Introduction
This is a report for the insert benchmark with 50M docs and 1 client(s). It is generated by scripts (bash, awk, sed) and Tufte might not be impressed. An overview of the insert benchmark is here and a short update is here. Below, by DBMS, I mean DBMS+version.config. An example is my8020.c10b40 where my means MySQL, 8020 is version 8.0.20 and c10b40 is the name for the configuration file.
The test server has 8 AMD cores, 32G RAM and an NVMe SSD. It is described here as the ASUS PN53. The benchmark was run with 1 client and there were 1 or 3 connections per client (1 for queries or inserts without rate limits, 1+1 for rate limited inserts+deletes). It uses 1 table. It loads 50M rows per table without secondary indexes, creates 3 secondary indexes per table, then inserts 40m+10m rows per table with a delete per insert to avoid growing the table. It then does 6 read+write tests for 1800s each that do queries as fast as possible with 100,100,500,500,1000,1000 inserts/s and the same for deletes/s per client concurrent with the queries. The database is cached in memory. Clients and the DBMS share one server. The per-database configs are in the per-database subdirectories here.
The tested DBMS are:
- ma101107_rel.cz11apur1_c8r32 - MariaDB 10.11.7 with the cz11apur1_c8r32 config that uses innodb_purge_threads=1
- ma110401_rel.cz11bpur1_c8r32 - MariaDB 11.4.1 with the cz11apur1_c8r32 config that uses innodb_purge_threads=1
- my8036_rel.cz11apur1_c8r32 - MySQL 8.0.36 with the cz11apur1_c8r32 config that uses innodb_purge_threads=1
Contents
- Summary
- l.i0: load without secondary indexes
- l.x: create secondary indexes
- l.i1: continue load after secondary indexes created with 50 inserts per transaction
- l.i2: continue load after secondary indexes created with 5 inserts per transaction
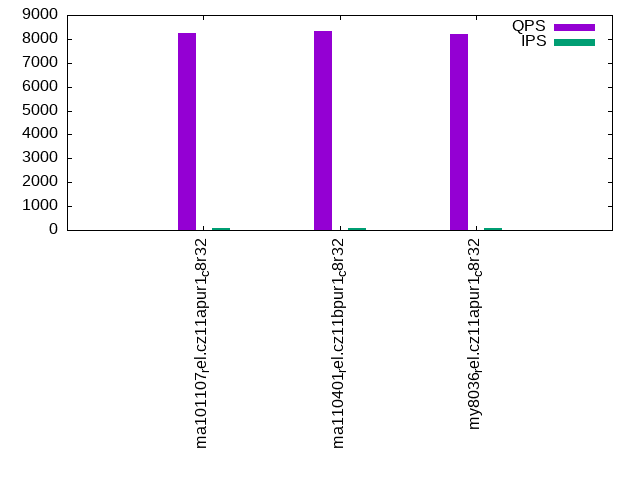
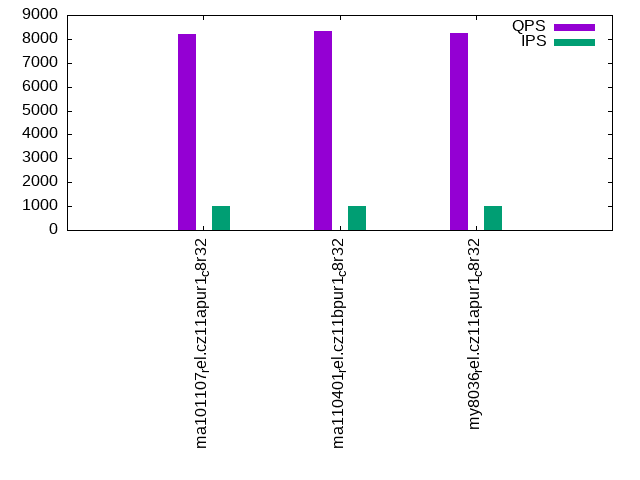
- qr100.L1: range queries with 100 insert/s per client
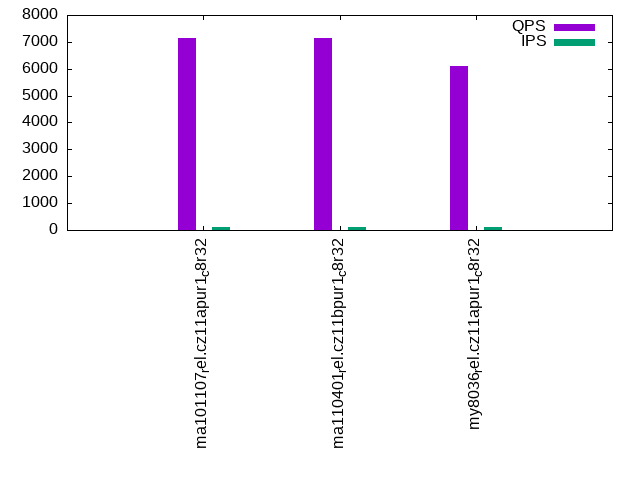
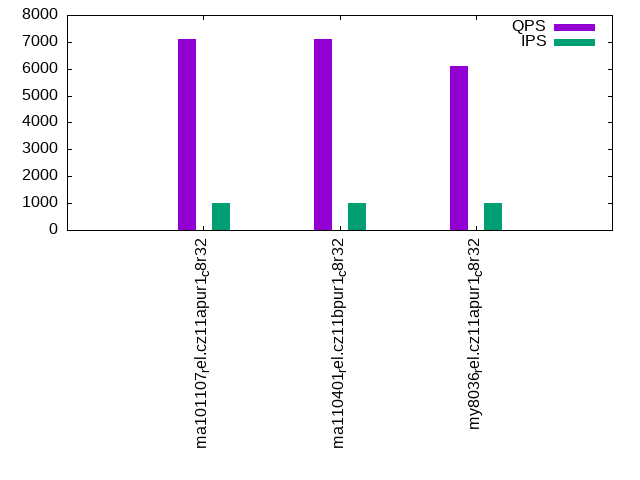
- qp100.L2: point queries with 100 insert/s per client
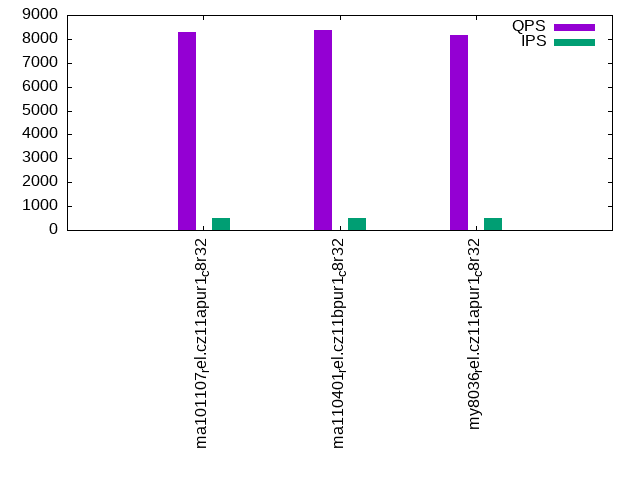
- qr500.L3: range queries with 500 insert/s per client
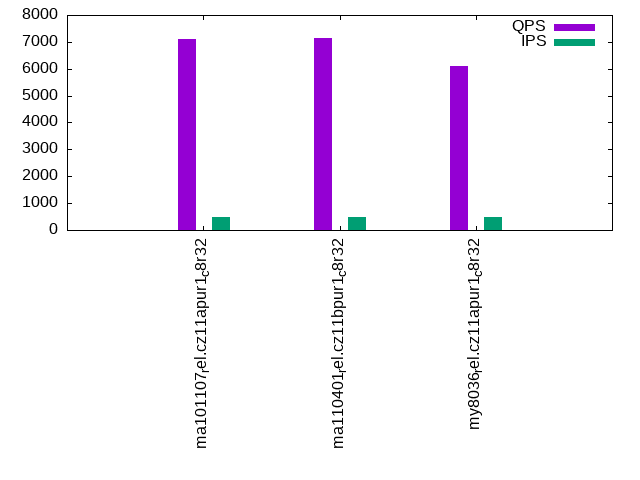
- qp500.L4: point queries with 500 insert/s per client
- qr1000.L5: range queries with 1000 insert/s per client
- qp1000.L6: point queries with 1000 insert/s per client
Summary
The numbers are inserts/s for l.i0, l.i1 and l.i2, indexed docs (or rows) /s for l.x and queries/s for qr100, qp100 thru qr1000, qp1000" The values are the average rate over the entire test for inserts (IPS) and queries (QPS). The range of values for IPS and QPS is split into 3 parts: bottom 25%, middle 50%, top 25%. Values in the bottom 25% have a red background, values in the top 25% have a green background and values in the middle have no color. A gray background is used for values that can be ignored because the DBMS did not sustain the target insert rate. Red backgrounds are not used when the minimum value is within 80% of the max value.
| dbms | l.i0 | l.x | l.i1 | l.i2 | qr100 | qp100 | qr500 | qp500 | qr1000 | qp1000 |
|---|---|---|---|---|---|---|---|---|---|---|
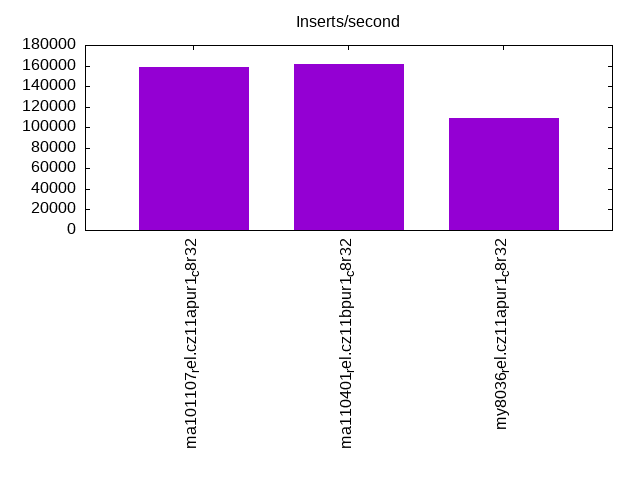
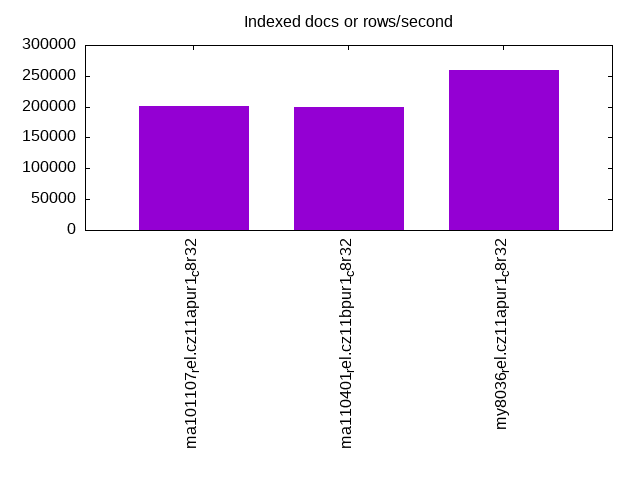
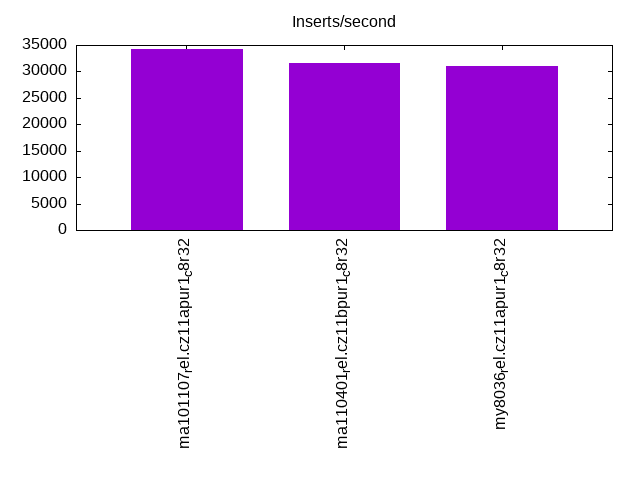
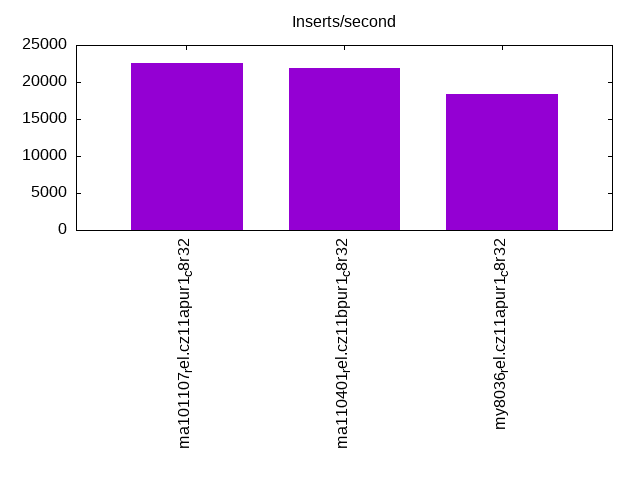
| ma101107_rel.cz11apur1_c8r32 | 158228 | 201613 | 34335 | 22573 | 8238 | 7129 | 8296 | 7095 | 8190 | 7094 |
| ma110401_rel.cz11bpur1_c8r32 | 161812 | 200000 | 31620 | 21882 | 8315 | 7135 | 8356 | 7149 | 8316 | 7113 |
| my8036_rel.cz11apur1_c8r32 | 108696 | 259068 | 30960 | 18349 | 8207 | 6109 | 8146 | 6099 | 8230 | 6095 |
This table has relative throughput, throughput for the DBMS relative to the DBMS in the first line, using the absolute throughput from the previous table. Values less than 0.95 have a yellow background. Values greater than 1.05 have a blue background.
| dbms | l.i0 | l.x | l.i1 | l.i2 | qr100 | qp100 | qr500 | qp500 | qr1000 | qp1000 |
|---|---|---|---|---|---|---|---|---|---|---|
| ma101107_rel.cz11apur1_c8r32 | 1.00 | 1.00 | 1.00 | 1.00 | 1.00 | 1.00 | 1.00 | 1.00 | 1.00 | 1.00 |
| ma110401_rel.cz11bpur1_c8r32 | 1.02 | 0.99 | 0.92 | 0.97 | 1.01 | 1.00 | 1.01 | 1.01 | 1.02 | 1.00 |
| my8036_rel.cz11apur1_c8r32 | 0.69 | 1.28 | 0.90 | 0.81 | 1.00 | 0.86 | 0.98 | 0.86 | 1.00 | 0.86 |
This lists the average rate of inserts/s for the tests that do inserts concurrent with queries. For such tests the query rate is listed in the table above. The read+write tests are setup so that the insert rate should match the target rate every second. Cells that are not at least 95% of the target have a red background to indicate a failure to satisfy the target.
| dbms | qr100.L1 | qp100.L2 | qr500.L3 | qp500.L4 | qr1000.L5 | qp1000.L6 |
|---|---|---|---|---|---|---|
| ma101107_rel.cz11apur1_c8r32 | 100 | 100 | 499 | 499 | 999 | 999 |
| ma110401_rel.cz11bpur1_c8r32 | 100 | 100 | 499 | 499 | 999 | 999 |
| my8036_rel.cz11apur1_c8r32 | 100 | 100 | 499 | 499 | 999 | 999 |
| target | 100 | 100 | 500 | 500 | 1000 | 1000 |
l.i0
l.i0: load without secondary indexes. Graphs for performance per 1-second interval are here.
Average throughput:
Insert response time histogram: each cell has the percentage of responses that take <= the time in the header and max is the max response time in seconds. For the max column values in the top 25% of the range have a red background and in the bottom 25% of the range have a green background. The red background is not used when the min value is within 80% of the max value.
| dbms | 256us | 1ms | 4ms | 16ms | 64ms | 256ms | 1s | 4s | 16s | gt | max |
|---|---|---|---|---|---|---|---|---|---|---|---|
| ma101107_rel.cz11apur1_c8r32 | 99.585 | 0.167 | 0.235 | 0.008 | 0.005 | 0.164 | |||||
| ma110401_rel.cz11bpur1_c8r32 | 99.590 | 0.164 | 0.223 | 0.018 | 0.005 | 0.197 | |||||
| my8036_rel.cz11apur1_c8r32 | 99.249 | 0.367 | 0.252 | 0.131 | 0.002 | 0.079 |
Performance metrics for the DBMS listed above. Some are normalized by throughput, others are not. Legend for results is here.
ips	qps	rps	rmbps	wps	wmbps	rpq	rkbpq	wpi	wkbpi	csps	cpups	cspq	cpupq	dbgb1	dbgb2	rss	maxop	p50	p99	tag
158228	0	0	0.0	643.2	40.4	0.000	0.000	0.004	0.261	19214	23.3	0.121	12	3.3	34.1	3.7	0.164	160124	138850	ma101107_rel.cz11apur1_c8r32
161812	0	0	0.0	656.8	40.6	0.000	0.000	0.004	0.257	20447	23.8	0.126	12	3.3	34.1	3.8	0.197	162921	139548	ma110401_rel.cz11bpur1_c8r32
108696	0	0	0.0	576.2	35.3	0.000	0.000	0.005	0.333	12490	17.8	0.115	13	3.3	33.9	5.4	0.079	109179	100591	my8036_rel.cz11apur1_c8r32
l.x
l.x: create secondary indexes.
Average throughput:
Performance metrics for the DBMS listed above. Some are normalized by throughput, others are not. Legend for results is here.
ips	qps	rps	rmbps	wps	wmbps	rpq	rkbpq	wpi	wkbpi	csps	cpups	cspq	cpupq	dbgb1	dbgb2	rss	maxop	p50	p99	tag
201613	0	0	0.0	2335.6	178.4	0.000	0.000	0.012	0.906	5195	12.1	0.026	5	7.5	38.3	6.9	0.002	NA	NA	ma101107_rel.cz11apur1_c8r32
200000	0	0	0.0	2299.1	176.1	0.000	0.000	0.011	0.901	5108	12.0	0.026	5	7.5	38.3	6.7	0.001	NA	NA	ma110401_rel.cz11bpur1_c8r32
259068	0	1330	84.2	5274.5	304.2	0.005	0.333	0.020	1.202	18413	40.9	0.071	13	7.6	38.1	9.1	0.002	NA	NA	my8036_rel.cz11apur1_c8r32
l.i1
l.i1: continue load after secondary indexes created with 50 inserts per transaction. Graphs for performance per 1-second interval are here.
Average throughput:
Insert response time histogram: each cell has the percentage of responses that take <= the time in the header and max is the max response time in seconds. For the max column values in the top 25% of the range have a red background and in the bottom 25% of the range have a green background. The red background is not used when the min value is within 80% of the max value.
| dbms | 256us | 1ms | 4ms | 16ms | 64ms | 256ms | 1s | 4s | 16s | gt | max |
|---|---|---|---|---|---|---|---|---|---|---|---|
| ma101107_rel.cz11apur1_c8r32 | 2.921 | 95.920 | 1.122 | 0.036 | 0.001 | 0.236 | |||||
| ma110401_rel.cz11bpur1_c8r32 | 5.355 | 92.048 | 2.305 | 0.289 | 0.003 | 0.229 | |||||
| my8036_rel.cz11apur1_c8r32 | 97.843 | 2.025 | 0.131 | 0.001 | 0.097 |
Delete response time histogram: each cell has the percentage of responses that take <= the time in the header and max is the max response time in seconds. For the max column values in the top 25% of the range have a red background and in the bottom 25% of the range have a green background. The red background is not used when the min value is within 80% of the max value.
| dbms | 256us | 1ms | 4ms | 16ms | 64ms | 256ms | 1s | 4s | 16s | gt | max |
|---|---|---|---|---|---|---|---|---|---|---|---|
| ma101107_rel.cz11apur1_c8r32 | 49.686 | 49.472 | 0.814 | 0.026 | 0.001 | 0.234 | |||||
| ma110401_rel.cz11bpur1_c8r32 | 54.844 | 42.913 | 1.995 | 0.245 | 0.003 | 0.228 | |||||
| my8036_rel.cz11apur1_c8r32 | 53.232 | 45.212 | 1.524 | 0.031 | nonzero | 0.088 |
Performance metrics for the DBMS listed above. Some are normalized by throughput, others are not. Legend for results is here.
ips	qps	rps	rmbps	wps	wmbps	rpq	rkbpq	wpi	wkbpi	csps	cpups	cspq	cpupq	dbgb1	dbgb2	rss	maxop	p50	p99	tag
34335	0	878	3.4	5352.3	180.8	0.026	0.102	0.156	5.393	88977	29.9	2.591	70	10.1	40.9	10.0	0.236	36722	11038	ma101107_rel.cz11apur1_c8r32
31620	0	833	3.3	4978.8	166.5	0.026	0.105	0.157	5.392	80700	27.3	2.552	69	10.1	40.9	10.0	0.229	32065	12686	ma110401_rel.cz11bpur1_c8r32
30960	0	175	2.7	4996.7	184.5	0.006	0.091	0.161	6.104	27393	34.3	0.885	89	10.6	41.6	12.7	0.097	33264	3946	my8036_rel.cz11apur1_c8r32
l.i2
l.i2: continue load after secondary indexes created with 5 inserts per transaction. Graphs for performance per 1-second interval are here.
Average throughput:
Insert response time histogram: each cell has the percentage of responses that take <= the time in the header and max is the max response time in seconds. For the max column values in the top 25% of the range have a red background and in the bottom 25% of the range have a green background. The red background is not used when the min value is within 80% of the max value.
| dbms | 256us | 1ms | 4ms | 16ms | 64ms | 256ms | 1s | 4s | 16s | gt | max |
|---|---|---|---|---|---|---|---|---|---|---|---|
| ma101107_rel.cz11apur1_c8r32 | 88.990 | 10.935 | 0.064 | 0.011 | nonzero | 0.059 | |||||
| ma110401_rel.cz11bpur1_c8r32 | 90.945 | 8.879 | 0.057 | 0.116 | 0.003 | 0.061 | |||||
| my8036_rel.cz11apur1_c8r32 | 77.509 | 22.345 | 0.008 | 0.137 | 0.001 | 0.060 |
Delete response time histogram: each cell has the percentage of responses that take <= the time in the header and max is the max response time in seconds. For the max column values in the top 25% of the range have a red background and in the bottom 25% of the range have a green background. The red background is not used when the min value is within 80% of the max value.
| dbms | 256us | 1ms | 4ms | 16ms | 64ms | 256ms | 1s | 4s | 16s | gt | max |
|---|---|---|---|---|---|---|---|---|---|---|---|
| ma101107_rel.cz11apur1_c8r32 | 95.656 | 4.276 | 0.058 | 0.010 | nonzero | 0.059 | |||||
| ma110401_rel.cz11bpur1_c8r32 | 94.776 | 5.068 | 0.051 | 0.103 | 0.003 | 0.061 | |||||
| my8036_rel.cz11apur1_c8r32 | 92.298 | 7.564 | 0.005 | 0.132 | 0.001 | 0.053 |
Performance metrics for the DBMS listed above. Some are normalized by throughput, others are not. Legend for results is here.
ips	qps	rps	rmbps	wps	wmbps	rpq	rkbpq	wpi	wkbpi	csps	cpups	cspq	cpupq	dbgb1	dbgb2	rss	maxop	p50	p99	tag
22573	0	3214	12.6	2628.4	91.2	0.142	0.569	0.116	4.137	114634	33.0	5.078	117	10.3	41.2	10.2	0.059	22546	21367	ma101107_rel.cz11apur1_c8r32
21882	0	3106	12.1	2556.0	87.9	0.142	0.568	0.117	4.113	111089	31.9	5.077	117	10.3	41.1	10.2	0.061	22631	18795	ma110401_rel.cz11bpur1_c8r32
18349	0	28	0.4	2630.8	91.0	0.002	0.025	0.143	5.077	75403	33.4	4.109	146	10.9	41.8	13.2	0.060	18370	17456	my8036_rel.cz11apur1_c8r32
qr100.L1
qr100.L1: range queries with 100 insert/s per client. Graphs for performance per 1-second interval are here.
Average throughput:
Query response time histogram: each cell has the percentage of responses that take <= the time in the header and max is the max response time in seconds. For max values in the top 25% of the range have a red background and in the bottom 25% of the range have a green background. The red background is not used when the min value is within 80% of the max value.
| dbms | 256us | 1ms | 4ms | 16ms | 64ms | 256ms | 1s | 4s | 16s | gt | max |
|---|---|---|---|---|---|---|---|---|---|---|---|
| ma101107_rel.cz11apur1_c8r32 | 99.995 | 0.005 | 0.001 | ||||||||
| ma110401_rel.cz11bpur1_c8r32 | 99.995 | 0.005 | 0.001 | ||||||||
| my8036_rel.cz11apur1_c8r32 | 99.979 | 0.021 | nonzero | 0.002 |
Insert response time histogram: each cell has the percentage of responses that take <= the time in the header and max is the max response time in seconds. For max values in the top 25% of the range have a red background and in the bottom 25% of the range have a green background. The red background is not used when the min value is within 80% of the max value.
| dbms | 256us | 1ms | 4ms | 16ms | 64ms | 256ms | 1s | 4s | 16s | gt | max |
|---|---|---|---|---|---|---|---|---|---|---|---|
| ma101107_rel.cz11apur1_c8r32 | 0.611 | 52.750 | 46.639 | 0.011 | |||||||
| ma110401_rel.cz11bpur1_c8r32 | 1.139 | 52.306 | 46.556 | 0.011 | |||||||
| my8036_rel.cz11apur1_c8r32 | 99.917 | 0.083 | 0.010 |
Delete response time histogram: each cell has the percentage of responses that take <= the time in the header and max is the max response time in seconds. For max values in the top 25% of the range have a red background and in the bottom 25% of the range have a green background. The red background is not used when the min value is within 80% of the max value.
| dbms | 256us | 1ms | 4ms | 16ms | 64ms | 256ms | 1s | 4s | 16s | gt | max |
|---|---|---|---|---|---|---|---|---|---|---|---|
| ma101107_rel.cz11apur1_c8r32 | 3.417 | 49.944 | 46.639 | 0.011 | |||||||
| ma110401_rel.cz11bpur1_c8r32 | 3.889 | 49.556 | 46.556 | 0.011 | |||||||
| my8036_rel.cz11apur1_c8r32 | 48.444 | 51.500 | 0.056 | 0.007 |
Performance metrics for the DBMS listed above. Some are normalized by throughput, others are not. Legend for results is here.
ips	qps	rps	rmbps	wps	wmbps	rpq	rkbpq	wpi	wkbpi	csps	cpups	cspq	cpupq	dbgb1	dbgb2	rss	maxop	p50	p99	tag
100	8238	4	0.0	2.4	0.1	0.000	0.002	0.024	1.192	31658	12.6	3.843	122	10.3	41.2	10.2	0.001	8247	8183	ma101107_rel.cz11apur1_c8r32
100	8315	3	0.0	2.3	0.1	0.000	0.002	0.024	1.181	31944	12.6	3.842	121	10.3	41.1	10.2	0.001	8313	8231	ma110401_rel.cz11bpur1_c8r32
100	8207	0	0.0	181.5	4.6	0.000	0.000	1.818	46.833	32270	12.5	3.932	122	10.9	41.8	13.2	0.002	8215	8151	my8036_rel.cz11apur1_c8r32
qp100.L2
qp100.L2: point queries with 100 insert/s per client. Graphs for performance per 1-second interval are here.
Average throughput:
Query response time histogram: each cell has the percentage of responses that take <= the time in the header and max is the max response time in seconds. For max values in the top 25% of the range have a red background and in the bottom 25% of the range have a green background. The red background is not used when the min value is within 80% of the max value.
| dbms | 256us | 1ms | 4ms | 16ms | 64ms | 256ms | 1s | 4s | 16s | gt | max |
|---|---|---|---|---|---|---|---|---|---|---|---|
| ma101107_rel.cz11apur1_c8r32 | 99.985 | 0.015 | 0.001 | ||||||||
| ma110401_rel.cz11bpur1_c8r32 | 99.988 | 0.012 | 0.001 | ||||||||
| my8036_rel.cz11apur1_c8r32 | 99.855 | 0.145 | nonzero | 0.002 |
Insert response time histogram: each cell has the percentage of responses that take <= the time in the header and max is the max response time in seconds. For max values in the top 25% of the range have a red background and in the bottom 25% of the range have a green background. The red background is not used when the min value is within 80% of the max value.
| dbms | 256us | 1ms | 4ms | 16ms | 64ms | 256ms | 1s | 4s | 16s | gt | max |
|---|---|---|---|---|---|---|---|---|---|---|---|
| ma101107_rel.cz11apur1_c8r32 | 0.028 | 53.333 | 46.639 | 0.011 | |||||||
| ma110401_rel.cz11bpur1_c8r32 | 0.167 | 53.278 | 46.556 | 0.015 | |||||||
| my8036_rel.cz11apur1_c8r32 | 99.833 | 0.167 | 0.011 |
Delete response time histogram: each cell has the percentage of responses that take <= the time in the header and max is the max response time in seconds. For max values in the top 25% of the range have a red background and in the bottom 25% of the range have a green background. The red background is not used when the min value is within 80% of the max value.
| dbms | 256us | 1ms | 4ms | 16ms | 64ms | 256ms | 1s | 4s | 16s | gt | max |
|---|---|---|---|---|---|---|---|---|---|---|---|
| ma101107_rel.cz11apur1_c8r32 | 2.444 | 50.917 | 46.639 | 0.011 | |||||||
| ma110401_rel.cz11bpur1_c8r32 | 2.806 | 50.667 | 46.528 | 0.011 | |||||||
| my8036_rel.cz11apur1_c8r32 | 0.861 | 99.028 | 0.111 | 0.007 |
Performance metrics for the DBMS listed above. Some are normalized by throughput, others are not. Legend for results is here.
ips	qps	rps	rmbps	wps	wmbps	rpq	rkbpq	wpi	wkbpi	csps	cpups	cspq	cpupq	dbgb1	dbgb2	rss	maxop	p50	p99	tag
100	7129	3	0.0	8.6	0.3	0.000	0.002	0.086	2.944	28770	13.1	4.035	147	10.3	41.2	10.2	0.001	7128	7019	ma101107_rel.cz11apur1_c8r32
100	7135	3	0.0	15.1	0.5	0.000	0.002	0.151	4.722	28821	13.1	4.040	147	10.3	41.1	10.2	0.001	7144	6952	ma110401_rel.cz11bpur1_c8r32
100	6109	0	0.0	53.8	1.4	0.000	0.000	0.539	14.211	24889	13.1	4.074	172	10.9	41.8	13.2	0.002	6110	5961	my8036_rel.cz11apur1_c8r32
qr500.L3
qr500.L3: range queries with 500 insert/s per client. Graphs for performance per 1-second interval are here.
Average throughput:
Query response time histogram: each cell has the percentage of responses that take <= the time in the header and max is the max response time in seconds. For max values in the top 25% of the range have a red background and in the bottom 25% of the range have a green background. The red background is not used when the min value is within 80% of the max value.
| dbms | 256us | 1ms | 4ms | 16ms | 64ms | 256ms | 1s | 4s | 16s | gt | max |
|---|---|---|---|---|---|---|---|---|---|---|---|
| ma101107_rel.cz11apur1_c8r32 | 99.989 | 0.011 | nonzero | nonzero | 0.005 | ||||||
| ma110401_rel.cz11bpur1_c8r32 | 99.989 | 0.011 | nonzero | nonzero | 0.009 | ||||||
| my8036_rel.cz11apur1_c8r32 | 99.975 | 0.025 | nonzero | 0.002 |
Insert response time histogram: each cell has the percentage of responses that take <= the time in the header and max is the max response time in seconds. For max values in the top 25% of the range have a red background and in the bottom 25% of the range have a green background. The red background is not used when the min value is within 80% of the max value.
| dbms | 256us | 1ms | 4ms | 16ms | 64ms | 256ms | 1s | 4s | 16s | gt | max |
|---|---|---|---|---|---|---|---|---|---|---|---|
| ma101107_rel.cz11apur1_c8r32 | 17.539 | 73.150 | 9.311 | 0.011 | |||||||
| ma110401_rel.cz11bpur1_c8r32 | 23.611 | 67.039 | 9.350 | 0.011 | |||||||
| my8036_rel.cz11apur1_c8r32 | 99.856 | 0.133 | 0.011 | 0.023 |
Delete response time histogram: each cell has the percentage of responses that take <= the time in the header and max is the max response time in seconds. For max values in the top 25% of the range have a red background and in the bottom 25% of the range have a green background. The red background is not used when the min value is within 80% of the max value.
| dbms | 256us | 1ms | 4ms | 16ms | 64ms | 256ms | 1s | 4s | 16s | gt | max |
|---|---|---|---|---|---|---|---|---|---|---|---|
| ma101107_rel.cz11apur1_c8r32 | 79.056 | 11.633 | 9.311 | 0.011 | |||||||
| ma110401_rel.cz11bpur1_c8r32 | 78.917 | 11.744 | 9.339 | 0.011 | |||||||
| my8036_rel.cz11apur1_c8r32 | 82.972 | 16.917 | 0.106 | 0.006 | 0.023 |
Performance metrics for the DBMS listed above. Some are normalized by throughput, others are not. Legend for results is here.
ips	qps	rps	rmbps	wps	wmbps	rpq	rkbpq	wpi	wkbpi	csps	cpups	cspq	cpupq	dbgb1	dbgb2	rss	maxop	p50	p99	tag
499	8296	19	0.1	24.8	1.1	0.002	0.009	0.050	2.203	32167	13.2	3.878	127	10.3	41.2	10.2	0.005	8295	8231	ma101107_rel.cz11apur1_c8r32
499	8356	19	0.1	25.0	1.1	0.002	0.009	0.050	2.191	32396	13.1	3.877	125	10.3	41.1	10.2	0.009	8359	8279	ma110401_rel.cz11bpur1_c8r32
499	8146	0	0.0	125.5	3.6	0.000	0.000	0.251	7.436	31964	12.9	3.924	127	10.9	41.8	13.2	0.002	8151	8103	my8036_rel.cz11apur1_c8r32
qp500.L4
qp500.L4: point queries with 500 insert/s per client. Graphs for performance per 1-second interval are here.
Average throughput:
Query response time histogram: each cell has the percentage of responses that take <= the time in the header and max is the max response time in seconds. For max values in the top 25% of the range have a red background and in the bottom 25% of the range have a green background. The red background is not used when the min value is within 80% of the max value.
| dbms | 256us | 1ms | 4ms | 16ms | 64ms | 256ms | 1s | 4s | 16s | gt | max |
|---|---|---|---|---|---|---|---|---|---|---|---|
| ma101107_rel.cz11apur1_c8r32 | 99.970 | 0.030 | nonzero | 0.002 | |||||||
| ma110401_rel.cz11bpur1_c8r32 | 99.975 | 0.025 | nonzero | 0.002 | |||||||
| my8036_rel.cz11apur1_c8r32 | 99.792 | 0.208 | nonzero | 0.003 |
Insert response time histogram: each cell has the percentage of responses that take <= the time in the header and max is the max response time in seconds. For max values in the top 25% of the range have a red background and in the bottom 25% of the range have a green background. The red background is not used when the min value is within 80% of the max value.
| dbms | 256us | 1ms | 4ms | 16ms | 64ms | 256ms | 1s | 4s | 16s | gt | max |
|---|---|---|---|---|---|---|---|---|---|---|---|
| ma101107_rel.cz11apur1_c8r32 | 2.483 | 88.256 | 9.261 | 0.011 | |||||||
| ma110401_rel.cz11bpur1_c8r32 | 13.644 | 77.033 | 9.322 | 0.015 | |||||||
| my8036_rel.cz11apur1_c8r32 | 99.822 | 0.172 | 0.006 | 0.024 |
Delete response time histogram: each cell has the percentage of responses that take <= the time in the header and max is the max response time in seconds. For max values in the top 25% of the range have a red background and in the bottom 25% of the range have a green background. The red background is not used when the min value is within 80% of the max value.
| dbms | 256us | 1ms | 4ms | 16ms | 64ms | 256ms | 1s | 4s | 16s | gt | max |
|---|---|---|---|---|---|---|---|---|---|---|---|
| ma101107_rel.cz11apur1_c8r32 | 70.511 | 20.228 | 9.261 | 0.011 | |||||||
| ma110401_rel.cz11bpur1_c8r32 | 76.539 | 14.139 | 9.322 | 0.011 | |||||||
| my8036_rel.cz11apur1_c8r32 | 60.550 | 39.311 | 0.133 | 0.006 | 0.023 |
Performance metrics for the DBMS listed above. Some are normalized by throughput, others are not. Legend for results is here.
ips	qps	rps	rmbps	wps	wmbps	rpq	rkbpq	wpi	wkbpi	csps	cpups	cspq	cpupq	dbgb1	dbgb2	rss	maxop	p50	p99	tag
499	7095	18	0.1	24.8	1.1	0.003	0.010	0.050	2.191	28952	13.3	4.081	150	10.3	41.2	10.2	0.002	7096	6936	ma101107_rel.cz11apur1_c8r32
499	7149	18	0.1	25.0	1.1	0.003	0.010	0.050	2.182	29161	13.4	4.079	150	10.3	41.1	10.2	0.002	7160	6952	ma110401_rel.cz11bpur1_c8r32
499	6099	0	0.0	53.8	1.8	0.000	0.000	0.108	3.790	24928	13.2	4.087	173	10.9	41.8	13.2	0.003	6105	5946	my8036_rel.cz11apur1_c8r32
qr1000.L5
qr1000.L5: range queries with 1000 insert/s per client. Graphs for performance per 1-second interval are here.
Average throughput:
Query response time histogram: each cell has the percentage of responses that take <= the time in the header and max is the max response time in seconds. For max values in the top 25% of the range have a red background and in the bottom 25% of the range have a green background. The red background is not used when the min value is within 80% of the max value.
| dbms | 256us | 1ms | 4ms | 16ms | 64ms | 256ms | 1s | 4s | 16s | gt | max |
|---|---|---|---|---|---|---|---|---|---|---|---|
| ma101107_rel.cz11apur1_c8r32 | 99.983 | 0.017 | 0.001 | nonzero | 0.006 | ||||||
| ma110401_rel.cz11bpur1_c8r32 | 99.985 | 0.015 | nonzero | nonzero | nonzero | 0.020 | |||||
| my8036_rel.cz11apur1_c8r32 | 99.969 | 0.031 | nonzero | nonzero | 0.004 |
Insert response time histogram: each cell has the percentage of responses that take <= the time in the header and max is the max response time in seconds. For max values in the top 25% of the range have a red background and in the bottom 25% of the range have a green background. The red background is not used when the min value is within 80% of the max value.
| dbms | 256us | 1ms | 4ms | 16ms | 64ms | 256ms | 1s | 4s | 16s | gt | max |
|---|---|---|---|---|---|---|---|---|---|---|---|
| ma101107_rel.cz11apur1_c8r32 | 22.564 | 72.747 | 4.686 | 0.003 | 0.033 | ||||||
| ma110401_rel.cz11bpur1_c8r32 | 37.619 | 57.611 | 4.764 | 0.006 | 0.032 | ||||||
| my8036_rel.cz11apur1_c8r32 | 99.822 | 0.172 | 0.006 | 0.024 |
Delete response time histogram: each cell has the percentage of responses that take <= the time in the header and max is the max response time in seconds. For max values in the top 25% of the range have a red background and in the bottom 25% of the range have a green background. The red background is not used when the min value is within 80% of the max value.
| dbms | 256us | 1ms | 4ms | 16ms | 64ms | 256ms | 1s | 4s | 16s | gt | max |
|---|---|---|---|---|---|---|---|---|---|---|---|
| ma101107_rel.cz11apur1_c8r32 | 86.514 | 8.814 | 4.669 | 0.003 | 0.032 | ||||||
| ma110401_rel.cz11bpur1_c8r32 | 86.775 | 8.503 | 4.717 | 0.006 | 0.030 | ||||||
| my8036_rel.cz11apur1_c8r32 | 78.578 | 21.286 | 0.136 | 0.013 |
Performance metrics for the DBMS listed above. Some are normalized by throughput, others are not. Legend for results is here.
ips	qps	rps	rmbps	wps	wmbps	rpq	rkbpq	wpi	wkbpi	csps	cpups	cspq	cpupq	dbgb1	dbgb2	rss	maxop	p50	p99	tag
999	8190	37	0.1	123.6	4.1	0.005	0.018	0.124	4.191	32534	13.4	3.973	131	10.3	41.2	10.2	0.006	8199	8087	ma101107_rel.cz11apur1_c8r32
999	8316	37	0.1	126.9	4.1	0.004	0.018	0.127	4.239	33032	13.4	3.972	129	10.3	41.1	10.2	0.020	8311	8215	ma110401_rel.cz11bpur1_c8r32
999	8230	0	0.0	195.1	5.9	0.000	0.000	0.195	6.096	32664	13.4	3.969	130	10.9	41.8	13.2	0.004	8231	8183	my8036_rel.cz11apur1_c8r32
qp1000.L6
qp1000.L6: point queries with 1000 insert/s per client. Graphs for performance per 1-second interval are here.
Average throughput:
Query response time histogram: each cell has the percentage of responses that take <= the time in the header and max is the max response time in seconds. For max values in the top 25% of the range have a red background and in the bottom 25% of the range have a green background. The red background is not used when the min value is within 80% of the max value.
| dbms | 256us | 1ms | 4ms | 16ms | 64ms | 256ms | 1s | 4s | 16s | gt | max |
|---|---|---|---|---|---|---|---|---|---|---|---|
| ma101107_rel.cz11apur1_c8r32 | 99.960 | 0.039 | nonzero | nonzero | 0.011 | ||||||
| ma110401_rel.cz11bpur1_c8r32 | 99.965 | 0.035 | nonzero | 0.002 | |||||||
| my8036_rel.cz11apur1_c8r32 | 99.767 | 0.233 | nonzero | 0.002 |
Insert response time histogram: each cell has the percentage of responses that take <= the time in the header and max is the max response time in seconds. For max values in the top 25% of the range have a red background and in the bottom 25% of the range have a green background. The red background is not used when the min value is within 80% of the max value.
| dbms | 256us | 1ms | 4ms | 16ms | 64ms | 256ms | 1s | 4s | 16s | gt | max |
|---|---|---|---|---|---|---|---|---|---|---|---|
| ma101107_rel.cz11apur1_c8r32 | 8.011 | 87.339 | 4.647 | 0.003 | 0.040 | ||||||
| ma110401_rel.cz11bpur1_c8r32 | 24.122 | 71.206 | 4.667 | 0.006 | 0.031 | ||||||
| my8036_rel.cz11apur1_c8r32 | 99.731 | 0.267 | 0.003 | 0.023 |
Delete response time histogram: each cell has the percentage of responses that take <= the time in the header and max is the max response time in seconds. For max values in the top 25% of the range have a red background and in the bottom 25% of the range have a green background. The red background is not used when the min value is within 80% of the max value.
| dbms | 256us | 1ms | 4ms | 16ms | 64ms | 256ms | 1s | 4s | 16s | gt | max |
|---|---|---|---|---|---|---|---|---|---|---|---|
| ma101107_rel.cz11apur1_c8r32 | 80.122 | 15.236 | 4.639 | 0.003 | 0.029 | ||||||
| ma110401_rel.cz11bpur1_c8r32 | 85.361 | 9.986 | 4.650 | 0.003 | 0.031 | ||||||
| my8036_rel.cz11apur1_c8r32 | 56.700 | 43.094 | 0.203 | 0.003 | 0.023 |
Performance metrics for the DBMS listed above. Some are normalized by throughput, others are not. Legend for results is here.
ips	qps	rps	rmbps	wps	wmbps	rpq	rkbpq	wpi	wkbpi	csps	cpups	cspq	cpupq	dbgb1	dbgb2	rss	maxop	p50	p99	tag
999	7094	37	0.1	51.7	2.1	0.005	0.021	0.052	2.194	29452	13.4	4.152	151	10.3	41.2	10.2	0.011	7096	6921	ma101107_rel.cz11apur1_c8r32
999	7113	37	0.1	52.0	2.1	0.005	0.021	0.052	2.181	29538	13.4	4.152	151	10.3	41.1	10.2	0.002	7115	6936	ma110401_rel.cz11bpur1_c8r32
999	6095	0	0.0	192.9	5.9	0.000	0.000	0.193	6.042	25497	14.0	4.184	184	10.9	41.9	13.2	0.002	6105	5961	my8036_rel.cz11apur1_c8r32
l.i0
l.i0: load without secondary indexes
Performance metrics for all DBMS, not just the ones listed above. Some are normalized by throughput, others are not. Legend for results is here.
ips	qps	rps	rmbps	wps	wmbps	rpq	rkbpq	wpi	wkbpi	csps	cpups	cspq	cpupq	dbgb1	dbgb2	rss	maxop	p50	p99	tag
158228	0	0	0.0	643.2	40.4	0.000	0.000	0.004	0.261	19214	23.3	0.121	12	3.3	34.1	3.7	0.164	160124	138850	ma101107_rel.cz11apur1_c8r32
161812	0	0	0.0	656.8	40.6	0.000	0.000	0.004	0.257	20447	23.8	0.126	12	3.3	34.1	3.8	0.197	162921	139548	ma110401_rel.cz11bpur1_c8r32
108696	0	0	0.0	576.2	35.3	0.000	0.000	0.005	0.333	12490	17.8	0.115	13	3.3	33.9	5.4	0.079	109179	100591	my8036_rel.cz11apur1_c8r32
l.x
l.x: create secondary indexes
Performance metrics for all DBMS, not just the ones listed above. Some are normalized by throughput, others are not. Legend for results is here.
ips	qps	rps	rmbps	wps	wmbps	rpq	rkbpq	wpi	wkbpi	csps	cpups	cspq	cpupq	dbgb1	dbgb2	rss	maxop	p50	p99	tag
201613	0	0	0.0	2335.6	178.4	0.000	0.000	0.012	0.906	5195	12.1	0.026	5	7.5	38.3	6.9	0.002	NA	NA	ma101107_rel.cz11apur1_c8r32
200000	0	0	0.0	2299.1	176.1	0.000	0.000	0.011	0.901	5108	12.0	0.026	5	7.5	38.3	6.7	0.001	NA	NA	ma110401_rel.cz11bpur1_c8r32
259068	0	1330	84.2	5274.5	304.2	0.005	0.333	0.020	1.202	18413	40.9	0.071	13	7.6	38.1	9.1	0.002	NA	NA	my8036_rel.cz11apur1_c8r32
l.i1
l.i1: continue load after secondary indexes created with 50 inserts per transaction
Performance metrics for all DBMS, not just the ones listed above. Some are normalized by throughput, others are not. Legend for results is here.
ips	qps	rps	rmbps	wps	wmbps	rpq	rkbpq	wpi	wkbpi	csps	cpups	cspq	cpupq	dbgb1	dbgb2	rss	maxop	p50	p99	tag
34335	0	878	3.4	5352.3	180.8	0.026	0.102	0.156	5.393	88977	29.9	2.591	70	10.1	40.9	10.0	0.236	36722	11038	ma101107_rel.cz11apur1_c8r32
31620	0	833	3.3	4978.8	166.5	0.026	0.105	0.157	5.392	80700	27.3	2.552	69	10.1	40.9	10.0	0.229	32065	12686	ma110401_rel.cz11bpur1_c8r32
30960	0	175	2.7	4996.7	184.5	0.006	0.091	0.161	6.104	27393	34.3	0.885	89	10.6	41.6	12.7	0.097	33264	3946	my8036_rel.cz11apur1_c8r32
l.i2
l.i2: continue load after secondary indexes created with 5 inserts per transaction
Performance metrics for all DBMS, not just the ones listed above. Some are normalized by throughput, others are not. Legend for results is here.
ips	qps	rps	rmbps	wps	wmbps	rpq	rkbpq	wpi	wkbpi	csps	cpups	cspq	cpupq	dbgb1	dbgb2	rss	maxop	p50	p99	tag
22573	0	3214	12.6	2628.4	91.2	0.142	0.569	0.116	4.137	114634	33.0	5.078	117	10.3	41.2	10.2	0.059	22546	21367	ma101107_rel.cz11apur1_c8r32
21882	0	3106	12.1	2556.0	87.9	0.142	0.568	0.117	4.113	111089	31.9	5.077	117	10.3	41.1	10.2	0.061	22631	18795	ma110401_rel.cz11bpur1_c8r32
18349	0	28	0.4	2630.8	91.0	0.002	0.025	0.143	5.077	75403	33.4	4.109	146	10.9	41.8	13.2	0.060	18370	17456	my8036_rel.cz11apur1_c8r32
qr100.L1
qr100.L1: range queries with 100 insert/s per client
Performance metrics for all DBMS, not just the ones listed above. Some are normalized by throughput, others are not. Legend for results is here.
ips	qps	rps	rmbps	wps	wmbps	rpq	rkbpq	wpi	wkbpi	csps	cpups	cspq	cpupq	dbgb1	dbgb2	rss	maxop	p50	p99	tag
100	8238	4	0.0	2.4	0.1	0.000	0.002	0.024	1.192	31658	12.6	3.843	122	10.3	41.2	10.2	0.001	8247	8183	ma101107_rel.cz11apur1_c8r32
100	8315	3	0.0	2.3	0.1	0.000	0.002	0.024	1.181	31944	12.6	3.842	121	10.3	41.1	10.2	0.001	8313	8231	ma110401_rel.cz11bpur1_c8r32
100	8207	0	0.0	181.5	4.6	0.000	0.000	1.818	46.833	32270	12.5	3.932	122	10.9	41.8	13.2	0.002	8215	8151	my8036_rel.cz11apur1_c8r32
qp100.L2
qp100.L2: point queries with 100 insert/s per client
Performance metrics for all DBMS, not just the ones listed above. Some are normalized by throughput, others are not. Legend for results is here.
ips	qps	rps	rmbps	wps	wmbps	rpq	rkbpq	wpi	wkbpi	csps	cpups	cspq	cpupq	dbgb1	dbgb2	rss	maxop	p50	p99	tag
100	7129	3	0.0	8.6	0.3	0.000	0.002	0.086	2.944	28770	13.1	4.035	147	10.3	41.2	10.2	0.001	7128	7019	ma101107_rel.cz11apur1_c8r32
100	7135	3	0.0	15.1	0.5	0.000	0.002	0.151	4.722	28821	13.1	4.040	147	10.3	41.1	10.2	0.001	7144	6952	ma110401_rel.cz11bpur1_c8r32
100	6109	0	0.0	53.8	1.4	0.000	0.000	0.539	14.211	24889	13.1	4.074	172	10.9	41.8	13.2	0.002	6110	5961	my8036_rel.cz11apur1_c8r32
qr500.L3
qr500.L3: range queries with 500 insert/s per client
Performance metrics for all DBMS, not just the ones listed above. Some are normalized by throughput, others are not. Legend for results is here.
ips	qps	rps	rmbps	wps	wmbps	rpq	rkbpq	wpi	wkbpi	csps	cpups	cspq	cpupq	dbgb1	dbgb2	rss	maxop	p50	p99	tag
499	8296	19	0.1	24.8	1.1	0.002	0.009	0.050	2.203	32167	13.2	3.878	127	10.3	41.2	10.2	0.005	8295	8231	ma101107_rel.cz11apur1_c8r32
499	8356	19	0.1	25.0	1.1	0.002	0.009	0.050	2.191	32396	13.1	3.877	125	10.3	41.1	10.2	0.009	8359	8279	ma110401_rel.cz11bpur1_c8r32
499	8146	0	0.0	125.5	3.6	0.000	0.000	0.251	7.436	31964	12.9	3.924	127	10.9	41.8	13.2	0.002	8151	8103	my8036_rel.cz11apur1_c8r32
qp500.L4
qp500.L4: point queries with 500 insert/s per client
Performance metrics for all DBMS, not just the ones listed above. Some are normalized by throughput, others are not. Legend for results is here.
ips	qps	rps	rmbps	wps	wmbps	rpq	rkbpq	wpi	wkbpi	csps	cpups	cspq	cpupq	dbgb1	dbgb2	rss	maxop	p50	p99	tag
499	7095	18	0.1	24.8	1.1	0.003	0.010	0.050	2.191	28952	13.3	4.081	150	10.3	41.2	10.2	0.002	7096	6936	ma101107_rel.cz11apur1_c8r32
499	7149	18	0.1	25.0	1.1	0.003	0.010	0.050	2.182	29161	13.4	4.079	150	10.3	41.1	10.2	0.002	7160	6952	ma110401_rel.cz11bpur1_c8r32
499	6099	0	0.0	53.8	1.8	0.000	0.000	0.108	3.790	24928	13.2	4.087	173	10.9	41.8	13.2	0.003	6105	5946	my8036_rel.cz11apur1_c8r32
qr1000.L5
qr1000.L5: range queries with 1000 insert/s per client
Performance metrics for all DBMS, not just the ones listed above. Some are normalized by throughput, others are not. Legend for results is here.
ips	qps	rps	rmbps	wps	wmbps	rpq	rkbpq	wpi	wkbpi	csps	cpups	cspq	cpupq	dbgb1	dbgb2	rss	maxop	p50	p99	tag
999	8190	37	0.1	123.6	4.1	0.005	0.018	0.124	4.191	32534	13.4	3.973	131	10.3	41.2	10.2	0.006	8199	8087	ma101107_rel.cz11apur1_c8r32
999	8316	37	0.1	126.9	4.1	0.004	0.018	0.127	4.239	33032	13.4	3.972	129	10.3	41.1	10.2	0.020	8311	8215	ma110401_rel.cz11bpur1_c8r32
999	8230	0	0.0	195.1	5.9	0.000	0.000	0.195	6.096	32664	13.4	3.969	130	10.9	41.8	13.2	0.004	8231	8183	my8036_rel.cz11apur1_c8r32
qp1000.L6
qp1000.L6: point queries with 1000 insert/s per client
Performance metrics for all DBMS, not just the ones listed above. Some are normalized by throughput, others are not. Legend for results is here.
ips	qps	rps	rmbps	wps	wmbps	rpq	rkbpq	wpi	wkbpi	csps	cpups	cspq	cpupq	dbgb1	dbgb2	rss	maxop	p50	p99	tag
999	7094	37	0.1	51.7	2.1	0.005	0.021	0.052	2.194	29452	13.4	4.152	151	10.3	41.2	10.2	0.011	7096	6921	ma101107_rel.cz11apur1_c8r32
999	7113	37	0.1	52.0	2.1	0.005	0.021	0.052	2.181	29538	13.4	4.152	151	10.3	41.1	10.2	0.002	7115	6936	ma110401_rel.cz11bpur1_c8r32
999	6095	0	0.0	192.9	5.9	0.000	0.000	0.193	6.042	25497	14.0	4.184	184	10.9	41.9	13.2	0.002	6105	5961	my8036_rel.cz11apur1_c8r32
l.i0
- l.i0: load without secondary indexes
- Legend for results is here.
- Each entry lists the percentage of responses that fit in that bucket (slower than max time for previous bucket, faster than min time for next bucket).
Insert response time histogram
256us	1ms	4ms	16ms	64ms	256ms	1s	4s	16s	gt	max	tag
0.000	99.585	0.167	0.235	0.008	0.005	0.000	0.000	0.000	0.000	0.164	ma101107_rel.cz11apur1_c8r32
0.000	99.590	0.164	0.223	0.018	0.005	0.000	0.000	0.000	0.000	0.197	ma110401_rel.cz11bpur1_c8r32
0.000	99.249	0.367	0.252	0.131	0.002	0.000	0.000	0.000	0.000	0.079	my8036_rel.cz11apur1_c8r32
l.x
- l.x: create secondary indexes
- Legend for results is here.
- Each entry lists the percentage of responses that fit in that bucket (slower than max time for previous bucket, faster than min time for next bucket).
TODO - determine whether there is data for create index response time
l.i1
- l.i1: continue load after secondary indexes created with 50 inserts per transaction
- Legend for results is here.
- Each entry lists the percentage of responses that fit in that bucket (slower than max time for previous bucket, faster than min time for next bucket).
Insert response time histogram
256us	1ms	4ms	16ms	64ms	256ms	1s	4s	16s	gt	max	tag
0.000	2.921	95.920	1.122	0.036	0.001	0.000	0.000	0.000	0.000	0.236	ma101107_rel.cz11apur1_c8r32
0.000	5.355	92.048	2.305	0.289	0.003	0.000	0.000	0.000	0.000	0.229	ma110401_rel.cz11bpur1_c8r32
0.000	0.000	97.843	2.025	0.131	0.001	0.000	0.000	0.000	0.000	0.097	my8036_rel.cz11apur1_c8r32
Delete response time histogram
256us	1ms	4ms	16ms	64ms	256ms	1s	4s	16s	gt	max	tag
0.000	49.686	49.472	0.814	0.026	0.001	0.000	0.000	0.000	0.000	0.234	ma101107_rel.cz11apur1_c8r32
0.000	54.844	42.913	1.995	0.245	0.003	0.000	0.000	0.000	0.000	0.228	ma110401_rel.cz11bpur1_c8r32
0.000	53.232	45.212	1.524	0.031	nonzero	0.000	0.000	0.000	0.000	0.088	my8036_rel.cz11apur1_c8r32
l.i2
- l.i2: continue load after secondary indexes created with 5 inserts per transaction
- Legend for results is here.
- Each entry lists the percentage of responses that fit in that bucket (slower than max time for previous bucket, faster than min time for next bucket).
Insert response time histogram
256us	1ms	4ms	16ms	64ms	256ms	1s	4s	16s	gt	max	tag
88.990	10.935	0.064	0.011	nonzero	0.000	0.000	0.000	0.000	0.000	0.059	ma101107_rel.cz11apur1_c8r32
90.945	8.879	0.057	0.116	0.003	0.000	0.000	0.000	0.000	0.000	0.061	ma110401_rel.cz11bpur1_c8r32
77.509	22.345	0.008	0.137	0.001	0.000	0.000	0.000	0.000	0.000	0.060	my8036_rel.cz11apur1_c8r32
Delete response time histogram
256us	1ms	4ms	16ms	64ms	256ms	1s	4s	16s	gt	max	tag
95.656	4.276	0.058	0.010	nonzero	0.000	0.000	0.000	0.000	0.000	0.059	ma101107_rel.cz11apur1_c8r32
94.776	5.068	0.051	0.103	0.003	0.000	0.000	0.000	0.000	0.000	0.061	ma110401_rel.cz11bpur1_c8r32
92.298	7.564	0.005	0.132	0.001	0.000	0.000	0.000	0.000	0.000	0.053	my8036_rel.cz11apur1_c8r32
qr100.L1
- qr100.L1: range queries with 100 insert/s per client
- Legend for results is here.
- Each entry lists the percentage of responses that fit in that bucket (slower than max time for previous bucket, faster than min time for next bucket).
Query response time histogram
256us	1ms	4ms	16ms	64ms	256ms	1s	4s	16s	gt	max	tag
99.995	0.005	0.000	0.000	0.000	0.000	0.000	0.000	0.000	0.000	0.001	ma101107_rel.cz11apur1_c8r32
99.995	0.005	0.000	0.000	0.000	0.000	0.000	0.000	0.000	0.000	0.001	ma110401_rel.cz11bpur1_c8r32
99.979	0.021	nonzero	0.000	0.000	0.000	0.000	0.000	0.000	0.000	0.002	my8036_rel.cz11apur1_c8r32
Insert response time histogram
256us	1ms	4ms	16ms	64ms	256ms	1s	4s	16s	gt	max	tag
0.000	0.611	52.750	46.639	0.000	0.000	0.000	0.000	0.000	0.000	0.011	ma101107_rel.cz11apur1_c8r32
0.000	1.139	52.306	46.556	0.000	0.000	0.000	0.000	0.000	0.000	0.011	ma110401_rel.cz11bpur1_c8r32
0.000	0.000	99.917	0.083	0.000	0.000	0.000	0.000	0.000	0.000	0.010	my8036_rel.cz11apur1_c8r32
Delete response time histogram
256us	1ms	4ms	16ms	64ms	256ms	1s	4s	16s	gt	max	tag
0.000	3.417	49.944	46.639	0.000	0.000	0.000	0.000	0.000	0.000	0.011	ma101107_rel.cz11apur1_c8r32
0.000	3.889	49.556	46.556	0.000	0.000	0.000	0.000	0.000	0.000	0.011	ma110401_rel.cz11bpur1_c8r32
0.000	48.444	51.500	0.056	0.000	0.000	0.000	0.000	0.000	0.000	0.007	my8036_rel.cz11apur1_c8r32
qp100.L2
- qp100.L2: point queries with 100 insert/s per client
- Legend for results is here.
- Each entry lists the percentage of responses that fit in that bucket (slower than max time for previous bucket, faster than min time for next bucket).
Query response time histogram
256us	1ms	4ms	16ms	64ms	256ms	1s	4s	16s	gt	max	tag
99.985	0.015	0.000	0.000	0.000	0.000	0.000	0.000	0.000	0.000	0.001	ma101107_rel.cz11apur1_c8r32
99.988	0.012	0.000	0.000	0.000	0.000	0.000	0.000	0.000	0.000	0.001	ma110401_rel.cz11bpur1_c8r32
99.855	0.145	nonzero	0.000	0.000	0.000	0.000	0.000	0.000	0.000	0.002	my8036_rel.cz11apur1_c8r32
Insert response time histogram
256us	1ms	4ms	16ms	64ms	256ms	1s	4s	16s	gt	max	tag
0.000	0.028	53.333	46.639	0.000	0.000	0.000	0.000	0.000	0.000	0.011	ma101107_rel.cz11apur1_c8r32
0.000	0.167	53.278	46.556	0.000	0.000	0.000	0.000	0.000	0.000	0.015	ma110401_rel.cz11bpur1_c8r32
0.000	0.000	99.833	0.167	0.000	0.000	0.000	0.000	0.000	0.000	0.011	my8036_rel.cz11apur1_c8r32
Delete response time histogram
256us	1ms	4ms	16ms	64ms	256ms	1s	4s	16s	gt	max	tag
0.000	2.444	50.917	46.639	0.000	0.000	0.000	0.000	0.000	0.000	0.011	ma101107_rel.cz11apur1_c8r32
0.000	2.806	50.667	46.528	0.000	0.000	0.000	0.000	0.000	0.000	0.011	ma110401_rel.cz11bpur1_c8r32
0.000	0.861	99.028	0.111	0.000	0.000	0.000	0.000	0.000	0.000	0.007	my8036_rel.cz11apur1_c8r32
qr500.L3
- qr500.L3: range queries with 500 insert/s per client
- Legend for results is here.
- Each entry lists the percentage of responses that fit in that bucket (slower than max time for previous bucket, faster than min time for next bucket).
Query response time histogram
256us	1ms	4ms	16ms	64ms	256ms	1s	4s	16s	gt	max	tag
99.989	0.011	nonzero	nonzero	0.000	0.000	0.000	0.000	0.000	0.000	0.005	ma101107_rel.cz11apur1_c8r32
99.989	0.011	nonzero	nonzero	0.000	0.000	0.000	0.000	0.000	0.000	0.009	ma110401_rel.cz11bpur1_c8r32
99.975	0.025	nonzero	0.000	0.000	0.000	0.000	0.000	0.000	0.000	0.002	my8036_rel.cz11apur1_c8r32
Insert response time histogram
256us	1ms	4ms	16ms	64ms	256ms	1s	4s	16s	gt	max	tag
0.000	17.539	73.150	9.311	0.000	0.000	0.000	0.000	0.000	0.000	0.011	ma101107_rel.cz11apur1_c8r32
0.000	23.611	67.039	9.350	0.000	0.000	0.000	0.000	0.000	0.000	0.011	ma110401_rel.cz11bpur1_c8r32
0.000	0.000	99.856	0.133	0.011	0.000	0.000	0.000	0.000	0.000	0.023	my8036_rel.cz11apur1_c8r32
Delete response time histogram
256us	1ms	4ms	16ms	64ms	256ms	1s	4s	16s	gt	max	tag
0.000	79.056	11.633	9.311	0.000	0.000	0.000	0.000	0.000	0.000	0.011	ma101107_rel.cz11apur1_c8r32
0.000	78.917	11.744	9.339	0.000	0.000	0.000	0.000	0.000	0.000	0.011	ma110401_rel.cz11bpur1_c8r32
0.000	82.972	16.917	0.106	0.006	0.000	0.000	0.000	0.000	0.000	0.023	my8036_rel.cz11apur1_c8r32
qp500.L4
- qp500.L4: point queries with 500 insert/s per client
- Legend for results is here.
- Each entry lists the percentage of responses that fit in that bucket (slower than max time for previous bucket, faster than min time for next bucket).
Query response time histogram
256us	1ms	4ms	16ms	64ms	256ms	1s	4s	16s	gt	max	tag
99.970	0.030	nonzero	0.000	0.000	0.000	0.000	0.000	0.000	0.000	0.002	ma101107_rel.cz11apur1_c8r32
99.975	0.025	nonzero	0.000	0.000	0.000	0.000	0.000	0.000	0.000	0.002	ma110401_rel.cz11bpur1_c8r32
99.792	0.208	nonzero	0.000	0.000	0.000	0.000	0.000	0.000	0.000	0.003	my8036_rel.cz11apur1_c8r32
Insert response time histogram
256us	1ms	4ms	16ms	64ms	256ms	1s	4s	16s	gt	max	tag
0.000	2.483	88.256	9.261	0.000	0.000	0.000	0.000	0.000	0.000	0.011	ma101107_rel.cz11apur1_c8r32
0.000	13.644	77.033	9.322	0.000	0.000	0.000	0.000	0.000	0.000	0.015	ma110401_rel.cz11bpur1_c8r32
0.000	0.000	99.822	0.172	0.006	0.000	0.000	0.000	0.000	0.000	0.024	my8036_rel.cz11apur1_c8r32
Delete response time histogram
256us	1ms	4ms	16ms	64ms	256ms	1s	4s	16s	gt	max	tag
0.000	70.511	20.228	9.261	0.000	0.000	0.000	0.000	0.000	0.000	0.011	ma101107_rel.cz11apur1_c8r32
0.000	76.539	14.139	9.322	0.000	0.000	0.000	0.000	0.000	0.000	0.011	ma110401_rel.cz11bpur1_c8r32
0.000	60.550	39.311	0.133	0.006	0.000	0.000	0.000	0.000	0.000	0.023	my8036_rel.cz11apur1_c8r32
qr1000.L5
- qr1000.L5: range queries with 1000 insert/s per client
- Legend for results is here.
- Each entry lists the percentage of responses that fit in that bucket (slower than max time for previous bucket, faster than min time for next bucket).
Query response time histogram
256us	1ms	4ms	16ms	64ms	256ms	1s	4s	16s	gt	max	tag
99.983	0.017	0.001	nonzero	0.000	0.000	0.000	0.000	0.000	0.000	0.006	ma101107_rel.cz11apur1_c8r32
99.985	0.015	nonzero	nonzero	nonzero	0.000	0.000	0.000	0.000	0.000	0.020	ma110401_rel.cz11bpur1_c8r32
99.969	0.031	nonzero	nonzero	0.000	0.000	0.000	0.000	0.000	0.000	0.004	my8036_rel.cz11apur1_c8r32
Insert response time histogram
256us	1ms	4ms	16ms	64ms	256ms	1s	4s	16s	gt	max	tag
0.000	22.564	72.747	4.686	0.003	0.000	0.000	0.000	0.000	0.000	0.033	ma101107_rel.cz11apur1_c8r32
0.000	37.619	57.611	4.764	0.006	0.000	0.000	0.000	0.000	0.000	0.032	ma110401_rel.cz11bpur1_c8r32
0.000	0.000	99.822	0.172	0.006	0.000	0.000	0.000	0.000	0.000	0.024	my8036_rel.cz11apur1_c8r32
Delete response time histogram
256us	1ms	4ms	16ms	64ms	256ms	1s	4s	16s	gt	max	tag
0.000	86.514	8.814	4.669	0.003	0.000	0.000	0.000	0.000	0.000	0.032	ma101107_rel.cz11apur1_c8r32
0.000	86.775	8.503	4.717	0.006	0.000	0.000	0.000	0.000	0.000	0.030	ma110401_rel.cz11bpur1_c8r32
0.000	78.578	21.286	0.136	0.000	0.000	0.000	0.000	0.000	0.000	0.013	my8036_rel.cz11apur1_c8r32
qp1000.L6
- qp1000.L6: point queries with 1000 insert/s per client
- Legend for results is here.
- Each entry lists the percentage of responses that fit in that bucket (slower than max time for previous bucket, faster than min time for next bucket).
Query response time histogram
256us	1ms	4ms	16ms	64ms	256ms	1s	4s	16s	gt	max	tag
99.960	0.039	nonzero	nonzero	0.000	0.000	0.000	0.000	0.000	0.000	0.011	ma101107_rel.cz11apur1_c8r32
99.965	0.035	nonzero	0.000	0.000	0.000	0.000	0.000	0.000	0.000	0.002	ma110401_rel.cz11bpur1_c8r32
99.767	0.233	nonzero	0.000	0.000	0.000	0.000	0.000	0.000	0.000	0.002	my8036_rel.cz11apur1_c8r32
Insert response time histogram
256us	1ms	4ms	16ms	64ms	256ms	1s	4s	16s	gt	max	tag
0.000	8.011	87.339	4.647	0.003	0.000	0.000	0.000	0.000	0.000	0.040	ma101107_rel.cz11apur1_c8r32
0.000	24.122	71.206	4.667	0.006	0.000	0.000	0.000	0.000	0.000	0.031	ma110401_rel.cz11bpur1_c8r32
0.000	0.000	99.731	0.267	0.003	0.000	0.000	0.000	0.000	0.000	0.023	my8036_rel.cz11apur1_c8r32
Delete response time histogram
256us	1ms	4ms	16ms	64ms	256ms	1s	4s	16s	gt	max	tag
0.000	80.122	15.236	4.639	0.003	0.000	0.000	0.000	0.000	0.000	0.029	ma101107_rel.cz11apur1_c8r32
0.000	85.361	9.986	4.650	0.003	0.000	0.000	0.000	0.000	0.000	0.031	ma110401_rel.cz11bpur1_c8r32
0.000	56.700	43.094	0.203	0.003	0.000	0.000	0.000	0.000	0.000	0.023	my8036_rel.cz11apur1_c8r32