Introduction
This is a report for the insert benchmark with 50M docs and 1 client(s). It is generated by scripts (bash, awk, sed) and Tufte might not be impressed. An overview of the insert benchmark is here and a short update is here. Below, by DBMS, I mean DBMS+version.config. An example is my8020.c10b40 where my means MySQL, 8020 is version 8.0.20 and c10b40 is the name for the configuration file.
The test server has 8 AMD cores, 32G RAM and an NVMe SSD. It is described here as the ASUS PN53. The benchmark was run with 1 client and there were 1 or 3 connections per client (1 for queries or inserts without rate limits, 1+1 for rate limited inserts+deletes). It uses 1 table. It loads 50M rows per table without secondary indexes, creates 3 secondary indexes per table, then inserts 40m+10m rows per table with a delete per insert to avoid growing the table. It then does 6 read+write tests for 1800s each that do queries as fast as possible with 100,100,500,500,1000,1000 inserts/s and the same for deletes/s per client concurrent with the queries. The database is cached in memory. Clients and the DBMS share one server. The per-database configs are in the per-database subdirectories here.
The tested DBMS are:
- ma100244_rel.cz11apur1_c8r32 - MariaDB 10.2.44 with the cz11apur1_c8r32 config that uses innodb_purge_threads=1
- ma100339_rel.cz11apur1_c8r32 - MariaDB 10.3.39 with the cz11apur1_c8r32 config that uses innodb_purge_threads=1
- ma100433_rel.cz11apur1_c8r32 - MariaDB 10.4.33 with the cz11apur1_c8r32 config that uses innodb_purge_threads=1
- ma100524_rel.cz11apur1_c8r32 - MariaDB 10.5.24 with the cz11apur1_c8r32 config that uses innodb_purge_threads=1
- ma100617_rel.cz11apur1_c8r32 - MariaDB 10.6.17 with the cz11apur1_c8r32 config that uses innodb_purge_threads=1
- ma101107_rel.cz11apur1_c8r32 - MariaDB 10.11.7 with the cz11apur1_c8r32 config that uses innodb_purge_threads=1
- ma110401_rel.cz11bpur1_c8r32 - MariaDB 11.4.1 with the cz11apur1_c8r32 config that uses innodb_purge_threads=1
Contents
- Summary
- l.i0: load without secondary indexes
- l.x: create secondary indexes
- l.i1: continue load after secondary indexes created with 50 inserts per transaction
- l.i2: continue load after secondary indexes created with 5 inserts per transaction
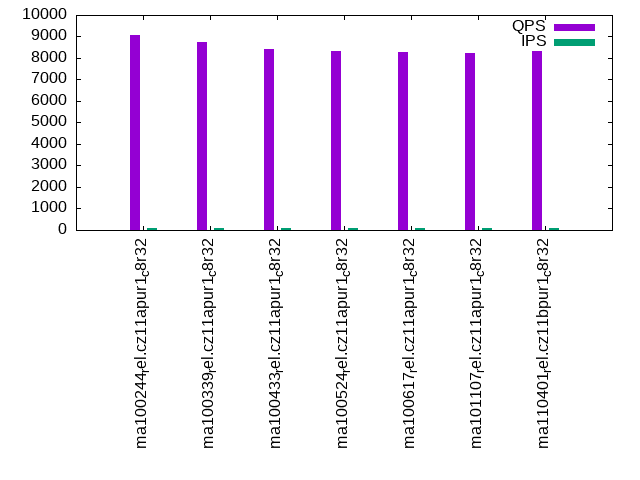
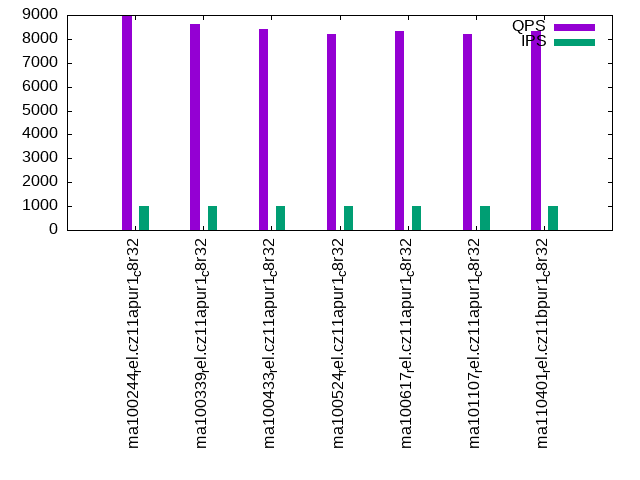
- qr100.L1: range queries with 100 insert/s per client
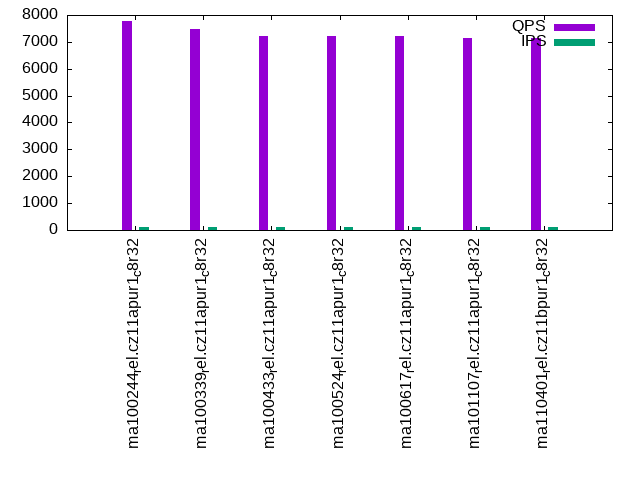
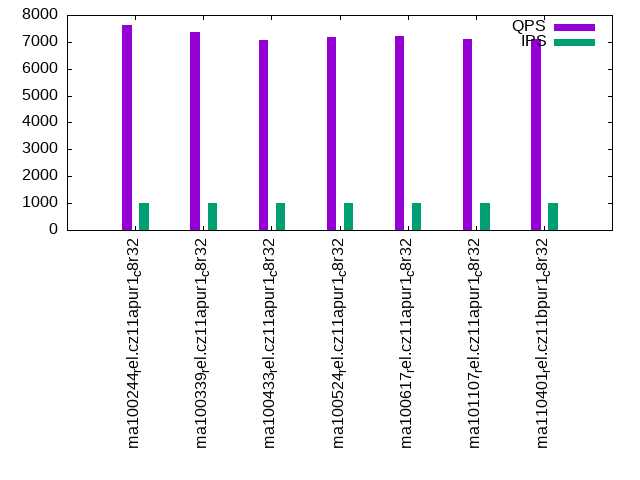
- qp100.L2: point queries with 100 insert/s per client
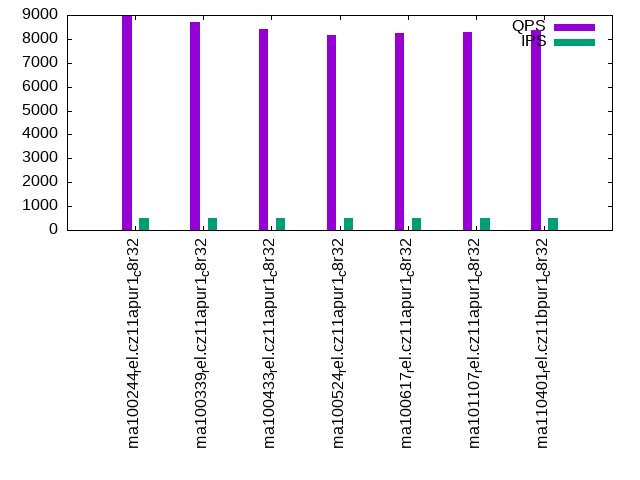
- qr500.L3: range queries with 500 insert/s per client
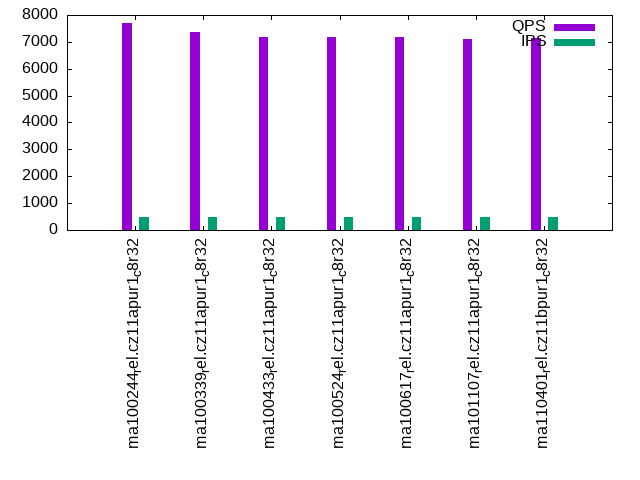
- qp500.L4: point queries with 500 insert/s per client
- qr1000.L5: range queries with 1000 insert/s per client
- qp1000.L6: point queries with 1000 insert/s per client
Summary
The numbers are inserts/s for l.i0, l.i1 and l.i2, indexed docs (or rows) /s for l.x and queries/s for qr100, qp100 thru qr1000, qp1000" The values are the average rate over the entire test for inserts (IPS) and queries (QPS). The range of values for IPS and QPS is split into 3 parts: bottom 25%, middle 50%, top 25%. Values in the bottom 25% have a red background, values in the top 25% have a green background and values in the middle have no color. A gray background is used for values that can be ignored because the DBMS did not sustain the target insert rate. Red backgrounds are not used when the minimum value is within 80% of the max value.
| dbms | l.i0 | l.x | l.i1 | l.i2 | qr100 | qp100 | qr500 | qp500 | qr1000 | qp1000 |
|---|---|---|---|---|---|---|---|---|---|---|
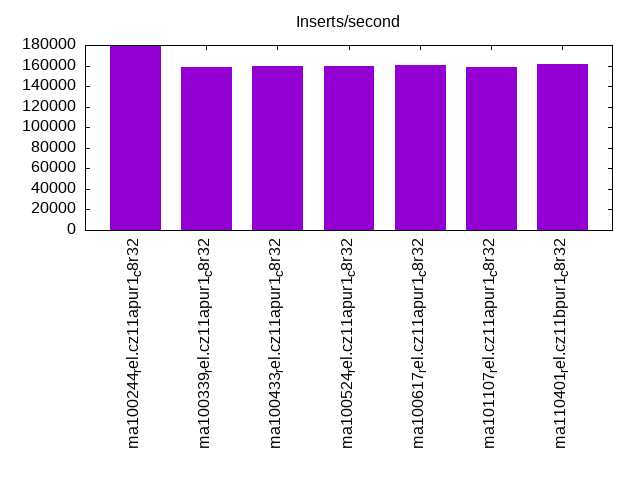
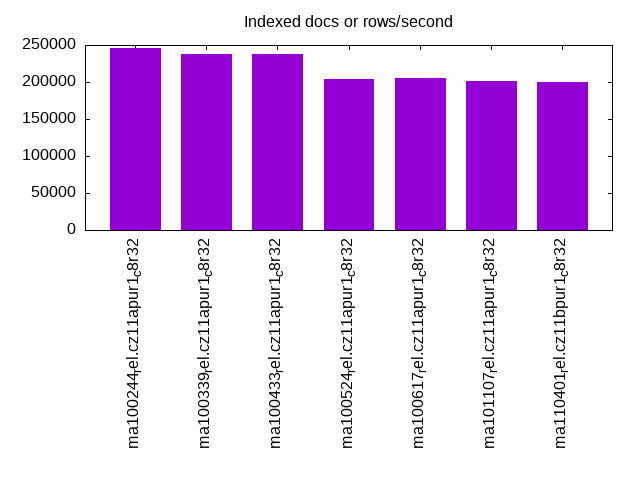
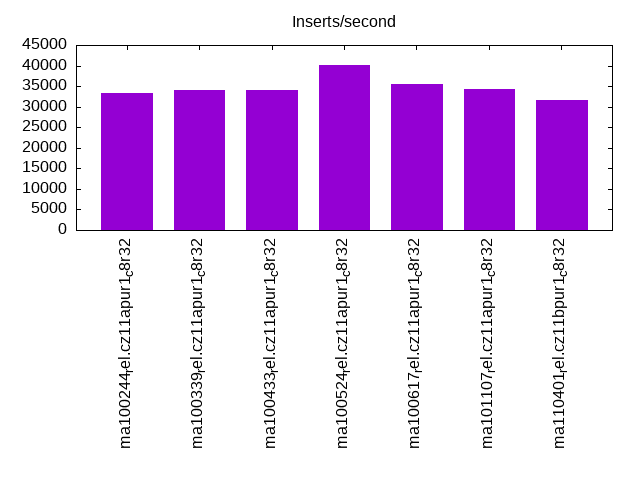
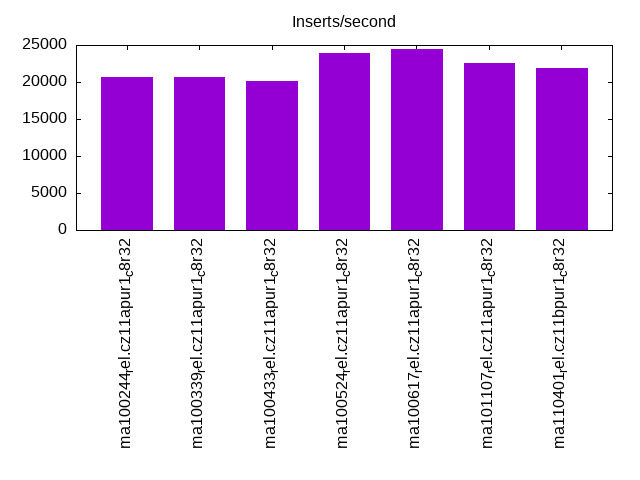
| ma100244_rel.cz11apur1_c8r32 | 179856 | 246306 | 33389 | 20618 | 9051 | 7792 | 8943 | 7707 | 8938 | 7611 |
| ma100339_rel.cz11apur1_c8r32 | 158228 | 238096 | 34100 | 20704 | 8760 | 7496 | 8716 | 7349 | 8618 | 7377 |
| ma100433_rel.cz11apur1_c8r32 | 159744 | 238096 | 34014 | 20161 | 8412 | 7209 | 8420 | 7196 | 8416 | 7056 |
| ma100524_rel.cz11apur1_c8r32 | 159744 | 204082 | 40040 | 23981 | 8332 | 7230 | 8175 | 7197 | 8206 | 7168 |
| ma100617_rel.cz11apur1_c8r32 | 160772 | 204918 | 35587 | 24510 | 8276 | 7218 | 8246 | 7177 | 8330 | 7205 |
| ma101107_rel.cz11apur1_c8r32 | 158228 | 201613 | 34335 | 22573 | 8238 | 7129 | 8296 | 7095 | 8190 | 7094 |
| ma110401_rel.cz11bpur1_c8r32 | 161812 | 200000 | 31620 | 21882 | 8315 | 7135 | 8356 | 7149 | 8316 | 7113 |
This table has relative throughput, throughput for the DBMS relative to the DBMS in the first line, using the absolute throughput from the previous table. Values less than 0.95 have a yellow background. Values greater than 1.05 have a blue background.
| dbms | l.i0 | l.x | l.i1 | l.i2 | qr100 | qp100 | qr500 | qp500 | qr1000 | qp1000 |
|---|---|---|---|---|---|---|---|---|---|---|
| ma100244_rel.cz11apur1_c8r32 | 1.00 | 1.00 | 1.00 | 1.00 | 1.00 | 1.00 | 1.00 | 1.00 | 1.00 | 1.00 |
| ma100339_rel.cz11apur1_c8r32 | 0.88 | 0.97 | 1.02 | 1.00 | 0.97 | 0.96 | 0.97 | 0.95 | 0.96 | 0.97 |
| ma100433_rel.cz11apur1_c8r32 | 0.89 | 0.97 | 1.02 | 0.98 | 0.93 | 0.93 | 0.94 | 0.93 | 0.94 | 0.93 |
| ma100524_rel.cz11apur1_c8r32 | 0.89 | 0.83 | 1.20 | 1.16 | 0.92 | 0.93 | 0.91 | 0.93 | 0.92 | 0.94 |
| ma100617_rel.cz11apur1_c8r32 | 0.89 | 0.83 | 1.07 | 1.19 | 0.91 | 0.93 | 0.92 | 0.93 | 0.93 | 0.95 |
| ma101107_rel.cz11apur1_c8r32 | 0.88 | 0.82 | 1.03 | 1.09 | 0.91 | 0.91 | 0.93 | 0.92 | 0.92 | 0.93 |
| ma110401_rel.cz11bpur1_c8r32 | 0.90 | 0.81 | 0.95 | 1.06 | 0.92 | 0.92 | 0.93 | 0.93 | 0.93 | 0.93 |
This lists the average rate of inserts/s for the tests that do inserts concurrent with queries. For such tests the query rate is listed in the table above. The read+write tests are setup so that the insert rate should match the target rate every second. Cells that are not at least 95% of the target have a red background to indicate a failure to satisfy the target.
| dbms | qr100.L1 | qp100.L2 | qr500.L3 | qp500.L4 | qr1000.L5 | qp1000.L6 |
|---|---|---|---|---|---|---|
| ma100244_rel.cz11apur1_c8r32 | 100 | 100 | 499 | 499 | 999 | 999 |
| ma100339_rel.cz11apur1_c8r32 | 100 | 100 | 499 | 499 | 999 | 999 |
| ma100433_rel.cz11apur1_c8r32 | 100 | 100 | 499 | 499 | 999 | 999 |
| ma100524_rel.cz11apur1_c8r32 | 100 | 100 | 499 | 499 | 999 | 999 |
| ma100617_rel.cz11apur1_c8r32 | 100 | 100 | 499 | 499 | 999 | 999 |
| ma101107_rel.cz11apur1_c8r32 | 100 | 100 | 499 | 499 | 999 | 999 |
| ma110401_rel.cz11bpur1_c8r32 | 100 | 100 | 499 | 499 | 999 | 999 |
| target | 100 | 100 | 500 | 500 | 1000 | 1000 |
l.i0
l.i0: load without secondary indexes. Graphs for performance per 1-second interval are here.
Average throughput:
Insert response time histogram: each cell has the percentage of responses that take <= the time in the header and max is the max response time in seconds. For the max column values in the top 25% of the range have a red background and in the bottom 25% of the range have a green background. The red background is not used when the min value is within 80% of the max value.
| dbms | 256us | 1ms | 4ms | 16ms | 64ms | 256ms | 1s | 4s | 16s | gt | max |
|---|---|---|---|---|---|---|---|---|---|---|---|
| ma100244_rel.cz11apur1_c8r32 | 99.599 | 0.155 | 0.232 | 0.010 | 0.004 | 0.132 | |||||
| ma100339_rel.cz11apur1_c8r32 | 99.381 | 0.253 | 0.343 | 0.019 | 0.004 | 0.135 | |||||
| ma100433_rel.cz11apur1_c8r32 | 99.537 | 0.192 | 0.255 | 0.012 | 0.004 | 0.126 | |||||
| ma100524_rel.cz11apur1_c8r32 | 99.334 | 0.224 | 0.379 | 0.058 | 0.004 | 0.124 | |||||
| ma100617_rel.cz11apur1_c8r32 | 99.582 | 0.169 | 0.240 | 0.005 | 0.004 | 0.174 | |||||
| ma101107_rel.cz11apur1_c8r32 | 99.585 | 0.167 | 0.235 | 0.008 | 0.005 | 0.164 | |||||
| ma110401_rel.cz11bpur1_c8r32 | 99.590 | 0.164 | 0.223 | 0.018 | 0.005 | 0.197 |
Performance metrics for the DBMS listed above. Some are normalized by throughput, others are not. Legend for results is here.
ips	qps	rps	rmbps	wps	wmbps	rpq	rkbpq	wpi	wkbpi	csps	cpups	cspq	cpupq	dbgb1	dbgb2	rss	maxop	p50	p99	tag
179856	0	0	0.0	919.9	57.7	0.000	0.000	0.005	0.328	19421	21.8	0.108	10	3.3	34.1	4.3	0.132	182200	155329	ma100244_rel.cz11apur1_c8r32
158228	0	0	0.0	1203.5	64.4	0.000	0.000	0.008	0.417	21149	23.2	0.134	12	3.3	34.1	4.2	0.135	159924	134854	ma100339_rel.cz11apur1_c8r32
159744	0	0	0.0	858.2	55.0	0.000	0.000	0.005	0.353	20832	23.8	0.130	12	3.3	34.1	NA	0.126	161875	138448	ma100433_rel.cz11apur1_c8r32
159744	0	0	0.0	1308.3	52.4	0.000	0.000	0.008	0.336	23894	23.2	0.150	12	3.3	34.1	4.0	0.124	161376	139251	ma100524_rel.cz11apur1_c8r32
160772	0	0	0.0	618.3	39.3	0.000	0.000	0.004	0.250	19662	23.7	0.122	12	3.3	34.1	3.7	0.174	161723	139546	ma100617_rel.cz11apur1_c8r32
158228	0	0	0.0	643.2	40.4	0.000	0.000	0.004	0.261	19214	23.3	0.121	12	3.3	34.1	3.7	0.164	160124	138850	ma101107_rel.cz11apur1_c8r32
161812	0	0	0.0	656.8	40.6	0.000	0.000	0.004	0.257	20447	23.8	0.126	12	3.3	34.1	3.8	0.197	162921	139548	ma110401_rel.cz11bpur1_c8r32
l.x
l.x: create secondary indexes.
Average throughput:
Performance metrics for the DBMS listed above. Some are normalized by throughput, others are not. Legend for results is here.
ips	qps	rps	rmbps	wps	wmbps	rpq	rkbpq	wpi	wkbpi	csps	cpups	cspq	cpupq	dbgb1	dbgb2	rss	maxop	p50	p99	tag
246306	0	0	0.0	2813.3	232.0	0.000	0.000	0.011	0.965	11456	12.6	0.047	4	7.6	38.4	6.9	0.001	NA	NA	ma100244_rel.cz11apur1_c8r32
238096	0	0	0.0	2398.7	214.1	0.000	0.000	0.010	0.921	10738	12.2	0.045	4	7.6	38.4	8.1	0.001	NA	NA	ma100339_rel.cz11apur1_c8r32
238096	0	0	0.0	2663.7	223.2	0.000	0.000	0.011	0.960	10648	12.5	0.045	4	7.5	38.3	NA	0.001	NA	NA	ma100433_rel.cz11apur1_c8r32
204082	0	0	0.0	1335.1	165.6	0.000	0.000	0.007	0.831	439	11.9	0.002	5	7.5	38.3	7.5	0.002	NA	NA	ma100524_rel.cz11apur1_c8r32
204918	0	0	0.0	2412.8	182.5	0.000	0.000	0.012	0.912	5418	12.2	0.026	5	7.5	38.3	7.2	0.001	NA	NA	ma100617_rel.cz11apur1_c8r32
201613	0	0	0.0	2335.6	178.4	0.000	0.000	0.012	0.906	5195	12.1	0.026	5	7.5	38.3	6.9	0.002	NA	NA	ma101107_rel.cz11apur1_c8r32
200000	0	0	0.0	2299.1	176.1	0.000	0.000	0.011	0.901	5108	12.0	0.026	5	7.5	38.3	6.7	0.001	NA	NA	ma110401_rel.cz11bpur1_c8r32
l.i1
l.i1: continue load after secondary indexes created with 50 inserts per transaction. Graphs for performance per 1-second interval are here.
Average throughput:
Insert response time histogram: each cell has the percentage of responses that take <= the time in the header and max is the max response time in seconds. For the max column values in the top 25% of the range have a red background and in the bottom 25% of the range have a green background. The red background is not used when the min value is within 80% of the max value.
| dbms | 256us | 1ms | 4ms | 16ms | 64ms | 256ms | 1s | 4s | 16s | gt | max |
|---|---|---|---|---|---|---|---|---|---|---|---|
| ma100244_rel.cz11apur1_c8r32 | 4.255 | 90.510 | 5.213 | 0.021 | nonzero | 0.065 | |||||
| ma100339_rel.cz11apur1_c8r32 | 4.779 | 90.446 | 4.753 | 0.022 | 0.001 | 0.071 | |||||
| ma100433_rel.cz11apur1_c8r32 | 2.102 | 93.400 | 4.478 | 0.019 | nonzero | 0.154 | |||||
| ma100524_rel.cz11apur1_c8r32 | 14.986 | 83.860 | 1.094 | 0.052 | 0.002 | 0.006 | 0.394 | ||||
| ma100617_rel.cz11apur1_c8r32 | 6.969 | 91.890 | 1.096 | 0.044 | 0.001 | nonzero | 0.282 | ||||
| ma101107_rel.cz11apur1_c8r32 | 2.921 | 95.920 | 1.122 | 0.036 | 0.001 | 0.236 | |||||
| ma110401_rel.cz11bpur1_c8r32 | 5.355 | 92.048 | 2.305 | 0.289 | 0.003 | 0.229 |
Delete response time histogram: each cell has the percentage of responses that take <= the time in the header and max is the max response time in seconds. For the max column values in the top 25% of the range have a red background and in the bottom 25% of the range have a green background. The red background is not used when the min value is within 80% of the max value.
| dbms | 256us | 1ms | 4ms | 16ms | 64ms | 256ms | 1s | 4s | 16s | gt | max |
|---|---|---|---|---|---|---|---|---|---|---|---|
| ma100244_rel.cz11apur1_c8r32 | 87.584 | 7.729 | 4.676 | 0.010 | 0.064 | ||||||
| ma100339_rel.cz11apur1_c8r32 | 90.697 | 5.143 | 4.149 | 0.011 | 0.058 | ||||||
| ma100433_rel.cz11apur1_c8r32 | 90.570 | 5.508 | 3.913 | 0.008 | nonzero | 0.068 | |||||
| ma100524_rel.cz11apur1_c8r32 | 96.998 | 2.264 | 0.711 | 0.018 | 0.003 | 0.006 | 0.261 | ||||
| ma100617_rel.cz11apur1_c8r32 | 59.517 | 39.655 | 0.795 | 0.033 | 0.001 | 0.106 | |||||
| ma101107_rel.cz11apur1_c8r32 | 49.686 | 49.472 | 0.814 | 0.026 | 0.001 | 0.234 | |||||
| ma110401_rel.cz11bpur1_c8r32 | 54.844 | 42.913 | 1.995 | 0.245 | 0.003 | 0.228 |
Performance metrics for the DBMS listed above. Some are normalized by throughput, others are not. Legend for results is here.
ips	qps	rps	rmbps	wps	wmbps	rpq	rkbpq	wpi	wkbpi	csps	cpups	cspq	cpupq	dbgb1	dbgb2	rss	maxop	p50	p99	tag
33389	0	0	0.0	11928.2	376.1	0.000	0.000	0.357	11.534	51548	33.8	1.544	81	10.1	41.0	11.1	0.065	33714	12386	ma100244_rel.cz11apur1_c8r32
34100	0	0	0.0	10707.3	344.1	0.000	0.000	0.314	10.332	47604	33.8	1.396	79	10.2	41.0	11.2	0.071	34812	10988	ma100339_rel.cz11apur1_c8r32
34014	0	0	0.0	10205.6	329.8	0.000	0.000	0.300	9.928	46738	33.4	1.374	79	10.2	41.0	NA	0.154	34912	10988	ma100433_rel.cz11apur1_c8r32
40040	0	0	0.0	8838.0	279.5	0.000	0.000	0.221	7.149	56644	35.8	1.415	72	11.0	43.0	11.4	0.394	43054	200	ma100524_rel.cz11apur1_c8r32
35587	0	0	0.0	5491.8	185.7	0.000	0.000	0.154	5.342	92213	30.9	2.591	69	10.1	40.9	10.0	0.282	38222	11387	ma100617_rel.cz11apur1_c8r32
34335	0	878	3.4	5352.3	180.8	0.026	0.102	0.156	5.393	88977	29.9	2.591	70	10.1	40.9	10.0	0.236	36722	11038	ma101107_rel.cz11apur1_c8r32
31620	0	833	3.3	4978.8	166.5	0.026	0.105	0.157	5.392	80700	27.3	2.552	69	10.1	40.9	10.0	0.229	32065	12686	ma110401_rel.cz11bpur1_c8r32
l.i2
l.i2: continue load after secondary indexes created with 5 inserts per transaction. Graphs for performance per 1-second interval are here.
Average throughput:
Insert response time histogram: each cell has the percentage of responses that take <= the time in the header and max is the max response time in seconds. For the max column values in the top 25% of the range have a red background and in the bottom 25% of the range have a green background. The red background is not used when the min value is within 80% of the max value.
| dbms | 256us | 1ms | 4ms | 16ms | 64ms | 256ms | 1s | 4s | 16s | gt | max |
|---|---|---|---|---|---|---|---|---|---|---|---|
| ma100244_rel.cz11apur1_c8r32 | 94.843 | 4.336 | 0.115 | 0.706 | 0.001 | nonzero | 0.069 | ||||
| ma100339_rel.cz11apur1_c8r32 | 94.515 | 4.743 | 0.096 | 0.645 | 0.001 | 0.064 | |||||
| ma100433_rel.cz11apur1_c8r32 | 93.971 | 5.245 | 0.100 | 0.683 | 0.001 | nonzero | 0.065 | ||||
| ma100524_rel.cz11apur1_c8r32 | 96.585 | 3.250 | 0.135 | 0.028 | 0.002 | 0.053 | |||||
| ma100617_rel.cz11apur1_c8r32 | 95.847 | 4.089 | 0.050 | 0.013 | 0.001 | 0.053 | |||||
| ma101107_rel.cz11apur1_c8r32 | 88.990 | 10.935 | 0.064 | 0.011 | nonzero | 0.059 | |||||
| ma110401_rel.cz11bpur1_c8r32 | 90.945 | 8.879 | 0.057 | 0.116 | 0.003 | 0.061 |
Delete response time histogram: each cell has the percentage of responses that take <= the time in the header and max is the max response time in seconds. For the max column values in the top 25% of the range have a red background and in the bottom 25% of the range have a green background. The red background is not used when the min value is within 80% of the max value.
| dbms | 256us | 1ms | 4ms | 16ms | 64ms | 256ms | 1s | 4s | 16s | gt | max |
|---|---|---|---|---|---|---|---|---|---|---|---|
| ma100244_rel.cz11apur1_c8r32 | 96.509 | 2.683 | 0.108 | 0.700 | 0.001 | nonzero | 0.069 | ||||
| ma100339_rel.cz11apur1_c8r32 | 96.526 | 2.740 | 0.093 | 0.640 | 0.001 | 0.064 | |||||
| ma100433_rel.cz11apur1_c8r32 | 96.351 | 2.875 | 0.096 | 0.676 | 0.001 | nonzero | 0.065 | ||||
| ma100524_rel.cz11apur1_c8r32 | 98.915 | 0.952 | 0.110 | 0.022 | 0.002 | 0.053 | |||||
| ma100617_rel.cz11apur1_c8r32 | 98.224 | 1.722 | 0.042 | 0.012 | 0.001 | 0.053 | |||||
| ma101107_rel.cz11apur1_c8r32 | 95.656 | 4.276 | 0.058 | 0.010 | nonzero | 0.059 | |||||
| ma110401_rel.cz11bpur1_c8r32 | 94.776 | 5.068 | 0.051 | 0.103 | 0.003 | 0.061 |
Performance metrics for the DBMS listed above. Some are normalized by throughput, others are not. Legend for results is here.
ips	qps	rps	rmbps	wps	wmbps	rpq	rkbpq	wpi	wkbpi	csps	cpups	cspq	cpupq	dbgb1	dbgb2	rss	maxop	p50	p99	tag
20618	0	0	0.0	13080.7	384.5	0.000	0.000	0.634	19.095	131207	34.5	6.364	134	10.4	41.2	11.4	0.069	20474	17127	ma100244_rel.cz11apur1_c8r32
20704	0	0	0.0	12494.7	369.1	0.000	0.000	0.603	18.256	129252	34.9	6.243	135	10.5	41.3	11.5	0.064	20688	17356	ma100339_rel.cz11apur1_c8r32
20161	0	0	0.0	13104.4	384.6	0.000	0.000	0.650	19.536	130640	34.2	6.480	136	10.4	41.2	NA	0.065	19990	16792	ma100433_rel.cz11apur1_c8r32
23981	0	0	0.0	10912.1	318.7	0.000	0.000	0.455	13.607	155327	38.0	6.477	127	11.2	43.3	11.4	0.053	24077	22751	ma100524_rel.cz11apur1_c8r32
24510	0	0	0.0	2765.7	95.9	0.000	0.000	0.113	4.006	118905	34.6	4.851	113	10.3	41.2	10.2	0.053	24574	23285	ma100617_rel.cz11apur1_c8r32
22573	0	3214	12.6	2628.4	91.2	0.142	0.569	0.116	4.137	114634	33.0	5.078	117	10.3	41.2	10.2	0.059	22546	21367	ma101107_rel.cz11apur1_c8r32
21882	0	3106	12.1	2556.0	87.9	0.142	0.568	0.117	4.113	111089	31.9	5.077	117	10.3	41.1	10.2	0.061	22631	18795	ma110401_rel.cz11bpur1_c8r32
qr100.L1
qr100.L1: range queries with 100 insert/s per client. Graphs for performance per 1-second interval are here.
Average throughput:
Query response time histogram: each cell has the percentage of responses that take <= the time in the header and max is the max response time in seconds. For max values in the top 25% of the range have a red background and in the bottom 25% of the range have a green background. The red background is not used when the min value is within 80% of the max value.
| dbms | 256us | 1ms | 4ms | 16ms | 64ms | 256ms | 1s | 4s | 16s | gt | max |
|---|---|---|---|---|---|---|---|---|---|---|---|
| ma100244_rel.cz11apur1_c8r32 | 99.994 | 0.005 | nonzero | nonzero | 0.014 | ||||||
| ma100339_rel.cz11apur1_c8r32 | 99.992 | 0.007 | nonzero | nonzero | 0.015 | ||||||
| ma100433_rel.cz11apur1_c8r32 | 99.990 | 0.010 | nonzero | nonzero | nonzero | 0.022 | |||||
| ma100524_rel.cz11apur1_c8r32 | 99.996 | 0.004 | nonzero | 0.001 | |||||||
| ma100617_rel.cz11apur1_c8r32 | 99.996 | 0.004 | 0.001 | ||||||||
| ma101107_rel.cz11apur1_c8r32 | 99.995 | 0.005 | 0.001 | ||||||||
| ma110401_rel.cz11bpur1_c8r32 | 99.995 | 0.005 | 0.001 |
Insert response time histogram: each cell has the percentage of responses that take <= the time in the header and max is the max response time in seconds. For max values in the top 25% of the range have a red background and in the bottom 25% of the range have a green background. The red background is not used when the min value is within 80% of the max value.
| dbms | 256us | 1ms | 4ms | 16ms | 64ms | 256ms | 1s | 4s | 16s | gt | max |
|---|---|---|---|---|---|---|---|---|---|---|---|
| ma100244_rel.cz11apur1_c8r32 | 0.889 | 96.028 | 2.500 | 0.583 | 0.030 | ||||||
| ma100339_rel.cz11apur1_c8r32 | 0.528 | 96.556 | 2.278 | 0.639 | 0.036 | ||||||
| ma100433_rel.cz11apur1_c8r32 | 0.583 | 96.333 | 2.528 | 0.556 | 0.037 | ||||||
| ma100524_rel.cz11apur1_c8r32 | 5.056 | 94.944 | 0.002 | ||||||||
| ma100617_rel.cz11apur1_c8r32 | 19.667 | 80.333 | 0.002 | ||||||||
| ma101107_rel.cz11apur1_c8r32 | 0.611 | 52.750 | 46.639 | 0.011 | |||||||
| ma110401_rel.cz11bpur1_c8r32 | 1.139 | 52.306 | 46.556 | 0.011 |
Delete response time histogram: each cell has the percentage of responses that take <= the time in the header and max is the max response time in seconds. For max values in the top 25% of the range have a red background and in the bottom 25% of the range have a green background. The red background is not used when the min value is within 80% of the max value.
| dbms | 256us | 1ms | 4ms | 16ms | 64ms | 256ms | 1s | 4s | 16s | gt | max |
|---|---|---|---|---|---|---|---|---|---|---|---|
| ma100244_rel.cz11apur1_c8r32 | 39.250 | 57.972 | 2.528 | 0.250 | 0.021 | ||||||
| ma100339_rel.cz11apur1_c8r32 | 52.167 | 45.278 | 2.361 | 0.194 | 0.022 | ||||||
| ma100433_rel.cz11apur1_c8r32 | 51.389 | 46.083 | 2.222 | 0.306 | 0.033 | ||||||
| ma100524_rel.cz11apur1_c8r32 | 63.583 | 36.417 | 0.002 | ||||||||
| ma100617_rel.cz11apur1_c8r32 | 52.722 | 47.278 | 0.002 | ||||||||
| ma101107_rel.cz11apur1_c8r32 | 3.417 | 49.944 | 46.639 | 0.011 | |||||||
| ma110401_rel.cz11bpur1_c8r32 | 3.889 | 49.556 | 46.556 | 0.011 |
Performance metrics for the DBMS listed above. Some are normalized by throughput, others are not. Legend for results is here.
ips	qps	rps	rmbps	wps	wmbps	rpq	rkbpq	wpi	wkbpi	csps	cpups	cspq	cpupq	dbgb1	dbgb2	rss	maxop	p50	p99	tag
100	9051	0	0.0	876.0	24.3	0.000	0.000	8.778	248.995	37402	12.9	4.133	114	10.4	41.2	11.4	0.014	9046	8966	ma100244_rel.cz11apur1_c8r32
100	8760	0	0.0	866.8	24.0	0.000	0.000	8.686	246.337	36297	12.7	4.143	116	10.5	41.3	11.5	0.015	8762	8647	ma100339_rel.cz11apur1_c8r32
100	8412	0	0.0	865.5	24.0	0.000	0.000	8.672	245.928	35020	12.7	4.163	121	10.4	41.2	NA	0.022	8409	8343	ma100433_rel.cz11apur1_c8r32
100	8332	0	0.0	2.4	0.1	0.000	0.000	0.024	1.172	32186	12.6	3.863	121	11.2	43.3	11.4	0.001	8343	8215	ma100524_rel.cz11apur1_c8r32
100	8276	0	0.0	2.4	0.1	0.000	0.000	0.024	1.186	31769	12.6	3.838	122	10.3	41.2	10.2	0.001	8279	8231	ma100617_rel.cz11apur1_c8r32
100	8238	4	0.0	2.4	0.1	0.000	0.002	0.024	1.192	31658	12.6	3.843	122	10.3	41.2	10.2	0.001	8247	8183	ma101107_rel.cz11apur1_c8r32
100	8315	3	0.0	2.3	0.1	0.000	0.002	0.024	1.181	31944	12.6	3.842	121	10.3	41.1	10.2	0.001	8313	8231	ma110401_rel.cz11bpur1_c8r32
qp100.L2
qp100.L2: point queries with 100 insert/s per client. Graphs for performance per 1-second interval are here.
Average throughput:
Query response time histogram: each cell has the percentage of responses that take <= the time in the header and max is the max response time in seconds. For max values in the top 25% of the range have a red background and in the bottom 25% of the range have a green background. The red background is not used when the min value is within 80% of the max value.
| dbms | 256us | 1ms | 4ms | 16ms | 64ms | 256ms | 1s | 4s | 16s | gt | max |
|---|---|---|---|---|---|---|---|---|---|---|---|
| ma100244_rel.cz11apur1_c8r32 | 99.988 | 0.012 | nonzero | nonzero | 0.008 | ||||||
| ma100339_rel.cz11apur1_c8r32 | 99.983 | 0.017 | nonzero | nonzero | 0.015 | ||||||
| ma100433_rel.cz11apur1_c8r32 | 99.976 | 0.024 | nonzero | nonzero | nonzero | 0.023 | |||||
| ma100524_rel.cz11apur1_c8r32 | 99.989 | 0.011 | nonzero | 0.001 | |||||||
| ma100617_rel.cz11apur1_c8r32 | 99.989 | 0.011 | nonzero | 0.002 | |||||||
| ma101107_rel.cz11apur1_c8r32 | 99.985 | 0.015 | 0.001 | ||||||||
| ma110401_rel.cz11bpur1_c8r32 | 99.988 | 0.012 | 0.001 |
Insert response time histogram: each cell has the percentage of responses that take <= the time in the header and max is the max response time in seconds. For max values in the top 25% of the range have a red background and in the bottom 25% of the range have a green background. The red background is not used when the min value is within 80% of the max value.
| dbms | 256us | 1ms | 4ms | 16ms | 64ms | 256ms | 1s | 4s | 16s | gt | max |
|---|---|---|---|---|---|---|---|---|---|---|---|
| ma100244_rel.cz11apur1_c8r32 | 96.694 | 2.694 | 0.611 | 0.032 | |||||||
| ma100339_rel.cz11apur1_c8r32 | 96.611 | 2.833 | 0.556 | 0.047 | |||||||
| ma100433_rel.cz11apur1_c8r32 | 96.667 | 2.722 | 0.611 | 0.035 | |||||||
| ma100524_rel.cz11apur1_c8r32 | 0.028 | 99.972 | 0.002 | ||||||||
| ma100617_rel.cz11apur1_c8r32 | 0.917 | 99.083 | 0.002 | ||||||||
| ma101107_rel.cz11apur1_c8r32 | 0.028 | 53.333 | 46.639 | 0.011 | |||||||
| ma110401_rel.cz11bpur1_c8r32 | 0.167 | 53.278 | 46.556 | 0.015 |
Delete response time histogram: each cell has the percentage of responses that take <= the time in the header and max is the max response time in seconds. For max values in the top 25% of the range have a red background and in the bottom 25% of the range have a green background. The red background is not used when the min value is within 80% of the max value.
| dbms | 256us | 1ms | 4ms | 16ms | 64ms | 256ms | 1s | 4s | 16s | gt | max |
|---|---|---|---|---|---|---|---|---|---|---|---|
| ma100244_rel.cz11apur1_c8r32 | 6.389 | 90.556 | 2.833 | 0.222 | 0.025 | ||||||
| ma100339_rel.cz11apur1_c8r32 | 27.472 | 69.639 | 2.667 | 0.222 | 0.030 | ||||||
| ma100433_rel.cz11apur1_c8r32 | 23.639 | 73.639 | 2.389 | 0.333 | 0.025 | ||||||
| ma100524_rel.cz11apur1_c8r32 | 33.111 | 66.889 | 0.002 | ||||||||
| ma100617_rel.cz11apur1_c8r32 | 46.639 | 53.361 | 0.002 | ||||||||
| ma101107_rel.cz11apur1_c8r32 | 2.444 | 50.917 | 46.639 | 0.011 | |||||||
| ma110401_rel.cz11bpur1_c8r32 | 2.806 | 50.667 | 46.528 | 0.011 |
Performance metrics for the DBMS listed above. Some are normalized by throughput, others are not. Legend for results is here.
ips	qps	rps	rmbps	wps	wmbps	rpq	rkbpq	wpi	wkbpi	csps	cpups	cspq	cpupq	dbgb1	dbgb2	rss	maxop	p50	p99	tag
100	7792	0	0.0	856.6	23.7	0.000	0.000	8.583	243.435	33974	12.8	4.360	131	10.4	41.2	11.4	0.008	7799	7576	ma100244_rel.cz11apur1_c8r32
100	7496	0	0.0	854.3	23.7	0.000	0.000	8.560	242.752	32749	12.9	4.369	138	10.5	41.3	11.5	0.015	7496	7320	ma100339_rel.cz11apur1_c8r32
100	7209	0	0.0	854.2	23.7	0.000	0.000	8.559	242.720	31707	13.2	4.398	146	10.4	41.2	NA	0.023	7208	7017	ma100433_rel.cz11apur1_c8r32
100	7230	0	0.0	2.4	0.1	0.000	0.000	0.024	1.154	29314	13.0	4.054	144	11.2	43.3	11.4	0.001	7240	7019	ma100524_rel.cz11apur1_c8r32
100	7218	0	0.0	16.5	0.5	0.000	0.000	0.165	5.165	29160	12.9	4.040	143	10.3	41.2	10.2	0.002	7224	7032	ma100617_rel.cz11apur1_c8r32
100	7129	3	0.0	8.6	0.3	0.000	0.002	0.086	2.944	28770	13.1	4.035	147	10.3	41.2	10.2	0.001	7128	7019	ma101107_rel.cz11apur1_c8r32
100	7135	3	0.0	15.1	0.5	0.000	0.002	0.151	4.722	28821	13.1	4.040	147	10.3	41.1	10.2	0.001	7144	6952	ma110401_rel.cz11bpur1_c8r32
qr500.L3
qr500.L3: range queries with 500 insert/s per client. Graphs for performance per 1-second interval are here.
Average throughput:
Query response time histogram: each cell has the percentage of responses that take <= the time in the header and max is the max response time in seconds. For max values in the top 25% of the range have a red background and in the bottom 25% of the range have a green background. The red background is not used when the min value is within 80% of the max value.
| dbms | 256us | 1ms | 4ms | 16ms | 64ms | 256ms | 1s | 4s | 16s | gt | max |
|---|---|---|---|---|---|---|---|---|---|---|---|
| ma100244_rel.cz11apur1_c8r32 | 99.985 | 0.013 | nonzero | 0.001 | nonzero | 0.022 | |||||
| ma100339_rel.cz11apur1_c8r32 | 99.979 | 0.019 | nonzero | 0.002 | nonzero | 0.025 | |||||
| ma100433_rel.cz11apur1_c8r32 | 99.976 | 0.022 | nonzero | 0.001 | nonzero | 0.017 | |||||
| ma100524_rel.cz11apur1_c8r32 | 99.989 | 0.011 | nonzero | 0.002 | |||||||
| ma100617_rel.cz11apur1_c8r32 | 99.991 | 0.009 | nonzero | 0.002 | |||||||
| ma101107_rel.cz11apur1_c8r32 | 99.989 | 0.011 | nonzero | nonzero | 0.005 | ||||||
| ma110401_rel.cz11bpur1_c8r32 | 99.989 | 0.011 | nonzero | nonzero | 0.009 |
Insert response time histogram: each cell has the percentage of responses that take <= the time in the header and max is the max response time in seconds. For max values in the top 25% of the range have a red background and in the bottom 25% of the range have a green background. The red background is not used when the min value is within 80% of the max value.
| dbms | 256us | 1ms | 4ms | 16ms | 64ms | 256ms | 1s | 4s | 16s | gt | max |
|---|---|---|---|---|---|---|---|---|---|---|---|
| ma100244_rel.cz11apur1_c8r32 | 11.800 | 80.778 | 6.822 | 0.600 | 0.038 | ||||||
| ma100339_rel.cz11apur1_c8r32 | 7.456 | 84.572 | 7.194 | 0.778 | 0.038 | ||||||
| ma100433_rel.cz11apur1_c8r32 | 8.800 | 83.833 | 6.761 | 0.606 | 0.043 | ||||||
| ma100524_rel.cz11apur1_c8r32 | 15.561 | 84.439 | 0.002 | ||||||||
| ma100617_rel.cz11apur1_c8r32 | 51.744 | 48.256 | 0.002 | ||||||||
| ma101107_rel.cz11apur1_c8r32 | 17.539 | 73.150 | 9.311 | 0.011 | |||||||
| ma110401_rel.cz11bpur1_c8r32 | 23.611 | 67.039 | 9.350 | 0.011 |
Delete response time histogram: each cell has the percentage of responses that take <= the time in the header and max is the max response time in seconds. For max values in the top 25% of the range have a red background and in the bottom 25% of the range have a green background. The red background is not used when the min value is within 80% of the max value.
| dbms | 256us | 1ms | 4ms | 16ms | 64ms | 256ms | 1s | 4s | 16s | gt | max |
|---|---|---|---|---|---|---|---|---|---|---|---|
| ma100244_rel.cz11apur1_c8r32 | 70.817 | 22.339 | 6.467 | 0.378 | 0.030 | ||||||
| ma100339_rel.cz11apur1_c8r32 | 79.917 | 12.778 | 6.761 | 0.544 | 0.029 | ||||||
| ma100433_rel.cz11apur1_c8r32 | 80.278 | 12.856 | 6.500 | 0.367 | 0.044 | ||||||
| ma100524_rel.cz11apur1_c8r32 | 89.417 | 10.583 | 0.002 | ||||||||
| ma100617_rel.cz11apur1_c8r32 | 88.672 | 11.328 | 0.002 | ||||||||
| ma101107_rel.cz11apur1_c8r32 | 79.056 | 11.633 | 9.311 | 0.011 | |||||||
| ma110401_rel.cz11bpur1_c8r32 | 78.917 | 11.744 | 9.339 | 0.011 |
Performance metrics for the DBMS listed above. Some are normalized by throughput, others are not. Legend for results is here.
ips	qps	rps	rmbps	wps	wmbps	rpq	rkbpq	wpi	wkbpi	csps	cpups	cspq	cpupq	dbgb1	dbgb2	rss	maxop	p50	p99	tag
499	8943	0	0.0	3633.7	101.2	0.000	0.000	7.276	207.508	45283	14.3	5.064	128	10.4	41.2	11.4	0.022	8950	8694	ma100244_rel.cz11apur1_c8r32
499	8716	0	0.0	3658.9	101.9	0.000	0.000	7.327	208.945	44360	14.3	5.090	131	10.5	41.3	11.5	0.025	8726	8391	ma100339_rel.cz11apur1_c8r32
499	8420	0	0.0	3657.9	101.9	0.000	0.000	7.325	208.893	43846	14.3	5.207	136	10.4	41.2	NA	0.017	8439	8170	ma100433_rel.cz11apur1_c8r32
499	8175	0	0.0	5.9	0.5	0.000	0.000	0.012	1.108	31671	13.3	3.874	130	11.2	43.3	11.4	0.002	8170	8119	ma100524_rel.cz11apur1_c8r32
499	8246	0	0.0	6.0	0.5	0.000	0.000	0.012	1.122	31850	13.2	3.862	128	10.3	41.2	10.2	0.002	8247	8199	ma100617_rel.cz11apur1_c8r32
499	8296	19	0.1	24.8	1.1	0.002	0.009	0.050	2.203	32167	13.2	3.878	127	10.3	41.2	10.2	0.005	8295	8231	ma101107_rel.cz11apur1_c8r32
499	8356	19	0.1	25.0	1.1	0.002	0.009	0.050	2.191	32396	13.1	3.877	125	10.3	41.1	10.2	0.009	8359	8279	ma110401_rel.cz11bpur1_c8r32
qp500.L4
qp500.L4: point queries with 500 insert/s per client. Graphs for performance per 1-second interval are here.
Average throughput:
Query response time histogram: each cell has the percentage of responses that take <= the time in the header and max is the max response time in seconds. For max values in the top 25% of the range have a red background and in the bottom 25% of the range have a green background. The red background is not used when the min value is within 80% of the max value.
| dbms | 256us | 1ms | 4ms | 16ms | 64ms | 256ms | 1s | 4s | 16s | gt | max |
|---|---|---|---|---|---|---|---|---|---|---|---|
| ma100244_rel.cz11apur1_c8r32 | 99.972 | 0.028 | nonzero | nonzero | 0.014 | ||||||
| ma100339_rel.cz11apur1_c8r32 | 99.959 | 0.041 | nonzero | nonzero | nonzero | 0.019 | |||||
| ma100433_rel.cz11apur1_c8r32 | 99.942 | 0.057 | nonzero | nonzero | nonzero | 0.023 | |||||
| ma100524_rel.cz11apur1_c8r32 | 99.972 | 0.028 | nonzero | 0.002 | |||||||
| ma100617_rel.cz11apur1_c8r32 | 99.981 | 0.018 | nonzero | 0.002 | |||||||
| ma101107_rel.cz11apur1_c8r32 | 99.970 | 0.030 | nonzero | 0.002 | |||||||
| ma110401_rel.cz11bpur1_c8r32 | 99.975 | 0.025 | nonzero | 0.002 |
Insert response time histogram: each cell has the percentage of responses that take <= the time in the header and max is the max response time in seconds. For max values in the top 25% of the range have a red background and in the bottom 25% of the range have a green background. The red background is not used when the min value is within 80% of the max value.
| dbms | 256us | 1ms | 4ms | 16ms | 64ms | 256ms | 1s | 4s | 16s | gt | max |
|---|---|---|---|---|---|---|---|---|---|---|---|
| ma100244_rel.cz11apur1_c8r32 | 8.444 | 83.911 | 6.928 | 0.717 | 0.034 | ||||||
| ma100339_rel.cz11apur1_c8r32 | 6.578 | 86.078 | 6.617 | 0.728 | 0.035 | ||||||
| ma100433_rel.cz11apur1_c8r32 | 4.889 | 87.617 | 6.756 | 0.739 | 0.041 | ||||||
| ma100524_rel.cz11apur1_c8r32 | 9.461 | 90.539 | 0.002 | ||||||||
| ma100617_rel.cz11apur1_c8r32 | 28.500 | 71.500 | 0.002 | ||||||||
| ma101107_rel.cz11apur1_c8r32 | 2.483 | 88.256 | 9.261 | 0.011 | |||||||
| ma110401_rel.cz11bpur1_c8r32 | 13.644 | 77.033 | 9.322 | 0.015 |
Delete response time histogram: each cell has the percentage of responses that take <= the time in the header and max is the max response time in seconds. For max values in the top 25% of the range have a red background and in the bottom 25% of the range have a green background. The red background is not used when the min value is within 80% of the max value.
| dbms | 256us | 1ms | 4ms | 16ms | 64ms | 256ms | 1s | 4s | 16s | gt | max |
|---|---|---|---|---|---|---|---|---|---|---|---|
| ma100244_rel.cz11apur1_c8r32 | 55.506 | 37.367 | 6.756 | 0.372 | 0.030 | ||||||
| ma100339_rel.cz11apur1_c8r32 | 74.222 | 18.833 | 6.600 | 0.344 | 0.038 | ||||||
| ma100433_rel.cz11apur1_c8r32 | 71.600 | 21.494 | 6.561 | 0.344 | 0.030 | ||||||
| ma100524_rel.cz11apur1_c8r32 | 83.194 | 16.806 | 0.002 | ||||||||
| ma100617_rel.cz11apur1_c8r32 | 87.611 | 12.389 | 0.002 | ||||||||
| ma101107_rel.cz11apur1_c8r32 | 70.511 | 20.228 | 9.261 | 0.011 | |||||||
| ma110401_rel.cz11bpur1_c8r32 | 76.539 | 14.139 | 9.322 | 0.011 |
Performance metrics for the DBMS listed above. Some are normalized by throughput, others are not. Legend for results is here.
ips	qps	rps	rmbps	wps	wmbps	rpq	rkbpq	wpi	wkbpi	csps	cpups	cspq	cpupq	dbgb1	dbgb2	rss	maxop	p50	p99	tag
499	7707	0	0.0	3632.2	101.2	0.000	0.000	7.273	207.420	41999	14.3	5.449	148	10.4	41.2	11.4	0.014	7719	7547	ma100244_rel.cz11apur1_c8r32
499	7349	0	0.0	3651.2	101.7	0.000	0.000	7.311	208.510	40605	14.1	5.525	153	10.5	41.3	11.5	0.019	7352	7192	ma100339_rel.cz11apur1_c8r32
499	7196	0	0.0	3658.3	101.9	0.000	0.000	7.330	209.035	40500	14.1	5.628	157	10.4	41.2	NA	0.023	7208	7048	ma100433_rel.cz11apur1_c8r32
499	7197	0	0.0	5.9	0.5	0.000	0.000	0.012	1.110	29275	13.3	4.068	148	11.2	43.3	11.4	0.002	7198	7016	ma100524_rel.cz11apur1_c8r32
499	7177	0	0.0	6.0	0.5	0.000	0.000	0.012	1.123	29141	13.3	4.060	148	10.3	41.2	10.2	0.002	7178	6984	ma100617_rel.cz11apur1_c8r32
499	7095	18	0.1	24.8	1.1	0.003	0.010	0.050	2.191	28952	13.3	4.081	150	10.3	41.2	10.2	0.002	7096	6936	ma101107_rel.cz11apur1_c8r32
499	7149	18	0.1	25.0	1.1	0.003	0.010	0.050	2.182	29161	13.4	4.079	150	10.3	41.1	10.2	0.002	7160	6952	ma110401_rel.cz11bpur1_c8r32
qr1000.L5
qr1000.L5: range queries with 1000 insert/s per client. Graphs for performance per 1-second interval are here.
Average throughput:
Query response time histogram: each cell has the percentage of responses that take <= the time in the header and max is the max response time in seconds. For max values in the top 25% of the range have a red background and in the bottom 25% of the range have a green background. The red background is not used when the min value is within 80% of the max value.
| dbms | 256us | 1ms | 4ms | 16ms | 64ms | 256ms | 1s | 4s | 16s | gt | max |
|---|---|---|---|---|---|---|---|---|---|---|---|
| ma100244_rel.cz11apur1_c8r32 | 99.969 | 0.028 | 0.001 | 0.002 | nonzero | 0.022 | |||||
| ma100339_rel.cz11apur1_c8r32 | 99.956 | 0.040 | 0.001 | 0.003 | nonzero | 0.023 | |||||
| ma100433_rel.cz11apur1_c8r32 | 99.948 | 0.048 | 0.001 | 0.003 | nonzero | 0.020 | |||||
| ma100524_rel.cz11apur1_c8r32 | 99.980 | 0.020 | nonzero | 0.002 | |||||||
| ma100617_rel.cz11apur1_c8r32 | 99.986 | 0.013 | 0.001 | nonzero | 0.014 | ||||||
| ma101107_rel.cz11apur1_c8r32 | 99.983 | 0.017 | 0.001 | nonzero | 0.006 | ||||||
| ma110401_rel.cz11bpur1_c8r32 | 99.985 | 0.015 | nonzero | nonzero | nonzero | 0.020 |
Insert response time histogram: each cell has the percentage of responses that take <= the time in the header and max is the max response time in seconds. For max values in the top 25% of the range have a red background and in the bottom 25% of the range have a green background. The red background is not used when the min value is within 80% of the max value.
| dbms | 256us | 1ms | 4ms | 16ms | 64ms | 256ms | 1s | 4s | 16s | gt | max |
|---|---|---|---|---|---|---|---|---|---|---|---|
| ma100244_rel.cz11apur1_c8r32 | 14.944 | 75.008 | 9.550 | 0.497 | 0.036 | ||||||
| ma100339_rel.cz11apur1_c8r32 | 14.125 | 75.683 | 9.611 | 0.581 | 0.034 | ||||||
| ma100433_rel.cz11apur1_c8r32 | 12.617 | 76.950 | 9.914 | 0.519 | 0.037 | ||||||
| ma100524_rel.cz11apur1_c8r32 | 28.836 | 71.161 | 0.003 | 0.042 | |||||||
| ma100617_rel.cz11apur1_c8r32 | 59.100 | 40.758 | 0.139 | 0.003 | 0.036 | ||||||
| ma101107_rel.cz11apur1_c8r32 | 22.564 | 72.747 | 4.686 | 0.003 | 0.033 | ||||||
| ma110401_rel.cz11bpur1_c8r32 | 37.619 | 57.611 | 4.764 | 0.006 | 0.032 |
Delete response time histogram: each cell has the percentage of responses that take <= the time in the header and max is the max response time in seconds. For max values in the top 25% of the range have a red background and in the bottom 25% of the range have a green background. The red background is not used when the min value is within 80% of the max value.
| dbms | 256us | 1ms | 4ms | 16ms | 64ms | 256ms | 1s | 4s | 16s | gt | max |
|---|---|---|---|---|---|---|---|---|---|---|---|
| ma100244_rel.cz11apur1_c8r32 | 74.506 | 16.344 | 8.872 | 0.278 | 0.036 | ||||||
| ma100339_rel.cz11apur1_c8r32 | 80.750 | 10.128 | 8.836 | 0.286 | 0.058 | ||||||
| ma100433_rel.cz11apur1_c8r32 | 80.386 | 10.381 | 8.936 | 0.297 | 0.039 | ||||||
| ma100524_rel.cz11apur1_c8r32 | 93.703 | 6.294 | 0.003 | 0.043 | |||||||
| ma100617_rel.cz11apur1_c8r32 | 93.031 | 6.867 | 0.100 | 0.003 | 0.036 | ||||||
| ma101107_rel.cz11apur1_c8r32 | 86.514 | 8.814 | 4.669 | 0.003 | 0.032 | ||||||
| ma110401_rel.cz11bpur1_c8r32 | 86.775 | 8.503 | 4.717 | 0.006 | 0.030 |
Performance metrics for the DBMS listed above. Some are normalized by throughput, others are not. Legend for results is here.
ips	qps	rps	rmbps	wps	wmbps	rpq	rkbpq	wpi	wkbpi	csps	cpups	cspq	cpupq	dbgb1	dbgb2	rss	maxop	p50	p99	tag
999	8938	0	0.0	6620.2	184.6	0.000	0.000	6.628	189.221	54495	15.6	6.097	140	10.4	41.2	11.4	0.022	8953	8634	ma100244_rel.cz11apur1_c8r32
999	8618	0	0.0	6654.1	185.5	0.000	0.000	6.662	190.198	53283	15.5	6.183	144	10.5	41.3	11.5	0.023	8634	8311	ma100339_rel.cz11apur1_c8r32
999	8416	0	0.0	6659.5	185.7	0.000	0.000	6.667	190.339	53497	15.4	6.357	146	10.4	41.2	NA	0.020	8439	8087	ma100433_rel.cz11apur1_c8r32
999	8206	0	0.0	10.3	1.1	0.000	0.000	0.010	1.108	31942	13.4	3.893	131	11.2	43.3	11.4	0.002	8199	8119	ma100524_rel.cz11apur1_c8r32
999	8330	0	0.0	148.4	4.7	0.000	0.000	0.149	4.859	33086	13.4	3.972	129	10.3	41.2	10.3	0.014	8327	8202	ma100617_rel.cz11apur1_c8r32
999	8190	37	0.1	123.6	4.1	0.005	0.018	0.124	4.191	32534	13.4	3.973	131	10.3	41.2	10.2	0.006	8199	8087	ma101107_rel.cz11apur1_c8r32
999	8316	37	0.1	126.9	4.1	0.004	0.018	0.127	4.239	33032	13.4	3.972	129	10.3	41.1	10.2	0.020	8311	8215	ma110401_rel.cz11bpur1_c8r32
qp1000.L6
qp1000.L6: point queries with 1000 insert/s per client. Graphs for performance per 1-second interval are here.
Average throughput:
Query response time histogram: each cell has the percentage of responses that take <= the time in the header and max is the max response time in seconds. For max values in the top 25% of the range have a red background and in the bottom 25% of the range have a green background. The red background is not used when the min value is within 80% of the max value.
| dbms | 256us | 1ms | 4ms | 16ms | 64ms | 256ms | 1s | 4s | 16s | gt | max |
|---|---|---|---|---|---|---|---|---|---|---|---|
| ma100244_rel.cz11apur1_c8r32 | 99.944 | 0.056 | nonzero | nonzero | nonzero | 0.017 | |||||
| ma100339_rel.cz11apur1_c8r32 | 99.926 | 0.073 | nonzero | 0.001 | nonzero | 0.019 | |||||
| ma100433_rel.cz11apur1_c8r32 | 99.894 | 0.105 | nonzero | 0.001 | nonzero | 0.020 | |||||
| ma100524_rel.cz11apur1_c8r32 | 99.952 | 0.048 | nonzero | 0.002 | |||||||
| ma100617_rel.cz11apur1_c8r32 | 99.970 | 0.030 | nonzero | 0.002 | |||||||
| ma101107_rel.cz11apur1_c8r32 | 99.960 | 0.039 | nonzero | nonzero | 0.011 | ||||||
| ma110401_rel.cz11bpur1_c8r32 | 99.965 | 0.035 | nonzero | 0.002 |
Insert response time histogram: each cell has the percentage of responses that take <= the time in the header and max is the max response time in seconds. For max values in the top 25% of the range have a red background and in the bottom 25% of the range have a green background. The red background is not used when the min value is within 80% of the max value.
| dbms | 256us | 1ms | 4ms | 16ms | 64ms | 256ms | 1s | 4s | 16s | gt | max |
|---|---|---|---|---|---|---|---|---|---|---|---|
| ma100244_rel.cz11apur1_c8r32 | 13.228 | 76.639 | 9.697 | 0.436 | 0.037 | ||||||
| ma100339_rel.cz11apur1_c8r32 | 12.039 | 77.894 | 9.583 | 0.483 | 0.035 | ||||||
| ma100433_rel.cz11apur1_c8r32 | 9.675 | 79.989 | 9.853 | 0.483 | 0.036 | ||||||
| ma100524_rel.cz11apur1_c8r32 | 17.589 | 82.406 | 0.003 | 0.003 | 0.037 | ||||||
| ma100617_rel.cz11apur1_c8r32 | 39.083 | 60.903 | 0.011 | 0.003 | 0.037 | ||||||
| ma101107_rel.cz11apur1_c8r32 | 8.011 | 87.339 | 4.647 | 0.003 | 0.040 | ||||||
| ma110401_rel.cz11bpur1_c8r32 | 24.122 | 71.206 | 4.667 | 0.006 | 0.031 |
Delete response time histogram: each cell has the percentage of responses that take <= the time in the header and max is the max response time in seconds. For max values in the top 25% of the range have a red background and in the bottom 25% of the range have a green background. The red background is not used when the min value is within 80% of the max value.
| dbms | 256us | 1ms | 4ms | 16ms | 64ms | 256ms | 1s | 4s | 16s | gt | max |
|---|---|---|---|---|---|---|---|---|---|---|---|
| ma100244_rel.cz11apur1_c8r32 | 66.911 | 24.008 | 8.831 | 0.250 | 0.036 | ||||||
| ma100339_rel.cz11apur1_c8r32 | 77.775 | 13.258 | 8.714 | 0.253 | 0.036 | ||||||
| ma100433_rel.cz11apur1_c8r32 | 76.081 | 14.681 | 8.989 | 0.250 | 0.035 | ||||||
| ma100524_rel.cz11apur1_c8r32 | 90.831 | 9.167 | 0.003 | 0.036 | |||||||
| ma100617_rel.cz11apur1_c8r32 | 92.661 | 7.333 | 0.003 | 0.003 | 0.037 | ||||||
| ma101107_rel.cz11apur1_c8r32 | 80.122 | 15.236 | 4.639 | 0.003 | 0.029 | ||||||
| ma110401_rel.cz11bpur1_c8r32 | 85.361 | 9.986 | 4.650 | 0.003 | 0.031 |
Performance metrics for the DBMS listed above. Some are normalized by throughput, others are not. Legend for results is here.
ips	qps	rps	rmbps	wps	wmbps	rpq	rkbpq	wpi	wkbpi	csps	cpups	cspq	cpupq	dbgb1	dbgb2	rss	maxop	p50	p99	tag
999	7611	0	0.0	6623.5	184.6	0.000	0.000	6.631	189.305	50845	15.4	6.680	162	10.4	41.2	11.4	0.017	7623	7496	ma100244_rel.cz11apur1_c8r32
999	7377	0	0.0	6652.8	185.5	0.000	0.000	6.661	190.162	50050	15.3	6.785	166	10.5	41.3	11.5	0.019	7384	7224	ma100339_rel.cz11apur1_c8r32
999	7056	0	0.0	6653.9	185.5	0.000	0.000	6.662	190.182	49584	15.3	7.027	173	10.4	41.2	NA	0.020	7064	6891	ma100433_rel.cz11apur1_c8r32
999	7168	0	0.0	10.3	1.1	0.000	0.000	0.010	1.110	29333	13.4	4.092	150	11.2	43.3	11.4	0.002	7176	6969	ma100524_rel.cz11apur1_c8r32
999	7205	0	0.0	26.3	1.4	0.000	0.000	0.026	1.477	29687	13.4	4.120	149	10.3	41.2	10.3	0.002	7208	7003	ma100617_rel.cz11apur1_c8r32
999	7094	37	0.1	51.7	2.1	0.005	0.021	0.052	2.194	29452	13.4	4.152	151	10.3	41.2	10.2	0.011	7096	6921	ma101107_rel.cz11apur1_c8r32
999	7113	37	0.1	52.0	2.1	0.005	0.021	0.052	2.181	29538	13.4	4.152	151	10.3	41.1	10.2	0.002	7115	6936	ma110401_rel.cz11bpur1_c8r32
l.i0
l.i0: load without secondary indexes
Performance metrics for all DBMS, not just the ones listed above. Some are normalized by throughput, others are not. Legend for results is here.
ips	qps	rps	rmbps	wps	wmbps	rpq	rkbpq	wpi	wkbpi	csps	cpups	cspq	cpupq	dbgb1	dbgb2	rss	maxop	p50	p99	tag
179856	0	0	0.0	919.9	57.7	0.000	0.000	0.005	0.328	19421	21.8	0.108	10	3.3	34.1	4.3	0.132	182200	155329	ma100244_rel.cz11apur1_c8r32
158228	0	0	0.0	1203.5	64.4	0.000	0.000	0.008	0.417	21149	23.2	0.134	12	3.3	34.1	4.2	0.135	159924	134854	ma100339_rel.cz11apur1_c8r32
159744	0	0	0.0	858.2	55.0	0.000	0.000	0.005	0.353	20832	23.8	0.130	12	3.3	34.1	NA	0.126	161875	138448	ma100433_rel.cz11apur1_c8r32
159744	0	0	0.0	1308.3	52.4	0.000	0.000	0.008	0.336	23894	23.2	0.150	12	3.3	34.1	4.0	0.124	161376	139251	ma100524_rel.cz11apur1_c8r32
160772	0	0	0.0	618.3	39.3	0.000	0.000	0.004	0.250	19662	23.7	0.122	12	3.3	34.1	3.7	0.174	161723	139546	ma100617_rel.cz11apur1_c8r32
158228	0	0	0.0	643.2	40.4	0.000	0.000	0.004	0.261	19214	23.3	0.121	12	3.3	34.1	3.7	0.164	160124	138850	ma101107_rel.cz11apur1_c8r32
161812	0	0	0.0	656.8	40.6	0.000	0.000	0.004	0.257	20447	23.8	0.126	12	3.3	34.1	3.8	0.197	162921	139548	ma110401_rel.cz11bpur1_c8r32
l.x
l.x: create secondary indexes
Performance metrics for all DBMS, not just the ones listed above. Some are normalized by throughput, others are not. Legend for results is here.
ips	qps	rps	rmbps	wps	wmbps	rpq	rkbpq	wpi	wkbpi	csps	cpups	cspq	cpupq	dbgb1	dbgb2	rss	maxop	p50	p99	tag
246306	0	0	0.0	2813.3	232.0	0.000	0.000	0.011	0.965	11456	12.6	0.047	4	7.6	38.4	6.9	0.001	NA	NA	ma100244_rel.cz11apur1_c8r32
238096	0	0	0.0	2398.7	214.1	0.000	0.000	0.010	0.921	10738	12.2	0.045	4	7.6	38.4	8.1	0.001	NA	NA	ma100339_rel.cz11apur1_c8r32
238096	0	0	0.0	2663.7	223.2	0.000	0.000	0.011	0.960	10648	12.5	0.045	4	7.5	38.3	NA	0.001	NA	NA	ma100433_rel.cz11apur1_c8r32
204082	0	0	0.0	1335.1	165.6	0.000	0.000	0.007	0.831	439	11.9	0.002	5	7.5	38.3	7.5	0.002	NA	NA	ma100524_rel.cz11apur1_c8r32
204918	0	0	0.0	2412.8	182.5	0.000	0.000	0.012	0.912	5418	12.2	0.026	5	7.5	38.3	7.2	0.001	NA	NA	ma100617_rel.cz11apur1_c8r32
201613	0	0	0.0	2335.6	178.4	0.000	0.000	0.012	0.906	5195	12.1	0.026	5	7.5	38.3	6.9	0.002	NA	NA	ma101107_rel.cz11apur1_c8r32
200000	0	0	0.0	2299.1	176.1	0.000	0.000	0.011	0.901	5108	12.0	0.026	5	7.5	38.3	6.7	0.001	NA	NA	ma110401_rel.cz11bpur1_c8r32
l.i1
l.i1: continue load after secondary indexes created with 50 inserts per transaction
Performance metrics for all DBMS, not just the ones listed above. Some are normalized by throughput, others are not. Legend for results is here.
ips	qps	rps	rmbps	wps	wmbps	rpq	rkbpq	wpi	wkbpi	csps	cpups	cspq	cpupq	dbgb1	dbgb2	rss	maxop	p50	p99	tag
33389	0	0	0.0	11928.2	376.1	0.000	0.000	0.357	11.534	51548	33.8	1.544	81	10.1	41.0	11.1	0.065	33714	12386	ma100244_rel.cz11apur1_c8r32
34100	0	0	0.0	10707.3	344.1	0.000	0.000	0.314	10.332	47604	33.8	1.396	79	10.2	41.0	11.2	0.071	34812	10988	ma100339_rel.cz11apur1_c8r32
34014	0	0	0.0	10205.6	329.8	0.000	0.000	0.300	9.928	46738	33.4	1.374	79	10.2	41.0	NA	0.154	34912	10988	ma100433_rel.cz11apur1_c8r32
40040	0	0	0.0	8838.0	279.5	0.000	0.000	0.221	7.149	56644	35.8	1.415	72	11.0	43.0	11.4	0.394	43054	200	ma100524_rel.cz11apur1_c8r32
35587	0	0	0.0	5491.8	185.7	0.000	0.000	0.154	5.342	92213	30.9	2.591	69	10.1	40.9	10.0	0.282	38222	11387	ma100617_rel.cz11apur1_c8r32
34335	0	878	3.4	5352.3	180.8	0.026	0.102	0.156	5.393	88977	29.9	2.591	70	10.1	40.9	10.0	0.236	36722	11038	ma101107_rel.cz11apur1_c8r32
31620	0	833	3.3	4978.8	166.5	0.026	0.105	0.157	5.392	80700	27.3	2.552	69	10.1	40.9	10.0	0.229	32065	12686	ma110401_rel.cz11bpur1_c8r32
l.i2
l.i2: continue load after secondary indexes created with 5 inserts per transaction
Performance metrics for all DBMS, not just the ones listed above. Some are normalized by throughput, others are not. Legend for results is here.
ips	qps	rps	rmbps	wps	wmbps	rpq	rkbpq	wpi	wkbpi	csps	cpups	cspq	cpupq	dbgb1	dbgb2	rss	maxop	p50	p99	tag
20618	0	0	0.0	13080.7	384.5	0.000	0.000	0.634	19.095	131207	34.5	6.364	134	10.4	41.2	11.4	0.069	20474	17127	ma100244_rel.cz11apur1_c8r32
20704	0	0	0.0	12494.7	369.1	0.000	0.000	0.603	18.256	129252	34.9	6.243	135	10.5	41.3	11.5	0.064	20688	17356	ma100339_rel.cz11apur1_c8r32
20161	0	0	0.0	13104.4	384.6	0.000	0.000	0.650	19.536	130640	34.2	6.480	136	10.4	41.2	NA	0.065	19990	16792	ma100433_rel.cz11apur1_c8r32
23981	0	0	0.0	10912.1	318.7	0.000	0.000	0.455	13.607	155327	38.0	6.477	127	11.2	43.3	11.4	0.053	24077	22751	ma100524_rel.cz11apur1_c8r32
24510	0	0	0.0	2765.7	95.9	0.000	0.000	0.113	4.006	118905	34.6	4.851	113	10.3	41.2	10.2	0.053	24574	23285	ma100617_rel.cz11apur1_c8r32
22573	0	3214	12.6	2628.4	91.2	0.142	0.569	0.116	4.137	114634	33.0	5.078	117	10.3	41.2	10.2	0.059	22546	21367	ma101107_rel.cz11apur1_c8r32
21882	0	3106	12.1	2556.0	87.9	0.142	0.568	0.117	4.113	111089	31.9	5.077	117	10.3	41.1	10.2	0.061	22631	18795	ma110401_rel.cz11bpur1_c8r32
qr100.L1
qr100.L1: range queries with 100 insert/s per client
Performance metrics for all DBMS, not just the ones listed above. Some are normalized by throughput, others are not. Legend for results is here.
ips	qps	rps	rmbps	wps	wmbps	rpq	rkbpq	wpi	wkbpi	csps	cpups	cspq	cpupq	dbgb1	dbgb2	rss	maxop	p50	p99	tag
100	9051	0	0.0	876.0	24.3	0.000	0.000	8.778	248.995	37402	12.9	4.133	114	10.4	41.2	11.4	0.014	9046	8966	ma100244_rel.cz11apur1_c8r32
100	8760	0	0.0	866.8	24.0	0.000	0.000	8.686	246.337	36297	12.7	4.143	116	10.5	41.3	11.5	0.015	8762	8647	ma100339_rel.cz11apur1_c8r32
100	8412	0	0.0	865.5	24.0	0.000	0.000	8.672	245.928	35020	12.7	4.163	121	10.4	41.2	NA	0.022	8409	8343	ma100433_rel.cz11apur1_c8r32
100	8332	0	0.0	2.4	0.1	0.000	0.000	0.024	1.172	32186	12.6	3.863	121	11.2	43.3	11.4	0.001	8343	8215	ma100524_rel.cz11apur1_c8r32
100	8276	0	0.0	2.4	0.1	0.000	0.000	0.024	1.186	31769	12.6	3.838	122	10.3	41.2	10.2	0.001	8279	8231	ma100617_rel.cz11apur1_c8r32
100	8238	4	0.0	2.4	0.1	0.000	0.002	0.024	1.192	31658	12.6	3.843	122	10.3	41.2	10.2	0.001	8247	8183	ma101107_rel.cz11apur1_c8r32
100	8315	3	0.0	2.3	0.1	0.000	0.002	0.024	1.181	31944	12.6	3.842	121	10.3	41.1	10.2	0.001	8313	8231	ma110401_rel.cz11bpur1_c8r32
qp100.L2
qp100.L2: point queries with 100 insert/s per client
Performance metrics for all DBMS, not just the ones listed above. Some are normalized by throughput, others are not. Legend for results is here.
ips	qps	rps	rmbps	wps	wmbps	rpq	rkbpq	wpi	wkbpi	csps	cpups	cspq	cpupq	dbgb1	dbgb2	rss	maxop	p50	p99	tag
100	7792	0	0.0	856.6	23.7	0.000	0.000	8.583	243.435	33974	12.8	4.360	131	10.4	41.2	11.4	0.008	7799	7576	ma100244_rel.cz11apur1_c8r32
100	7496	0	0.0	854.3	23.7	0.000	0.000	8.560	242.752	32749	12.9	4.369	138	10.5	41.3	11.5	0.015	7496	7320	ma100339_rel.cz11apur1_c8r32
100	7209	0	0.0	854.2	23.7	0.000	0.000	8.559	242.720	31707	13.2	4.398	146	10.4	41.2	NA	0.023	7208	7017	ma100433_rel.cz11apur1_c8r32
100	7230	0	0.0	2.4	0.1	0.000	0.000	0.024	1.154	29314	13.0	4.054	144	11.2	43.3	11.4	0.001	7240	7019	ma100524_rel.cz11apur1_c8r32
100	7218	0	0.0	16.5	0.5	0.000	0.000	0.165	5.165	29160	12.9	4.040	143	10.3	41.2	10.2	0.002	7224	7032	ma100617_rel.cz11apur1_c8r32
100	7129	3	0.0	8.6	0.3	0.000	0.002	0.086	2.944	28770	13.1	4.035	147	10.3	41.2	10.2	0.001	7128	7019	ma101107_rel.cz11apur1_c8r32
100	7135	3	0.0	15.1	0.5	0.000	0.002	0.151	4.722	28821	13.1	4.040	147	10.3	41.1	10.2	0.001	7144	6952	ma110401_rel.cz11bpur1_c8r32
qr500.L3
qr500.L3: range queries with 500 insert/s per client
Performance metrics for all DBMS, not just the ones listed above. Some are normalized by throughput, others are not. Legend for results is here.
ips	qps	rps	rmbps	wps	wmbps	rpq	rkbpq	wpi	wkbpi	csps	cpups	cspq	cpupq	dbgb1	dbgb2	rss	maxop	p50	p99	tag
499	8943	0	0.0	3633.7	101.2	0.000	0.000	7.276	207.508	45283	14.3	5.064	128	10.4	41.2	11.4	0.022	8950	8694	ma100244_rel.cz11apur1_c8r32
499	8716	0	0.0	3658.9	101.9	0.000	0.000	7.327	208.945	44360	14.3	5.090	131	10.5	41.3	11.5	0.025	8726	8391	ma100339_rel.cz11apur1_c8r32
499	8420	0	0.0	3657.9	101.9	0.000	0.000	7.325	208.893	43846	14.3	5.207	136	10.4	41.2	NA	0.017	8439	8170	ma100433_rel.cz11apur1_c8r32
499	8175	0	0.0	5.9	0.5	0.000	0.000	0.012	1.108	31671	13.3	3.874	130	11.2	43.3	11.4	0.002	8170	8119	ma100524_rel.cz11apur1_c8r32
499	8246	0	0.0	6.0	0.5	0.000	0.000	0.012	1.122	31850	13.2	3.862	128	10.3	41.2	10.2	0.002	8247	8199	ma100617_rel.cz11apur1_c8r32
499	8296	19	0.1	24.8	1.1	0.002	0.009	0.050	2.203	32167	13.2	3.878	127	10.3	41.2	10.2	0.005	8295	8231	ma101107_rel.cz11apur1_c8r32
499	8356	19	0.1	25.0	1.1	0.002	0.009	0.050	2.191	32396	13.1	3.877	125	10.3	41.1	10.2	0.009	8359	8279	ma110401_rel.cz11bpur1_c8r32
qp500.L4
qp500.L4: point queries with 500 insert/s per client
Performance metrics for all DBMS, not just the ones listed above. Some are normalized by throughput, others are not. Legend for results is here.
ips	qps	rps	rmbps	wps	wmbps	rpq	rkbpq	wpi	wkbpi	csps	cpups	cspq	cpupq	dbgb1	dbgb2	rss	maxop	p50	p99	tag
499	7707	0	0.0	3632.2	101.2	0.000	0.000	7.273	207.420	41999	14.3	5.449	148	10.4	41.2	11.4	0.014	7719	7547	ma100244_rel.cz11apur1_c8r32
499	7349	0	0.0	3651.2	101.7	0.000	0.000	7.311	208.510	40605	14.1	5.525	153	10.5	41.3	11.5	0.019	7352	7192	ma100339_rel.cz11apur1_c8r32
499	7196	0	0.0	3658.3	101.9	0.000	0.000	7.330	209.035	40500	14.1	5.628	157	10.4	41.2	NA	0.023	7208	7048	ma100433_rel.cz11apur1_c8r32
499	7197	0	0.0	5.9	0.5	0.000	0.000	0.012	1.110	29275	13.3	4.068	148	11.2	43.3	11.4	0.002	7198	7016	ma100524_rel.cz11apur1_c8r32
499	7177	0	0.0	6.0	0.5	0.000	0.000	0.012	1.123	29141	13.3	4.060	148	10.3	41.2	10.2	0.002	7178	6984	ma100617_rel.cz11apur1_c8r32
499	7095	18	0.1	24.8	1.1	0.003	0.010	0.050	2.191	28952	13.3	4.081	150	10.3	41.2	10.2	0.002	7096	6936	ma101107_rel.cz11apur1_c8r32
499	7149	18	0.1	25.0	1.1	0.003	0.010	0.050	2.182	29161	13.4	4.079	150	10.3	41.1	10.2	0.002	7160	6952	ma110401_rel.cz11bpur1_c8r32
qr1000.L5
qr1000.L5: range queries with 1000 insert/s per client
Performance metrics for all DBMS, not just the ones listed above. Some are normalized by throughput, others are not. Legend for results is here.
ips	qps	rps	rmbps	wps	wmbps	rpq	rkbpq	wpi	wkbpi	csps	cpups	cspq	cpupq	dbgb1	dbgb2	rss	maxop	p50	p99	tag
999	8938	0	0.0	6620.2	184.6	0.000	0.000	6.628	189.221	54495	15.6	6.097	140	10.4	41.2	11.4	0.022	8953	8634	ma100244_rel.cz11apur1_c8r32
999	8618	0	0.0	6654.1	185.5	0.000	0.000	6.662	190.198	53283	15.5	6.183	144	10.5	41.3	11.5	0.023	8634	8311	ma100339_rel.cz11apur1_c8r32
999	8416	0	0.0	6659.5	185.7	0.000	0.000	6.667	190.339	53497	15.4	6.357	146	10.4	41.2	NA	0.020	8439	8087	ma100433_rel.cz11apur1_c8r32
999	8206	0	0.0	10.3	1.1	0.000	0.000	0.010	1.108	31942	13.4	3.893	131	11.2	43.3	11.4	0.002	8199	8119	ma100524_rel.cz11apur1_c8r32
999	8330	0	0.0	148.4	4.7	0.000	0.000	0.149	4.859	33086	13.4	3.972	129	10.3	41.2	10.3	0.014	8327	8202	ma100617_rel.cz11apur1_c8r32
999	8190	37	0.1	123.6	4.1	0.005	0.018	0.124	4.191	32534	13.4	3.973	131	10.3	41.2	10.2	0.006	8199	8087	ma101107_rel.cz11apur1_c8r32
999	8316	37	0.1	126.9	4.1	0.004	0.018	0.127	4.239	33032	13.4	3.972	129	10.3	41.1	10.2	0.020	8311	8215	ma110401_rel.cz11bpur1_c8r32
qp1000.L6
qp1000.L6: point queries with 1000 insert/s per client
Performance metrics for all DBMS, not just the ones listed above. Some are normalized by throughput, others are not. Legend for results is here.
ips	qps	rps	rmbps	wps	wmbps	rpq	rkbpq	wpi	wkbpi	csps	cpups	cspq	cpupq	dbgb1	dbgb2	rss	maxop	p50	p99	tag
999	7611	0	0.0	6623.5	184.6	0.000	0.000	6.631	189.305	50845	15.4	6.680	162	10.4	41.2	11.4	0.017	7623	7496	ma100244_rel.cz11apur1_c8r32
999	7377	0	0.0	6652.8	185.5	0.000	0.000	6.661	190.162	50050	15.3	6.785	166	10.5	41.3	11.5	0.019	7384	7224	ma100339_rel.cz11apur1_c8r32
999	7056	0	0.0	6653.9	185.5	0.000	0.000	6.662	190.182	49584	15.3	7.027	173	10.4	41.2	NA	0.020	7064	6891	ma100433_rel.cz11apur1_c8r32
999	7168	0	0.0	10.3	1.1	0.000	0.000	0.010	1.110	29333	13.4	4.092	150	11.2	43.3	11.4	0.002	7176	6969	ma100524_rel.cz11apur1_c8r32
999	7205	0	0.0	26.3	1.4	0.000	0.000	0.026	1.477	29687	13.4	4.120	149	10.3	41.2	10.3	0.002	7208	7003	ma100617_rel.cz11apur1_c8r32
999	7094	37	0.1	51.7	2.1	0.005	0.021	0.052	2.194	29452	13.4	4.152	151	10.3	41.2	10.2	0.011	7096	6921	ma101107_rel.cz11apur1_c8r32
999	7113	37	0.1	52.0	2.1	0.005	0.021	0.052	2.181	29538	13.4	4.152	151	10.3	41.1	10.2	0.002	7115	6936	ma110401_rel.cz11bpur1_c8r32
l.i0
- l.i0: load without secondary indexes
- Legend for results is here.
- Each entry lists the percentage of responses that fit in that bucket (slower than max time for previous bucket, faster than min time for next bucket).
Insert response time histogram
256us	1ms	4ms	16ms	64ms	256ms	1s	4s	16s	gt	max	tag
0.000	99.599	0.155	0.232	0.010	0.004	0.000	0.000	0.000	0.000	0.132	ma100244_rel.cz11apur1_c8r32
0.000	99.381	0.253	0.343	0.019	0.004	0.000	0.000	0.000	0.000	0.135	ma100339_rel.cz11apur1_c8r32
0.000	99.537	0.192	0.255	0.012	0.004	0.000	0.000	0.000	0.000	0.126	ma100433_rel.cz11apur1_c8r32
0.000	99.334	0.224	0.379	0.058	0.004	0.000	0.000	0.000	0.000	0.124	ma100524_rel.cz11apur1_c8r32
0.000	99.582	0.169	0.240	0.005	0.004	0.000	0.000	0.000	0.000	0.174	ma100617_rel.cz11apur1_c8r32
0.000	99.585	0.167	0.235	0.008	0.005	0.000	0.000	0.000	0.000	0.164	ma101107_rel.cz11apur1_c8r32
0.000	99.590	0.164	0.223	0.018	0.005	0.000	0.000	0.000	0.000	0.197	ma110401_rel.cz11bpur1_c8r32
l.x
- l.x: create secondary indexes
- Legend for results is here.
- Each entry lists the percentage of responses that fit in that bucket (slower than max time for previous bucket, faster than min time for next bucket).
TODO - determine whether there is data for create index response time
l.i1
- l.i1: continue load after secondary indexes created with 50 inserts per transaction
- Legend for results is here.
- Each entry lists the percentage of responses that fit in that bucket (slower than max time for previous bucket, faster than min time for next bucket).
Insert response time histogram
256us	1ms	4ms	16ms	64ms	256ms	1s	4s	16s	gt	max	tag
0.000	4.255	90.510	5.213	0.021	nonzero	0.000	0.000	0.000	0.000	0.065	ma100244_rel.cz11apur1_c8r32
0.000	4.779	90.446	4.753	0.022	0.001	0.000	0.000	0.000	0.000	0.071	ma100339_rel.cz11apur1_c8r32
0.000	2.102	93.400	4.478	0.019	nonzero	0.000	0.000	0.000	0.000	0.154	ma100433_rel.cz11apur1_c8r32
0.000	14.986	83.860	1.094	0.052	0.002	0.006	0.000	0.000	0.000	0.394	ma100524_rel.cz11apur1_c8r32
0.000	6.969	91.890	1.096	0.044	0.001	nonzero	0.000	0.000	0.000	0.282	ma100617_rel.cz11apur1_c8r32
0.000	2.921	95.920	1.122	0.036	0.001	0.000	0.000	0.000	0.000	0.236	ma101107_rel.cz11apur1_c8r32
0.000	5.355	92.048	2.305	0.289	0.003	0.000	0.000	0.000	0.000	0.229	ma110401_rel.cz11bpur1_c8r32
Delete response time histogram
256us	1ms	4ms	16ms	64ms	256ms	1s	4s	16s	gt	max	tag
0.000	87.584	7.729	4.676	0.010	0.000	0.000	0.000	0.000	0.000	0.064	ma100244_rel.cz11apur1_c8r32
0.000	90.697	5.143	4.149	0.011	0.000	0.000	0.000	0.000	0.000	0.058	ma100339_rel.cz11apur1_c8r32
0.000	90.570	5.508	3.913	0.008	nonzero	0.000	0.000	0.000	0.000	0.068	ma100433_rel.cz11apur1_c8r32
0.000	96.998	2.264	0.711	0.018	0.003	0.006	0.000	0.000	0.000	0.261	ma100524_rel.cz11apur1_c8r32
0.000	59.517	39.655	0.795	0.033	0.001	0.000	0.000	0.000	0.000	0.106	ma100617_rel.cz11apur1_c8r32
0.000	49.686	49.472	0.814	0.026	0.001	0.000	0.000	0.000	0.000	0.234	ma101107_rel.cz11apur1_c8r32
0.000	54.844	42.913	1.995	0.245	0.003	0.000	0.000	0.000	0.000	0.228	ma110401_rel.cz11bpur1_c8r32
l.i2
- l.i2: continue load after secondary indexes created with 5 inserts per transaction
- Legend for results is here.
- Each entry lists the percentage of responses that fit in that bucket (slower than max time for previous bucket, faster than min time for next bucket).
Insert response time histogram
256us	1ms	4ms	16ms	64ms	256ms	1s	4s	16s	gt	max	tag
94.843	4.336	0.115	0.706	0.001	nonzero	0.000	0.000	0.000	0.000	0.069	ma100244_rel.cz11apur1_c8r32
94.515	4.743	0.096	0.645	0.001	0.000	0.000	0.000	0.000	0.000	0.064	ma100339_rel.cz11apur1_c8r32
93.971	5.245	0.100	0.683	0.001	nonzero	0.000	0.000	0.000	0.000	0.065	ma100433_rel.cz11apur1_c8r32
96.585	3.250	0.135	0.028	0.002	0.000	0.000	0.000	0.000	0.000	0.053	ma100524_rel.cz11apur1_c8r32
95.847	4.089	0.050	0.013	0.001	0.000	0.000	0.000	0.000	0.000	0.053	ma100617_rel.cz11apur1_c8r32
88.990	10.935	0.064	0.011	nonzero	0.000	0.000	0.000	0.000	0.000	0.059	ma101107_rel.cz11apur1_c8r32
90.945	8.879	0.057	0.116	0.003	0.000	0.000	0.000	0.000	0.000	0.061	ma110401_rel.cz11bpur1_c8r32
Delete response time histogram
256us	1ms	4ms	16ms	64ms	256ms	1s	4s	16s	gt	max	tag
96.509	2.683	0.108	0.700	0.001	nonzero	0.000	0.000	0.000	0.000	0.069	ma100244_rel.cz11apur1_c8r32
96.526	2.740	0.093	0.640	0.001	0.000	0.000	0.000	0.000	0.000	0.064	ma100339_rel.cz11apur1_c8r32
96.351	2.875	0.096	0.676	0.001	nonzero	0.000	0.000	0.000	0.000	0.065	ma100433_rel.cz11apur1_c8r32
98.915	0.952	0.110	0.022	0.002	0.000	0.000	0.000	0.000	0.000	0.053	ma100524_rel.cz11apur1_c8r32
98.224	1.722	0.042	0.012	0.001	0.000	0.000	0.000	0.000	0.000	0.053	ma100617_rel.cz11apur1_c8r32
95.656	4.276	0.058	0.010	nonzero	0.000	0.000	0.000	0.000	0.000	0.059	ma101107_rel.cz11apur1_c8r32
94.776	5.068	0.051	0.103	0.003	0.000	0.000	0.000	0.000	0.000	0.061	ma110401_rel.cz11bpur1_c8r32
qr100.L1
- qr100.L1: range queries with 100 insert/s per client
- Legend for results is here.
- Each entry lists the percentage of responses that fit in that bucket (slower than max time for previous bucket, faster than min time for next bucket).
Query response time histogram
256us	1ms	4ms	16ms	64ms	256ms	1s	4s	16s	gt	max	tag
99.994	0.005	nonzero	nonzero	0.000	0.000	0.000	0.000	0.000	0.000	0.014	ma100244_rel.cz11apur1_c8r32
99.992	0.007	nonzero	nonzero	0.000	0.000	0.000	0.000	0.000	0.000	0.015	ma100339_rel.cz11apur1_c8r32
99.990	0.010	nonzero	nonzero	nonzero	0.000	0.000	0.000	0.000	0.000	0.022	ma100433_rel.cz11apur1_c8r32
99.996	0.004	nonzero	0.000	0.000	0.000	0.000	0.000	0.000	0.000	0.001	ma100524_rel.cz11apur1_c8r32
99.996	0.004	0.000	0.000	0.000	0.000	0.000	0.000	0.000	0.000	0.001	ma100617_rel.cz11apur1_c8r32
99.995	0.005	0.000	0.000	0.000	0.000	0.000	0.000	0.000	0.000	0.001	ma101107_rel.cz11apur1_c8r32
99.995	0.005	0.000	0.000	0.000	0.000	0.000	0.000	0.000	0.000	0.001	ma110401_rel.cz11bpur1_c8r32
Insert response time histogram
256us	1ms	4ms	16ms	64ms	256ms	1s	4s	16s	gt	max	tag
0.000	0.889	96.028	2.500	0.583	0.000	0.000	0.000	0.000	0.000	0.030	ma100244_rel.cz11apur1_c8r32
0.000	0.528	96.556	2.278	0.639	0.000	0.000	0.000	0.000	0.000	0.036	ma100339_rel.cz11apur1_c8r32
0.000	0.583	96.333	2.528	0.556	0.000	0.000	0.000	0.000	0.000	0.037	ma100433_rel.cz11apur1_c8r32
0.000	5.056	94.944	0.000	0.000	0.000	0.000	0.000	0.000	0.000	0.002	ma100524_rel.cz11apur1_c8r32
0.000	19.667	80.333	0.000	0.000	0.000	0.000	0.000	0.000	0.000	0.002	ma100617_rel.cz11apur1_c8r32
0.000	0.611	52.750	46.639	0.000	0.000	0.000	0.000	0.000	0.000	0.011	ma101107_rel.cz11apur1_c8r32
0.000	1.139	52.306	46.556	0.000	0.000	0.000	0.000	0.000	0.000	0.011	ma110401_rel.cz11bpur1_c8r32
Delete response time histogram
256us	1ms	4ms	16ms	64ms	256ms	1s	4s	16s	gt	max	tag
0.000	39.250	57.972	2.528	0.250	0.000	0.000	0.000	0.000	0.000	0.021	ma100244_rel.cz11apur1_c8r32
0.000	52.167	45.278	2.361	0.194	0.000	0.000	0.000	0.000	0.000	0.022	ma100339_rel.cz11apur1_c8r32
0.000	51.389	46.083	2.222	0.306	0.000	0.000	0.000	0.000	0.000	0.033	ma100433_rel.cz11apur1_c8r32
0.000	63.583	36.417	0.000	0.000	0.000	0.000	0.000	0.000	0.000	0.002	ma100524_rel.cz11apur1_c8r32
0.000	52.722	47.278	0.000	0.000	0.000	0.000	0.000	0.000	0.000	0.002	ma100617_rel.cz11apur1_c8r32
0.000	3.417	49.944	46.639	0.000	0.000	0.000	0.000	0.000	0.000	0.011	ma101107_rel.cz11apur1_c8r32
0.000	3.889	49.556	46.556	0.000	0.000	0.000	0.000	0.000	0.000	0.011	ma110401_rel.cz11bpur1_c8r32
qp100.L2
- qp100.L2: point queries with 100 insert/s per client
- Legend for results is here.
- Each entry lists the percentage of responses that fit in that bucket (slower than max time for previous bucket, faster than min time for next bucket).
Query response time histogram
256us	1ms	4ms	16ms	64ms	256ms	1s	4s	16s	gt	max	tag
99.988	0.012	nonzero	nonzero	0.000	0.000	0.000	0.000	0.000	0.000	0.008	ma100244_rel.cz11apur1_c8r32
99.983	0.017	nonzero	nonzero	0.000	0.000	0.000	0.000	0.000	0.000	0.015	ma100339_rel.cz11apur1_c8r32
99.976	0.024	nonzero	nonzero	nonzero	0.000	0.000	0.000	0.000	0.000	0.023	ma100433_rel.cz11apur1_c8r32
99.989	0.011	nonzero	0.000	0.000	0.000	0.000	0.000	0.000	0.000	0.001	ma100524_rel.cz11apur1_c8r32
99.989	0.011	nonzero	0.000	0.000	0.000	0.000	0.000	0.000	0.000	0.002	ma100617_rel.cz11apur1_c8r32
99.985	0.015	0.000	0.000	0.000	0.000	0.000	0.000	0.000	0.000	0.001	ma101107_rel.cz11apur1_c8r32
99.988	0.012	0.000	0.000	0.000	0.000	0.000	0.000	0.000	0.000	0.001	ma110401_rel.cz11bpur1_c8r32
Insert response time histogram
256us	1ms	4ms	16ms	64ms	256ms	1s	4s	16s	gt	max	tag
0.000	0.000	96.694	2.694	0.611	0.000	0.000	0.000	0.000	0.000	0.032	ma100244_rel.cz11apur1_c8r32
0.000	0.000	96.611	2.833	0.556	0.000	0.000	0.000	0.000	0.000	0.047	ma100339_rel.cz11apur1_c8r32
0.000	0.000	96.667	2.722	0.611	0.000	0.000	0.000	0.000	0.000	0.035	ma100433_rel.cz11apur1_c8r32
0.000	0.028	99.972	0.000	0.000	0.000	0.000	0.000	0.000	0.000	0.002	ma100524_rel.cz11apur1_c8r32
0.000	0.917	99.083	0.000	0.000	0.000	0.000	0.000	0.000	0.000	0.002	ma100617_rel.cz11apur1_c8r32
0.000	0.028	53.333	46.639	0.000	0.000	0.000	0.000	0.000	0.000	0.011	ma101107_rel.cz11apur1_c8r32
0.000	0.167	53.278	46.556	0.000	0.000	0.000	0.000	0.000	0.000	0.015	ma110401_rel.cz11bpur1_c8r32
Delete response time histogram
256us	1ms	4ms	16ms	64ms	256ms	1s	4s	16s	gt	max	tag
0.000	6.389	90.556	2.833	0.222	0.000	0.000	0.000	0.000	0.000	0.025	ma100244_rel.cz11apur1_c8r32
0.000	27.472	69.639	2.667	0.222	0.000	0.000	0.000	0.000	0.000	0.030	ma100339_rel.cz11apur1_c8r32
0.000	23.639	73.639	2.389	0.333	0.000	0.000	0.000	0.000	0.000	0.025	ma100433_rel.cz11apur1_c8r32
0.000	33.111	66.889	0.000	0.000	0.000	0.000	0.000	0.000	0.000	0.002	ma100524_rel.cz11apur1_c8r32
0.000	46.639	53.361	0.000	0.000	0.000	0.000	0.000	0.000	0.000	0.002	ma100617_rel.cz11apur1_c8r32
0.000	2.444	50.917	46.639	0.000	0.000	0.000	0.000	0.000	0.000	0.011	ma101107_rel.cz11apur1_c8r32
0.000	2.806	50.667	46.528	0.000	0.000	0.000	0.000	0.000	0.000	0.011	ma110401_rel.cz11bpur1_c8r32
qr500.L3
- qr500.L3: range queries with 500 insert/s per client
- Legend for results is here.
- Each entry lists the percentage of responses that fit in that bucket (slower than max time for previous bucket, faster than min time for next bucket).
Query response time histogram
256us	1ms	4ms	16ms	64ms	256ms	1s	4s	16s	gt	max	tag
99.985	0.013	nonzero	0.001	nonzero	0.000	0.000	0.000	0.000	0.000	0.022	ma100244_rel.cz11apur1_c8r32
99.979	0.019	nonzero	0.002	nonzero	0.000	0.000	0.000	0.000	0.000	0.025	ma100339_rel.cz11apur1_c8r32
99.976	0.022	nonzero	0.001	nonzero	0.000	0.000	0.000	0.000	0.000	0.017	ma100433_rel.cz11apur1_c8r32
99.989	0.011	nonzero	0.000	0.000	0.000	0.000	0.000	0.000	0.000	0.002	ma100524_rel.cz11apur1_c8r32
99.991	0.009	nonzero	0.000	0.000	0.000	0.000	0.000	0.000	0.000	0.002	ma100617_rel.cz11apur1_c8r32
99.989	0.011	nonzero	nonzero	0.000	0.000	0.000	0.000	0.000	0.000	0.005	ma101107_rel.cz11apur1_c8r32
99.989	0.011	nonzero	nonzero	0.000	0.000	0.000	0.000	0.000	0.000	0.009	ma110401_rel.cz11bpur1_c8r32
Insert response time histogram
256us	1ms	4ms	16ms	64ms	256ms	1s	4s	16s	gt	max	tag
0.000	11.800	80.778	6.822	0.600	0.000	0.000	0.000	0.000	0.000	0.038	ma100244_rel.cz11apur1_c8r32
0.000	7.456	84.572	7.194	0.778	0.000	0.000	0.000	0.000	0.000	0.038	ma100339_rel.cz11apur1_c8r32
0.000	8.800	83.833	6.761	0.606	0.000	0.000	0.000	0.000	0.000	0.043	ma100433_rel.cz11apur1_c8r32
0.000	15.561	84.439	0.000	0.000	0.000	0.000	0.000	0.000	0.000	0.002	ma100524_rel.cz11apur1_c8r32
0.000	51.744	48.256	0.000	0.000	0.000	0.000	0.000	0.000	0.000	0.002	ma100617_rel.cz11apur1_c8r32
0.000	17.539	73.150	9.311	0.000	0.000	0.000	0.000	0.000	0.000	0.011	ma101107_rel.cz11apur1_c8r32
0.000	23.611	67.039	9.350	0.000	0.000	0.000	0.000	0.000	0.000	0.011	ma110401_rel.cz11bpur1_c8r32
Delete response time histogram
256us	1ms	4ms	16ms	64ms	256ms	1s	4s	16s	gt	max	tag
0.000	70.817	22.339	6.467	0.378	0.000	0.000	0.000	0.000	0.000	0.030	ma100244_rel.cz11apur1_c8r32
0.000	79.917	12.778	6.761	0.544	0.000	0.000	0.000	0.000	0.000	0.029	ma100339_rel.cz11apur1_c8r32
0.000	80.278	12.856	6.500	0.367	0.000	0.000	0.000	0.000	0.000	0.044	ma100433_rel.cz11apur1_c8r32
0.000	89.417	10.583	0.000	0.000	0.000	0.000	0.000	0.000	0.000	0.002	ma100524_rel.cz11apur1_c8r32
0.000	88.672	11.328	0.000	0.000	0.000	0.000	0.000	0.000	0.000	0.002	ma100617_rel.cz11apur1_c8r32
0.000	79.056	11.633	9.311	0.000	0.000	0.000	0.000	0.000	0.000	0.011	ma101107_rel.cz11apur1_c8r32
0.000	78.917	11.744	9.339	0.000	0.000	0.000	0.000	0.000	0.000	0.011	ma110401_rel.cz11bpur1_c8r32
qp500.L4
- qp500.L4: point queries with 500 insert/s per client
- Legend for results is here.
- Each entry lists the percentage of responses that fit in that bucket (slower than max time for previous bucket, faster than min time for next bucket).
Query response time histogram
256us	1ms	4ms	16ms	64ms	256ms	1s	4s	16s	gt	max	tag
99.972	0.028	nonzero	nonzero	0.000	0.000	0.000	0.000	0.000	0.000	0.014	ma100244_rel.cz11apur1_c8r32
99.959	0.041	nonzero	nonzero	nonzero	0.000	0.000	0.000	0.000	0.000	0.019	ma100339_rel.cz11apur1_c8r32
99.942	0.057	nonzero	nonzero	nonzero	0.000	0.000	0.000	0.000	0.000	0.023	ma100433_rel.cz11apur1_c8r32
99.972	0.028	nonzero	0.000	0.000	0.000	0.000	0.000	0.000	0.000	0.002	ma100524_rel.cz11apur1_c8r32
99.981	0.018	nonzero	0.000	0.000	0.000	0.000	0.000	0.000	0.000	0.002	ma100617_rel.cz11apur1_c8r32
99.970	0.030	nonzero	0.000	0.000	0.000	0.000	0.000	0.000	0.000	0.002	ma101107_rel.cz11apur1_c8r32
99.975	0.025	nonzero	0.000	0.000	0.000	0.000	0.000	0.000	0.000	0.002	ma110401_rel.cz11bpur1_c8r32
Insert response time histogram
256us	1ms	4ms	16ms	64ms	256ms	1s	4s	16s	gt	max	tag
0.000	8.444	83.911	6.928	0.717	0.000	0.000	0.000	0.000	0.000	0.034	ma100244_rel.cz11apur1_c8r32
0.000	6.578	86.078	6.617	0.728	0.000	0.000	0.000	0.000	0.000	0.035	ma100339_rel.cz11apur1_c8r32
0.000	4.889	87.617	6.756	0.739	0.000	0.000	0.000	0.000	0.000	0.041	ma100433_rel.cz11apur1_c8r32
0.000	9.461	90.539	0.000	0.000	0.000	0.000	0.000	0.000	0.000	0.002	ma100524_rel.cz11apur1_c8r32
0.000	28.500	71.500	0.000	0.000	0.000	0.000	0.000	0.000	0.000	0.002	ma100617_rel.cz11apur1_c8r32
0.000	2.483	88.256	9.261	0.000	0.000	0.000	0.000	0.000	0.000	0.011	ma101107_rel.cz11apur1_c8r32
0.000	13.644	77.033	9.322	0.000	0.000	0.000	0.000	0.000	0.000	0.015	ma110401_rel.cz11bpur1_c8r32
Delete response time histogram
256us	1ms	4ms	16ms	64ms	256ms	1s	4s	16s	gt	max	tag
0.000	55.506	37.367	6.756	0.372	0.000	0.000	0.000	0.000	0.000	0.030	ma100244_rel.cz11apur1_c8r32
0.000	74.222	18.833	6.600	0.344	0.000	0.000	0.000	0.000	0.000	0.038	ma100339_rel.cz11apur1_c8r32
0.000	71.600	21.494	6.561	0.344	0.000	0.000	0.000	0.000	0.000	0.030	ma100433_rel.cz11apur1_c8r32
0.000	83.194	16.806	0.000	0.000	0.000	0.000	0.000	0.000	0.000	0.002	ma100524_rel.cz11apur1_c8r32
0.000	87.611	12.389	0.000	0.000	0.000	0.000	0.000	0.000	0.000	0.002	ma100617_rel.cz11apur1_c8r32
0.000	70.511	20.228	9.261	0.000	0.000	0.000	0.000	0.000	0.000	0.011	ma101107_rel.cz11apur1_c8r32
0.000	76.539	14.139	9.322	0.000	0.000	0.000	0.000	0.000	0.000	0.011	ma110401_rel.cz11bpur1_c8r32
qr1000.L5
- qr1000.L5: range queries with 1000 insert/s per client
- Legend for results is here.
- Each entry lists the percentage of responses that fit in that bucket (slower than max time for previous bucket, faster than min time for next bucket).
Query response time histogram
256us	1ms	4ms	16ms	64ms	256ms	1s	4s	16s	gt	max	tag
99.969	0.028	0.001	0.002	nonzero	0.000	0.000	0.000	0.000	0.000	0.022	ma100244_rel.cz11apur1_c8r32
99.956	0.040	0.001	0.003	nonzero	0.000	0.000	0.000	0.000	0.000	0.023	ma100339_rel.cz11apur1_c8r32
99.948	0.048	0.001	0.003	nonzero	0.000	0.000	0.000	0.000	0.000	0.020	ma100433_rel.cz11apur1_c8r32
99.980	0.020	nonzero	0.000	0.000	0.000	0.000	0.000	0.000	0.000	0.002	ma100524_rel.cz11apur1_c8r32
99.986	0.013	0.001	nonzero	0.000	0.000	0.000	0.000	0.000	0.000	0.014	ma100617_rel.cz11apur1_c8r32
99.983	0.017	0.001	nonzero	0.000	0.000	0.000	0.000	0.000	0.000	0.006	ma101107_rel.cz11apur1_c8r32
99.985	0.015	nonzero	nonzero	nonzero	0.000	0.000	0.000	0.000	0.000	0.020	ma110401_rel.cz11bpur1_c8r32
Insert response time histogram
256us	1ms	4ms	16ms	64ms	256ms	1s	4s	16s	gt	max	tag
0.000	14.944	75.008	9.550	0.497	0.000	0.000	0.000	0.000	0.000	0.036	ma100244_rel.cz11apur1_c8r32
0.000	14.125	75.683	9.611	0.581	0.000	0.000	0.000	0.000	0.000	0.034	ma100339_rel.cz11apur1_c8r32
0.000	12.617	76.950	9.914	0.519	0.000	0.000	0.000	0.000	0.000	0.037	ma100433_rel.cz11apur1_c8r32
0.000	28.836	71.161	0.000	0.003	0.000	0.000	0.000	0.000	0.000	0.042	ma100524_rel.cz11apur1_c8r32
0.000	59.100	40.758	0.139	0.003	0.000	0.000	0.000	0.000	0.000	0.036	ma100617_rel.cz11apur1_c8r32
0.000	22.564	72.747	4.686	0.003	0.000	0.000	0.000	0.000	0.000	0.033	ma101107_rel.cz11apur1_c8r32
0.000	37.619	57.611	4.764	0.006	0.000	0.000	0.000	0.000	0.000	0.032	ma110401_rel.cz11bpur1_c8r32
Delete response time histogram
256us	1ms	4ms	16ms	64ms	256ms	1s	4s	16s	gt	max	tag
0.000	74.506	16.344	8.872	0.278	0.000	0.000	0.000	0.000	0.000	0.036	ma100244_rel.cz11apur1_c8r32
0.000	80.750	10.128	8.836	0.286	0.000	0.000	0.000	0.000	0.000	0.058	ma100339_rel.cz11apur1_c8r32
0.000	80.386	10.381	8.936	0.297	0.000	0.000	0.000	0.000	0.000	0.039	ma100433_rel.cz11apur1_c8r32
0.000	93.703	6.294	0.000	0.003	0.000	0.000	0.000	0.000	0.000	0.043	ma100524_rel.cz11apur1_c8r32
0.000	93.031	6.867	0.100	0.003	0.000	0.000	0.000	0.000	0.000	0.036	ma100617_rel.cz11apur1_c8r32
0.000	86.514	8.814	4.669	0.003	0.000	0.000	0.000	0.000	0.000	0.032	ma101107_rel.cz11apur1_c8r32
0.000	86.775	8.503	4.717	0.006	0.000	0.000	0.000	0.000	0.000	0.030	ma110401_rel.cz11bpur1_c8r32
qp1000.L6
- qp1000.L6: point queries with 1000 insert/s per client
- Legend for results is here.
- Each entry lists the percentage of responses that fit in that bucket (slower than max time for previous bucket, faster than min time for next bucket).
Query response time histogram
256us	1ms	4ms	16ms	64ms	256ms	1s	4s	16s	gt	max	tag
99.944	0.056	nonzero	nonzero	nonzero	0.000	0.000	0.000	0.000	0.000	0.017	ma100244_rel.cz11apur1_c8r32
99.926	0.073	nonzero	0.001	nonzero	0.000	0.000	0.000	0.000	0.000	0.019	ma100339_rel.cz11apur1_c8r32
99.894	0.105	nonzero	0.001	nonzero	0.000	0.000	0.000	0.000	0.000	0.020	ma100433_rel.cz11apur1_c8r32
99.952	0.048	nonzero	0.000	0.000	0.000	0.000	0.000	0.000	0.000	0.002	ma100524_rel.cz11apur1_c8r32
99.970	0.030	nonzero	0.000	0.000	0.000	0.000	0.000	0.000	0.000	0.002	ma100617_rel.cz11apur1_c8r32
99.960	0.039	nonzero	nonzero	0.000	0.000	0.000	0.000	0.000	0.000	0.011	ma101107_rel.cz11apur1_c8r32
99.965	0.035	nonzero	0.000	0.000	0.000	0.000	0.000	0.000	0.000	0.002	ma110401_rel.cz11bpur1_c8r32
Insert response time histogram
256us	1ms	4ms	16ms	64ms	256ms	1s	4s	16s	gt	max	tag
0.000	13.228	76.639	9.697	0.436	0.000	0.000	0.000	0.000	0.000	0.037	ma100244_rel.cz11apur1_c8r32
0.000	12.039	77.894	9.583	0.483	0.000	0.000	0.000	0.000	0.000	0.035	ma100339_rel.cz11apur1_c8r32
0.000	9.675	79.989	9.853	0.483	0.000	0.000	0.000	0.000	0.000	0.036	ma100433_rel.cz11apur1_c8r32
0.000	17.589	82.406	0.003	0.003	0.000	0.000	0.000	0.000	0.000	0.037	ma100524_rel.cz11apur1_c8r32
0.000	39.083	60.903	0.011	0.003	0.000	0.000	0.000	0.000	0.000	0.037	ma100617_rel.cz11apur1_c8r32
0.000	8.011	87.339	4.647	0.003	0.000	0.000	0.000	0.000	0.000	0.040	ma101107_rel.cz11apur1_c8r32
0.000	24.122	71.206	4.667	0.006	0.000	0.000	0.000	0.000	0.000	0.031	ma110401_rel.cz11bpur1_c8r32
Delete response time histogram
256us	1ms	4ms	16ms	64ms	256ms	1s	4s	16s	gt	max	tag
0.000	66.911	24.008	8.831	0.250	0.000	0.000	0.000	0.000	0.000	0.036	ma100244_rel.cz11apur1_c8r32
0.000	77.775	13.258	8.714	0.253	0.000	0.000	0.000	0.000	0.000	0.036	ma100339_rel.cz11apur1_c8r32
0.000	76.081	14.681	8.989	0.250	0.000	0.000	0.000	0.000	0.000	0.035	ma100433_rel.cz11apur1_c8r32
0.000	90.831	9.167	0.000	0.003	0.000	0.000	0.000	0.000	0.000	0.036	ma100524_rel.cz11apur1_c8r32
0.000	92.661	7.333	0.003	0.003	0.000	0.000	0.000	0.000	0.000	0.037	ma100617_rel.cz11apur1_c8r32
0.000	80.122	15.236	4.639	0.003	0.000	0.000	0.000	0.000	0.000	0.029	ma101107_rel.cz11apur1_c8r32
0.000	85.361	9.986	4.650	0.003	0.000	0.000	0.000	0.000	0.000	0.031	ma110401_rel.cz11bpur1_c8r32