Introduction
This is a report for the insert benchmark with 32M docs and 4 client(s). It is generated by scripts (bash, awk, sed) and Tufte might not be impressed. An overview of the insert benchmark is here and a short update is here. Below, by DBMS, I mean DBMS+version.config. An example is my8020.c10b40 where my means MySQL, 8020 is version 8.0.20 and c10b40 is the name for the configuration file.
The test server has 8 AMD cores, 16G RAM and an NVMe SSD. It is described here as the Beelink. The benchmark was run with 1 client and there were 1 or 3 connections per client (1 for queries or inserts without rate limits, 1+1 for rate limited inserts+deletes). It uses 4 tables with a table per client. It loads 8M rows per table without secondary indexes, creates 3 secondary indexes per table, then inserts 40m+10m rows per table with a delete per insert to avoid growing the table. It then does 6 read+write tests for 1800s each that do queries as fast as possible with 100,100,500,500,1000,1000 inserts/s and the same for deletes/s per client concurrent with the queries. The database is cached in memory. Clients and the DBMS share one server. The per-database configs are in the per-database subdirectories here.
The tested DBMS are:
- my5651_rel.cz11a_bee - MySQL 5.6.51 with the cz11a_bee config
- my5744_rel.cz11a_bee - MySQL 5.7.44 with the cz11a_bee config
- my8036_rel.cz11a_bee - MySQL 8.0.36 with the cz11a_bee config
- my8036_rel.cz11b_bee - MySQL 8.0.36 with the cz11b_bee config that uses innodb_flush_method=O_DIRECT
- my8036_rel.cz11c_bee - MySQL 8.0.36 with the cz11c_bee config that uses innodb_flush_method=fsync
- my8036_rel.cz11d_bee - MySQL 8.0.36 with the cz11d_bee config that uses innodb_change_buffering=none
Contents
- Summary
- l.i0: load without secondary indexes
- l.x: create secondary indexes
- l.i1: continue load after secondary indexes created with 50 inserts per transaction
- l.i2: continue load after secondary indexes created with 5 inserts per transaction
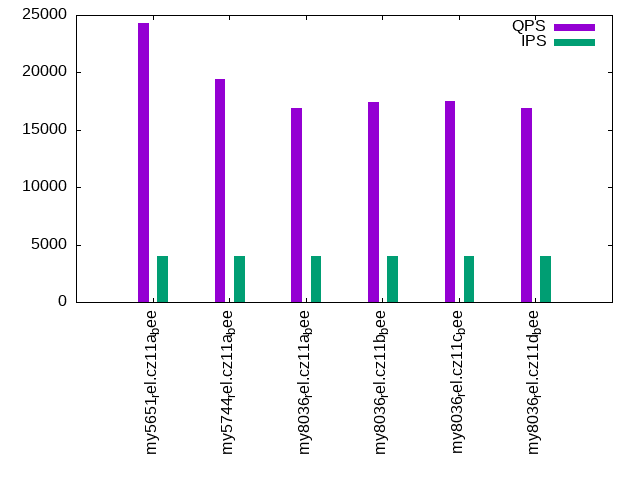
- qr100.L1: range queries with 100 insert/s per client
- qp100.L2: point queries with 100 insert/s per client
- qr500.L3: range queries with 500 insert/s per client
- qp500.L4: point queries with 500 insert/s per client
- qr1000.L5: range queries with 1000 insert/s per client
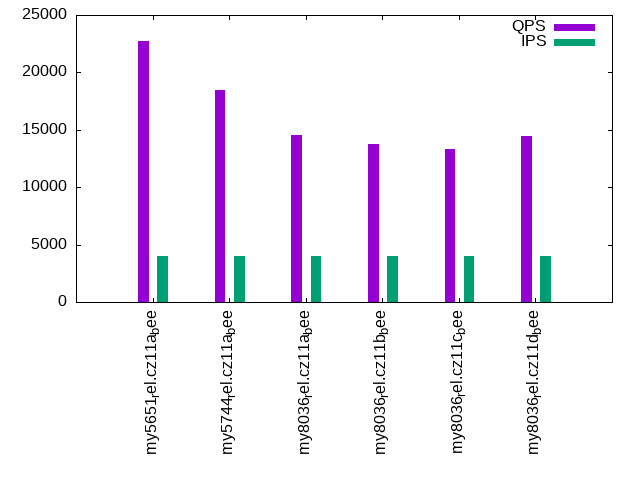
- qp1000.L6: point queries with 1000 insert/s per client
Summary
The numbers are inserts/s for l.i0, l.i1 and l.i2, indexed docs (or rows) /s for l.x and queries/s for qr100, qp100 thru qr1000, qp1000" The values are the average rate over the entire test for inserts (IPS) and queries (QPS). The range of values for IPS and QPS is split into 3 parts: bottom 25%, middle 50%, top 25%. Values in the bottom 25% have a red background, values in the top 25% have a green background and values in the middle have no color. A gray background is used for values that can be ignored because the DBMS did not sustain the target insert rate. Red backgrounds are not used when the minimum value is within 80% of the max value.
| dbms | l.i0 | l.x | l.i1 | l.i2 | qr100 | qp100 | qr500 | qp500 | qr1000 | qp1000 |
|---|---|---|---|---|---|---|---|---|---|---|
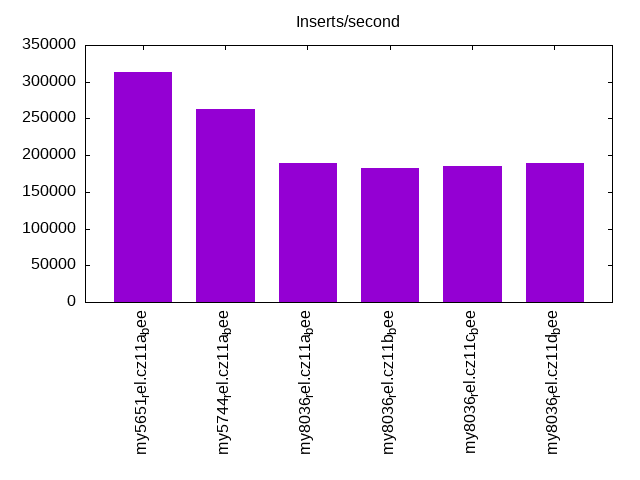
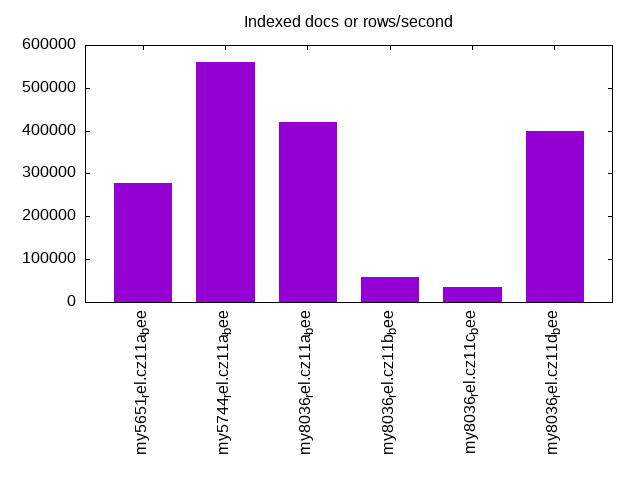
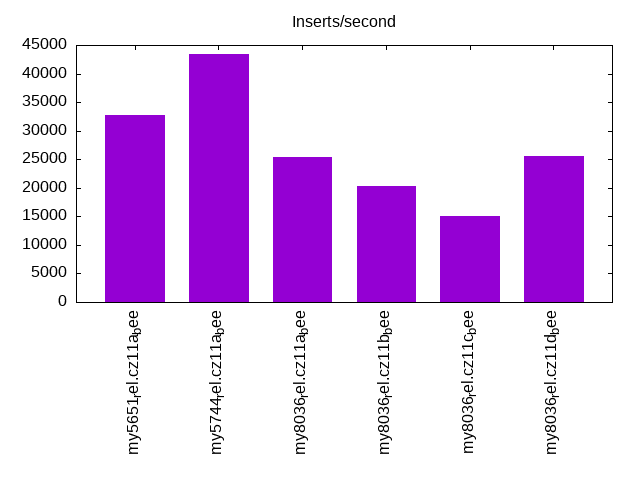
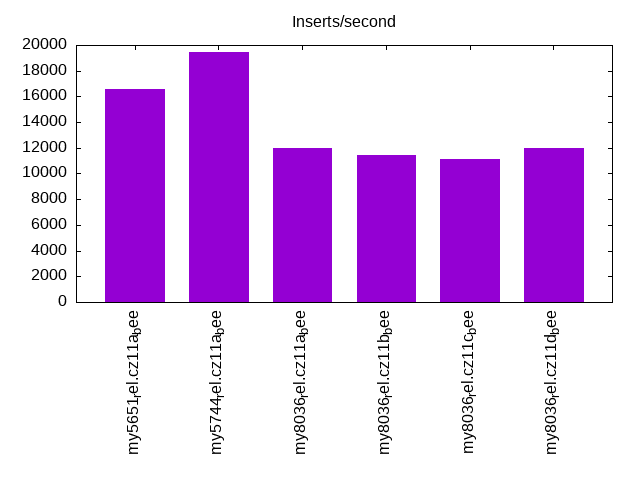
| my5651_rel.cz11a_bee | 313725 | 278262 | 32720 | 16577 | 25385 | 23759 | 25032 | 22473 | 24346 | 22694 |
| my5744_rel.cz11a_bee | 262295 | 561405 | 43396 | 19455 | 20161 | 19410 | 20016 | 19275 | 19462 | 18429 |
| my8036_rel.cz11a_bee | 189349 | 421054 | 25429 | 12001 | 17519 | 15251 | 17092 | 15105 | 16872 | 14562 |
| my8036_rel.cz11b_bee | 182857 | 58608 | 20377 | 11419 | 17494 | 15441 | 17524 | 14684 | 17422 | 13780 |
| my8036_rel.cz11c_bee | 184971 | 34115 | 14981 | 11096 | 18224 | 15200 | 17884 | 14462 | 17538 | 13360 |
| my8036_rel.cz11d_bee | 189349 | 400001 | 25584 | 12023 | 17496 | 15584 | 17152 | 15134 | 16875 | 14476 |
This table has relative throughput, throughput for the DBMS relative to the DBMS in the first line, using the absolute throughput from the previous table. Values less than 0.95 have a yellow background. Values greater than 1.05 have a blue background.
| dbms | l.i0 | l.x | l.i1 | l.i2 | qr100 | qp100 | qr500 | qp500 | qr1000 | qp1000 |
|---|---|---|---|---|---|---|---|---|---|---|
| my5651_rel.cz11a_bee | 1.00 | 1.00 | 1.00 | 1.00 | 1.00 | 1.00 | 1.00 | 1.00 | 1.00 | 1.00 |
| my5744_rel.cz11a_bee | 0.84 | 2.02 | 1.33 | 1.17 | 0.79 | 0.82 | 0.80 | 0.86 | 0.80 | 0.81 |
| my8036_rel.cz11a_bee | 0.60 | 1.51 | 0.78 | 0.72 | 0.69 | 0.64 | 0.68 | 0.67 | 0.69 | 0.64 |
| my8036_rel.cz11b_bee | 0.58 | 0.21 | 0.62 | 0.69 | 0.69 | 0.65 | 0.70 | 0.65 | 0.72 | 0.61 |
| my8036_rel.cz11c_bee | 0.59 | 0.12 | 0.46 | 0.67 | 0.72 | 0.64 | 0.71 | 0.64 | 0.72 | 0.59 |
| my8036_rel.cz11d_bee | 0.60 | 1.44 | 0.78 | 0.73 | 0.69 | 0.66 | 0.69 | 0.67 | 0.69 | 0.64 |
This lists the average rate of inserts/s for the tests that do inserts concurrent with queries. For such tests the query rate is listed in the table above. The read+write tests are setup so that the insert rate should match the target rate every second. Cells that are not at least 95% of the target have a red background to indicate a failure to satisfy the target.
| dbms | qr100.L1 | qp100.L2 | qr500.L3 | qp500.L4 | qr1000.L5 | qp1000.L6 |
|---|---|---|---|---|---|---|
| my5651_rel.cz11a_bee | 399 | 399 | 1993 | 1994 | 3989 | 3987 |
| my5744_rel.cz11a_bee | 399 | 399 | 1994 | 1994 | 3989 | 3989 |
| my8036_rel.cz11a_bee | 399 | 399 | 1993 | 1993 | 3989 | 3989 |
| my8036_rel.cz11b_bee | 399 | 399 | 1994 | 1994 | 3987 | 3989 |
| my8036_rel.cz11c_bee | 399 | 399 | 1994 | 1994 | 3989 | 3989 |
| my8036_rel.cz11d_bee | 399 | 399 | 1994 | 1994 | 3989 | 3989 |
| target | 400 | 400 | 2000 | 2000 | 4000 | 4000 |
l.i0
l.i0: load without secondary indexes. Graphs for performance per 1-second interval are here.
Average throughput:
Insert response time histogram: each cell has the percentage of responses that take <= the time in the header and max is the max response time in seconds. For the max column values in the top 25% of the range have a red background and in the bottom 25% of the range have a green background. The red background is not used when the min value is within 80% of the max value.
| dbms | 256us | 1ms | 4ms | 16ms | 64ms | 256ms | 1s | 4s | 16s | gt | max |
|---|---|---|---|---|---|---|---|---|---|---|---|
| my5651_rel.cz11a_bee | 60.494 | 39.257 | 0.135 | 0.107 | 0.006 | 0.169 | |||||
| my5744_rel.cz11a_bee | 0.289 | 99.199 | 0.391 | 0.115 | 0.006 | 0.173 | |||||
| my8036_rel.cz11a_bee | 99.246 | 0.613 | 0.130 | 0.012 | 0.151 | ||||||
| my8036_rel.cz11b_bee | 98.876 | 0.985 | 0.105 | 0.034 | 0.165 | ||||||
| my8036_rel.cz11c_bee | 98.977 | 0.861 | 0.146 | 0.017 | 0.175 | ||||||
| my8036_rel.cz11d_bee | 99.229 | 0.645 | 0.115 | 0.011 | 0.157 |
Performance metrics for the DBMS listed above. Some are normalized by throughput, others are not. Legend for results is here.
ips	qps	rps	rmbps	wps	wmbps	rpq	rkbpq	wpi	wkbpi	csps	cpups	cspq	cpupq	dbgb1	dbgb2	rss	maxop	p50	p99	tag
313725	0	99	0.4	820.5	91.1	0.000	0.001	0.003	0.297	31203	75.3	0.099	19	2.1	17.6	2.6	0.169	92030	75217	my5651_rel.cz11a_bee
262295	0	0	0.0	720.9	76.3	0.000	0.000	0.003	0.298	27796	69.7	0.106	21	2.1	17.7	3.0	0.173	74919	51843	my5744_rel.cz11a_bee
189349	0	0	0.0	783.5	62.1	0.000	0.000	0.004	0.336	22535	70.7	0.119	30	2.1	17.7	3.0	0.151	51344	41255	my8036_rel.cz11a_bee
182857	0	0	0.0	913.5	59.1	0.000	0.000	0.005	0.331	21225	69.8	0.116	31	2.1	17.7	3.0	0.165	50447	36061	my8036_rel.cz11b_bee
184971	0	0	0.0	586.7	56.1	0.000	0.000	0.003	0.311	20793	69.9	0.112	30	2.1	17.7	3.0	0.175	50745	34563	my8036_rel.cz11c_bee
189349	0	0	0.0	785.0	62.2	0.000	0.000	0.004	0.336	22374	71.0	0.118	30	2.1	17.7	3.0	0.157	51644	43652	my8036_rel.cz11d_bee
l.x
l.x: create secondary indexes.
Average throughput:
Performance metrics for the DBMS listed above. Some are normalized by throughput, others are not. Legend for results is here.
ips	qps	rps	rmbps	wps	wmbps	rpq	rkbpq	wpi	wkbpi	csps	cpups	cspq	cpupq	dbgb1	dbgb2	rss	maxop	p50	p99	tag
278262	0	0	0.0	2438.3	260.0	0.000	0.000	0.009	0.957	6583	39.1	0.024	11	4.5	20.0	4.5	0.002	NA	NA	my5651_rel.cz11a_bee
561405	0	0	0.0	6160.0	483.3	0.000	0.000	0.011	0.882	31387	45.2	0.056	6	4.9	20.4	3.2	0.002	NA	NA	my5744_rel.cz11a_bee
421054	0	2186	136.2	8559.0	427.2	0.005	0.331	0.020	1.039	25790	89.3	0.061	17	4.9	20.4	3.9	0.004	NA	NA	my8036_rel.cz11a_bee
58608	0	301	18.8	1604.5	61.8	0.005	0.328	0.027	1.080	13149	20.6	0.224	28	4.9	20.4	5.7	0.009	NA	NA	my8036_rel.cz11b_bee
34115	0	175	10.9	1091.6	36.7	0.005	0.328	0.032	1.103	12002	15.2	0.352	36	4.9	20.4	5.7	0.006	NA	NA	my8036_rel.cz11c_bee
400001	0	2055	127.9	8285.8	405.1	0.005	0.327	0.021	1.037	24713	89.4	0.062	18	4.9	20.4	3.4	0.007	NA	NA	my8036_rel.cz11d_bee
l.i1
l.i1: continue load after secondary indexes created with 50 inserts per transaction. Graphs for performance per 1-second interval are here.
Average throughput:
Insert response time histogram: each cell has the percentage of responses that take <= the time in the header and max is the max response time in seconds. For the max column values in the top 25% of the range have a red background and in the bottom 25% of the range have a green background. The red background is not used when the min value is within 80% of the max value.
| dbms | 256us | 1ms | 4ms | 16ms | 64ms | 256ms | 1s | 4s | 16s | gt | max |
|---|---|---|---|---|---|---|---|---|---|---|---|
| my5651_rel.cz11a_bee | 39.432 | 57.402 | 3.158 | 0.009 | 0.131 | ||||||
| my5744_rel.cz11a_bee | 59.486 | 39.700 | 0.807 | 0.008 | 0.155 | ||||||
| my8036_rel.cz11a_bee | 55.537 | 40.393 | 0.927 | 3.142 | 0.255 | ||||||
| my8036_rel.cz11b_bee | 57.684 | 37.090 | 1.973 | 3.094 | 0.095 | 0.061 | 0.001 | 0.001 | 30.175 | ||
| my8036_rel.cz11c_bee | 61.403 | 32.586 | 2.305 | 2.984 | 0.594 | 0.128 | 0.001 | 52.888 | |||
| my8036_rel.cz11d_bee | 55.878 | 40.169 | 0.821 | 3.132 | 0.227 |
Delete response time histogram: each cell has the percentage of responses that take <= the time in the header and max is the max response time in seconds. For the max column values in the top 25% of the range have a red background and in the bottom 25% of the range have a green background. The red background is not used when the min value is within 80% of the max value.
| dbms | 256us | 1ms | 4ms | 16ms | 64ms | 256ms | 1s | 4s | 16s | gt | max |
|---|---|---|---|---|---|---|---|---|---|---|---|
| my5651_rel.cz11a_bee | 55.950 | 41.811 | 2.232 | 0.007 | 0.141 | ||||||
| my5744_rel.cz11a_bee | 63.085 | 36.320 | 0.588 | 0.007 | 0.155 | ||||||
| my8036_rel.cz11a_bee | 63.931 | 32.348 | 0.726 | 2.995 | 0.216 | ||||||
| my8036_rel.cz11b_bee | 67.395 | 28.024 | 1.552 | 2.885 | 0.086 | 0.056 | 0.001 | 0.001 | 30.167 | ||
| my8036_rel.cz11c_bee | 70.947 | 23.831 | 1.825 | 2.740 | 0.542 | 0.114 | nonzero | 0.001 | 52.887 | ||
| my8036_rel.cz11d_bee | 64.394 | 31.988 | 0.642 | 2.976 | 0.214 |
Performance metrics for the DBMS listed above. Some are normalized by throughput, others are not. Legend for results is here.
ips	qps	rps	rmbps	wps	wmbps	rpq	rkbpq	wpi	wkbpi	csps	cpups	cspq	cpupq	dbgb1	dbgb2	rss	maxop	p50	p99	tag
32720	0	876	3.4	2814.6	120.1	0.027	0.107	0.086	3.758	29971	68.3	0.916	167	7.2	22.7	8.1	0.131	8191	6643	my5651_rel.cz11a_bee
43396	0	0	0.0	3674.4	155.7	0.000	0.000	0.085	3.674	24605	83.9	0.567	155	7.6	23.1	8.8	0.155	10888	9090	my5744_rel.cz11a_bee
25429	0	25	0.4	3283.1	120.2	0.001	0.015	0.129	4.840	21116	54.5	0.830	171	6.4	22.0	7.5	0.255	6341	3645	my8036_rel.cz11a_bee
20377	0	20	0.3	1119.5	50.7	0.001	0.015	0.055	2.546	16852	45.9	0.827	180	6.4	22.0	7.6	30.175	5596	0	my8036_rel.cz11b_bee
14981	0	3	0.1	880.9	36.8	0.000	0.009	0.059	2.517	17657	37.1	1.179	198	6.4	22.0	6.8	52.888	3496	0	my8036_rel.cz11c_bee
25584	0	25	0.4	3301.0	121.0	0.001	0.015	0.129	4.842	21217	54.5	0.829	170	6.4	22.0	7.6	0.227	6343	3499	my8036_rel.cz11d_bee
l.i2
l.i2: continue load after secondary indexes created with 5 inserts per transaction. Graphs for performance per 1-second interval are here.
Average throughput:
Insert response time histogram: each cell has the percentage of responses that take <= the time in the header and max is the max response time in seconds. For the max column values in the top 25% of the range have a red background and in the bottom 25% of the range have a green background. The red background is not used when the min value is within 80% of the max value.
| dbms | 256us | 1ms | 4ms | 16ms | 64ms | 256ms | 1s | 4s | 16s | gt | max |
|---|---|---|---|---|---|---|---|---|---|---|---|
| my5651_rel.cz11a_bee | 0.070 | 67.806 | 29.847 | 2.148 | 0.129 | 0.001 | 0.124 | ||||
| my5744_rel.cz11a_bee | 0.001 | 74.357 | 24.157 | 1.475 | 0.009 | 0.001 | 0.086 | ||||
| my8036_rel.cz11a_bee | 64.766 | 33.169 | 1.550 | 0.016 | 0.498 | 0.133 | |||||
| my8036_rel.cz11b_bee | 62.915 | 34.569 | 1.898 | 0.138 | 0.479 | 0.169 | |||||
| my8036_rel.cz11c_bee | 67.131 | 30.299 | 1.694 | 0.398 | 0.477 | nonzero | 0.001 | nonzero | nonzero | 21.851 | |
| my8036_rel.cz11d_bee | 64.799 | 33.156 | 1.530 | 0.016 | 0.500 | 0.130 |
Delete response time histogram: each cell has the percentage of responses that take <= the time in the header and max is the max response time in seconds. For the max column values in the top 25% of the range have a red background and in the bottom 25% of the range have a green background. The red background is not used when the min value is within 80% of the max value.
| dbms | 256us | 1ms | 4ms | 16ms | 64ms | 256ms | 1s | 4s | 16s | gt | max |
|---|---|---|---|---|---|---|---|---|---|---|---|
| my5651_rel.cz11a_bee | 0.127 | 67.421 | 30.164 | 2.159 | 0.129 | 0.001 | 0.124 | ||||
| my5744_rel.cz11a_bee | 0.002 | 74.267 | 24.230 | 1.491 | 0.009 | 0.001 | 0.085 | ||||
| my8036_rel.cz11a_bee | 65.220 | 32.713 | 1.555 | 0.015 | 0.498 | 0.132 | |||||
| my8036_rel.cz11b_bee | 63.406 | 34.079 | 1.901 | 0.136 | 0.478 | 0.174 | |||||
| my8036_rel.cz11c_bee | 67.628 | 29.809 | 1.694 | 0.395 | 0.474 | nonzero | 0.001 | nonzero | nonzero | 21.850 | |
| my8036_rel.cz11d_bee | 65.279 | 32.671 | 1.536 | 0.016 | 0.499 | 0.138 |
Performance metrics for the DBMS listed above. Some are normalized by throughput, others are not. Legend for results is here.
ips	qps	rps	rmbps	wps	wmbps	rpq	rkbpq	wpi	wkbpi	csps	cpups	cspq	cpupq	dbgb1	dbgb2	rss	maxop	p50	p99	tag
16577	0	2761	10.8	1762.9	71.8	0.167	0.666	0.106	4.433	63889	73.8	3.854	356	7.2	22.7	8.1	0.124	4145	3566	my5651_rel.cz11a_bee
19455	0	0	0.0	2033.7	83.8	0.000	0.000	0.105	4.413	62521	77.1	3.214	317	7.6	23.1	8.8	0.086	4854	4345	my5744_rel.cz11a_bee
12001	0	0	0.0	1835.3	63.6	0.000	0.000	0.153	5.429	45020	55.4	3.751	369	6.4	22.0	7.6	0.133	3001	1869	my8036_rel.cz11a_bee
11419	0	0	0.0	769.6	30.4	0.000	0.000	0.067	2.724	40710	53.3	3.565	373	6.4	22.0	7.6	0.169	2852	1798	my8036_rel.cz11b_bee
11096	0	0	0.0	656.6	27.1	0.000	0.000	0.059	2.501	42667	55.3	3.845	399	6.4	22.0	6.8	21.851	2782	644	my8036_rel.cz11c_bee
12023	0	0	0.0	1776.6	62.2	0.000	0.000	0.148	5.297	44918	55.4	3.736	369	6.4	22.0	7.6	0.130	2986	1837	my8036_rel.cz11d_bee
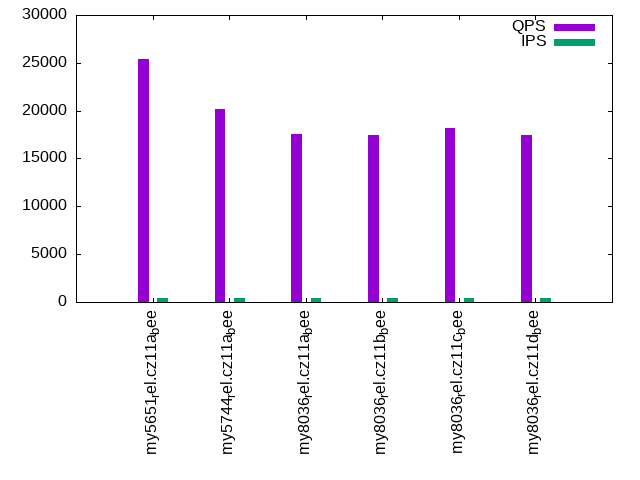
qr100.L1
qr100.L1: range queries with 100 insert/s per client. Graphs for performance per 1-second interval are here.
Average throughput:
Query response time histogram: each cell has the percentage of responses that take <= the time in the header and max is the max response time in seconds. For max values in the top 25% of the range have a red background and in the bottom 25% of the range have a green background. The red background is not used when the min value is within 80% of the max value.
| dbms | 256us | 1ms | 4ms | 16ms | 64ms | 256ms | 1s | 4s | 16s | gt | max |
|---|---|---|---|---|---|---|---|---|---|---|---|
| my5651_rel.cz11a_bee | 98.368 | 1.596 | 0.026 | 0.010 | nonzero | 0.021 | |||||
| my5744_rel.cz11a_bee | 89.758 | 10.232 | 0.009 | 0.001 | 0.012 | ||||||
| my8036_rel.cz11a_bee | 78.884 | 21.108 | 0.006 | 0.001 | 0.012 | ||||||
| my8036_rel.cz11b_bee | 78.578 | 21.413 | 0.007 | 0.002 | nonzero | 0.045 | |||||
| my8036_rel.cz11c_bee | 83.595 | 16.395 | 0.007 | 0.003 | nonzero | nonzero | 0.145 | ||||
| my8036_rel.cz11d_bee | 78.578 | 21.414 | 0.007 | 0.001 | 0.013 |
Insert response time histogram: each cell has the percentage of responses that take <= the time in the header and max is the max response time in seconds. For max values in the top 25% of the range have a red background and in the bottom 25% of the range have a green background. The red background is not used when the min value is within 80% of the max value.
| dbms | 256us | 1ms | 4ms | 16ms | 64ms | 256ms | 1s | 4s | 16s | gt | max |
|---|---|---|---|---|---|---|---|---|---|---|---|
| my5651_rel.cz11a_bee | 84.229 | 15.542 | 0.229 | 0.037 | |||||||
| my5744_rel.cz11a_bee | 98.403 | 1.562 | 0.035 | 0.020 | |||||||
| my8036_rel.cz11a_bee | 96.826 | 3.160 | 0.014 | 0.026 | |||||||
| my8036_rel.cz11b_bee | 94.625 | 5.083 | 0.215 | 0.076 | 0.102 | ||||||
| my8036_rel.cz11c_bee | 93.875 | 5.431 | 0.479 | 0.215 | 0.204 | ||||||
| my8036_rel.cz11d_bee | 92.882 | 7.062 | 0.007 | 0.049 | 0.104 |
Delete response time histogram: each cell has the percentage of responses that take <= the time in the header and max is the max response time in seconds. For max values in the top 25% of the range have a red background and in the bottom 25% of the range have a green background. The red background is not used when the min value is within 80% of the max value.
| dbms | 256us | 1ms | 4ms | 16ms | 64ms | 256ms | 1s | 4s | 16s | gt | max |
|---|---|---|---|---|---|---|---|---|---|---|---|
| my5651_rel.cz11a_bee | 85.611 | 14.215 | 0.174 | 0.032 | |||||||
| my5744_rel.cz11a_bee | 98.604 | 1.389 | 0.007 | 0.017 | |||||||
| my8036_rel.cz11a_bee | 96.993 | 2.993 | 0.014 | 0.037 | |||||||
| my8036_rel.cz11b_bee | 95.312 | 4.472 | 0.125 | 0.090 | 0.104 | ||||||
| my8036_rel.cz11c_bee | 95.062 | 4.326 | 0.431 | 0.181 | 0.164 | ||||||
| my8036_rel.cz11d_bee | 94.625 | 5.333 | 0.007 | 0.035 | 0.103 |
Performance metrics for the DBMS listed above. Some are normalized by throughput, others are not. Legend for results is here.
ips	qps	rps	rmbps	wps	wmbps	rpq	rkbpq	wpi	wkbpi	csps	cpups	cspq	cpupq	dbgb1	dbgb2	rss	maxop	p50	p99	tag
399	25385	14	0.1	348.8	10.9	0.001	0.002	0.875	27.937	97440	50.4	3.839	159	7.2	22.7	8.1	0.021	6361	5786	my5651_rel.cz11a_bee
399	20161	0	0.0	467.7	14.4	0.000	0.000	1.173	36.977	78143	51.4	3.876	204	7.6	23.1	8.8	0.012	5034	4332	my5744_rel.cz11a_bee
399	17519	0	0.0	528.2	13.6	0.000	0.000	1.324	34.977	68313	51.1	3.899	233	6.4	22.0	7.6	0.012	4331	3612	my8036_rel.cz11a_bee
399	17494	0	0.0	212.0	4.1	0.000	0.000	0.532	10.529	67566	51.4	3.862	235	6.4	22.0	7.6	0.045	4459	3534	my8036_rel.cz11b_bee
399	18224	0	0.0	247.4	4.2	0.000	0.000	0.620	10.860	69987	52.4	3.840	230	6.4	22.0	6.9	0.145	4613	3676	my8036_rel.cz11c_bee
399	17496	0	0.0	485.1	12.5	0.000	0.000	1.216	32.214	68145	51.2	3.895	234	6.4	22.0	7.6	0.013	4267	3548	my8036_rel.cz11d_bee
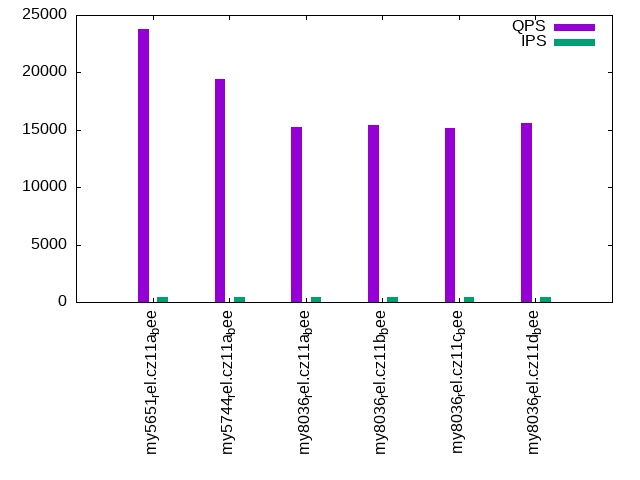
qp100.L2
qp100.L2: point queries with 100 insert/s per client. Graphs for performance per 1-second interval are here.
Average throughput:
Query response time histogram: each cell has the percentage of responses that take <= the time in the header and max is the max response time in seconds. For max values in the top 25% of the range have a red background and in the bottom 25% of the range have a green background. The red background is not used when the min value is within 80% of the max value.
| dbms | 256us | 1ms | 4ms | 16ms | 64ms | 256ms | 1s | 4s | 16s | gt | max |
|---|---|---|---|---|---|---|---|---|---|---|---|
| my5651_rel.cz11a_bee | 98.739 | 1.192 | 0.058 | 0.012 | 0.012 | ||||||
| my5744_rel.cz11a_bee | 95.942 | 4.015 | 0.038 | 0.005 | 0.012 | ||||||
| my8036_rel.cz11a_bee | 80.253 | 19.730 | 0.014 | 0.003 | 0.010 | ||||||
| my8036_rel.cz11b_bee | 84.283 | 15.695 | 0.017 | 0.004 | 0.012 | ||||||
| my8036_rel.cz11c_bee | 78.259 | 21.720 | 0.016 | 0.005 | 0.015 | ||||||
| my8036_rel.cz11d_bee | 85.570 | 14.413 | 0.014 | 0.003 | 0.012 |
Insert response time histogram: each cell has the percentage of responses that take <= the time in the header and max is the max response time in seconds. For max values in the top 25% of the range have a red background and in the bottom 25% of the range have a green background. The red background is not used when the min value is within 80% of the max value.
| dbms | 256us | 1ms | 4ms | 16ms | 64ms | 256ms | 1s | 4s | 16s | gt | max |
|---|---|---|---|---|---|---|---|---|---|---|---|
| my5651_rel.cz11a_bee | 86.701 | 13.174 | 0.125 | 0.023 | |||||||
| my5744_rel.cz11a_bee | 98.944 | 1.049 | 0.007 | 0.016 | |||||||
| my8036_rel.cz11a_bee | 96.236 | 3.681 | 0.021 | 0.062 | 0.106 | ||||||
| my8036_rel.cz11b_bee | 96.667 | 3.271 | 0.062 | 0.042 | |||||||
| my8036_rel.cz11c_bee | 95.493 | 4.174 | 0.264 | 0.069 | 0.123 | ||||||
| my8036_rel.cz11d_bee | 96.493 | 3.479 | 0.021 | 0.007 | 0.102 |
Delete response time histogram: each cell has the percentage of responses that take <= the time in the header and max is the max response time in seconds. For max values in the top 25% of the range have a red background and in the bottom 25% of the range have a green background. The red background is not used when the min value is within 80% of the max value.
| dbms | 256us | 1ms | 4ms | 16ms | 64ms | 256ms | 1s | 4s | 16s | gt | max |
|---|---|---|---|---|---|---|---|---|---|---|---|
| my5651_rel.cz11a_bee | 87.660 | 12.299 | 0.042 | 0.022 | |||||||
| my5744_rel.cz11a_bee | 99.021 | 0.965 | 0.014 | 0.020 | |||||||
| my8036_rel.cz11a_bee | 96.500 | 3.438 | 0.014 | 0.049 | 0.103 | ||||||
| my8036_rel.cz11b_bee | 96.389 | 3.542 | 0.069 | 0.048 | |||||||
| my8036_rel.cz11c_bee | 95.701 | 4.069 | 0.174 | 0.056 | 0.102 | ||||||
| my8036_rel.cz11d_bee | 96.458 | 3.528 | 0.007 | 0.007 | 0.102 |
Performance metrics for the DBMS listed above. Some are normalized by throughput, others are not. Legend for results is here.
ips	qps	rps	rmbps	wps	wmbps	rpq	rkbpq	wpi	wkbpi	csps	cpups	cspq	cpupq	dbgb1	dbgb2	rss	maxop	p50	p99	tag
399	23759	14	0.1	2.2	0.4	0.001	0.002	0.005	1.087	93639	49.4	3.941	166	7.2	22.7	8.1	0.012	6089	4813	my5651_rel.cz11a_bee
399	19410	0	0.0	39.4	1.4	0.000	0.000	0.099	3.661	76196	50.3	3.926	207	7.6	23.1	8.8	0.012	4891	4123	my5744_rel.cz11a_bee
399	15251	0	0.0	67.4	2.1	0.000	0.000	0.169	5.481	59346	50.3	3.891	264	6.4	22.1	7.6	0.010	3901	3356	my8036_rel.cz11a_bee
399	15441	0	0.0	150.2	3.3	0.000	0.000	0.377	8.443	61754	51.0	3.999	264	6.4	22.1	7.6	0.012	3900	3436	my8036_rel.cz11b_bee
399	15200	0	0.0	180.3	3.4	0.000	0.000	0.452	8.757	60092	51.8	3.953	273	6.4	22.1	6.9	0.015	3852	3372	my8036_rel.cz11c_bee
399	15584	0	0.0	71.9	2.2	0.000	0.000	0.180	5.760	61752	50.4	3.962	259	6.4	22.1	7.6	0.012	3944	3420	my8036_rel.cz11d_bee
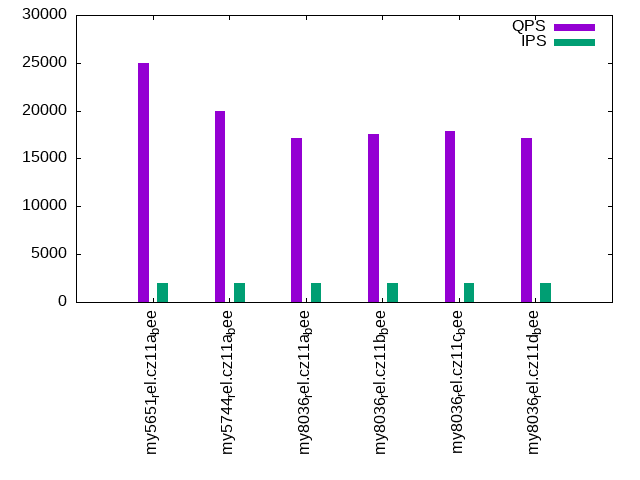
qr500.L3
qr500.L3: range queries with 500 insert/s per client. Graphs for performance per 1-second interval are here.
Average throughput:
Query response time histogram: each cell has the percentage of responses that take <= the time in the header and max is the max response time in seconds. For max values in the top 25% of the range have a red background and in the bottom 25% of the range have a green background. The red background is not used when the min value is within 80% of the max value.
| dbms | 256us | 1ms | 4ms | 16ms | 64ms | 256ms | 1s | 4s | 16s | gt | max |
|---|---|---|---|---|---|---|---|---|---|---|---|
| my5651_rel.cz11a_bee | 98.236 | 1.660 | 0.089 | 0.014 | nonzero | 0.037 | |||||
| my5744_rel.cz11a_bee | 90.342 | 9.631 | 0.020 | 0.007 | nonzero | 0.026 | |||||
| my8036_rel.cz11a_bee | 77.985 | 21.983 | 0.021 | 0.011 | nonzero | 0.030 | |||||
| my8036_rel.cz11b_bee | 81.320 | 18.629 | 0.035 | 0.016 | 0.001 | nonzero | 0.093 | ||||
| my8036_rel.cz11c_bee | 85.556 | 14.390 | 0.034 | 0.019 | 0.001 | nonzero | 0.102 | ||||
| my8036_rel.cz11d_bee | 78.135 | 21.833 | 0.022 | 0.010 | nonzero | 0.041 |
Insert response time histogram: each cell has the percentage of responses that take <= the time in the header and max is the max response time in seconds. For max values in the top 25% of the range have a red background and in the bottom 25% of the range have a green background. The red background is not used when the min value is within 80% of the max value.
| dbms | 256us | 1ms | 4ms | 16ms | 64ms | 256ms | 1s | 4s | 16s | gt | max |
|---|---|---|---|---|---|---|---|---|---|---|---|
| my5651_rel.cz11a_bee | 67.400 | 31.524 | 1.076 | 0.059 | |||||||
| my5744_rel.cz11a_bee | 94.901 | 4.810 | 0.289 | 0.064 | |||||||
| my8036_rel.cz11a_bee | 86.285 | 12.310 | 1.051 | 0.354 | 0.131 | ||||||
| my8036_rel.cz11b_bee | 87.268 | 11.322 | 1.161 | 0.249 | 0.124 | ||||||
| my8036_rel.cz11c_bee | 81.035 | 15.851 | 2.506 | 0.608 | 0.166 | ||||||
| my8036_rel.cz11d_bee | 85.592 | 13.061 | 1.075 | 0.272 | 0.129 |
Delete response time histogram: each cell has the percentage of responses that take <= the time in the header and max is the max response time in seconds. For max values in the top 25% of the range have a red background and in the bottom 25% of the range have a green background. The red background is not used when the min value is within 80% of the max value.
| dbms | 256us | 1ms | 4ms | 16ms | 64ms | 256ms | 1s | 4s | 16s | gt | max |
|---|---|---|---|---|---|---|---|---|---|---|---|
| my5651_rel.cz11a_bee | 76.469 | 22.818 | 0.713 | 0.049 | |||||||
| my5744_rel.cz11a_bee | 96.256 | 3.547 | 0.197 | 0.062 | |||||||
| my8036_rel.cz11a_bee | 89.608 | 9.412 | 0.667 | 0.312 | 0.124 | ||||||
| my8036_rel.cz11b_bee | 90.022 | 8.812 | 0.935 | 0.231 | 0.117 | ||||||
| my8036_rel.cz11c_bee | 85.599 | 12.028 | 1.835 | 0.539 | 0.184 | ||||||
| my8036_rel.cz11d_bee | 89.040 | 10.035 | 0.676 | 0.249 | 0.126 |
Performance metrics for the DBMS listed above. Some are normalized by throughput, others are not. Legend for results is here.
ips	qps	rps	rmbps	wps	wmbps	rpq	rkbpq	wpi	wkbpi	csps	cpups	cspq	cpupq	dbgb1	dbgb2	rss	maxop	p50	p99	tag
1993	25032	62	0.2	697.1	22.9	0.002	0.010	0.350	11.775	95269	52.9	3.806	169	7.2	22.7	8.1	0.037	6249	5626	my5651_rel.cz11a_bee
1994	20016	0	0.0	282.3	10.4	0.000	0.000	0.142	5.328	75169	53.6	3.755	214	7.6	23.1	8.8	0.026	4957	4285	my5744_rel.cz11a_bee
1993	17092	0	0.0	421.4	13.0	0.000	0.000	0.211	6.662	65399	53.4	3.826	250	6.4	22.1	7.6	0.030	4315	3550	my8036_rel.cz11a_bee
1994	17524	0	0.0	508.0	12.0	0.000	0.000	0.255	6.146	67449	55.5	3.849	253	6.4	22.1	7.6	0.093	4475	3628	my8036_rel.cz11b_bee
1994	17884	0	0.0	585.3	12.0	0.000	0.000	0.293	6.155	69173	57.9	3.868	259	6.4	22.1	6.9	0.102	4573	3662	my8036_rel.cz11c_bee
1994	17152	0	0.0	414.4	12.8	0.000	0.000	0.208	6.549	65770	53.5	3.835	250	6.4	22.1	7.6	0.041	4331	3580	my8036_rel.cz11d_bee
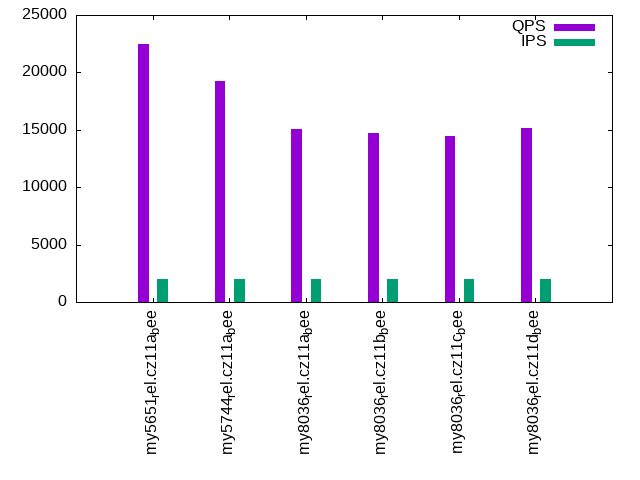
qp500.L4
qp500.L4: point queries with 500 insert/s per client. Graphs for performance per 1-second interval are here.
Average throughput:
Query response time histogram: each cell has the percentage of responses that take <= the time in the header and max is the max response time in seconds. For max values in the top 25% of the range have a red background and in the bottom 25% of the range have a green background. The red background is not used when the min value is within 80% of the max value.
| dbms | 256us | 1ms | 4ms | 16ms | 64ms | 256ms | 1s | 4s | 16s | gt | max |
|---|---|---|---|---|---|---|---|---|---|---|---|
| my5651_rel.cz11a_bee | 97.465 | 2.282 | 0.235 | 0.019 | nonzero | 0.017 | |||||
| my5744_rel.cz11a_bee | 94.989 | 4.900 | 0.094 | 0.017 | nonzero | 0.027 | |||||
| my8036_rel.cz11a_bee | 80.278 | 19.676 | 0.034 | 0.012 | nonzero | 0.028 | |||||
| my8036_rel.cz11b_bee | 73.325 | 26.608 | 0.047 | 0.020 | nonzero | 0.042 | |||||
| my8036_rel.cz11c_bee | 66.119 | 33.808 | 0.050 | 0.023 | 0.001 | 0.054 | |||||
| my8036_rel.cz11d_bee | 79.685 | 20.266 | 0.035 | 0.013 | 0.001 | 0.029 |
Insert response time histogram: each cell has the percentage of responses that take <= the time in the header and max is the max response time in seconds. For max values in the top 25% of the range have a red background and in the bottom 25% of the range have a green background. The red background is not used when the min value is within 80% of the max value.
| dbms | 256us | 1ms | 4ms | 16ms | 64ms | 256ms | 1s | 4s | 16s | gt | max |
|---|---|---|---|---|---|---|---|---|---|---|---|
| my5651_rel.cz11a_bee | 76.542 | 23.081 | 0.378 | 0.049 | |||||||
| my5744_rel.cz11a_bee | 98.069 | 1.889 | 0.042 | 0.048 | |||||||
| my8036_rel.cz11a_bee | 91.044 | 8.249 | 0.532 | 0.175 | 0.123 | ||||||
| my8036_rel.cz11b_bee | 88.122 | 10.312 | 1.296 | 0.269 | 0.125 | ||||||
| my8036_rel.cz11c_bee | 78.003 | 18.632 | 2.690 | 0.675 | 0.163 | ||||||
| my8036_rel.cz11d_bee | 90.943 | 8.138 | 0.633 | 0.286 | 0.125 |
Delete response time histogram: each cell has the percentage of responses that take <= the time in the header and max is the max response time in seconds. For max values in the top 25% of the range have a red background and in the bottom 25% of the range have a green background. The red background is not used when the min value is within 80% of the max value.
| dbms | 256us | 1ms | 4ms | 16ms | 64ms | 256ms | 1s | 4s | 16s | gt | max |
|---|---|---|---|---|---|---|---|---|---|---|---|
| my5651_rel.cz11a_bee | 83.628 | 16.118 | 0.254 | 0.047 | |||||||
| my5744_rel.cz11a_bee | 98.776 | 1.201 | 0.022 | 0.048 | |||||||
| my8036_rel.cz11a_bee | 92.862 | 6.606 | 0.374 | 0.158 | 0.121 | ||||||
| my8036_rel.cz11b_bee | 90.943 | 7.918 | 0.907 | 0.232 | 0.156 | ||||||
| my8036_rel.cz11c_bee | 83.147 | 14.258 | 2.019 | 0.575 | 0.158 | ||||||
| my8036_rel.cz11d_bee | 93.299 | 6.078 | 0.378 | 0.246 | 0.125 |
Performance metrics for the DBMS listed above. Some are normalized by throughput, others are not. Legend for results is here.
ips	qps	rps	rmbps	wps	wmbps	rpq	rkbpq	wpi	wkbpi	csps	cpups	cspq	cpupq	dbgb1	dbgb2	rss	maxop	p50	p99	tag
1994	22473	63	0.2	540.2	18.2	0.003	0.011	0.271	9.344	89973	51.1	4.004	182	7.2	22.7	8.1	0.017	5674	4699	my5651_rel.cz11a_bee
1994	19275	0	0.0	262.0	9.8	0.000	0.000	0.131	5.015	76572	52.2	3.973	217	7.6	23.1	8.8	0.027	4891	4046	my5744_rel.cz11a_bee
1993	15105	0	0.0	408.4	12.7	0.000	0.000	0.205	6.507	60736	53.1	4.021	281	6.4	22.1	7.6	0.028	3819	3374	my8036_rel.cz11a_bee
1994	14684	0	0.0	542.8	12.6	0.000	0.000	0.272	6.487	59490	55.3	4.051	301	6.4	22.1	7.6	0.042	3700	3276	my8036_rel.cz11b_bee
1994	14462	0	0.0	620.0	12.6	0.000	0.000	0.311	6.457	59914	58.2	4.143	322	6.4	22.1	6.9	0.054	3628	3117	my8036_rel.cz11c_bee
1994	15134	0	0.0	400.6	12.5	0.000	0.000	0.201	6.408	60329	53.0	3.986	280	6.4	22.1	7.6	0.029	3836	3358	my8036_rel.cz11d_bee
qr1000.L5
qr1000.L5: range queries with 1000 insert/s per client. Graphs for performance per 1-second interval are here.
Average throughput:
Query response time histogram: each cell has the percentage of responses that take <= the time in the header and max is the max response time in seconds. For max values in the top 25% of the range have a red background and in the bottom 25% of the range have a green background. The red background is not used when the min value is within 80% of the max value.
| dbms | 256us | 1ms | 4ms | 16ms | 64ms | 256ms | 1s | 4s | 16s | gt | max |
|---|---|---|---|---|---|---|---|---|---|---|---|
| my5651_rel.cz11a_bee | 97.842 | 1.957 | 0.173 | 0.027 | 0.001 | 0.058 | |||||
| my5744_rel.cz11a_bee | 90.014 | 9.905 | 0.062 | 0.019 | 0.001 | 0.046 | |||||
| my8036_rel.cz11a_bee | 79.093 | 20.800 | 0.074 | 0.031 | 0.003 | 0.048 | |||||
| my8036_rel.cz11b_bee | 85.119 | 14.727 | 0.102 | 0.048 | 0.003 | nonzero | 0.083 | ||||
| my8036_rel.cz11c_bee | 87.959 | 11.910 | 0.086 | 0.041 | 0.004 | nonzero | 0.117 | ||||
| my8036_rel.cz11d_bee | 79.016 | 20.879 | 0.074 | 0.029 | 0.002 | 0.052 |
Insert response time histogram: each cell has the percentage of responses that take <= the time in the header and max is the max response time in seconds. For max values in the top 25% of the range have a red background and in the bottom 25% of the range have a green background. The red background is not used when the min value is within 80% of the max value.
| dbms | 256us | 1ms | 4ms | 16ms | 64ms | 256ms | 1s | 4s | 16s | gt | max |
|---|---|---|---|---|---|---|---|---|---|---|---|
| my5651_rel.cz11a_bee | 44.122 | 52.656 | 3.222 | 0.059 | |||||||
| my5744_rel.cz11a_bee | 73.409 | 24.966 | 1.624 | 0.001 | 0.067 | ||||||
| my8036_rel.cz11a_bee | 64.655 | 30.896 | 3.487 | 0.963 | 0.148 | ||||||
| my8036_rel.cz11b_bee | 62.992 | 30.940 | 5.075 | 0.993 | 0.189 | ||||||
| my8036_rel.cz11c_bee | 63.365 | 30.023 | 5.299 | 1.313 | 0.241 | ||||||
| my8036_rel.cz11d_bee | 68.292 | 27.570 | 3.252 | 0.886 | 0.152 |
Delete response time histogram: each cell has the percentage of responses that take <= the time in the header and max is the max response time in seconds. For max values in the top 25% of the range have a red background and in the bottom 25% of the range have a green background. The red background is not used when the min value is within 80% of the max value.
| dbms | 256us | 1ms | 4ms | 16ms | 64ms | 256ms | 1s | 4s | 16s | gt | max |
|---|---|---|---|---|---|---|---|---|---|---|---|
| my5651_rel.cz11a_bee | 0.001 | 53.565 | 44.135 | 2.300 | 0.057 | ||||||
| my5744_rel.cz11a_bee | 78.606 | 19.983 | 1.411 | 0.053 | |||||||
| my8036_rel.cz11a_bee | 71.585 | 24.879 | 2.667 | 0.869 | 0.138 | ||||||
| my8036_rel.cz11b_bee | 70.851 | 24.447 | 3.823 | 0.879 | 0.194 | ||||||
| my8036_rel.cz11c_bee | 71.294 | 23.676 | 3.908 | 1.122 | 0.210 | ||||||
| my8036_rel.cz11d_bee | 75.481 | 21.357 | 2.397 | 0.765 | 0.137 |
Performance metrics for the DBMS listed above. Some are normalized by throughput, others are not. Legend for results is here.
ips	qps	rps	rmbps	wps	wmbps	rpq	rkbpq	wpi	wkbpi	csps	cpups	cspq	cpupq	dbgb1	dbgb2	rss	maxop	p50	p99	tag
3989	24346	114	0.4	750.2	26.5	0.005	0.019	0.188	6.790	91301	55.4	3.750	182	7.2	22.7	8.1	0.058	6025	5418	my5651_rel.cz11a_bee
3989	19462	0	0.0	541.4	20.2	0.000	0.000	0.136	5.180	71655	56.5	3.682	232	7.6	23.1	8.8	0.046	4893	4141	my5744_rel.cz11a_bee
3989	16872	0	0.0	796.8	24.9	0.000	0.000	0.200	6.384	64385	56.4	3.816	267	6.4	22.1	7.6	0.048	4299	3564	my8036_rel.cz11a_bee
3987	17422	0	0.0	1111.1	25.2	0.000	0.000	0.279	6.462	67731	60.7	3.888	279	6.4	22.1	7.6	0.083	4413	3644	my8036_rel.cz11b_bee
3989	17538	0	0.0	1013.5	21.3	0.000	0.000	0.254	5.458	68662	63.6	3.915	290	6.4	22.1	6.9	0.117	4427	3772	my8036_rel.cz11c_bee
3989	16875	0	0.0	799.7	24.9	0.000	0.000	0.200	6.403	64621	56.4	3.829	267	6.4	22.1	7.6	0.052	4251	3518	my8036_rel.cz11d_bee
qp1000.L6
qp1000.L6: point queries with 1000 insert/s per client. Graphs for performance per 1-second interval are here.
Average throughput:
Query response time histogram: each cell has the percentage of responses that take <= the time in the header and max is the max response time in seconds. For max values in the top 25% of the range have a red background and in the bottom 25% of the range have a green background. The red background is not used when the min value is within 80% of the max value.
| dbms | 256us | 1ms | 4ms | 16ms | 64ms | 256ms | 1s | 4s | 16s | gt | max |
|---|---|---|---|---|---|---|---|---|---|---|---|
| my5651_rel.cz11a_bee | 96.994 | 2.622 | 0.354 | 0.030 | nonzero | 0.028 | |||||
| my5744_rel.cz11a_bee | 92.653 | 7.086 | 0.218 | 0.042 | 0.001 | 0.037 | |||||
| my8036_rel.cz11a_bee | 75.304 | 24.560 | 0.103 | 0.032 | 0.002 | 0.052 | |||||
| my8036_rel.cz11b_bee | 61.063 | 38.736 | 0.144 | 0.056 | 0.002 | 0.051 | |||||
| my8036_rel.cz11c_bee | 48.259 | 51.552 | 0.137 | 0.050 | 0.002 | nonzero | 0.143 | ||||
| my8036_rel.cz11d_bee | 73.825 | 26.003 | 0.127 | 0.041 | 0.004 | 0.047 |
Insert response time histogram: each cell has the percentage of responses that take <= the time in the header and max is the max response time in seconds. For max values in the top 25% of the range have a red background and in the bottom 25% of the range have a green background. The red background is not used when the min value is within 80% of the max value.
| dbms | 256us | 1ms | 4ms | 16ms | 64ms | 256ms | 1s | 4s | 16s | gt | max |
|---|---|---|---|---|---|---|---|---|---|---|---|
| my5651_rel.cz11a_bee | 52.681 | 46.067 | 1.251 | 0.001 | 0.069 | ||||||
| my5744_rel.cz11a_bee | 77.252 | 22.062 | 0.685 | 0.051 | |||||||
| my8036_rel.cz11a_bee | 71.709 | 24.872 | 2.551 | 0.868 | 0.143 | ||||||
| my8036_rel.cz11b_bee | 64.085 | 29.413 | 5.333 | 1.169 | 0.158 | ||||||
| my8036_rel.cz11c_bee | 63.131 | 30.015 | 5.455 | 1.399 | 0.202 | ||||||
| my8036_rel.cz11d_bee | 63.250 | 31.788 | 3.765 | 1.198 | 0.151 |
Delete response time histogram: each cell has the percentage of responses that take <= the time in the header and max is the max response time in seconds. For max values in the top 25% of the range have a red background and in the bottom 25% of the range have a green background. The red background is not used when the min value is within 80% of the max value.
| dbms | 256us | 1ms | 4ms | 16ms | 64ms | 256ms | 1s | 4s | 16s | gt | max |
|---|---|---|---|---|---|---|---|---|---|---|---|
| my5651_rel.cz11a_bee | 62.965 | 36.124 | 0.911 | 0.055 | |||||||
| my5744_rel.cz11a_bee | 82.297 | 17.112 | 0.591 | 0.057 | |||||||
| my8036_rel.cz11a_bee | 76.862 | 20.558 | 1.820 | 0.760 | 0.141 | ||||||
| my8036_rel.cz11b_bee | 71.583 | 23.385 | 4.029 | 1.003 | 0.172 | ||||||
| my8036_rel.cz11c_bee | 70.720 | 23.931 | 4.147 | 1.202 | 0.197 | ||||||
| my8036_rel.cz11d_bee | 70.278 | 25.790 | 2.854 | 1.078 | 0.143 |
Performance metrics for the DBMS listed above. Some are normalized by throughput, others are not. Legend for results is here.
ips	qps	rps	rmbps	wps	wmbps	rpq	rkbpq	wpi	wkbpi	csps	cpups	cspq	cpupq	dbgb1	dbgb2	rss	maxop	p50	p99	tag
3987	22694	121	0.5	653.2	23.5	0.005	0.021	0.164	6.046	92226	53.7	4.064	189	7.2	22.7	8.1	0.028	5721	4955	my5651_rel.cz11a_bee
3989	18429	0	0.0	540.2	20.1	0.000	0.000	0.135	5.172	74083	54.3	4.020	236	7.6	23.1	8.8	0.037	4667	3869	my5744_rel.cz11a_bee
3989	14562	0	0.0	795.2	24.8	0.000	0.000	0.199	6.372	59289	56.1	4.071	308	6.4	22.2	7.6	0.052	3660	3292	my8036_rel.cz11a_bee
3989	13780	0	0.0	1099.6	25.0	0.000	0.000	0.276	6.406	57443	60.4	4.169	351	6.4	22.2	7.6	0.051	3452	3117	my8036_rel.cz11b_bee
3989	13360	0	0.0	998.4	21.0	0.000	0.000	0.250	5.402	56876	63.4	4.257	380	6.4	22.2	6.9	0.143	3340	2972	my8036_rel.cz11c_bee
3989	14476	0	0.0	799.9	24.9	0.000	0.000	0.201	6.404	57958	55.7	4.004	308	6.4	22.2	7.6	0.047	3660	3228	my8036_rel.cz11d_bee
l.i0
l.i0: load without secondary indexes
Performance metrics for all DBMS, not just the ones listed above. Some are normalized by throughput, others are not. Legend for results is here.
ips	qps	rps	rmbps	wps	wmbps	rpq	rkbpq	wpi	wkbpi	csps	cpups	cspq	cpupq	dbgb1	dbgb2	rss	maxop	p50	p99	tag
313725	0	99	0.4	820.5	91.1	0.000	0.001	0.003	0.297	31203	75.3	0.099	19	2.1	17.6	2.6	0.169	92030	75217	my5651_rel.cz11a_bee
262295	0	0	0.0	720.9	76.3	0.000	0.000	0.003	0.298	27796	69.7	0.106	21	2.1	17.7	3.0	0.173	74919	51843	my5744_rel.cz11a_bee
189349	0	0	0.0	783.5	62.1	0.000	0.000	0.004	0.336	22535	70.7	0.119	30	2.1	17.7	3.0	0.151	51344	41255	my8036_rel.cz11a_bee
182857	0	0	0.0	913.5	59.1	0.000	0.000	0.005	0.331	21225	69.8	0.116	31	2.1	17.7	3.0	0.165	50447	36061	my8036_rel.cz11b_bee
184971	0	0	0.0	586.7	56.1	0.000	0.000	0.003	0.311	20793	69.9	0.112	30	2.1	17.7	3.0	0.175	50745	34563	my8036_rel.cz11c_bee
189349	0	0	0.0	785.0	62.2	0.000	0.000	0.004	0.336	22374	71.0	0.118	30	2.1	17.7	3.0	0.157	51644	43652	my8036_rel.cz11d_bee
l.x
l.x: create secondary indexes
Performance metrics for all DBMS, not just the ones listed above. Some are normalized by throughput, others are not. Legend for results is here.
ips	qps	rps	rmbps	wps	wmbps	rpq	rkbpq	wpi	wkbpi	csps	cpups	cspq	cpupq	dbgb1	dbgb2	rss	maxop	p50	p99	tag
278262	0	0	0.0	2438.3	260.0	0.000	0.000	0.009	0.957	6583	39.1	0.024	11	4.5	20.0	4.5	0.002	NA	NA	my5651_rel.cz11a_bee
561405	0	0	0.0	6160.0	483.3	0.000	0.000	0.011	0.882	31387	45.2	0.056	6	4.9	20.4	3.2	0.002	NA	NA	my5744_rel.cz11a_bee
421054	0	2186	136.2	8559.0	427.2	0.005	0.331	0.020	1.039	25790	89.3	0.061	17	4.9	20.4	3.9	0.004	NA	NA	my8036_rel.cz11a_bee
58608	0	301	18.8	1604.5	61.8	0.005	0.328	0.027	1.080	13149	20.6	0.224	28	4.9	20.4	5.7	0.009	NA	NA	my8036_rel.cz11b_bee
34115	0	175	10.9	1091.6	36.7	0.005	0.328	0.032	1.103	12002	15.2	0.352	36	4.9	20.4	5.7	0.006	NA	NA	my8036_rel.cz11c_bee
400001	0	2055	127.9	8285.8	405.1	0.005	0.327	0.021	1.037	24713	89.4	0.062	18	4.9	20.4	3.4	0.007	NA	NA	my8036_rel.cz11d_bee
l.i1
l.i1: continue load after secondary indexes created with 50 inserts per transaction
Performance metrics for all DBMS, not just the ones listed above. Some are normalized by throughput, others are not. Legend for results is here.
ips	qps	rps	rmbps	wps	wmbps	rpq	rkbpq	wpi	wkbpi	csps	cpups	cspq	cpupq	dbgb1	dbgb2	rss	maxop	p50	p99	tag
32720	0	876	3.4	2814.6	120.1	0.027	0.107	0.086	3.758	29971	68.3	0.916	167	7.2	22.7	8.1	0.131	8191	6643	my5651_rel.cz11a_bee
43396	0	0	0.0	3674.4	155.7	0.000	0.000	0.085	3.674	24605	83.9	0.567	155	7.6	23.1	8.8	0.155	10888	9090	my5744_rel.cz11a_bee
25429	0	25	0.4	3283.1	120.2	0.001	0.015	0.129	4.840	21116	54.5	0.830	171	6.4	22.0	7.5	0.255	6341	3645	my8036_rel.cz11a_bee
20377	0	20	0.3	1119.5	50.7	0.001	0.015	0.055	2.546	16852	45.9	0.827	180	6.4	22.0	7.6	30.175	5596	0	my8036_rel.cz11b_bee
14981	0	3	0.1	880.9	36.8	0.000	0.009	0.059	2.517	17657	37.1	1.179	198	6.4	22.0	6.8	52.888	3496	0	my8036_rel.cz11c_bee
25584	0	25	0.4	3301.0	121.0	0.001	0.015	0.129	4.842	21217	54.5	0.829	170	6.4	22.0	7.6	0.227	6343	3499	my8036_rel.cz11d_bee
l.i2
l.i2: continue load after secondary indexes created with 5 inserts per transaction
Performance metrics for all DBMS, not just the ones listed above. Some are normalized by throughput, others are not. Legend for results is here.
ips	qps	rps	rmbps	wps	wmbps	rpq	rkbpq	wpi	wkbpi	csps	cpups	cspq	cpupq	dbgb1	dbgb2	rss	maxop	p50	p99	tag
16577	0	2761	10.8	1762.9	71.8	0.167	0.666	0.106	4.433	63889	73.8	3.854	356	7.2	22.7	8.1	0.124	4145	3566	my5651_rel.cz11a_bee
19455	0	0	0.0	2033.7	83.8	0.000	0.000	0.105	4.413	62521	77.1	3.214	317	7.6	23.1	8.8	0.086	4854	4345	my5744_rel.cz11a_bee
12001	0	0	0.0	1835.3	63.6	0.000	0.000	0.153	5.429	45020	55.4	3.751	369	6.4	22.0	7.6	0.133	3001	1869	my8036_rel.cz11a_bee
11419	0	0	0.0	769.6	30.4	0.000	0.000	0.067	2.724	40710	53.3	3.565	373	6.4	22.0	7.6	0.169	2852	1798	my8036_rel.cz11b_bee
11096	0	0	0.0	656.6	27.1	0.000	0.000	0.059	2.501	42667	55.3	3.845	399	6.4	22.0	6.8	21.851	2782	644	my8036_rel.cz11c_bee
12023	0	0	0.0	1776.6	62.2	0.000	0.000	0.148	5.297	44918	55.4	3.736	369	6.4	22.0	7.6	0.130	2986	1837	my8036_rel.cz11d_bee
qr100.L1
qr100.L1: range queries with 100 insert/s per client
Performance metrics for all DBMS, not just the ones listed above. Some are normalized by throughput, others are not. Legend for results is here.
ips	qps	rps	rmbps	wps	wmbps	rpq	rkbpq	wpi	wkbpi	csps	cpups	cspq	cpupq	dbgb1	dbgb2	rss	maxop	p50	p99	tag
399	25385	14	0.1	348.8	10.9	0.001	0.002	0.875	27.937	97440	50.4	3.839	159	7.2	22.7	8.1	0.021	6361	5786	my5651_rel.cz11a_bee
399	20161	0	0.0	467.7	14.4	0.000	0.000	1.173	36.977	78143	51.4	3.876	204	7.6	23.1	8.8	0.012	5034	4332	my5744_rel.cz11a_bee
399	17519	0	0.0	528.2	13.6	0.000	0.000	1.324	34.977	68313	51.1	3.899	233	6.4	22.0	7.6	0.012	4331	3612	my8036_rel.cz11a_bee
399	17494	0	0.0	212.0	4.1	0.000	0.000	0.532	10.529	67566	51.4	3.862	235	6.4	22.0	7.6	0.045	4459	3534	my8036_rel.cz11b_bee
399	18224	0	0.0	247.4	4.2	0.000	0.000	0.620	10.860	69987	52.4	3.840	230	6.4	22.0	6.9	0.145	4613	3676	my8036_rel.cz11c_bee
399	17496	0	0.0	485.1	12.5	0.000	0.000	1.216	32.214	68145	51.2	3.895	234	6.4	22.0	7.6	0.013	4267	3548	my8036_rel.cz11d_bee
qp100.L2
qp100.L2: point queries with 100 insert/s per client
Performance metrics for all DBMS, not just the ones listed above. Some are normalized by throughput, others are not. Legend for results is here.
ips	qps	rps	rmbps	wps	wmbps	rpq	rkbpq	wpi	wkbpi	csps	cpups	cspq	cpupq	dbgb1	dbgb2	rss	maxop	p50	p99	tag
399	23759	14	0.1	2.2	0.4	0.001	0.002	0.005	1.087	93639	49.4	3.941	166	7.2	22.7	8.1	0.012	6089	4813	my5651_rel.cz11a_bee
399	19410	0	0.0	39.4	1.4	0.000	0.000	0.099	3.661	76196	50.3	3.926	207	7.6	23.1	8.8	0.012	4891	4123	my5744_rel.cz11a_bee
399	15251	0	0.0	67.4	2.1	0.000	0.000	0.169	5.481	59346	50.3	3.891	264	6.4	22.1	7.6	0.010	3901	3356	my8036_rel.cz11a_bee
399	15441	0	0.0	150.2	3.3	0.000	0.000	0.377	8.443	61754	51.0	3.999	264	6.4	22.1	7.6	0.012	3900	3436	my8036_rel.cz11b_bee
399	15200	0	0.0	180.3	3.4	0.000	0.000	0.452	8.757	60092	51.8	3.953	273	6.4	22.1	6.9	0.015	3852	3372	my8036_rel.cz11c_bee
399	15584	0	0.0	71.9	2.2	0.000	0.000	0.180	5.760	61752	50.4	3.962	259	6.4	22.1	7.6	0.012	3944	3420	my8036_rel.cz11d_bee
qr500.L3
qr500.L3: range queries with 500 insert/s per client
Performance metrics for all DBMS, not just the ones listed above. Some are normalized by throughput, others are not. Legend for results is here.
ips	qps	rps	rmbps	wps	wmbps	rpq	rkbpq	wpi	wkbpi	csps	cpups	cspq	cpupq	dbgb1	dbgb2	rss	maxop	p50	p99	tag
1993	25032	62	0.2	697.1	22.9	0.002	0.010	0.350	11.775	95269	52.9	3.806	169	7.2	22.7	8.1	0.037	6249	5626	my5651_rel.cz11a_bee
1994	20016	0	0.0	282.3	10.4	0.000	0.000	0.142	5.328	75169	53.6	3.755	214	7.6	23.1	8.8	0.026	4957	4285	my5744_rel.cz11a_bee
1993	17092	0	0.0	421.4	13.0	0.000	0.000	0.211	6.662	65399	53.4	3.826	250	6.4	22.1	7.6	0.030	4315	3550	my8036_rel.cz11a_bee
1994	17524	0	0.0	508.0	12.0	0.000	0.000	0.255	6.146	67449	55.5	3.849	253	6.4	22.1	7.6	0.093	4475	3628	my8036_rel.cz11b_bee
1994	17884	0	0.0	585.3	12.0	0.000	0.000	0.293	6.155	69173	57.9	3.868	259	6.4	22.1	6.9	0.102	4573	3662	my8036_rel.cz11c_bee
1994	17152	0	0.0	414.4	12.8	0.000	0.000	0.208	6.549	65770	53.5	3.835	250	6.4	22.1	7.6	0.041	4331	3580	my8036_rel.cz11d_bee
qp500.L4
qp500.L4: point queries with 500 insert/s per client
Performance metrics for all DBMS, not just the ones listed above. Some are normalized by throughput, others are not. Legend for results is here.
ips	qps	rps	rmbps	wps	wmbps	rpq	rkbpq	wpi	wkbpi	csps	cpups	cspq	cpupq	dbgb1	dbgb2	rss	maxop	p50	p99	tag
1994	22473	63	0.2	540.2	18.2	0.003	0.011	0.271	9.344	89973	51.1	4.004	182	7.2	22.7	8.1	0.017	5674	4699	my5651_rel.cz11a_bee
1994	19275	0	0.0	262.0	9.8	0.000	0.000	0.131	5.015	76572	52.2	3.973	217	7.6	23.1	8.8	0.027	4891	4046	my5744_rel.cz11a_bee
1993	15105	0	0.0	408.4	12.7	0.000	0.000	0.205	6.507	60736	53.1	4.021	281	6.4	22.1	7.6	0.028	3819	3374	my8036_rel.cz11a_bee
1994	14684	0	0.0	542.8	12.6	0.000	0.000	0.272	6.487	59490	55.3	4.051	301	6.4	22.1	7.6	0.042	3700	3276	my8036_rel.cz11b_bee
1994	14462	0	0.0	620.0	12.6	0.000	0.000	0.311	6.457	59914	58.2	4.143	322	6.4	22.1	6.9	0.054	3628	3117	my8036_rel.cz11c_bee
1994	15134	0	0.0	400.6	12.5	0.000	0.000	0.201	6.408	60329	53.0	3.986	280	6.4	22.1	7.6	0.029	3836	3358	my8036_rel.cz11d_bee
qr1000.L5
qr1000.L5: range queries with 1000 insert/s per client
Performance metrics for all DBMS, not just the ones listed above. Some are normalized by throughput, others are not. Legend for results is here.
ips	qps	rps	rmbps	wps	wmbps	rpq	rkbpq	wpi	wkbpi	csps	cpups	cspq	cpupq	dbgb1	dbgb2	rss	maxop	p50	p99	tag
3989	24346	114	0.4	750.2	26.5	0.005	0.019	0.188	6.790	91301	55.4	3.750	182	7.2	22.7	8.1	0.058	6025	5418	my5651_rel.cz11a_bee
3989	19462	0	0.0	541.4	20.2	0.000	0.000	0.136	5.180	71655	56.5	3.682	232	7.6	23.1	8.8	0.046	4893	4141	my5744_rel.cz11a_bee
3989	16872	0	0.0	796.8	24.9	0.000	0.000	0.200	6.384	64385	56.4	3.816	267	6.4	22.1	7.6	0.048	4299	3564	my8036_rel.cz11a_bee
3987	17422	0	0.0	1111.1	25.2	0.000	0.000	0.279	6.462	67731	60.7	3.888	279	6.4	22.1	7.6	0.083	4413	3644	my8036_rel.cz11b_bee
3989	17538	0	0.0	1013.5	21.3	0.000	0.000	0.254	5.458	68662	63.6	3.915	290	6.4	22.1	6.9	0.117	4427	3772	my8036_rel.cz11c_bee
3989	16875	0	0.0	799.7	24.9	0.000	0.000	0.200	6.403	64621	56.4	3.829	267	6.4	22.1	7.6	0.052	4251	3518	my8036_rel.cz11d_bee
qp1000.L6
qp1000.L6: point queries with 1000 insert/s per client
Performance metrics for all DBMS, not just the ones listed above. Some are normalized by throughput, others are not. Legend for results is here.
ips	qps	rps	rmbps	wps	wmbps	rpq	rkbpq	wpi	wkbpi	csps	cpups	cspq	cpupq	dbgb1	dbgb2	rss	maxop	p50	p99	tag
3987	22694	121	0.5	653.2	23.5	0.005	0.021	0.164	6.046	92226	53.7	4.064	189	7.2	22.7	8.1	0.028	5721	4955	my5651_rel.cz11a_bee
3989	18429	0	0.0	540.2	20.1	0.000	0.000	0.135	5.172	74083	54.3	4.020	236	7.6	23.1	8.8	0.037	4667	3869	my5744_rel.cz11a_bee
3989	14562	0	0.0	795.2	24.8	0.000	0.000	0.199	6.372	59289	56.1	4.071	308	6.4	22.2	7.6	0.052	3660	3292	my8036_rel.cz11a_bee
3989	13780	0	0.0	1099.6	25.0	0.000	0.000	0.276	6.406	57443	60.4	4.169	351	6.4	22.2	7.6	0.051	3452	3117	my8036_rel.cz11b_bee
3989	13360	0	0.0	998.4	21.0	0.000	0.000	0.250	5.402	56876	63.4	4.257	380	6.4	22.2	6.9	0.143	3340	2972	my8036_rel.cz11c_bee
3989	14476	0	0.0	799.9	24.9	0.000	0.000	0.201	6.404	57958	55.7	4.004	308	6.4	22.2	7.6	0.047	3660	3228	my8036_rel.cz11d_bee
l.i0
- l.i0: load without secondary indexes
- Legend for results is here.
- Each entry lists the percentage of responses that fit in that bucket (slower than max time for previous bucket, faster than min time for next bucket).
Insert response time histogram
256us	1ms	4ms	16ms	64ms	256ms	1s	4s	16s	gt	max	tag
0.000	60.494	39.257	0.135	0.107	0.006	0.000	0.000	0.000	0.000	0.169	my5651_rel.cz11a_bee
0.000	0.289	99.199	0.391	0.115	0.006	0.000	0.000	0.000	0.000	0.173	my5744_rel.cz11a_bee
0.000	0.000	99.246	0.613	0.130	0.012	0.000	0.000	0.000	0.000	0.151	my8036_rel.cz11a_bee
0.000	0.000	98.876	0.985	0.105	0.034	0.000	0.000	0.000	0.000	0.165	my8036_rel.cz11b_bee
0.000	0.000	98.977	0.861	0.146	0.017	0.000	0.000	0.000	0.000	0.175	my8036_rel.cz11c_bee
0.000	0.000	99.229	0.645	0.115	0.011	0.000	0.000	0.000	0.000	0.157	my8036_rel.cz11d_bee
l.x
- l.x: create secondary indexes
- Legend for results is here.
- Each entry lists the percentage of responses that fit in that bucket (slower than max time for previous bucket, faster than min time for next bucket).
TODO - determine whether there is data for create index response time
l.i1
- l.i1: continue load after secondary indexes created with 50 inserts per transaction
- Legend for results is here.
- Each entry lists the percentage of responses that fit in that bucket (slower than max time for previous bucket, faster than min time for next bucket).
Insert response time histogram
256us	1ms	4ms	16ms	64ms	256ms	1s	4s	16s	gt	max	tag
0.000	0.000	39.432	57.402	3.158	0.009	0.000	0.000	0.000	0.000	0.131	my5651_rel.cz11a_bee
0.000	0.000	59.486	39.700	0.807	0.008	0.000	0.000	0.000	0.000	0.155	my5744_rel.cz11a_bee
0.000	0.000	55.537	40.393	0.927	3.142	0.000	0.000	0.000	0.000	0.255	my8036_rel.cz11a_bee
0.000	0.000	57.684	37.090	1.973	3.094	0.095	0.061	0.001	0.001	30.175	my8036_rel.cz11b_bee
0.000	0.000	61.403	32.586	2.305	2.984	0.594	0.128	0.000	0.001	52.888	my8036_rel.cz11c_bee
0.000	0.000	55.878	40.169	0.821	3.132	0.000	0.000	0.000	0.000	0.227	my8036_rel.cz11d_bee
Delete response time histogram
256us	1ms	4ms	16ms	64ms	256ms	1s	4s	16s	gt	max	tag
0.000	0.000	55.950	41.811	2.232	0.007	0.000	0.000	0.000	0.000	0.141	my5651_rel.cz11a_bee
0.000	0.000	63.085	36.320	0.588	0.007	0.000	0.000	0.000	0.000	0.155	my5744_rel.cz11a_bee
0.000	0.000	63.931	32.348	0.726	2.995	0.000	0.000	0.000	0.000	0.216	my8036_rel.cz11a_bee
0.000	0.000	67.395	28.024	1.552	2.885	0.086	0.056	0.001	0.001	30.167	my8036_rel.cz11b_bee
0.000	0.000	70.947	23.831	1.825	2.740	0.542	0.114	nonzero	0.001	52.887	my8036_rel.cz11c_bee
0.000	0.000	64.394	31.988	0.642	2.976	0.000	0.000	0.000	0.000	0.214	my8036_rel.cz11d_bee
l.i2
- l.i2: continue load after secondary indexes created with 5 inserts per transaction
- Legend for results is here.
- Each entry lists the percentage of responses that fit in that bucket (slower than max time for previous bucket, faster than min time for next bucket).
Insert response time histogram
256us	1ms	4ms	16ms	64ms	256ms	1s	4s	16s	gt	max	tag
0.070	67.806	29.847	2.148	0.129	0.001	0.000	0.000	0.000	0.000	0.124	my5651_rel.cz11a_bee
0.001	74.357	24.157	1.475	0.009	0.001	0.000	0.000	0.000	0.000	0.086	my5744_rel.cz11a_bee
0.000	64.766	33.169	1.550	0.016	0.498	0.000	0.000	0.000	0.000	0.133	my8036_rel.cz11a_bee
0.000	62.915	34.569	1.898	0.138	0.479	0.000	0.000	0.000	0.000	0.169	my8036_rel.cz11b_bee
0.000	67.131	30.299	1.694	0.398	0.477	nonzero	0.001	nonzero	nonzero	21.851	my8036_rel.cz11c_bee
0.000	64.799	33.156	1.530	0.016	0.500	0.000	0.000	0.000	0.000	0.130	my8036_rel.cz11d_bee
Delete response time histogram
256us	1ms	4ms	16ms	64ms	256ms	1s	4s	16s	gt	max	tag
0.127	67.421	30.164	2.159	0.129	0.001	0.000	0.000	0.000	0.000	0.124	my5651_rel.cz11a_bee
0.002	74.267	24.230	1.491	0.009	0.001	0.000	0.000	0.000	0.000	0.085	my5744_rel.cz11a_bee
0.000	65.220	32.713	1.555	0.015	0.498	0.000	0.000	0.000	0.000	0.132	my8036_rel.cz11a_bee
0.000	63.406	34.079	1.901	0.136	0.478	0.000	0.000	0.000	0.000	0.174	my8036_rel.cz11b_bee
0.000	67.628	29.809	1.694	0.395	0.474	nonzero	0.001	nonzero	nonzero	21.850	my8036_rel.cz11c_bee
0.000	65.279	32.671	1.536	0.016	0.499	0.000	0.000	0.000	0.000	0.138	my8036_rel.cz11d_bee
qr100.L1
- qr100.L1: range queries with 100 insert/s per client
- Legend for results is here.
- Each entry lists the percentage of responses that fit in that bucket (slower than max time for previous bucket, faster than min time for next bucket).
Query response time histogram
256us	1ms	4ms	16ms	64ms	256ms	1s	4s	16s	gt	max	tag
98.368	1.596	0.026	0.010	nonzero	0.000	0.000	0.000	0.000	0.000	0.021	my5651_rel.cz11a_bee
89.758	10.232	0.009	0.001	0.000	0.000	0.000	0.000	0.000	0.000	0.012	my5744_rel.cz11a_bee
78.884	21.108	0.006	0.001	0.000	0.000	0.000	0.000	0.000	0.000	0.012	my8036_rel.cz11a_bee
78.578	21.413	0.007	0.002	nonzero	0.000	0.000	0.000	0.000	0.000	0.045	my8036_rel.cz11b_bee
83.595	16.395	0.007	0.003	nonzero	nonzero	0.000	0.000	0.000	0.000	0.145	my8036_rel.cz11c_bee
78.578	21.414	0.007	0.001	0.000	0.000	0.000	0.000	0.000	0.000	0.013	my8036_rel.cz11d_bee
Insert response time histogram
256us	1ms	4ms	16ms	64ms	256ms	1s	4s	16s	gt	max	tag
0.000	0.000	84.229	15.542	0.229	0.000	0.000	0.000	0.000	0.000	0.037	my5651_rel.cz11a_bee
0.000	0.000	98.403	1.562	0.035	0.000	0.000	0.000	0.000	0.000	0.020	my5744_rel.cz11a_bee
0.000	0.000	96.826	3.160	0.014	0.000	0.000	0.000	0.000	0.000	0.026	my8036_rel.cz11a_bee
0.000	0.000	94.625	5.083	0.215	0.076	0.000	0.000	0.000	0.000	0.102	my8036_rel.cz11b_bee
0.000	0.000	93.875	5.431	0.479	0.215	0.000	0.000	0.000	0.000	0.204	my8036_rel.cz11c_bee
0.000	0.000	92.882	7.062	0.007	0.049	0.000	0.000	0.000	0.000	0.104	my8036_rel.cz11d_bee
Delete response time histogram
256us	1ms	4ms	16ms	64ms	256ms	1s	4s	16s	gt	max	tag
0.000	0.000	85.611	14.215	0.174	0.000	0.000	0.000	0.000	0.000	0.032	my5651_rel.cz11a_bee
0.000	0.000	98.604	1.389	0.007	0.000	0.000	0.000	0.000	0.000	0.017	my5744_rel.cz11a_bee
0.000	0.000	96.993	2.993	0.014	0.000	0.000	0.000	0.000	0.000	0.037	my8036_rel.cz11a_bee
0.000	0.000	95.312	4.472	0.125	0.090	0.000	0.000	0.000	0.000	0.104	my8036_rel.cz11b_bee
0.000	0.000	95.062	4.326	0.431	0.181	0.000	0.000	0.000	0.000	0.164	my8036_rel.cz11c_bee
0.000	0.000	94.625	5.333	0.007	0.035	0.000	0.000	0.000	0.000	0.103	my8036_rel.cz11d_bee
qp100.L2
- qp100.L2: point queries with 100 insert/s per client
- Legend for results is here.
- Each entry lists the percentage of responses that fit in that bucket (slower than max time for previous bucket, faster than min time for next bucket).
Query response time histogram
256us	1ms	4ms	16ms	64ms	256ms	1s	4s	16s	gt	max	tag
98.739	1.192	0.058	0.012	0.000	0.000	0.000	0.000	0.000	0.000	0.012	my5651_rel.cz11a_bee
95.942	4.015	0.038	0.005	0.000	0.000	0.000	0.000	0.000	0.000	0.012	my5744_rel.cz11a_bee
80.253	19.730	0.014	0.003	0.000	0.000	0.000	0.000	0.000	0.000	0.010	my8036_rel.cz11a_bee
84.283	15.695	0.017	0.004	0.000	0.000	0.000	0.000	0.000	0.000	0.012	my8036_rel.cz11b_bee
78.259	21.720	0.016	0.005	0.000	0.000	0.000	0.000	0.000	0.000	0.015	my8036_rel.cz11c_bee
85.570	14.413	0.014	0.003	0.000	0.000	0.000	0.000	0.000	0.000	0.012	my8036_rel.cz11d_bee
Insert response time histogram
256us	1ms	4ms	16ms	64ms	256ms	1s	4s	16s	gt	max	tag
0.000	0.000	86.701	13.174	0.125	0.000	0.000	0.000	0.000	0.000	0.023	my5651_rel.cz11a_bee
0.000	0.000	98.944	1.049	0.007	0.000	0.000	0.000	0.000	0.000	0.016	my5744_rel.cz11a_bee
0.000	0.000	96.236	3.681	0.021	0.062	0.000	0.000	0.000	0.000	0.106	my8036_rel.cz11a_bee
0.000	0.000	96.667	3.271	0.062	0.000	0.000	0.000	0.000	0.000	0.042	my8036_rel.cz11b_bee
0.000	0.000	95.493	4.174	0.264	0.069	0.000	0.000	0.000	0.000	0.123	my8036_rel.cz11c_bee
0.000	0.000	96.493	3.479	0.021	0.007	0.000	0.000	0.000	0.000	0.102	my8036_rel.cz11d_bee
Delete response time histogram
256us	1ms	4ms	16ms	64ms	256ms	1s	4s	16s	gt	max	tag
0.000	0.000	87.660	12.299	0.042	0.000	0.000	0.000	0.000	0.000	0.022	my5651_rel.cz11a_bee
0.000	0.000	99.021	0.965	0.014	0.000	0.000	0.000	0.000	0.000	0.020	my5744_rel.cz11a_bee
0.000	0.000	96.500	3.438	0.014	0.049	0.000	0.000	0.000	0.000	0.103	my8036_rel.cz11a_bee
0.000	0.000	96.389	3.542	0.069	0.000	0.000	0.000	0.000	0.000	0.048	my8036_rel.cz11b_bee
0.000	0.000	95.701	4.069	0.174	0.056	0.000	0.000	0.000	0.000	0.102	my8036_rel.cz11c_bee
0.000	0.000	96.458	3.528	0.007	0.007	0.000	0.000	0.000	0.000	0.102	my8036_rel.cz11d_bee
qr500.L3
- qr500.L3: range queries with 500 insert/s per client
- Legend for results is here.
- Each entry lists the percentage of responses that fit in that bucket (slower than max time for previous bucket, faster than min time for next bucket).
Query response time histogram
256us	1ms	4ms	16ms	64ms	256ms	1s	4s	16s	gt	max	tag
98.236	1.660	0.089	0.014	nonzero	0.000	0.000	0.000	0.000	0.000	0.037	my5651_rel.cz11a_bee
90.342	9.631	0.020	0.007	nonzero	0.000	0.000	0.000	0.000	0.000	0.026	my5744_rel.cz11a_bee
77.985	21.983	0.021	0.011	nonzero	0.000	0.000	0.000	0.000	0.000	0.030	my8036_rel.cz11a_bee
81.320	18.629	0.035	0.016	0.001	nonzero	0.000	0.000	0.000	0.000	0.093	my8036_rel.cz11b_bee
85.556	14.390	0.034	0.019	0.001	nonzero	0.000	0.000	0.000	0.000	0.102	my8036_rel.cz11c_bee
78.135	21.833	0.022	0.010	nonzero	0.000	0.000	0.000	0.000	0.000	0.041	my8036_rel.cz11d_bee
Insert response time histogram
256us	1ms	4ms	16ms	64ms	256ms	1s	4s	16s	gt	max	tag
0.000	0.000	67.400	31.524	1.076	0.000	0.000	0.000	0.000	0.000	0.059	my5651_rel.cz11a_bee
0.000	0.000	94.901	4.810	0.289	0.000	0.000	0.000	0.000	0.000	0.064	my5744_rel.cz11a_bee
0.000	0.000	86.285	12.310	1.051	0.354	0.000	0.000	0.000	0.000	0.131	my8036_rel.cz11a_bee
0.000	0.000	87.268	11.322	1.161	0.249	0.000	0.000	0.000	0.000	0.124	my8036_rel.cz11b_bee
0.000	0.000	81.035	15.851	2.506	0.608	0.000	0.000	0.000	0.000	0.166	my8036_rel.cz11c_bee
0.000	0.000	85.592	13.061	1.075	0.272	0.000	0.000	0.000	0.000	0.129	my8036_rel.cz11d_bee
Delete response time histogram
256us	1ms	4ms	16ms	64ms	256ms	1s	4s	16s	gt	max	tag
0.000	0.000	76.469	22.818	0.713	0.000	0.000	0.000	0.000	0.000	0.049	my5651_rel.cz11a_bee
0.000	0.000	96.256	3.547	0.197	0.000	0.000	0.000	0.000	0.000	0.062	my5744_rel.cz11a_bee
0.000	0.000	89.608	9.412	0.667	0.312	0.000	0.000	0.000	0.000	0.124	my8036_rel.cz11a_bee
0.000	0.000	90.022	8.812	0.935	0.231	0.000	0.000	0.000	0.000	0.117	my8036_rel.cz11b_bee
0.000	0.000	85.599	12.028	1.835	0.539	0.000	0.000	0.000	0.000	0.184	my8036_rel.cz11c_bee
0.000	0.000	89.040	10.035	0.676	0.249	0.000	0.000	0.000	0.000	0.126	my8036_rel.cz11d_bee
qp500.L4
- qp500.L4: point queries with 500 insert/s per client
- Legend for results is here.
- Each entry lists the percentage of responses that fit in that bucket (slower than max time for previous bucket, faster than min time for next bucket).
Query response time histogram
256us	1ms	4ms	16ms	64ms	256ms	1s	4s	16s	gt	max	tag
97.465	2.282	0.235	0.019	nonzero	0.000	0.000	0.000	0.000	0.000	0.017	my5651_rel.cz11a_bee
94.989	4.900	0.094	0.017	nonzero	0.000	0.000	0.000	0.000	0.000	0.027	my5744_rel.cz11a_bee
80.278	19.676	0.034	0.012	nonzero	0.000	0.000	0.000	0.000	0.000	0.028	my8036_rel.cz11a_bee
73.325	26.608	0.047	0.020	nonzero	0.000	0.000	0.000	0.000	0.000	0.042	my8036_rel.cz11b_bee
66.119	33.808	0.050	0.023	0.001	0.000	0.000	0.000	0.000	0.000	0.054	my8036_rel.cz11c_bee
79.685	20.266	0.035	0.013	0.001	0.000	0.000	0.000	0.000	0.000	0.029	my8036_rel.cz11d_bee
Insert response time histogram
256us	1ms	4ms	16ms	64ms	256ms	1s	4s	16s	gt	max	tag
0.000	0.000	76.542	23.081	0.378	0.000	0.000	0.000	0.000	0.000	0.049	my5651_rel.cz11a_bee
0.000	0.000	98.069	1.889	0.042	0.000	0.000	0.000	0.000	0.000	0.048	my5744_rel.cz11a_bee
0.000	0.000	91.044	8.249	0.532	0.175	0.000	0.000	0.000	0.000	0.123	my8036_rel.cz11a_bee
0.000	0.000	88.122	10.312	1.296	0.269	0.000	0.000	0.000	0.000	0.125	my8036_rel.cz11b_bee
0.000	0.000	78.003	18.632	2.690	0.675	0.000	0.000	0.000	0.000	0.163	my8036_rel.cz11c_bee
0.000	0.000	90.943	8.138	0.633	0.286	0.000	0.000	0.000	0.000	0.125	my8036_rel.cz11d_bee
Delete response time histogram
256us	1ms	4ms	16ms	64ms	256ms	1s	4s	16s	gt	max	tag
0.000	0.000	83.628	16.118	0.254	0.000	0.000	0.000	0.000	0.000	0.047	my5651_rel.cz11a_bee
0.000	0.000	98.776	1.201	0.022	0.000	0.000	0.000	0.000	0.000	0.048	my5744_rel.cz11a_bee
0.000	0.000	92.862	6.606	0.374	0.158	0.000	0.000	0.000	0.000	0.121	my8036_rel.cz11a_bee
0.000	0.000	90.943	7.918	0.907	0.232	0.000	0.000	0.000	0.000	0.156	my8036_rel.cz11b_bee
0.000	0.000	83.147	14.258	2.019	0.575	0.000	0.000	0.000	0.000	0.158	my8036_rel.cz11c_bee
0.000	0.000	93.299	6.078	0.378	0.246	0.000	0.000	0.000	0.000	0.125	my8036_rel.cz11d_bee
qr1000.L5
- qr1000.L5: range queries with 1000 insert/s per client
- Legend for results is here.
- Each entry lists the percentage of responses that fit in that bucket (slower than max time for previous bucket, faster than min time for next bucket).
Query response time histogram
256us	1ms	4ms	16ms	64ms	256ms	1s	4s	16s	gt	max	tag
97.842	1.957	0.173	0.027	0.001	0.000	0.000	0.000	0.000	0.000	0.058	my5651_rel.cz11a_bee
90.014	9.905	0.062	0.019	0.001	0.000	0.000	0.000	0.000	0.000	0.046	my5744_rel.cz11a_bee
79.093	20.800	0.074	0.031	0.003	0.000	0.000	0.000	0.000	0.000	0.048	my8036_rel.cz11a_bee
85.119	14.727	0.102	0.048	0.003	nonzero	0.000	0.000	0.000	0.000	0.083	my8036_rel.cz11b_bee
87.959	11.910	0.086	0.041	0.004	nonzero	0.000	0.000	0.000	0.000	0.117	my8036_rel.cz11c_bee
79.016	20.879	0.074	0.029	0.002	0.000	0.000	0.000	0.000	0.000	0.052	my8036_rel.cz11d_bee
Insert response time histogram
256us	1ms	4ms	16ms	64ms	256ms	1s	4s	16s	gt	max	tag
0.000	0.000	44.122	52.656	3.222	0.000	0.000	0.000	0.000	0.000	0.059	my5651_rel.cz11a_bee
0.000	0.000	73.409	24.966	1.624	0.001	0.000	0.000	0.000	0.000	0.067	my5744_rel.cz11a_bee
0.000	0.000	64.655	30.896	3.487	0.963	0.000	0.000	0.000	0.000	0.148	my8036_rel.cz11a_bee
0.000	0.000	62.992	30.940	5.075	0.993	0.000	0.000	0.000	0.000	0.189	my8036_rel.cz11b_bee
0.000	0.000	63.365	30.023	5.299	1.313	0.000	0.000	0.000	0.000	0.241	my8036_rel.cz11c_bee
0.000	0.000	68.292	27.570	3.252	0.886	0.000	0.000	0.000	0.000	0.152	my8036_rel.cz11d_bee
Delete response time histogram
256us	1ms	4ms	16ms	64ms	256ms	1s	4s	16s	gt	max	tag
0.000	0.001	53.565	44.135	2.300	0.000	0.000	0.000	0.000	0.000	0.057	my5651_rel.cz11a_bee
0.000	0.000	78.606	19.983	1.411	0.000	0.000	0.000	0.000	0.000	0.053	my5744_rel.cz11a_bee
0.000	0.000	71.585	24.879	2.667	0.869	0.000	0.000	0.000	0.000	0.138	my8036_rel.cz11a_bee
0.000	0.000	70.851	24.447	3.823	0.879	0.000	0.000	0.000	0.000	0.194	my8036_rel.cz11b_bee
0.000	0.000	71.294	23.676	3.908	1.122	0.000	0.000	0.000	0.000	0.210	my8036_rel.cz11c_bee
0.000	0.000	75.481	21.357	2.397	0.765	0.000	0.000	0.000	0.000	0.137	my8036_rel.cz11d_bee
qp1000.L6
- qp1000.L6: point queries with 1000 insert/s per client
- Legend for results is here.
- Each entry lists the percentage of responses that fit in that bucket (slower than max time for previous bucket, faster than min time for next bucket).
Query response time histogram
256us	1ms	4ms	16ms	64ms	256ms	1s	4s	16s	gt	max	tag
96.994	2.622	0.354	0.030	nonzero	0.000	0.000	0.000	0.000	0.000	0.028	my5651_rel.cz11a_bee
92.653	7.086	0.218	0.042	0.001	0.000	0.000	0.000	0.000	0.000	0.037	my5744_rel.cz11a_bee
75.304	24.560	0.103	0.032	0.002	0.000	0.000	0.000	0.000	0.000	0.052	my8036_rel.cz11a_bee
61.063	38.736	0.144	0.056	0.002	0.000	0.000	0.000	0.000	0.000	0.051	my8036_rel.cz11b_bee
48.259	51.552	0.137	0.050	0.002	nonzero	0.000	0.000	0.000	0.000	0.143	my8036_rel.cz11c_bee
73.825	26.003	0.127	0.041	0.004	0.000	0.000	0.000	0.000	0.000	0.047	my8036_rel.cz11d_bee
Insert response time histogram
256us	1ms	4ms	16ms	64ms	256ms	1s	4s	16s	gt	max	tag
0.000	0.000	52.681	46.067	1.251	0.001	0.000	0.000	0.000	0.000	0.069	my5651_rel.cz11a_bee
0.000	0.000	77.252	22.062	0.685	0.000	0.000	0.000	0.000	0.000	0.051	my5744_rel.cz11a_bee
0.000	0.000	71.709	24.872	2.551	0.868	0.000	0.000	0.000	0.000	0.143	my8036_rel.cz11a_bee
0.000	0.000	64.085	29.413	5.333	1.169	0.000	0.000	0.000	0.000	0.158	my8036_rel.cz11b_bee
0.000	0.000	63.131	30.015	5.455	1.399	0.000	0.000	0.000	0.000	0.202	my8036_rel.cz11c_bee
0.000	0.000	63.250	31.788	3.765	1.198	0.000	0.000	0.000	0.000	0.151	my8036_rel.cz11d_bee
Delete response time histogram
256us	1ms	4ms	16ms	64ms	256ms	1s	4s	16s	gt	max	tag
0.000	0.000	62.965	36.124	0.911	0.000	0.000	0.000	0.000	0.000	0.055	my5651_rel.cz11a_bee
0.000	0.000	82.297	17.112	0.591	0.000	0.000	0.000	0.000	0.000	0.057	my5744_rel.cz11a_bee
0.000	0.000	76.862	20.558	1.820	0.760	0.000	0.000	0.000	0.000	0.141	my8036_rel.cz11a_bee
0.000	0.000	71.583	23.385	4.029	1.003	0.000	0.000	0.000	0.000	0.172	my8036_rel.cz11b_bee
0.000	0.000	70.720	23.931	4.147	1.202	0.000	0.000	0.000	0.000	0.197	my8036_rel.cz11c_bee
0.000	0.000	70.278	25.790	2.854	1.078	0.000	0.000	0.000	0.000	0.143	my8036_rel.cz11d_bee