Introduction
This is a report for the insert benchmark with 32M docs and 4 client(s). It is generated by scripts (bash, awk, sed) and Tufte might not be impressed. An overview of the insert benchmark is here and a short update is here. Below, by DBMS, I mean DBMS+version.config. An example is my8020.c10b40 where my means MySQL, 8020 is version 8.0.20 and c10b40 is the name for the configuration file.
The test server has 8 AMD cores, 16G RAM and an NVMe SSD. It is described here as the Beelink. The benchmark was run with 1 client and there were 1 or 3 connections per client (1 for queries or inserts without rate limits, 1+1 for rate limited inserts+deletes). It uses 4 tables with a table per client. It loads 8M rows per table without secondary indexes, creates 3 secondary indexes per table, then inserts 40m+10m rows per table with a delete per insert to avoid growing the table. It then does 6 read+write tests for 1800s each that do queries as fast as possible with 100,100,500,500,1000,1000 inserts/s and the same for deletes/s per client concurrent with the queries. The database is cached in memory. Clients and the DBMS share one server. The per-database configs are in the per-database subdirectories here.
The tested DBMS are:
- ma110401_rel.cz11b_bee - MariaDB 11.4.1 with the cz11b_bee config that uses innodb_flush_method=O_DIRECT
- ma110401_rel.cz11c_bee - MariaDB 11.4.1 with the cz11c_bee config that uses innodb_flush_method=fsync
Contents
- Summary
- l.i0: load without secondary indexes
- l.x: create secondary indexes
- l.i1: continue load after secondary indexes created with 50 inserts per transaction
- l.i2: continue load after secondary indexes created with 5 inserts per transaction
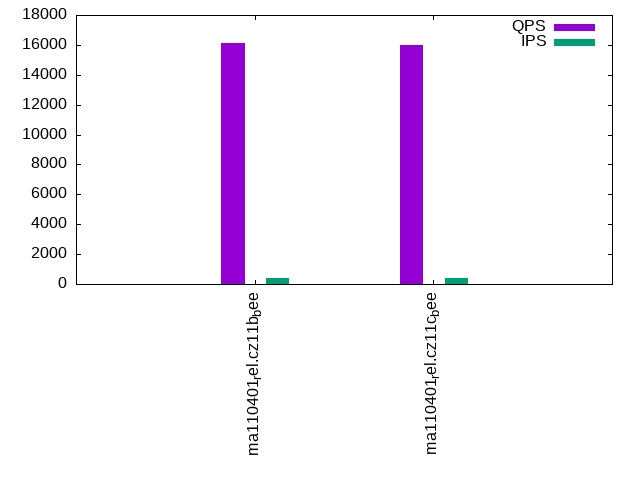
- qr100.L1: range queries with 100 insert/s per client
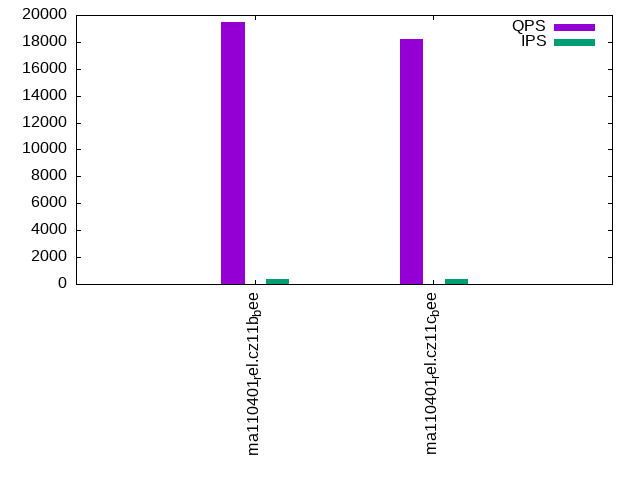
- qp100.L2: point queries with 100 insert/s per client
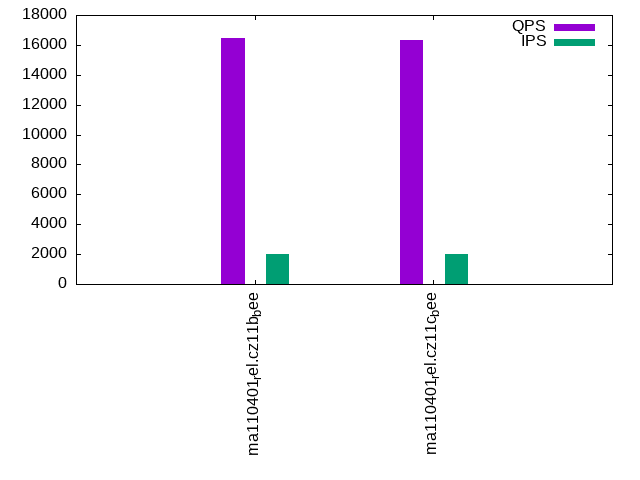
- qr500.L3: range queries with 500 insert/s per client
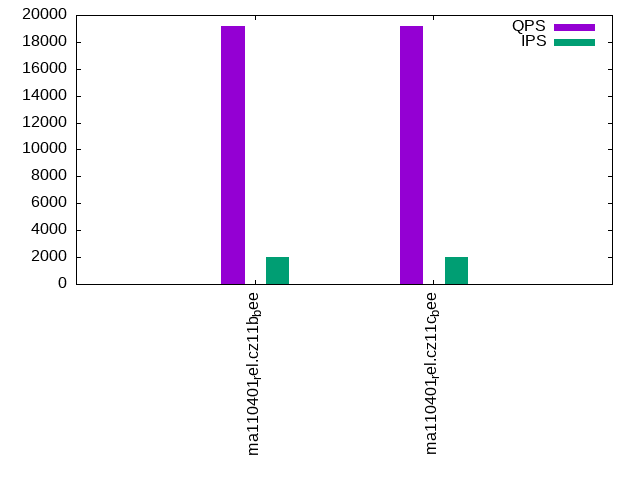
- qp500.L4: point queries with 500 insert/s per client
- qr1000.L5: range queries with 1000 insert/s per client
- qp1000.L6: point queries with 1000 insert/s per client
Summary
The numbers are inserts/s for l.i0, l.i1 and l.i2, indexed docs (or rows) /s for l.x and queries/s for qr100, qp100 thru qr1000, qp1000" The values are the average rate over the entire test for inserts (IPS) and queries (QPS). The range of values for IPS and QPS is split into 3 parts: bottom 25%, middle 50%, top 25%. Values in the bottom 25% have a red background, values in the top 25% have a green background and values in the middle have no color. A gray background is used for values that can be ignored because the DBMS did not sustain the target insert rate. Red backgrounds are not used when the minimum value is within 80% of the max value.
| dbms | l.i0 | l.x | l.i1 | l.i2 | qr100 | qp100 | qr500 | qp500 | qr1000 | qp1000 |
|---|---|---|---|---|---|---|---|---|---|---|
| ma110401_rel.cz11b_bee | 250000 | 421054 | 42941 | 21751 | 16142 | 19489 | 16469 | 19158 | 15856 | 18863 |
| ma110401_rel.cz11c_bee | 206452 | 415586 | 38647 | 19812 | 15965 | 18185 | 16356 | 19168 | 15816 | 18778 |
This table has relative throughput, throughput for the DBMS relative to the DBMS in the first line, using the absolute throughput from the previous table. Values less than 0.95 have a yellow background. Values greater than 1.05 have a blue background.
| dbms | l.i0 | l.x | l.i1 | l.i2 | qr100 | qp100 | qr500 | qp500 | qr1000 | qp1000 |
|---|---|---|---|---|---|---|---|---|---|---|
| ma110401_rel.cz11b_bee | 1.00 | 1.00 | 1.00 | 1.00 | 1.00 | 1.00 | 1.00 | 1.00 | 1.00 | 1.00 |
| ma110401_rel.cz11c_bee | 0.83 | 0.99 | 0.90 | 0.91 | 0.99 | 0.93 | 0.99 | 1.00 | 1.00 | 1.00 |
This lists the average rate of inserts/s for the tests that do inserts concurrent with queries. For such tests the query rate is listed in the table above. The read+write tests are setup so that the insert rate should match the target rate every second. Cells that are not at least 95% of the target have a red background to indicate a failure to satisfy the target.
| dbms | qr100.L1 | qp100.L2 | qr500.L3 | qp500.L4 | qr1000.L5 | qp1000.L6 |
|---|---|---|---|---|---|---|
| ma110401_rel.cz11b_bee | 399 | 399 | 1993 | 1994 | 3989 | 3989 |
| ma110401_rel.cz11c_bee | 399 | 399 | 1994 | 1994 | 3989 | 3989 |
| target | 400 | 400 | 2000 | 2000 | 4000 | 4000 |
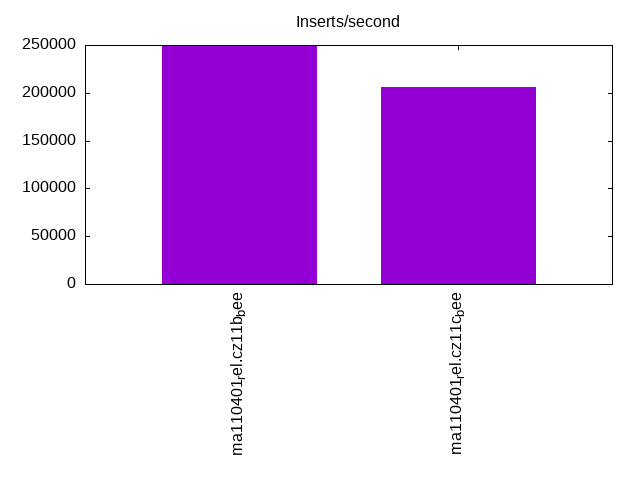
l.i0
l.i0: load without secondary indexes. Graphs for performance per 1-second interval are here.
Average throughput:
Insert response time histogram: each cell has the percentage of responses that take <= the time in the header and max is the max response time in seconds. For the max column values in the top 25% of the range have a red background and in the bottom 25% of the range have a green background. The red background is not used when the min value is within 80% of the max value.
| dbms | 256us | 1ms | 4ms | 16ms | 64ms | 256ms | 1s | 4s | 16s | gt | max |
|---|---|---|---|---|---|---|---|---|---|---|---|
| ma110401_rel.cz11b_bee | 2.108 | 95.707 | 2.125 | 0.040 | 0.019 | 0.200 | |||||
| ma110401_rel.cz11c_bee | 1.565 | 96.262 | 2.029 | 0.121 | 0.018 | 0.001 | 0.004 | 11.218 |
Performance metrics for the DBMS listed above. Some are normalized by throughput, others are not. Legend for results is here.
ips	qps	rps	rmbps	wps	wmbps	rpq	rkbpq	wpi	wkbpi	csps	cpups	cspq	cpupq	dbgb1	dbgb2	rss	maxop	p50	p99	tag
250000	0	0	0.0	831.5	65.9	0.000	0.000	0.003	0.270	30993	73.2	0.124	23	2.1	18.0	2.3	0.200	69724	50046	ma110401_rel.cz11b_bee
206452	0	0	0.0	178.6	54.1	0.000	0.000	0.001	0.268	25945	61.2	0.126	24	2.1	18.0	2.4	11.218	68326	0	ma110401_rel.cz11c_bee
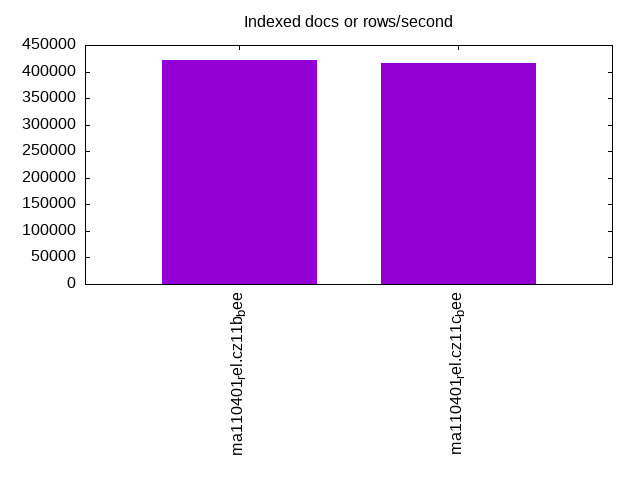
l.x
l.x: create secondary indexes.
Average throughput:
Performance metrics for the DBMS listed above. Some are normalized by throughput, others are not. Legend for results is here.
ips	qps	rps	rmbps	wps	wmbps	rpq	rkbpq	wpi	wkbpi	csps	cpups	cspq	cpupq	dbgb1	dbgb2	rss	maxop	p50	p99	tag
421054	0	0	0.0	2302.8	305.9	0.000	0.000	0.005	0.744	7891	41.8	0.019	8	4.8	20.6	4.3	0.002	NA	NA	ma110401_rel.cz11b_bee
415586	0	0	0.0	726.8	304.7	0.000	0.000	0.002	0.751	7872	41.6	0.019	8	4.8	20.6	4.3	0.002	NA	NA	ma110401_rel.cz11c_bee
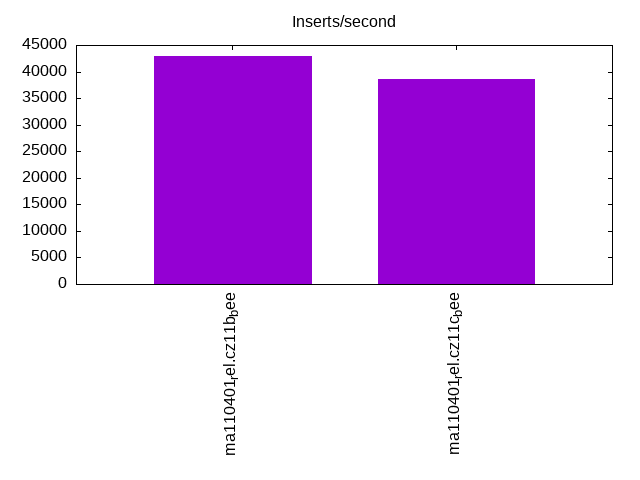
l.i1
l.i1: continue load after secondary indexes created with 50 inserts per transaction. Graphs for performance per 1-second interval are here.
Average throughput:
Insert response time histogram: each cell has the percentage of responses that take <= the time in the header and max is the max response time in seconds. For the max column values in the top 25% of the range have a red background and in the bottom 25% of the range have a green background. The red background is not used when the min value is within 80% of the max value.
| dbms | 256us | 1ms | 4ms | 16ms | 64ms | 256ms | 1s | 4s | 16s | gt | max |
|---|---|---|---|---|---|---|---|---|---|---|---|
| ma110401_rel.cz11b_bee | 65.331 | 31.546 | 3.101 | 0.022 | nonzero | 0.441 | |||||
| ma110401_rel.cz11c_bee | 82.573 | 13.304 | 3.484 | 0.565 | 0.073 | nonzero | 1.195 |
Delete response time histogram: each cell has the percentage of responses that take <= the time in the header and max is the max response time in seconds. For the max column values in the top 25% of the range have a red background and in the bottom 25% of the range have a green background. The red background is not used when the min value is within 80% of the max value.
| dbms | 256us | 1ms | 4ms | 16ms | 64ms | 256ms | 1s | 4s | 16s | gt | max |
|---|---|---|---|---|---|---|---|---|---|---|---|
| ma110401_rel.cz11b_bee | 75.804 | 21.729 | 2.449 | 0.017 | nonzero | 0.324 | |||||
| ma110401_rel.cz11c_bee | nonzero | 86.591 | 9.631 | 3.196 | 0.510 | 0.072 | 0.910 |
Performance metrics for the DBMS listed above. Some are normalized by throughput, others are not. Legend for results is here.
ips	qps	rps	rmbps	wps	wmbps	rpq	rkbpq	wpi	wkbpi	csps	cpups	cspq	cpupq	dbgb1	dbgb2	rss	maxop	p50	p99	tag
42941	0	1836	7.2	5427.5	192.4	0.043	0.171	0.126	4.589	70644	67.5	1.645	126	6.6	22.5	6.5	0.441	10788	6443	ma110401_rel.cz11b_bee
38647	0	1458	5.7	3473.1	123.6	0.038	0.151	0.090	3.274	39703	58.4	1.027	121	8.6	25.8	10.1	1.195	10039	200	ma110401_rel.cz11c_bee
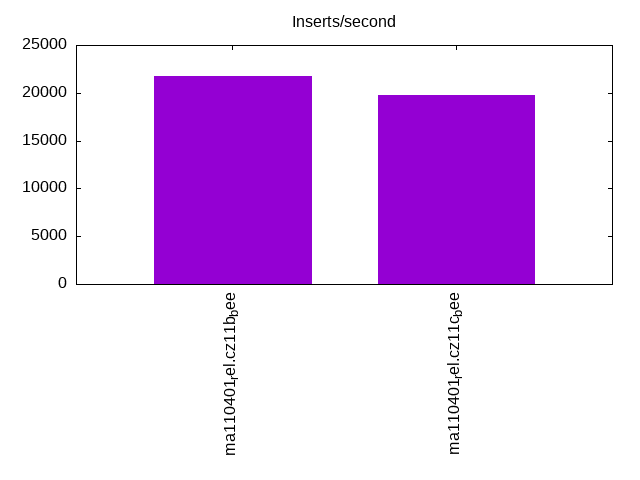
l.i2
l.i2: continue load after secondary indexes created with 5 inserts per transaction. Graphs for performance per 1-second interval are here.
Average throughput:
Insert response time histogram: each cell has the percentage of responses that take <= the time in the header and max is the max response time in seconds. For the max column values in the top 25% of the range have a red background and in the bottom 25% of the range have a green background. The red background is not used when the min value is within 80% of the max value.
| dbms | 256us | 1ms | 4ms | 16ms | 64ms | 256ms | 1s | 4s | 16s | gt | max |
|---|---|---|---|---|---|---|---|---|---|---|---|
| ma110401_rel.cz11b_bee | 0.141 | 84.496 | 14.001 | 1.244 | 0.117 | 0.002 | 0.138 | ||||
| ma110401_rel.cz11c_bee | 0.274 | 84.559 | 13.507 | 1.185 | 0.465 | 0.010 | 0.228 |
Delete response time histogram: each cell has the percentage of responses that take <= the time in the header and max is the max response time in seconds. For the max column values in the top 25% of the range have a red background and in the bottom 25% of the range have a green background. The red background is not used when the min value is within 80% of the max value.
| dbms | 256us | 1ms | 4ms | 16ms | 64ms | 256ms | 1s | 4s | 16s | gt | max |
|---|---|---|---|---|---|---|---|---|---|---|---|
| ma110401_rel.cz11b_bee | 0.160 | 84.532 | 13.950 | 1.252 | 0.105 | 0.002 | 0.127 | ||||
| ma110401_rel.cz11c_bee | 0.287 | 84.644 | 13.452 | 1.181 | 0.426 | 0.009 | 0.226 |
Performance metrics for the DBMS listed above. Some are normalized by throughput, others are not. Legend for results is here.
ips	qps	rps	rmbps	wps	wmbps	rpq	rkbpq	wpi	wkbpi	csps	cpups	cspq	cpupq	dbgb1	dbgb2	rss	maxop	p50	p99	tag
21751	0	3051	11.9	2661.6	96.8	0.140	0.561	0.122	4.556	92713	71.9	4.263	264	6.6	22.5	6.5	0.138	5507	4581	ma110401_rel.cz11b_bee
19812	0	2820	11.0	2526.7	93.7	0.142	0.569	0.128	4.841	83058	67.4	4.192	272	8.6	25.8	10.4	0.228	5199	170	ma110401_rel.cz11c_bee
qr100.L1
qr100.L1: range queries with 100 insert/s per client. Graphs for performance per 1-second interval are here.
Average throughput:
Query response time histogram: each cell has the percentage of responses that take <= the time in the header and max is the max response time in seconds. For max values in the top 25% of the range have a red background and in the bottom 25% of the range have a green background. The red background is not used when the min value is within 80% of the max value.
| dbms | 256us | 1ms | 4ms | 16ms | 64ms | 256ms | 1s | 4s | 16s | gt | max |
|---|---|---|---|---|---|---|---|---|---|---|---|
| ma110401_rel.cz11b_bee | 70.543 | 29.441 | 0.015 | 0.001 | 0.009 | ||||||
| ma110401_rel.cz11c_bee | 68.524 | 31.460 | 0.015 | 0.002 | 0.015 |
Insert response time histogram: each cell has the percentage of responses that take <= the time in the header and max is the max response time in seconds. For max values in the top 25% of the range have a red background and in the bottom 25% of the range have a green background. The red background is not used when the min value is within 80% of the max value.
| dbms | 256us | 1ms | 4ms | 16ms | 64ms | 256ms | 1s | 4s | 16s | gt | max |
|---|---|---|---|---|---|---|---|---|---|---|---|
| ma110401_rel.cz11b_bee | 70.424 | 29.563 | 0.014 | 0.017 | |||||||
| ma110401_rel.cz11c_bee | 79.639 | 20.361 | 0.015 |
Delete response time histogram: each cell has the percentage of responses that take <= the time in the header and max is the max response time in seconds. For max values in the top 25% of the range have a red background and in the bottom 25% of the range have a green background. The red background is not used when the min value is within 80% of the max value.
| dbms | 256us | 1ms | 4ms | 16ms | 64ms | 256ms | 1s | 4s | 16s | gt | max |
|---|---|---|---|---|---|---|---|---|---|---|---|
| ma110401_rel.cz11b_bee | 71.264 | 28.736 | 0.015 | ||||||||
| ma110401_rel.cz11c_bee | 80.188 | 19.812 | 0.014 |
Performance metrics for the DBMS listed above. Some are normalized by throughput, others are not. Legend for results is here.
ips	qps	rps	rmbps	wps	wmbps	rpq	rkbpq	wpi	wkbpi	csps	cpups	cspq	cpupq	dbgb1	dbgb2	rss	maxop	p50	p99	tag
399	16142	11	0.0	13.7	0.8	0.001	0.003	0.034	1.933	61560	51.0	3.814	253	6.6	22.5	6.5	0.009	4013	3564	ma110401_rel.cz11b_bee
399	15965	12	0.0	7.5	0.6	0.001	0.003	0.019	1.538	60867	50.9	3.813	255	8.6	25.8	9.7	0.015	3947	3468	ma110401_rel.cz11c_bee
qp100.L2
qp100.L2: point queries with 100 insert/s per client. Graphs for performance per 1-second interval are here.
Average throughput:
Query response time histogram: each cell has the percentage of responses that take <= the time in the header and max is the max response time in seconds. For max values in the top 25% of the range have a red background and in the bottom 25% of the range have a green background. The red background is not used when the min value is within 80% of the max value.
| dbms | 256us | 1ms | 4ms | 16ms | 64ms | 256ms | 1s | 4s | 16s | gt | max |
|---|---|---|---|---|---|---|---|---|---|---|---|
| ma110401_rel.cz11b_bee | 96.711 | 3.246 | 0.042 | 0.001 | 0.010 | ||||||
| ma110401_rel.cz11c_bee | 92.261 | 7.692 | 0.045 | 0.002 | 0.010 |
Insert response time histogram: each cell has the percentage of responses that take <= the time in the header and max is the max response time in seconds. For max values in the top 25% of the range have a red background and in the bottom 25% of the range have a green background. The red background is not used when the min value is within 80% of the max value.
| dbms | 256us | 1ms | 4ms | 16ms | 64ms | 256ms | 1s | 4s | 16s | gt | max |
|---|---|---|---|---|---|---|---|---|---|---|---|
| ma110401_rel.cz11b_bee | 88.153 | 11.847 | 0.013 | ||||||||
| ma110401_rel.cz11c_bee | 78.000 | 22.000 | 0.015 |
Delete response time histogram: each cell has the percentage of responses that take <= the time in the header and max is the max response time in seconds. For max values in the top 25% of the range have a red background and in the bottom 25% of the range have a green background. The red background is not used when the min value is within 80% of the max value.
| dbms | 256us | 1ms | 4ms | 16ms | 64ms | 256ms | 1s | 4s | 16s | gt | max |
|---|---|---|---|---|---|---|---|---|---|---|---|
| ma110401_rel.cz11b_bee | 88.097 | 11.896 | 0.007 | 0.017 | |||||||
| ma110401_rel.cz11c_bee | 78.264 | 21.736 | 0.016 |
Performance metrics for the DBMS listed above. Some are normalized by throughput, others are not. Legend for results is here.
ips	qps	rps	rmbps	wps	wmbps	rpq	rkbpq	wpi	wkbpi	csps	cpups	cspq	cpupq	dbgb1	dbgb2	rss	maxop	p50	p99	tag
399	19489	14	0.1	26.1	1.1	0.001	0.003	0.066	2.833	77240	50.7	3.963	208	6.6	22.5	6.5	0.010	5003	4014	ma110401_rel.cz11b_bee
399	18185	12	0.0	9.8	0.7	0.001	0.003	0.024	1.688	70867	50.4	3.897	222	8.6	25.8	9.7	0.010	4539	3853	ma110401_rel.cz11c_bee
qr500.L3
qr500.L3: range queries with 500 insert/s per client. Graphs for performance per 1-second interval are here.
Average throughput:
Query response time histogram: each cell has the percentage of responses that take <= the time in the header and max is the max response time in seconds. For max values in the top 25% of the range have a red background and in the bottom 25% of the range have a green background. The red background is not used when the min value is within 80% of the max value.
| dbms | 256us | 1ms | 4ms | 16ms | 64ms | 256ms | 1s | 4s | 16s | gt | max |
|---|---|---|---|---|---|---|---|---|---|---|---|
| ma110401_rel.cz11b_bee | 74.076 | 25.833 | 0.079 | 0.012 | nonzero | 0.031 | |||||
| ma110401_rel.cz11c_bee | 72.966 | 26.942 | 0.081 | 0.011 | nonzero | nonzero | 0.073 |
Insert response time histogram: each cell has the percentage of responses that take <= the time in the header and max is the max response time in seconds. For max values in the top 25% of the range have a red background and in the bottom 25% of the range have a green background. The red background is not used when the min value is within 80% of the max value.
| dbms | 256us | 1ms | 4ms | 16ms | 64ms | 256ms | 1s | 4s | 16s | gt | max |
|---|---|---|---|---|---|---|---|---|---|---|---|
| ma110401_rel.cz11b_bee | 93.364 | 6.510 | 0.126 | 0.036 | |||||||
| ma110401_rel.cz11c_bee | 93.192 | 6.567 | 0.236 | 0.006 | 0.079 |
Delete response time histogram: each cell has the percentage of responses that take <= the time in the header and max is the max response time in seconds. For max values in the top 25% of the range have a red background and in the bottom 25% of the range have a green background. The red background is not used when the min value is within 80% of the max value.
| dbms | 256us | 1ms | 4ms | 16ms | 64ms | 256ms | 1s | 4s | 16s | gt | max |
|---|---|---|---|---|---|---|---|---|---|---|---|
| ma110401_rel.cz11b_bee | 95.031 | 4.897 | 0.072 | 0.035 | |||||||
| ma110401_rel.cz11c_bee | 94.910 | 4.967 | 0.122 | 0.001 | 0.071 |
Performance metrics for the DBMS listed above. Some are normalized by throughput, others are not. Legend for results is here.
ips	qps	rps	rmbps	wps	wmbps	rpq	rkbpq	wpi	wkbpi	csps	cpups	cspq	cpupq	dbgb1	dbgb2	rss	maxop	p50	p99	tag
1993	16469	73	0.3	236.5	8.4	0.004	0.018	0.119	4.293	63307	52.5	3.844	255	6.6	22.5	6.5	0.031	4093	3582	ma110401_rel.cz11b_bee
1994	16356	73	0.3	250.0	9.0	0.004	0.018	0.125	4.644	62742	52.6	3.836	257	8.6	25.8	9.7	0.073	4059	3516	ma110401_rel.cz11c_bee
qp500.L4
qp500.L4: point queries with 500 insert/s per client. Graphs for performance per 1-second interval are here.
Average throughput:
Query response time histogram: each cell has the percentage of responses that take <= the time in the header and max is the max response time in seconds. For max values in the top 25% of the range have a red background and in the bottom 25% of the range have a green background. The red background is not used when the min value is within 80% of the max value.
| dbms | 256us | 1ms | 4ms | 16ms | 64ms | 256ms | 1s | 4s | 16s | gt | max |
|---|---|---|---|---|---|---|---|---|---|---|---|
| ma110401_rel.cz11b_bee | 95.904 | 3.983 | 0.100 | 0.013 | nonzero | 0.018 | |||||
| ma110401_rel.cz11c_bee | 95.820 | 4.067 | 0.102 | 0.012 | nonzero | 0.040 |
Insert response time histogram: each cell has the percentage of responses that take <= the time in the header and max is the max response time in seconds. For max values in the top 25% of the range have a red background and in the bottom 25% of the range have a green background. The red background is not used when the min value is within 80% of the max value.
| dbms | 256us | 1ms | 4ms | 16ms | 64ms | 256ms | 1s | 4s | 16s | gt | max |
|---|---|---|---|---|---|---|---|---|---|---|---|
| ma110401_rel.cz11b_bee | 93.774 | 6.112 | 0.114 | 0.046 | |||||||
| ma110401_rel.cz11c_bee | 93.826 | 5.950 | 0.215 | 0.008 | 0.193 |
Delete response time histogram: each cell has the percentage of responses that take <= the time in the header and max is the max response time in seconds. For max values in the top 25% of the range have a red background and in the bottom 25% of the range have a green background. The red background is not used when the min value is within 80% of the max value.
| dbms | 256us | 1ms | 4ms | 16ms | 64ms | 256ms | 1s | 4s | 16s | gt | max |
|---|---|---|---|---|---|---|---|---|---|---|---|
| ma110401_rel.cz11b_bee | 95.283 | 4.657 | 0.060 | 0.045 | |||||||
| ma110401_rel.cz11c_bee | 95.215 | 4.674 | 0.108 | 0.003 | 0.123 |
Performance metrics for the DBMS listed above. Some are normalized by throughput, others are not. Legend for results is here.
ips	qps	rps	rmbps	wps	wmbps	rpq	rkbpq	wpi	wkbpi	csps	cpups	cspq	cpupq	dbgb1	dbgb2	rss	maxop	p50	p99	tag
1994	19158	73	0.3	204.8	7.5	0.004	0.015	0.103	3.842	77112	52.2	4.025	218	6.6	22.5	6.5	0.018	4813	4331	ma110401_rel.cz11b_bee
1994	19168	73	0.3	200.1	7.6	0.004	0.015	0.100	3.903	76974	52.3	4.016	218	8.6	25.8	9.7	0.040	4859	4301	ma110401_rel.cz11c_bee
qr1000.L5
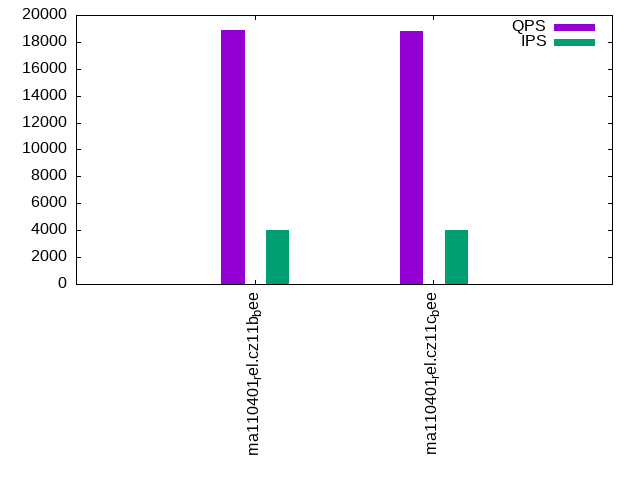
qr1000.L5: range queries with 1000 insert/s per client. Graphs for performance per 1-second interval are here.
Average throughput:
Query response time histogram: each cell has the percentage of responses that take <= the time in the header and max is the max response time in seconds. For max values in the top 25% of the range have a red background and in the bottom 25% of the range have a green background. The red background is not used when the min value is within 80% of the max value.
| dbms | 256us | 1ms | 4ms | 16ms | 64ms | 256ms | 1s | 4s | 16s | gt | max |
|---|---|---|---|---|---|---|---|---|---|---|---|
| ma110401_rel.cz11b_bee | 72.217 | 27.531 | 0.225 | 0.026 | nonzero | 0.028 | |||||
| ma110401_rel.cz11c_bee | 71.654 | 28.074 | 0.244 | 0.026 | 0.001 | nonzero | 0.128 |
Insert response time histogram: each cell has the percentage of responses that take <= the time in the header and max is the max response time in seconds. For max values in the top 25% of the range have a red background and in the bottom 25% of the range have a green background. The red background is not used when the min value is within 80% of the max value.
| dbms | 256us | 1ms | 4ms | 16ms | 64ms | 256ms | 1s | 4s | 16s | gt | max |
|---|---|---|---|---|---|---|---|---|---|---|---|
| ma110401_rel.cz11b_bee | 76.920 | 22.660 | 0.420 | 0.051 | |||||||
| ma110401_rel.cz11c_bee | 71.469 | 27.901 | 0.626 | 0.003 | 0.194 |
Delete response time histogram: each cell has the percentage of responses that take <= the time in the header and max is the max response time in seconds. For max values in the top 25% of the range have a red background and in the bottom 25% of the range have a green background. The red background is not used when the min value is within 80% of the max value.
| dbms | 256us | 1ms | 4ms | 16ms | 64ms | 256ms | 1s | 4s | 16s | gt | max |
|---|---|---|---|---|---|---|---|---|---|---|---|
| ma110401_rel.cz11b_bee | 81.279 | 18.439 | 0.282 | 0.053 | |||||||
| ma110401_rel.cz11c_bee | 76.758 | 22.820 | 0.417 | 0.004 | 0.192 |
Performance metrics for the DBMS listed above. Some are normalized by throughput, others are not. Legend for results is here.
ips	qps	rps	rmbps	wps	wmbps	rpq	rkbpq	wpi	wkbpi	csps	cpups	cspq	cpupq	dbgb1	dbgb2	rss	maxop	p50	p99	tag
3989	15856	138	0.5	442.3	15.9	0.009	0.035	0.111	4.070	61653	54.2	3.888	273	6.6	22.5	6.5	0.028	3966	3422	ma110401_rel.cz11b_bee
3989	15816	136	0.5	456.5	16.7	0.009	0.034	0.114	4.282	61309	54.4	3.876	275	8.6	25.8	9.7	0.128	3996	3422	ma110401_rel.cz11c_bee
qp1000.L6
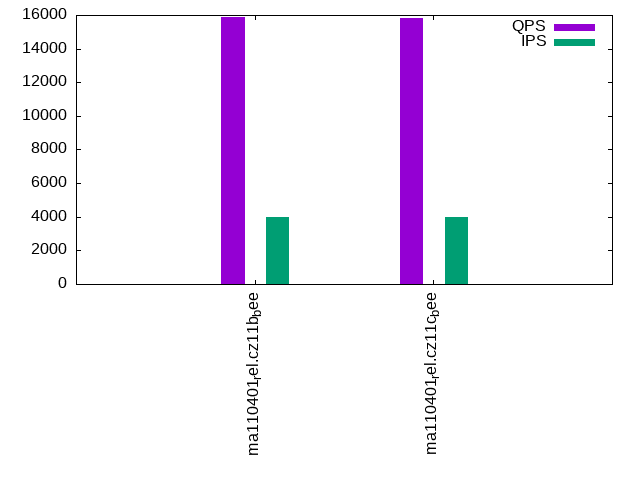
qp1000.L6: point queries with 1000 insert/s per client. Graphs for performance per 1-second interval are here.
Average throughput:
Query response time histogram: each cell has the percentage of responses that take <= the time in the header and max is the max response time in seconds. For max values in the top 25% of the range have a red background and in the bottom 25% of the range have a green background. The red background is not used when the min value is within 80% of the max value.
| dbms | 256us | 1ms | 4ms | 16ms | 64ms | 256ms | 1s | 4s | 16s | gt | max |
|---|---|---|---|---|---|---|---|---|---|---|---|
| ma110401_rel.cz11b_bee | 93.863 | 6.024 | 0.100 | 0.013 | nonzero | 0.025 | |||||
| ma110401_rel.cz11c_bee | 93.408 | 6.482 | 0.097 | 0.013 | nonzero | 0.024 |
Insert response time histogram: each cell has the percentage of responses that take <= the time in the header and max is the max response time in seconds. For max values in the top 25% of the range have a red background and in the bottom 25% of the range have a green background. The red background is not used when the min value is within 80% of the max value.
| dbms | 256us | 1ms | 4ms | 16ms | 64ms | 256ms | 1s | 4s | 16s | gt | max |
|---|---|---|---|---|---|---|---|---|---|---|---|
| ma110401_rel.cz11b_bee | 84.777 | 14.833 | 0.390 | 0.053 | |||||||
| ma110401_rel.cz11c_bee | 83.327 | 16.110 | 0.563 | 0.052 |
Delete response time histogram: each cell has the percentage of responses that take <= the time in the header and max is the max response time in seconds. For max values in the top 25% of the range have a red background and in the bottom 25% of the range have a green background. The red background is not used when the min value is within 80% of the max value.
| dbms | 256us | 1ms | 4ms | 16ms | 64ms | 256ms | 1s | 4s | 16s | gt | max |
|---|---|---|---|---|---|---|---|---|---|---|---|
| ma110401_rel.cz11b_bee | 87.701 | 12.081 | 0.218 | 0.053 | |||||||
| ma110401_rel.cz11c_bee | 86.635 | 13.031 | 0.334 | 0.058 |
Performance metrics for the DBMS listed above. Some are normalized by throughput, others are not. Legend for results is here.
ips	qps	rps	rmbps	wps	wmbps	rpq	rkbpq	wpi	wkbpi	csps	cpups	cspq	cpupq	dbgb1	dbgb2	rss	maxop	p50	p99	tag
3989	18863	143	0.6	436.6	15.7	0.008	0.030	0.109	4.031	76306	55.0	4.045	233	6.6	22.5	6.5	0.025	4715	4379	ma110401_rel.cz11b_bee
3989	18778	142	0.6	446.4	16.4	0.008	0.030	0.112	4.208	75524	55.1	4.022	235	8.6	25.8	9.7	0.024	4701	4315	ma110401_rel.cz11c_bee
l.i0
l.i0: load without secondary indexes
Performance metrics for all DBMS, not just the ones listed above. Some are normalized by throughput, others are not. Legend for results is here.
ips	qps	rps	rmbps	wps	wmbps	rpq	rkbpq	wpi	wkbpi	csps	cpups	cspq	cpupq	dbgb1	dbgb2	rss	maxop	p50	p99	tag
250000	0	0	0.0	831.5	65.9	0.000	0.000	0.003	0.270	30993	73.2	0.124	23	2.1	18.0	2.3	0.200	69724	50046	ma110401_rel.cz11b_bee
206452	0	0	0.0	178.6	54.1	0.000	0.000	0.001	0.268	25945	61.2	0.126	24	2.1	18.0	2.4	11.218	68326	0	ma110401_rel.cz11c_bee
l.x
l.x: create secondary indexes
Performance metrics for all DBMS, not just the ones listed above. Some are normalized by throughput, others are not. Legend for results is here.
ips	qps	rps	rmbps	wps	wmbps	rpq	rkbpq	wpi	wkbpi	csps	cpups	cspq	cpupq	dbgb1	dbgb2	rss	maxop	p50	p99	tag
421054	0	0	0.0	2302.8	305.9	0.000	0.000	0.005	0.744	7891	41.8	0.019	8	4.8	20.6	4.3	0.002	NA	NA	ma110401_rel.cz11b_bee
415586	0	0	0.0	726.8	304.7	0.000	0.000	0.002	0.751	7872	41.6	0.019	8	4.8	20.6	4.3	0.002	NA	NA	ma110401_rel.cz11c_bee
l.i1
l.i1: continue load after secondary indexes created with 50 inserts per transaction
Performance metrics for all DBMS, not just the ones listed above. Some are normalized by throughput, others are not. Legend for results is here.
ips	qps	rps	rmbps	wps	wmbps	rpq	rkbpq	wpi	wkbpi	csps	cpups	cspq	cpupq	dbgb1	dbgb2	rss	maxop	p50	p99	tag
42941	0	1836	7.2	5427.5	192.4	0.043	0.171	0.126	4.589	70644	67.5	1.645	126	6.6	22.5	6.5	0.441	10788	6443	ma110401_rel.cz11b_bee
38647	0	1458	5.7	3473.1	123.6	0.038	0.151	0.090	3.274	39703	58.4	1.027	121	8.6	25.8	10.1	1.195	10039	200	ma110401_rel.cz11c_bee
l.i2
l.i2: continue load after secondary indexes created with 5 inserts per transaction
Performance metrics for all DBMS, not just the ones listed above. Some are normalized by throughput, others are not. Legend for results is here.
ips	qps	rps	rmbps	wps	wmbps	rpq	rkbpq	wpi	wkbpi	csps	cpups	cspq	cpupq	dbgb1	dbgb2	rss	maxop	p50	p99	tag
21751	0	3051	11.9	2661.6	96.8	0.140	0.561	0.122	4.556	92713	71.9	4.263	264	6.6	22.5	6.5	0.138	5507	4581	ma110401_rel.cz11b_bee
19812	0	2820	11.0	2526.7	93.7	0.142	0.569	0.128	4.841	83058	67.4	4.192	272	8.6	25.8	10.4	0.228	5199	170	ma110401_rel.cz11c_bee
qr100.L1
qr100.L1: range queries with 100 insert/s per client
Performance metrics for all DBMS, not just the ones listed above. Some are normalized by throughput, others are not. Legend for results is here.
ips	qps	rps	rmbps	wps	wmbps	rpq	rkbpq	wpi	wkbpi	csps	cpups	cspq	cpupq	dbgb1	dbgb2	rss	maxop	p50	p99	tag
399	16142	11	0.0	13.7	0.8	0.001	0.003	0.034	1.933	61560	51.0	3.814	253	6.6	22.5	6.5	0.009	4013	3564	ma110401_rel.cz11b_bee
399	15965	12	0.0	7.5	0.6	0.001	0.003	0.019	1.538	60867	50.9	3.813	255	8.6	25.8	9.7	0.015	3947	3468	ma110401_rel.cz11c_bee
qp100.L2
qp100.L2: point queries with 100 insert/s per client
Performance metrics for all DBMS, not just the ones listed above. Some are normalized by throughput, others are not. Legend for results is here.
ips	qps	rps	rmbps	wps	wmbps	rpq	rkbpq	wpi	wkbpi	csps	cpups	cspq	cpupq	dbgb1	dbgb2	rss	maxop	p50	p99	tag
399	19489	14	0.1	26.1	1.1	0.001	0.003	0.066	2.833	77240	50.7	3.963	208	6.6	22.5	6.5	0.010	5003	4014	ma110401_rel.cz11b_bee
399	18185	12	0.0	9.8	0.7	0.001	0.003	0.024	1.688	70867	50.4	3.897	222	8.6	25.8	9.7	0.010	4539	3853	ma110401_rel.cz11c_bee
qr500.L3
qr500.L3: range queries with 500 insert/s per client
Performance metrics for all DBMS, not just the ones listed above. Some are normalized by throughput, others are not. Legend for results is here.
ips	qps	rps	rmbps	wps	wmbps	rpq	rkbpq	wpi	wkbpi	csps	cpups	cspq	cpupq	dbgb1	dbgb2	rss	maxop	p50	p99	tag
1993	16469	73	0.3	236.5	8.4	0.004	0.018	0.119	4.293	63307	52.5	3.844	255	6.6	22.5	6.5	0.031	4093	3582	ma110401_rel.cz11b_bee
1994	16356	73	0.3	250.0	9.0	0.004	0.018	0.125	4.644	62742	52.6	3.836	257	8.6	25.8	9.7	0.073	4059	3516	ma110401_rel.cz11c_bee
qp500.L4
qp500.L4: point queries with 500 insert/s per client
Performance metrics for all DBMS, not just the ones listed above. Some are normalized by throughput, others are not. Legend for results is here.
ips	qps	rps	rmbps	wps	wmbps	rpq	rkbpq	wpi	wkbpi	csps	cpups	cspq	cpupq	dbgb1	dbgb2	rss	maxop	p50	p99	tag
1994	19158	73	0.3	204.8	7.5	0.004	0.015	0.103	3.842	77112	52.2	4.025	218	6.6	22.5	6.5	0.018	4813	4331	ma110401_rel.cz11b_bee
1994	19168	73	0.3	200.1	7.6	0.004	0.015	0.100	3.903	76974	52.3	4.016	218	8.6	25.8	9.7	0.040	4859	4301	ma110401_rel.cz11c_bee
qr1000.L5
qr1000.L5: range queries with 1000 insert/s per client
Performance metrics for all DBMS, not just the ones listed above. Some are normalized by throughput, others are not. Legend for results is here.
ips	qps	rps	rmbps	wps	wmbps	rpq	rkbpq	wpi	wkbpi	csps	cpups	cspq	cpupq	dbgb1	dbgb2	rss	maxop	p50	p99	tag
3989	15856	138	0.5	442.3	15.9	0.009	0.035	0.111	4.070	61653	54.2	3.888	273	6.6	22.5	6.5	0.028	3966	3422	ma110401_rel.cz11b_bee
3989	15816	136	0.5	456.5	16.7	0.009	0.034	0.114	4.282	61309	54.4	3.876	275	8.6	25.8	9.7	0.128	3996	3422	ma110401_rel.cz11c_bee
qp1000.L6
qp1000.L6: point queries with 1000 insert/s per client
Performance metrics for all DBMS, not just the ones listed above. Some are normalized by throughput, others are not. Legend for results is here.
ips	qps	rps	rmbps	wps	wmbps	rpq	rkbpq	wpi	wkbpi	csps	cpups	cspq	cpupq	dbgb1	dbgb2	rss	maxop	p50	p99	tag
3989	18863	143	0.6	436.6	15.7	0.008	0.030	0.109	4.031	76306	55.0	4.045	233	6.6	22.5	6.5	0.025	4715	4379	ma110401_rel.cz11b_bee
3989	18778	142	0.6	446.4	16.4	0.008	0.030	0.112	4.208	75524	55.1	4.022	235	8.6	25.8	9.7	0.024	4701	4315	ma110401_rel.cz11c_bee
l.i0
- l.i0: load without secondary indexes
- Legend for results is here.
- Each entry lists the percentage of responses that fit in that bucket (slower than max time for previous bucket, faster than min time for next bucket).
Insert response time histogram
256us	1ms	4ms	16ms	64ms	256ms	1s	4s	16s	gt	max	tag
0.000	2.108	95.707	2.125	0.040	0.019	0.000	0.000	0.000	0.000	0.200	ma110401_rel.cz11b_bee
0.000	1.565	96.262	2.029	0.121	0.018	0.001	0.000	0.004	0.000	11.218	ma110401_rel.cz11c_bee
l.x
- l.x: create secondary indexes
- Legend for results is here.
- Each entry lists the percentage of responses that fit in that bucket (slower than max time for previous bucket, faster than min time for next bucket).
TODO - determine whether there is data for create index response time
l.i1
- l.i1: continue load after secondary indexes created with 50 inserts per transaction
- Legend for results is here.
- Each entry lists the percentage of responses that fit in that bucket (slower than max time for previous bucket, faster than min time for next bucket).
Insert response time histogram
256us	1ms	4ms	16ms	64ms	256ms	1s	4s	16s	gt	max	tag
0.000	0.000	65.331	31.546	3.101	0.022	nonzero	0.000	0.000	0.000	0.441	ma110401_rel.cz11b_bee
0.000	0.000	82.573	13.304	3.484	0.565	0.073	nonzero	0.000	0.000	1.195	ma110401_rel.cz11c_bee
Delete response time histogram
256us	1ms	4ms	16ms	64ms	256ms	1s	4s	16s	gt	max	tag
0.000	0.000	75.804	21.729	2.449	0.017	nonzero	0.000	0.000	0.000	0.324	ma110401_rel.cz11b_bee
0.000	nonzero	86.591	9.631	3.196	0.510	0.072	0.000	0.000	0.000	0.910	ma110401_rel.cz11c_bee
l.i2
- l.i2: continue load after secondary indexes created with 5 inserts per transaction
- Legend for results is here.
- Each entry lists the percentage of responses that fit in that bucket (slower than max time for previous bucket, faster than min time for next bucket).
Insert response time histogram
256us	1ms	4ms	16ms	64ms	256ms	1s	4s	16s	gt	max	tag
0.141	84.496	14.001	1.244	0.117	0.002	0.000	0.000	0.000	0.000	0.138	ma110401_rel.cz11b_bee
0.274	84.559	13.507	1.185	0.465	0.010	0.000	0.000	0.000	0.000	0.228	ma110401_rel.cz11c_bee
Delete response time histogram
256us	1ms	4ms	16ms	64ms	256ms	1s	4s	16s	gt	max	tag
0.160	84.532	13.950	1.252	0.105	0.002	0.000	0.000	0.000	0.000	0.127	ma110401_rel.cz11b_bee
0.287	84.644	13.452	1.181	0.426	0.009	0.000	0.000	0.000	0.000	0.226	ma110401_rel.cz11c_bee
qr100.L1
- qr100.L1: range queries with 100 insert/s per client
- Legend for results is here.
- Each entry lists the percentage of responses that fit in that bucket (slower than max time for previous bucket, faster than min time for next bucket).
Query response time histogram
256us	1ms	4ms	16ms	64ms	256ms	1s	4s	16s	gt	max	tag
70.543	29.441	0.015	0.001	0.000	0.000	0.000	0.000	0.000	0.000	0.009	ma110401_rel.cz11b_bee
68.524	31.460	0.015	0.002	0.000	0.000	0.000	0.000	0.000	0.000	0.015	ma110401_rel.cz11c_bee
Insert response time histogram
256us	1ms	4ms	16ms	64ms	256ms	1s	4s	16s	gt	max	tag
0.000	0.000	70.424	29.563	0.014	0.000	0.000	0.000	0.000	0.000	0.017	ma110401_rel.cz11b_bee
0.000	0.000	79.639	20.361	0.000	0.000	0.000	0.000	0.000	0.000	0.015	ma110401_rel.cz11c_bee
Delete response time histogram
256us	1ms	4ms	16ms	64ms	256ms	1s	4s	16s	gt	max	tag
0.000	0.000	71.264	28.736	0.000	0.000	0.000	0.000	0.000	0.000	0.015	ma110401_rel.cz11b_bee
0.000	0.000	80.188	19.812	0.000	0.000	0.000	0.000	0.000	0.000	0.014	ma110401_rel.cz11c_bee
qp100.L2
- qp100.L2: point queries with 100 insert/s per client
- Legend for results is here.
- Each entry lists the percentage of responses that fit in that bucket (slower than max time for previous bucket, faster than min time for next bucket).
Query response time histogram
256us	1ms	4ms	16ms	64ms	256ms	1s	4s	16s	gt	max	tag
96.711	3.246	0.042	0.001	0.000	0.000	0.000	0.000	0.000	0.000	0.010	ma110401_rel.cz11b_bee
92.261	7.692	0.045	0.002	0.000	0.000	0.000	0.000	0.000	0.000	0.010	ma110401_rel.cz11c_bee
Insert response time histogram
256us	1ms	4ms	16ms	64ms	256ms	1s	4s	16s	gt	max	tag
0.000	0.000	88.153	11.847	0.000	0.000	0.000	0.000	0.000	0.000	0.013	ma110401_rel.cz11b_bee
0.000	0.000	78.000	22.000	0.000	0.000	0.000	0.000	0.000	0.000	0.015	ma110401_rel.cz11c_bee
Delete response time histogram
256us	1ms	4ms	16ms	64ms	256ms	1s	4s	16s	gt	max	tag
0.000	0.000	88.097	11.896	0.007	0.000	0.000	0.000	0.000	0.000	0.017	ma110401_rel.cz11b_bee
0.000	0.000	78.264	21.736	0.000	0.000	0.000	0.000	0.000	0.000	0.016	ma110401_rel.cz11c_bee
qr500.L3
- qr500.L3: range queries with 500 insert/s per client
- Legend for results is here.
- Each entry lists the percentage of responses that fit in that bucket (slower than max time for previous bucket, faster than min time for next bucket).
Query response time histogram
256us	1ms	4ms	16ms	64ms	256ms	1s	4s	16s	gt	max	tag
74.076	25.833	0.079	0.012	nonzero	0.000	0.000	0.000	0.000	0.000	0.031	ma110401_rel.cz11b_bee
72.966	26.942	0.081	0.011	nonzero	nonzero	0.000	0.000	0.000	0.000	0.073	ma110401_rel.cz11c_bee
Insert response time histogram
256us	1ms	4ms	16ms	64ms	256ms	1s	4s	16s	gt	max	tag
0.000	0.000	93.364	6.510	0.126	0.000	0.000	0.000	0.000	0.000	0.036	ma110401_rel.cz11b_bee
0.000	0.000	93.192	6.567	0.236	0.006	0.000	0.000	0.000	0.000	0.079	ma110401_rel.cz11c_bee
Delete response time histogram
256us	1ms	4ms	16ms	64ms	256ms	1s	4s	16s	gt	max	tag
0.000	0.000	95.031	4.897	0.072	0.000	0.000	0.000	0.000	0.000	0.035	ma110401_rel.cz11b_bee
0.000	0.000	94.910	4.967	0.122	0.001	0.000	0.000	0.000	0.000	0.071	ma110401_rel.cz11c_bee
qp500.L4
- qp500.L4: point queries with 500 insert/s per client
- Legend for results is here.
- Each entry lists the percentage of responses that fit in that bucket (slower than max time for previous bucket, faster than min time for next bucket).
Query response time histogram
256us	1ms	4ms	16ms	64ms	256ms	1s	4s	16s	gt	max	tag
95.904	3.983	0.100	0.013	nonzero	0.000	0.000	0.000	0.000	0.000	0.018	ma110401_rel.cz11b_bee
95.820	4.067	0.102	0.012	nonzero	0.000	0.000	0.000	0.000	0.000	0.040	ma110401_rel.cz11c_bee
Insert response time histogram
256us	1ms	4ms	16ms	64ms	256ms	1s	4s	16s	gt	max	tag
0.000	0.000	93.774	6.112	0.114	0.000	0.000	0.000	0.000	0.000	0.046	ma110401_rel.cz11b_bee
0.000	0.000	93.826	5.950	0.215	0.008	0.000	0.000	0.000	0.000	0.193	ma110401_rel.cz11c_bee
Delete response time histogram
256us	1ms	4ms	16ms	64ms	256ms	1s	4s	16s	gt	max	tag
0.000	0.000	95.283	4.657	0.060	0.000	0.000	0.000	0.000	0.000	0.045	ma110401_rel.cz11b_bee
0.000	0.000	95.215	4.674	0.108	0.003	0.000	0.000	0.000	0.000	0.123	ma110401_rel.cz11c_bee
qr1000.L5
- qr1000.L5: range queries with 1000 insert/s per client
- Legend for results is here.
- Each entry lists the percentage of responses that fit in that bucket (slower than max time for previous bucket, faster than min time for next bucket).
Query response time histogram
256us	1ms	4ms	16ms	64ms	256ms	1s	4s	16s	gt	max	tag
72.217	27.531	0.225	0.026	nonzero	0.000	0.000	0.000	0.000	0.000	0.028	ma110401_rel.cz11b_bee
71.654	28.074	0.244	0.026	0.001	nonzero	0.000	0.000	0.000	0.000	0.128	ma110401_rel.cz11c_bee
Insert response time histogram
256us	1ms	4ms	16ms	64ms	256ms	1s	4s	16s	gt	max	tag
0.000	0.000	76.920	22.660	0.420	0.000	0.000	0.000	0.000	0.000	0.051	ma110401_rel.cz11b_bee
0.000	0.000	71.469	27.901	0.626	0.003	0.000	0.000	0.000	0.000	0.194	ma110401_rel.cz11c_bee
Delete response time histogram
256us	1ms	4ms	16ms	64ms	256ms	1s	4s	16s	gt	max	tag
0.000	0.000	81.279	18.439	0.282	0.000	0.000	0.000	0.000	0.000	0.053	ma110401_rel.cz11b_bee
0.000	0.000	76.758	22.820	0.417	0.004	0.000	0.000	0.000	0.000	0.192	ma110401_rel.cz11c_bee
qp1000.L6
- qp1000.L6: point queries with 1000 insert/s per client
- Legend for results is here.
- Each entry lists the percentage of responses that fit in that bucket (slower than max time for previous bucket, faster than min time for next bucket).
Query response time histogram
256us	1ms	4ms	16ms	64ms	256ms	1s	4s	16s	gt	max	tag
93.863	6.024	0.100	0.013	nonzero	0.000	0.000	0.000	0.000	0.000	0.025	ma110401_rel.cz11b_bee
93.408	6.482	0.097	0.013	nonzero	0.000	0.000	0.000	0.000	0.000	0.024	ma110401_rel.cz11c_bee
Insert response time histogram
256us	1ms	4ms	16ms	64ms	256ms	1s	4s	16s	gt	max	tag
0.000	0.000	84.777	14.833	0.390	0.000	0.000	0.000	0.000	0.000	0.053	ma110401_rel.cz11b_bee
0.000	0.000	83.327	16.110	0.563	0.000	0.000	0.000	0.000	0.000	0.052	ma110401_rel.cz11c_bee
Delete response time histogram
256us	1ms	4ms	16ms	64ms	256ms	1s	4s	16s	gt	max	tag
0.000	0.000	87.701	12.081	0.218	0.000	0.000	0.000	0.000	0.000	0.053	ma110401_rel.cz11b_bee
0.000	0.000	86.635	13.031	0.334	0.000	0.000	0.000	0.000	0.000	0.058	ma110401_rel.cz11c_bee