Introduction
This is a report for the insert benchmark with 32M docs and 4 client(s). It is generated by scripts (bash, awk, sed) and Tufte might not be impressed. An overview of the insert benchmark is here and a short update is here. Below, by DBMS, I mean DBMS+version.config. An example is my8020.c10b40 where my means MySQL, 8020 is version 8.0.20 and c10b40 is the name for the configuration file.
The test server has 8 AMD cores, 16G RAM and an NVMe SSD. It is described here as the Beelink. The benchmark was run with 1 client and there were 1 or 3 connections per client (1 for queries or inserts without rate limits, 1+1 for rate limited inserts+deletes). It uses 4 tables with a table per client. It loads 8M rows per table without secondary indexes, creates 3 secondary indexes per table, then inserts 40m+10m rows per table with a delete per insert to avoid growing the table. It then does 6 read+write tests for 1800s each that do queries as fast as possible with 100,100,500,500,1000,1000 inserts/s and the same for deletes/s per client concurrent with the queries. The database is cached in memory. Clients and the DBMS share one server. The per-database configs are in the per-database subdirectories here.
The tested DBMS are:
- ma101107_rel.cz11a_bee - MariaDB 10.11.7 with the cz11a_bee config
- ma101107_rel.cz11b_bee - MariaDB 10.11.7 with the cz11b_bee config that uses innodb_flush_method=O_DIRECT
- ma101107_rel.cz11c_bee - MariaDB 10.11.7 with the cz11c_bee config that uses innodb_flush_method=fsync
- ma101107_rel.cz11d_bee - MariaDB 10.11.7 with the cz11d_bee config that uses innodb_change_buffering=all
Contents
- Summary
- l.i0: load without secondary indexes
- l.x: create secondary indexes
- l.i1: continue load after secondary indexes created with 50 inserts per transaction
- l.i2: continue load after secondary indexes created with 5 inserts per transaction
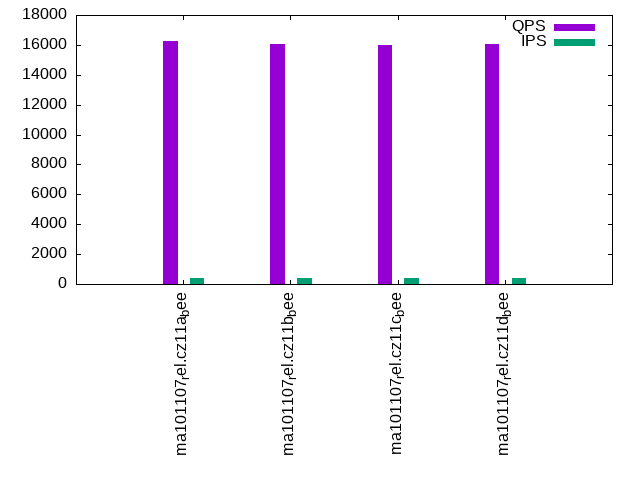
- qr100.L1: range queries with 100 insert/s per client
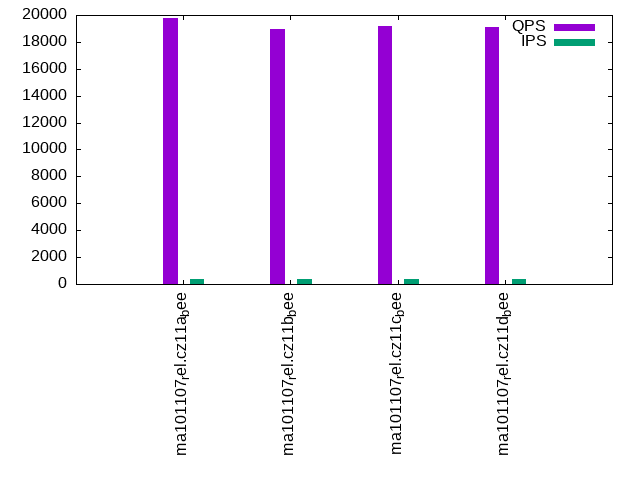
- qp100.L2: point queries with 100 insert/s per client
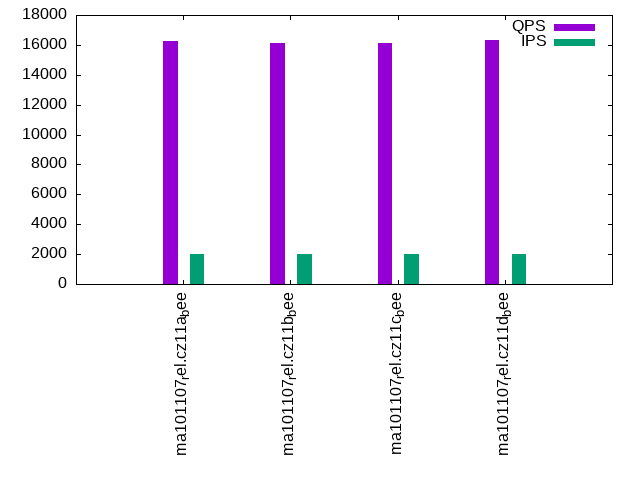
- qr500.L3: range queries with 500 insert/s per client
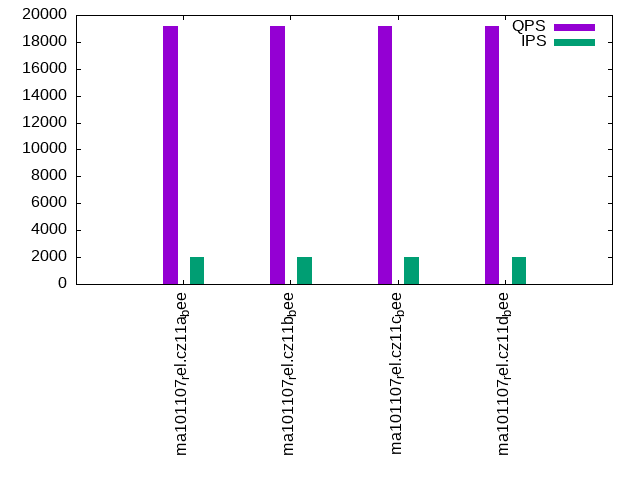
- qp500.L4: point queries with 500 insert/s per client
- qr1000.L5: range queries with 1000 insert/s per client
- qp1000.L6: point queries with 1000 insert/s per client
Summary
The numbers are inserts/s for l.i0, l.i1 and l.i2, indexed docs (or rows) /s for l.x and queries/s for qr100, qp100 thru qr1000, qp1000" The values are the average rate over the entire test for inserts (IPS) and queries (QPS). The range of values for IPS and QPS is split into 3 parts: bottom 25%, middle 50%, top 25%. Values in the bottom 25% have a red background, values in the top 25% have a green background and values in the middle have no color. A gray background is used for values that can be ignored because the DBMS did not sustain the target insert rate. Red backgrounds are not used when the minimum value is within 80% of the max value.
| dbms | l.i0 | l.x | l.i1 | l.i2 | qr100 | qp100 | qr500 | qp500 | qr1000 | qp1000 |
|---|---|---|---|---|---|---|---|---|---|---|
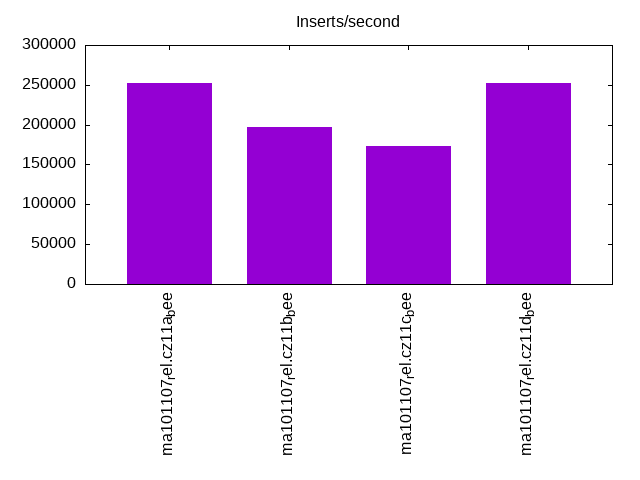
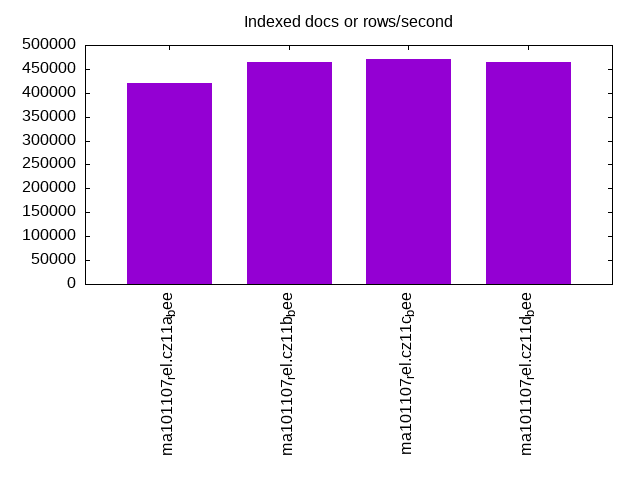
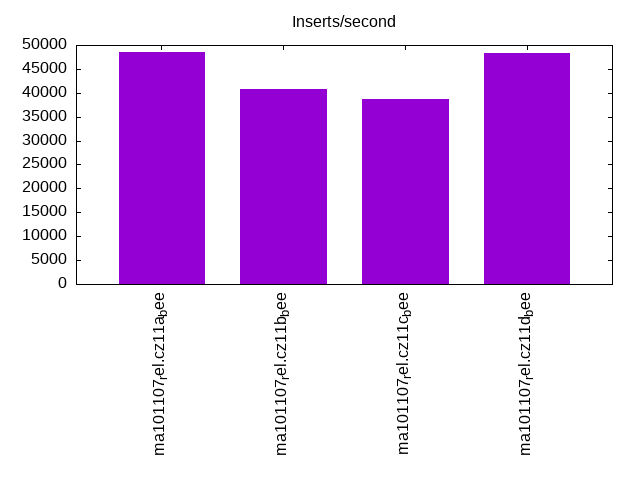
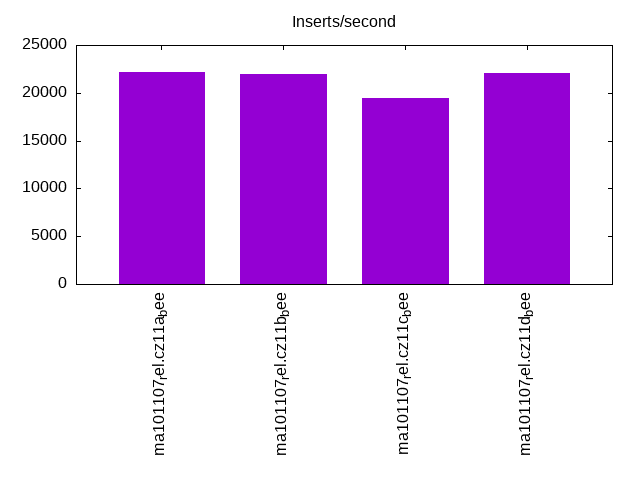
| ma101107_rel.cz11a_bee | 251968 | 421054 | 48558 | 22222 | 16259 | 19804 | 16269 | 19191 | 15856 | 18791 |
| ma101107_rel.cz11b_bee | 197531 | 463770 | 40879 | 21918 | 16028 | 18924 | 16138 | 19189 | 15676 | 18808 |
| ma101107_rel.cz11c_bee | 172973 | 470590 | 38750 | 19465 | 15989 | 19178 | 16099 | 19213 | 15638 | 18826 |
| ma101107_rel.cz11d_bee | 251968 | 463770 | 48324 | 22112 | 16092 | 19075 | 16294 | 19208 | 15793 | 18780 |
This table has relative throughput, throughput for the DBMS relative to the DBMS in the first line, using the absolute throughput from the previous table. Values less than 0.95 have a yellow background. Values greater than 1.05 have a blue background.
| dbms | l.i0 | l.x | l.i1 | l.i2 | qr100 | qp100 | qr500 | qp500 | qr1000 | qp1000 |
|---|---|---|---|---|---|---|---|---|---|---|
| ma101107_rel.cz11a_bee | 1.00 | 1.00 | 1.00 | 1.00 | 1.00 | 1.00 | 1.00 | 1.00 | 1.00 | 1.00 |
| ma101107_rel.cz11b_bee | 0.78 | 1.10 | 0.84 | 0.99 | 0.99 | 0.96 | 0.99 | 1.00 | 0.99 | 1.00 |
| ma101107_rel.cz11c_bee | 0.69 | 1.12 | 0.80 | 0.88 | 0.98 | 0.97 | 0.99 | 1.00 | 0.99 | 1.00 |
| ma101107_rel.cz11d_bee | 1.00 | 1.10 | 1.00 | 1.00 | 0.99 | 0.96 | 1.00 | 1.00 | 1.00 | 1.00 |
This lists the average rate of inserts/s for the tests that do inserts concurrent with queries. For such tests the query rate is listed in the table above. The read+write tests are setup so that the insert rate should match the target rate every second. Cells that are not at least 95% of the target have a red background to indicate a failure to satisfy the target.
| dbms | qr100.L1 | qp100.L2 | qr500.L3 | qp500.L4 | qr1000.L5 | qp1000.L6 |
|---|---|---|---|---|---|---|
| ma101107_rel.cz11a_bee | 399 | 399 | 1993 | 1994 | 3989 | 3989 |
| ma101107_rel.cz11b_bee | 399 | 399 | 1994 | 1993 | 3989 | 3989 |
| ma101107_rel.cz11c_bee | 399 | 399 | 1993 | 1994 | 3989 | 3989 |
| ma101107_rel.cz11d_bee | 399 | 399 | 1994 | 1994 | 3989 | 3989 |
| target | 400 | 400 | 2000 | 2000 | 4000 | 4000 |
l.i0
l.i0: load without secondary indexes. Graphs for performance per 1-second interval are here.
Average throughput:
Insert response time histogram: each cell has the percentage of responses that take <= the time in the header and max is the max response time in seconds. For the max column values in the top 25% of the range have a red background and in the bottom 25% of the range have a green background. The red background is not used when the min value is within 80% of the max value.
| dbms | 256us | 1ms | 4ms | 16ms | 64ms | 256ms | 1s | 4s | 16s | gt | max |
|---|---|---|---|---|---|---|---|---|---|---|---|
| ma101107_rel.cz11a_bee | 3.082 | 94.691 | 2.171 | 0.037 | 0.019 | 0.196 | |||||
| ma101107_rel.cz11b_bee | 2.473 | 95.289 | 2.143 | 0.075 | 0.017 | 0.001 | 0.001 | 19.505 | |||
| ma101107_rel.cz11c_bee | 2.562 | 95.150 | 2.202 | 0.065 | 0.017 | 0.001 | 0.001 | 0.001 | 56.292 | ||
| ma101107_rel.cz11d_bee | 2.832 | 94.928 | 2.173 | 0.048 | 0.019 | 0.191 |
Performance metrics for the DBMS listed above. Some are normalized by throughput, others are not. Legend for results is here.
ips	qps	rps	rmbps	wps	wmbps	rpq	rkbpq	wpi	wkbpi	csps	cpups	cspq	cpupq	dbgb1	dbgb2	rss	maxop	p50	p99	tag
251968	0	0	0.0	825.8	65.9	0.000	0.000	0.003	0.268	30027	73.1	0.119	23	2.1	18.0	2.3	0.196	70388	54159	ma101107_rel.cz11a_bee
197531	0	0	0.0	676.1	51.6	0.000	0.000	0.003	0.267	24320	58.4	0.123	24	2.1	18.0	2.3	19.505	68226	0	ma101107_rel.cz11b_bee
172973	0	0	0.0	200.7	45.5	0.000	0.000	0.001	0.269	21849	51.6	0.126	24	2.1	18.0	2.4	56.292	66428	0	ma101107_rel.cz11c_bee
251968	0	0	0.0	825.0	65.8	0.000	0.000	0.003	0.267	30437	73.1	0.121	23	2.1	18.0	2.3	0.191	69924	54141	ma101107_rel.cz11d_bee
l.x
l.x: create secondary indexes.
Average throughput:
Performance metrics for the DBMS listed above. Some are normalized by throughput, others are not. Legend for results is here.
ips	qps	rps	rmbps	wps	wmbps	rpq	rkbpq	wpi	wkbpi	csps	cpups	cspq	cpupq	dbgb1	dbgb2	rss	maxop	p50	p99	tag
421054	0	0	0.0	2409.0	307.4	0.000	0.000	0.006	0.748	8497	41.3	0.020	8	4.8	20.6	4.4	0.002	NA	NA	ma101107_rel.cz11a_bee
463770	0	0	0.0	2475.2	329.4	0.000	0.000	0.005	0.727	8168	44.6	0.018	8	4.8	20.6	4.6	0.002	NA	NA	ma101107_rel.cz11b_bee
470590	0	0	0.0	832.6	347.9	0.000	0.000	0.002	0.757	8430	44.5	0.018	8	4.8	20.6	4.5	0.002	NA	NA	ma101107_rel.cz11c_bee
463770	0	0	0.0	2466.4	347.0	0.000	0.000	0.005	0.766	8053	44.1	0.017	8	4.8	20.6	4.6	0.002	NA	NA	ma101107_rel.cz11d_bee
l.i1
l.i1: continue load after secondary indexes created with 50 inserts per transaction. Graphs for performance per 1-second interval are here.
Average throughput:
Insert response time histogram: each cell has the percentage of responses that take <= the time in the header and max is the max response time in seconds. For the max column values in the top 25% of the range have a red background and in the bottom 25% of the range have a green background. The red background is not used when the min value is within 80% of the max value.
| dbms | 256us | 1ms | 4ms | 16ms | 64ms | 256ms | 1s | 4s | 16s | gt | max |
|---|---|---|---|---|---|---|---|---|---|---|---|
| ma101107_rel.cz11a_bee | 63.882 | 35.728 | 0.380 | 0.010 | nonzero | 0.294 | |||||
| ma101107_rel.cz11b_bee | 62.906 | 33.202 | 3.859 | 0.032 | 0.001 | 0.515 | |||||
| ma101107_rel.cz11c_bee | 80.939 | 15.100 | 3.350 | 0.537 | 0.074 | nonzero | 1.143 | ||||
| ma101107_rel.cz11d_bee | 63.224 | 36.385 | 0.381 | 0.009 | nonzero | 0.345 |
Delete response time histogram: each cell has the percentage of responses that take <= the time in the header and max is the max response time in seconds. For the max column values in the top 25% of the range have a red background and in the bottom 25% of the range have a green background. The red background is not used when the min value is within 80% of the max value.
| dbms | 256us | 1ms | 4ms | 16ms | 64ms | 256ms | 1s | 4s | 16s | gt | max |
|---|---|---|---|---|---|---|---|---|---|---|---|
| ma101107_rel.cz11a_bee | 77.259 | 22.493 | 0.240 | 0.008 | nonzero | 0.293 | |||||
| ma101107_rel.cz11b_bee | 76.929 | 19.992 | 3.054 | 0.024 | nonzero | 0.352 | |||||
| ma101107_rel.cz11c_bee | nonzero | 86.025 | 10.400 | 3.020 | 0.480 | 0.074 | 0.911 | ||||
| ma101107_rel.cz11d_bee | 77.090 | 22.669 | 0.233 | 0.008 | nonzero | 0.339 |
Performance metrics for the DBMS listed above. Some are normalized by throughput, others are not. Legend for results is here.
ips	qps	rps	rmbps	wps	wmbps	rpq	rkbpq	wpi	wkbpi	csps	cpups	cspq	cpupq	dbgb1	dbgb2	rss	maxop	p50	p99	tag
48558	0	2074	8.1	5851.2	215.6	0.043	0.171	0.120	4.546	75160	75.3	1.548	124	6.7	22.5	6.6	0.294	12241	8239	ma101107_rel.cz11a_bee
40879	0	1767	6.9	5256.3	184.9	0.043	0.173	0.129	4.632	69802	66.4	1.708	130	6.7	22.9	6.6	0.515	10139	5394	ma101107_rel.cz11b_bee
38750	0	1430	5.6	3585.7	126.2	0.037	0.148	0.093	3.336	40856	59.5	1.054	123	8.5	25.8	10.2	1.143	10639	150	ma101107_rel.cz11c_bee
48324	0	2075	8.1	5865.6	215.7	0.043	0.172	0.121	4.570	75476	75.5	1.562	125	6.6	22.4	6.6	0.345	12191	7991	ma101107_rel.cz11d_bee
l.i2
l.i2: continue load after secondary indexes created with 5 inserts per transaction. Graphs for performance per 1-second interval are here.
Average throughput:
Insert response time histogram: each cell has the percentage of responses that take <= the time in the header and max is the max response time in seconds. For the max column values in the top 25% of the range have a red background and in the bottom 25% of the range have a green background. The red background is not used when the min value is within 80% of the max value.
| dbms | 256us | 1ms | 4ms | 16ms | 64ms | 256ms | 1s | 4s | 16s | gt | max |
|---|---|---|---|---|---|---|---|---|---|---|---|
| ma101107_rel.cz11a_bee | 0.011 | 82.903 | 15.979 | 1.102 | 0.004 | 0.001 | 0.145 | ||||
| ma101107_rel.cz11b_bee | 0.072 | 83.677 | 14.958 | 1.227 | 0.065 | 0.001 | 0.237 | ||||
| ma101107_rel.cz11c_bee | 0.348 | 85.303 | 12.647 | 1.099 | 0.590 | 0.013 | nonzero | 0.283 | |||
| ma101107_rel.cz11d_bee | 0.008 | 82.505 | 16.379 | 1.103 | 0.003 | 0.001 | 0.109 |
Delete response time histogram: each cell has the percentage of responses that take <= the time in the header and max is the max response time in seconds. For the max column values in the top 25% of the range have a red background and in the bottom 25% of the range have a green background. The red background is not used when the min value is within 80% of the max value.
| dbms | 256us | 1ms | 4ms | 16ms | 64ms | 256ms | 1s | 4s | 16s | gt | max |
|---|---|---|---|---|---|---|---|---|---|---|---|
| ma101107_rel.cz11a_bee | 0.026 | 83.191 | 15.635 | 1.143 | 0.004 | 0.001 | 0.144 | ||||
| ma101107_rel.cz11b_bee | 0.125 | 83.946 | 14.618 | 1.252 | 0.057 | 0.001 | 0.220 | ||||
| ma101107_rel.cz11c_bee | 0.573 | 85.326 | 12.461 | 1.103 | 0.525 | 0.012 | nonzero | 0.285 | |||
| ma101107_rel.cz11d_bee | 0.027 | 82.897 | 15.929 | 1.142 | 0.003 | 0.001 | 0.110 |
Performance metrics for the DBMS listed above. Some are normalized by throughput, others are not. Legend for results is here.
ips	qps	rps	rmbps	wps	wmbps	rpq	rkbpq	wpi	wkbpi	csps	cpups	cspq	cpupq	dbgb1	dbgb2	rss	maxop	p50	p99	tag
22222	0	3118	12.2	2641.7	99.3	0.140	0.561	0.119	4.576	93789	73.6	4.221	265	6.7	22.5	6.5	0.145	5572	5049	ma101107_rel.cz11a_bee
21918	0	3078	12.0	2678.2	97.5	0.140	0.562	0.122	4.554	93517	72.6	4.267	265	6.7	22.9	6.5	0.237	5529	4215	ma101107_rel.cz11b_bee
19465	0	2765	10.8	2411.0	89.6	0.142	0.568	0.124	4.715	81767	65.7	4.201	270	8.5	25.8	10.5	0.283	5226	180	ma101107_rel.cz11c_bee
22112	0	3104	12.1	2633.4	98.9	0.140	0.561	0.119	4.582	93581	73.7	4.232	267	6.6	22.4	6.5	0.109	5546	4900	ma101107_rel.cz11d_bee
qr100.L1
qr100.L1: range queries with 100 insert/s per client. Graphs for performance per 1-second interval are here.
Average throughput:
Query response time histogram: each cell has the percentage of responses that take <= the time in the header and max is the max response time in seconds. For max values in the top 25% of the range have a red background and in the bottom 25% of the range have a green background. The red background is not used when the min value is within 80% of the max value.
| dbms | 256us | 1ms | 4ms | 16ms | 64ms | 256ms | 1s | 4s | 16s | gt | max |
|---|---|---|---|---|---|---|---|---|---|---|---|
| ma101107_rel.cz11a_bee | 70.969 | 29.013 | 0.016 | 0.002 | 0.008 | ||||||
| ma101107_rel.cz11b_bee | 68.939 | 31.044 | 0.016 | 0.002 | 0.010 | ||||||
| ma101107_rel.cz11c_bee | 68.761 | 31.221 | 0.016 | 0.001 | 0.011 | ||||||
| ma101107_rel.cz11d_bee | 69.361 | 30.623 | 0.015 | 0.001 | 0.012 |
Insert response time histogram: each cell has the percentage of responses that take <= the time in the header and max is the max response time in seconds. For max values in the top 25% of the range have a red background and in the bottom 25% of the range have a green background. The red background is not used when the min value is within 80% of the max value.
| dbms | 256us | 1ms | 4ms | 16ms | 64ms | 256ms | 1s | 4s | 16s | gt | max |
|---|---|---|---|---|---|---|---|---|---|---|---|
| ma101107_rel.cz11a_bee | 57.799 | 42.194 | 0.007 | 0.019 | |||||||
| ma101107_rel.cz11b_bee | 87.910 | 12.090 | 0.012 | ||||||||
| ma101107_rel.cz11c_bee | 74.403 | 25.597 | 0.016 | ||||||||
| ma101107_rel.cz11d_bee | 75.174 | 24.826 | 0.014 |
Delete response time histogram: each cell has the percentage of responses that take <= the time in the header and max is the max response time in seconds. For max values in the top 25% of the range have a red background and in the bottom 25% of the range have a green background. The red background is not used when the min value is within 80% of the max value.
| dbms | 256us | 1ms | 4ms | 16ms | 64ms | 256ms | 1s | 4s | 16s | gt | max |
|---|---|---|---|---|---|---|---|---|---|---|---|
| ma101107_rel.cz11a_bee | 59.639 | 40.347 | 0.014 | 0.019 | |||||||
| ma101107_rel.cz11b_bee | 87.910 | 12.090 | 0.013 | ||||||||
| ma101107_rel.cz11c_bee | 74.785 | 25.215 | 0.015 | ||||||||
| ma101107_rel.cz11d_bee | 75.528 | 24.472 | 0.014 |
Performance metrics for the DBMS listed above. Some are normalized by throughput, others are not. Legend for results is here.
ips	qps	rps	rmbps	wps	wmbps	rpq	rkbpq	wpi	wkbpi	csps	cpups	cspq	cpupq	dbgb1	dbgb2	rss	maxop	p50	p99	tag
399	16259	10	0.0	9.3	0.6	0.001	0.003	0.023	1.645	61983	50.9	3.812	250	6.7	22.5	6.5	0.008	4029	3532	ma101107_rel.cz11a_bee
399	16028	14	0.1	8.2	0.6	0.001	0.003	0.021	1.524	61135	50.9	3.814	254	6.7	22.9	6.5	0.010	3996	3500	ma101107_rel.cz11b_bee
399	15989	12	0.0	2.2	0.4	0.001	0.003	0.006	1.131	60944	50.9	3.812	255	8.5	25.8	9.7	0.011	3980	3484	ma101107_rel.cz11c_bee
399	16092	12	0.0	19.7	0.9	0.001	0.003	0.049	2.406	61430	51.0	3.818	254	6.6	22.4	6.5	0.012	4012	3500	ma101107_rel.cz11d_bee
qp100.L2
qp100.L2: point queries with 100 insert/s per client. Graphs for performance per 1-second interval are here.
Average throughput:
Query response time histogram: each cell has the percentage of responses that take <= the time in the header and max is the max response time in seconds. For max values in the top 25% of the range have a red background and in the bottom 25% of the range have a green background. The red background is not used when the min value is within 80% of the max value.
| dbms | 256us | 1ms | 4ms | 16ms | 64ms | 256ms | 1s | 4s | 16s | gt | max |
|---|---|---|---|---|---|---|---|---|---|---|---|
| ma101107_rel.cz11a_bee | 98.034 | 1.923 | 0.042 | 0.001 | 0.008 | ||||||
| ma101107_rel.cz11b_bee | 94.936 | 5.019 | 0.044 | 0.002 | 0.010 | ||||||
| ma101107_rel.cz11c_bee | 95.727 | 4.228 | 0.044 | 0.001 | 0.012 | ||||||
| ma101107_rel.cz11d_bee | 95.813 | 4.141 | 0.045 | 0.001 | 0.009 |
Insert response time histogram: each cell has the percentage of responses that take <= the time in the header and max is the max response time in seconds. For max values in the top 25% of the range have a red background and in the bottom 25% of the range have a green background. The red background is not used when the min value is within 80% of the max value.
| dbms | 256us | 1ms | 4ms | 16ms | 64ms | 256ms | 1s | 4s | 16s | gt | max |
|---|---|---|---|---|---|---|---|---|---|---|---|
| ma101107_rel.cz11a_bee | 81.306 | 18.694 | 0.015 | ||||||||
| ma101107_rel.cz11b_bee | 87.646 | 12.354 | 0.015 | ||||||||
| ma101107_rel.cz11c_bee | 75.514 | 24.486 | 0.015 | ||||||||
| ma101107_rel.cz11d_bee | 86.646 | 13.347 | 0.007 | 0.016 |
Delete response time histogram: each cell has the percentage of responses that take <= the time in the header and max is the max response time in seconds. For max values in the top 25% of the range have a red background and in the bottom 25% of the range have a green background. The red background is not used when the min value is within 80% of the max value.
| dbms | 256us | 1ms | 4ms | 16ms | 64ms | 256ms | 1s | 4s | 16s | gt | max |
|---|---|---|---|---|---|---|---|---|---|---|---|
| ma101107_rel.cz11a_bee | 81.500 | 18.500 | 0.014 | ||||||||
| ma101107_rel.cz11b_bee | 87.785 | 12.215 | 0.016 | ||||||||
| ma101107_rel.cz11c_bee | 75.826 | 24.167 | 0.007 | 0.017 | |||||||
| ma101107_rel.cz11d_bee | 86.625 | 13.375 | 0.015 |
Performance metrics for the DBMS listed above. Some are normalized by throughput, others are not. Legend for results is here.
ips	qps	rps	rmbps	wps	wmbps	rpq	rkbpq	wpi	wkbpi	csps	cpups	cspq	cpupq	dbgb1	dbgb2	rss	maxop	p50	p99	tag
399	19804	13	0.1	21.2	1.0	0.001	0.003	0.053	2.520	78848	51.0	3.981	206	6.7	22.5	6.5	0.008	4981	4509	ma101107_rel.cz11a_bee
399	18924	14	0.1	20.0	0.9	0.001	0.003	0.050	2.391	74496	50.7	3.937	214	6.7	22.9	6.6	0.010	4797	3948	ma101107_rel.cz11b_bee
399	19178	13	0.0	2.6	0.5	0.001	0.003	0.007	1.158	75669	50.7	3.946	211	8.5	25.8	9.7	0.012	4908	3916	ma101107_rel.cz11c_bee
399	19075	14	0.1	25.4	1.1	0.001	0.003	0.064	2.834	75405	50.7	3.953	213	6.6	22.4	6.5	0.009	4891	3964	ma101107_rel.cz11d_bee
qr500.L3
qr500.L3: range queries with 500 insert/s per client. Graphs for performance per 1-second interval are here.
Average throughput:
Query response time histogram: each cell has the percentage of responses that take <= the time in the header and max is the max response time in seconds. For max values in the top 25% of the range have a red background and in the bottom 25% of the range have a green background. The red background is not used when the min value is within 80% of the max value.
| dbms | 256us | 1ms | 4ms | 16ms | 64ms | 256ms | 1s | 4s | 16s | gt | max |
|---|---|---|---|---|---|---|---|---|---|---|---|
| ma101107_rel.cz11a_bee | 72.673 | 27.227 | 0.088 | 0.012 | nonzero | 0.024 | |||||
| ma101107_rel.cz11b_bee | 71.593 | 28.304 | 0.087 | 0.016 | nonzero | 0.042 | |||||
| ma101107_rel.cz11c_bee | 71.673 | 28.212 | 0.095 | 0.018 | 0.002 | nonzero | 0.121 | ||||
| ma101107_rel.cz11d_bee | 72.381 | 27.521 | 0.087 | 0.011 | nonzero | 0.019 |
Insert response time histogram: each cell has the percentage of responses that take <= the time in the header and max is the max response time in seconds. For max values in the top 25% of the range have a red background and in the bottom 25% of the range have a green background. The red background is not used when the min value is within 80% of the max value.
| dbms | 256us | 1ms | 4ms | 16ms | 64ms | 256ms | 1s | 4s | 16s | gt | max |
|---|---|---|---|---|---|---|---|---|---|---|---|
| ma101107_rel.cz11a_bee | 93.333 | 6.599 | 0.068 | 0.040 | |||||||
| ma101107_rel.cz11b_bee | 93.126 | 6.711 | 0.161 | 0.001 | 0.065 | ||||||
| ma101107_rel.cz11c_bee | 92.004 | 7.714 | 0.265 | 0.017 | 0.146 | ||||||
| ma101107_rel.cz11d_bee | 93.469 | 6.476 | 0.054 | 0.030 |
Delete response time histogram: each cell has the percentage of responses that take <= the time in the header and max is the max response time in seconds. For max values in the top 25% of the range have a red background and in the bottom 25% of the range have a green background. The red background is not used when the min value is within 80% of the max value.
| dbms | 256us | 1ms | 4ms | 16ms | 64ms | 256ms | 1s | 4s | 16s | gt | max |
|---|---|---|---|---|---|---|---|---|---|---|---|
| ma101107_rel.cz11a_bee | 95.182 | 4.783 | 0.035 | 0.040 | |||||||
| ma101107_rel.cz11b_bee | 95.106 | 4.814 | 0.081 | 0.039 | |||||||
| ma101107_rel.cz11c_bee | 94.540 | 5.317 | 0.139 | 0.004 | 0.134 | ||||||
| ma101107_rel.cz11d_bee | 95.265 | 4.715 | 0.019 | 0.029 |
Performance metrics for the DBMS listed above. Some are normalized by throughput, others are not. Legend for results is here.
ips	qps	rps	rmbps	wps	wmbps	rpq	rkbpq	wpi	wkbpi	csps	cpups	cspq	cpupq	dbgb1	dbgb2	rss	maxop	p50	p99	tag
1993	16269	72	0.3	240.5	8.7	0.004	0.018	0.121	4.455	62602	52.6	3.848	259	6.7	22.5	6.5	0.024	4044	3532	ma101107_rel.cz11a_bee
1994	16138	73	0.3	245.5	8.6	0.005	0.018	0.123	4.429	62149	52.5	3.851	260	6.7	22.9	6.6	0.042	4013	3468	ma101107_rel.cz11b_bee
1993	16099	73	0.3	260.1	9.4	0.005	0.018	0.130	4.817	61896	52.4	3.845	260	8.5	25.8	9.7	0.121	4012	3436	ma101107_rel.cz11c_bee
1994	16294	72	0.3	227.2	8.3	0.004	0.018	0.114	4.258	62675	52.7	3.846	259	6.6	22.4	6.5	0.019	4076	3516	ma101107_rel.cz11d_bee
qp500.L4
qp500.L4: point queries with 500 insert/s per client. Graphs for performance per 1-second interval are here.
Average throughput:
Query response time histogram: each cell has the percentage of responses that take <= the time in the header and max is the max response time in seconds. For max values in the top 25% of the range have a red background and in the bottom 25% of the range have a green background. The red background is not used when the min value is within 80% of the max value.
| dbms | 256us | 1ms | 4ms | 16ms | 64ms | 256ms | 1s | 4s | 16s | gt | max |
|---|---|---|---|---|---|---|---|---|---|---|---|
| ma101107_rel.cz11a_bee | 96.132 | 3.759 | 0.099 | 0.010 | nonzero | 0.019 | |||||
| ma101107_rel.cz11b_bee | 95.938 | 3.943 | 0.108 | 0.012 | nonzero | 0.018 | |||||
| ma101107_rel.cz11c_bee | 96.086 | 3.794 | 0.108 | 0.012 | nonzero | 0.017 | |||||
| ma101107_rel.cz11d_bee | 96.113 | 3.766 | 0.110 | 0.011 | nonzero | 0.018 |
Insert response time histogram: each cell has the percentage of responses that take <= the time in the header and max is the max response time in seconds. For max values in the top 25% of the range have a red background and in the bottom 25% of the range have a green background. The red background is not used when the min value is within 80% of the max value.
| dbms | 256us | 1ms | 4ms | 16ms | 64ms | 256ms | 1s | 4s | 16s | gt | max |
|---|---|---|---|---|---|---|---|---|---|---|---|
| ma101107_rel.cz11a_bee | 95.129 | 4.835 | 0.036 | 0.030 | |||||||
| ma101107_rel.cz11b_bee | 92.156 | 7.754 | 0.090 | 0.040 | |||||||
| ma101107_rel.cz11c_bee | 90.347 | 9.496 | 0.157 | 0.048 | |||||||
| ma101107_rel.cz11d_bee | 93.353 | 6.603 | 0.044 | 0.039 |
Delete response time histogram: each cell has the percentage of responses that take <= the time in the header and max is the max response time in seconds. For max values in the top 25% of the range have a red background and in the bottom 25% of the range have a green background. The red background is not used when the min value is within 80% of the max value.
| dbms | 256us | 1ms | 4ms | 16ms | 64ms | 256ms | 1s | 4s | 16s | gt | max |
|---|---|---|---|---|---|---|---|---|---|---|---|
| ma101107_rel.cz11a_bee | 96.296 | 3.690 | 0.014 | 0.028 | |||||||
| ma101107_rel.cz11b_bee | 94.221 | 5.740 | 0.039 | 0.040 | |||||||
| ma101107_rel.cz11c_bee | 93.086 | 6.818 | 0.096 | 0.044 | |||||||
| ma101107_rel.cz11d_bee | 95.157 | 4.821 | 0.022 | 0.039 |
Performance metrics for the DBMS listed above. Some are normalized by throughput, others are not. Legend for results is here.
ips	qps	rps	rmbps	wps	wmbps	rpq	rkbpq	wpi	wkbpi	csps	cpups	cspq	cpupq	dbgb1	dbgb2	rss	maxop	p50	p99	tag
1994	19191	74	0.3	195.9	7.4	0.004	0.015	0.098	3.802	77261	52.4	4.026	218	6.7	22.5	6.5	0.019	4827	4395	ma101107_rel.cz11a_bee
1993	19189	74	0.3	202.0	7.4	0.004	0.015	0.101	3.810	77308	52.4	4.029	218	6.7	22.9	6.5	0.018	4855	4411	ma101107_rel.cz11b_bee
1994	19213	73	0.3	193.6	7.5	0.004	0.015	0.097	3.827	77145	52.5	4.015	219	8.5	25.8	9.7	0.017	4829	4427	ma101107_rel.cz11c_bee
1994	19208	73	0.3	211.7	7.8	0.004	0.015	0.106	4.025	77412	52.4	4.030	218	6.6	22.4	6.5	0.018	4859	4395	ma101107_rel.cz11d_bee
qr1000.L5
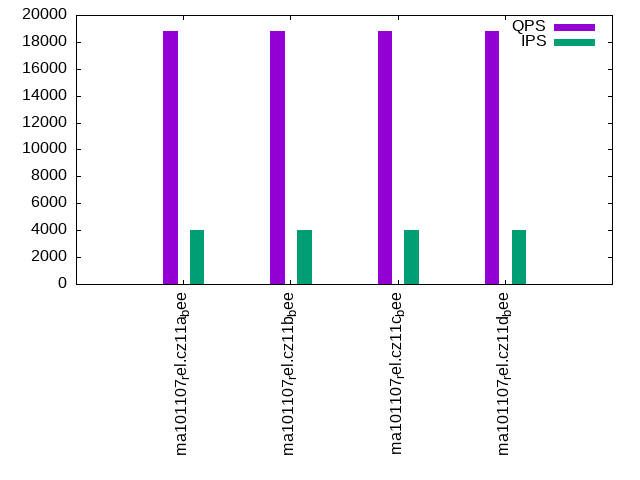
qr1000.L5: range queries with 1000 insert/s per client. Graphs for performance per 1-second interval are here.
Average throughput:
Query response time histogram: each cell has the percentage of responses that take <= the time in the header and max is the max response time in seconds. For max values in the top 25% of the range have a red background and in the bottom 25% of the range have a green background. The red background is not used when the min value is within 80% of the max value.
| dbms | 256us | 1ms | 4ms | 16ms | 64ms | 256ms | 1s | 4s | 16s | gt | max |
|---|---|---|---|---|---|---|---|---|---|---|---|
| ma101107_rel.cz11a_bee | 72.121 | 27.597 | 0.255 | 0.027 | nonzero | 0.025 | |||||
| ma101107_rel.cz11b_bee | 70.838 | 28.872 | 0.254 | 0.034 | 0.001 | nonzero | 0.077 | ||||
| ma101107_rel.cz11c_bee | 71.344 | 28.328 | 0.283 | 0.040 | 0.004 | nonzero | 0.103 | ||||
| ma101107_rel.cz11d_bee | 71.551 | 28.145 | 0.278 | 0.026 | nonzero | 0.040 |
Insert response time histogram: each cell has the percentage of responses that take <= the time in the header and max is the max response time in seconds. For max values in the top 25% of the range have a red background and in the bottom 25% of the range have a green background. The red background is not used when the min value is within 80% of the max value.
| dbms | 256us | 1ms | 4ms | 16ms | 64ms | 256ms | 1s | 4s | 16s | gt | max |
|---|---|---|---|---|---|---|---|---|---|---|---|
| ma101107_rel.cz11a_bee | 73.843 | 25.893 | 0.264 | 0.042 | |||||||
| ma101107_rel.cz11b_bee | 72.099 | 27.505 | 0.395 | 0.001 | 0.069 | ||||||
| ma101107_rel.cz11c_bee | 71.402 | 27.980 | 0.610 | 0.008 | 0.133 | ||||||
| ma101107_rel.cz11d_bee | 69.611 | 30.113 | 0.276 | 0.039 |
Delete response time histogram: each cell has the percentage of responses that take <= the time in the header and max is the max response time in seconds. For max values in the top 25% of the range have a red background and in the bottom 25% of the range have a green background. The red background is not used when the min value is within 80% of the max value.
| dbms | 256us | 1ms | 4ms | 16ms | 64ms | 256ms | 1s | 4s | 16s | gt | max |
|---|---|---|---|---|---|---|---|---|---|---|---|
| ma101107_rel.cz11a_bee | 79.099 | 20.728 | 0.174 | 0.044 | |||||||
| ma101107_rel.cz11b_bee | 77.497 | 22.257 | 0.245 | 0.001 | 0.071 | ||||||
| ma101107_rel.cz11c_bee | 76.966 | 22.653 | 0.380 | 0.001 | 0.108 | ||||||
| ma101107_rel.cz11d_bee | 75.333 | 24.503 | 0.164 | 0.042 |
Performance metrics for the DBMS listed above. Some are normalized by throughput, others are not. Legend for results is here.
ips	qps	rps	rmbps	wps	wmbps	rpq	rkbpq	wpi	wkbpi	csps	cpups	cspq	cpupq	dbgb1	dbgb2	rss	maxop	p50	p99	tag
3989	15856	137	0.5	425.7	15.8	0.009	0.035	0.107	4.053	61745	54.3	3.894	274	6.7	22.5	6.5	0.025	3931	3420	ma101107_rel.cz11a_bee
3989	15676	135	0.5	436.5	15.7	0.009	0.034	0.109	4.035	61213	54.2	3.905	277	6.7	22.9	6.5	0.077	3933	3404	ma101107_rel.cz11b_bee
3989	15638	136	0.5	456.3	16.8	0.009	0.035	0.114	4.301	60982	54.0	3.899	276	8.5	25.8	9.7	0.103	3900	3276	ma101107_rel.cz11c_bee
3989	15793	130	0.5	422.5	15.7	0.008	0.033	0.106	4.032	61493	54.3	3.894	275	6.6	22.4	6.5	0.040	3964	3404	ma101107_rel.cz11d_bee
qp1000.L6
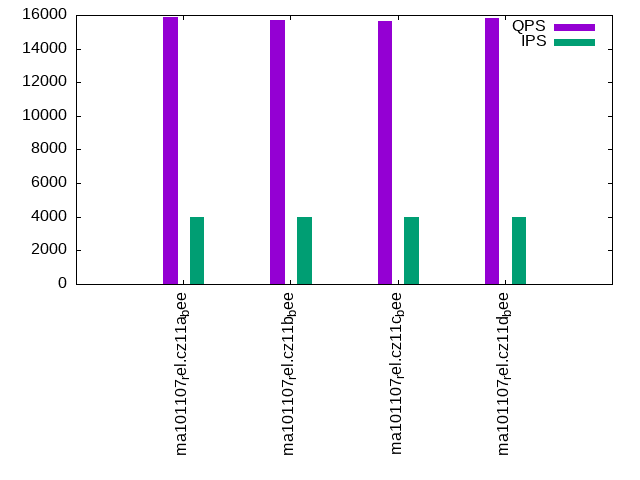
qp1000.L6: point queries with 1000 insert/s per client. Graphs for performance per 1-second interval are here.
Average throughput:
Query response time histogram: each cell has the percentage of responses that take <= the time in the header and max is the max response time in seconds. For max values in the top 25% of the range have a red background and in the bottom 25% of the range have a green background. The red background is not used when the min value is within 80% of the max value.
| dbms | 256us | 1ms | 4ms | 16ms | 64ms | 256ms | 1s | 4s | 16s | gt | max |
|---|---|---|---|---|---|---|---|---|---|---|---|
| ma101107_rel.cz11a_bee | 93.645 | 6.233 | 0.111 | 0.012 | nonzero | 0.016 | |||||
| ma101107_rel.cz11b_bee | 93.720 | 6.162 | 0.107 | 0.011 | nonzero | 0.020 | |||||
| ma101107_rel.cz11c_bee | 93.542 | 6.339 | 0.108 | 0.011 | nonzero | 0.063 | |||||
| ma101107_rel.cz11d_bee | 93.194 | 6.697 | 0.098 | 0.011 | nonzero | 0.022 |
Insert response time histogram: each cell has the percentage of responses that take <= the time in the header and max is the max response time in seconds. For max values in the top 25% of the range have a red background and in the bottom 25% of the range have a green background. The red background is not used when the min value is within 80% of the max value.
| dbms | 256us | 1ms | 4ms | 16ms | 64ms | 256ms | 1s | 4s | 16s | gt | max |
|---|---|---|---|---|---|---|---|---|---|---|---|
| ma101107_rel.cz11a_bee | 76.844 | 22.881 | 0.276 | 0.038 | |||||||
| ma101107_rel.cz11b_bee | 80.263 | 19.380 | 0.358 | 0.050 | |||||||
| ma101107_rel.cz11c_bee | 78.049 | 21.422 | 0.526 | 0.003 | 0.071 | ||||||
| ma101107_rel.cz11d_bee | 82.680 | 17.042 | 0.278 | 0.044 |
Delete response time histogram: each cell has the percentage of responses that take <= the time in the header and max is the max response time in seconds. For max values in the top 25% of the range have a red background and in the bottom 25% of the range have a green background. The red background is not used when the min value is within 80% of the max value.
| dbms | 256us | 1ms | 4ms | 16ms | 64ms | 256ms | 1s | 4s | 16s | gt | max |
|---|---|---|---|---|---|---|---|---|---|---|---|
| ma101107_rel.cz11a_bee | 81.510 | 18.310 | 0.181 | 0.042 | |||||||
| ma101107_rel.cz11b_bee | 84.139 | 15.667 | 0.194 | 0.038 | |||||||
| ma101107_rel.cz11c_bee | 82.430 | 17.262 | 0.308 | 0.001 | 0.064 | ||||||
| ma101107_rel.cz11d_bee | 86.371 | 13.469 | 0.160 | 0.051 |
Performance metrics for the DBMS listed above. Some are normalized by throughput, others are not. Legend for results is here.
ips	qps	rps	rmbps	wps	wmbps	rpq	rkbpq	wpi	wkbpi	csps	cpups	cspq	cpupq	dbgb1	dbgb2	rss	maxop	p50	p99	tag
3989	18791	139	0.5	420.7	15.6	0.007	0.030	0.105	4.009	75952	55.2	4.042	235	6.7	22.5	6.5	0.016	4715	4413	ma101107_rel.cz11a_bee
3989	18808	141	0.6	440.2	15.8	0.007	0.030	0.110	4.060	76093	55.2	4.046	235	6.7	22.9	6.5	0.020	4731	4381	ma101107_rel.cz11b_bee
3989	18826	140	0.5	452.7	16.6	0.007	0.030	0.113	4.271	75807	55.3	4.027	235	8.5	25.8	9.7	0.063	4747	4381	ma101107_rel.cz11c_bee
3989	18780	144	0.6	422.9	15.7	0.008	0.031	0.106	4.028	75746	55.4	4.033	236	6.6	22.4	6.5	0.022	4717	3981	ma101107_rel.cz11d_bee
l.i0
l.i0: load without secondary indexes
Performance metrics for all DBMS, not just the ones listed above. Some are normalized by throughput, others are not. Legend for results is here.
ips	qps	rps	rmbps	wps	wmbps	rpq	rkbpq	wpi	wkbpi	csps	cpups	cspq	cpupq	dbgb1	dbgb2	rss	maxop	p50	p99	tag
251968	0	0	0.0	825.8	65.9	0.000	0.000	0.003	0.268	30027	73.1	0.119	23	2.1	18.0	2.3	0.196	70388	54159	ma101107_rel.cz11a_bee
197531	0	0	0.0	676.1	51.6	0.000	0.000	0.003	0.267	24320	58.4	0.123	24	2.1	18.0	2.3	19.505	68226	0	ma101107_rel.cz11b_bee
172973	0	0	0.0	200.7	45.5	0.000	0.000	0.001	0.269	21849	51.6	0.126	24	2.1	18.0	2.4	56.292	66428	0	ma101107_rel.cz11c_bee
251968	0	0	0.0	825.0	65.8	0.000	0.000	0.003	0.267	30437	73.1	0.121	23	2.1	18.0	2.3	0.191	69924	54141	ma101107_rel.cz11d_bee
l.x
l.x: create secondary indexes
Performance metrics for all DBMS, not just the ones listed above. Some are normalized by throughput, others are not. Legend for results is here.
ips	qps	rps	rmbps	wps	wmbps	rpq	rkbpq	wpi	wkbpi	csps	cpups	cspq	cpupq	dbgb1	dbgb2	rss	maxop	p50	p99	tag
421054	0	0	0.0	2409.0	307.4	0.000	0.000	0.006	0.748	8497	41.3	0.020	8	4.8	20.6	4.4	0.002	NA	NA	ma101107_rel.cz11a_bee
463770	0	0	0.0	2475.2	329.4	0.000	0.000	0.005	0.727	8168	44.6	0.018	8	4.8	20.6	4.6	0.002	NA	NA	ma101107_rel.cz11b_bee
470590	0	0	0.0	832.6	347.9	0.000	0.000	0.002	0.757	8430	44.5	0.018	8	4.8	20.6	4.5	0.002	NA	NA	ma101107_rel.cz11c_bee
463770	0	0	0.0	2466.4	347.0	0.000	0.000	0.005	0.766	8053	44.1	0.017	8	4.8	20.6	4.6	0.002	NA	NA	ma101107_rel.cz11d_bee
l.i1
l.i1: continue load after secondary indexes created with 50 inserts per transaction
Performance metrics for all DBMS, not just the ones listed above. Some are normalized by throughput, others are not. Legend for results is here.
ips	qps	rps	rmbps	wps	wmbps	rpq	rkbpq	wpi	wkbpi	csps	cpups	cspq	cpupq	dbgb1	dbgb2	rss	maxop	p50	p99	tag
48558	0	2074	8.1	5851.2	215.6	0.043	0.171	0.120	4.546	75160	75.3	1.548	124	6.7	22.5	6.6	0.294	12241	8239	ma101107_rel.cz11a_bee
40879	0	1767	6.9	5256.3	184.9	0.043	0.173	0.129	4.632	69802	66.4	1.708	130	6.7	22.9	6.6	0.515	10139	5394	ma101107_rel.cz11b_bee
38750	0	1430	5.6	3585.7	126.2	0.037	0.148	0.093	3.336	40856	59.5	1.054	123	8.5	25.8	10.2	1.143	10639	150	ma101107_rel.cz11c_bee
48324	0	2075	8.1	5865.6	215.7	0.043	0.172	0.121	4.570	75476	75.5	1.562	125	6.6	22.4	6.6	0.345	12191	7991	ma101107_rel.cz11d_bee
l.i2
l.i2: continue load after secondary indexes created with 5 inserts per transaction
Performance metrics for all DBMS, not just the ones listed above. Some are normalized by throughput, others are not. Legend for results is here.
ips	qps	rps	rmbps	wps	wmbps	rpq	rkbpq	wpi	wkbpi	csps	cpups	cspq	cpupq	dbgb1	dbgb2	rss	maxop	p50	p99	tag
22222	0	3118	12.2	2641.7	99.3	0.140	0.561	0.119	4.576	93789	73.6	4.221	265	6.7	22.5	6.5	0.145	5572	5049	ma101107_rel.cz11a_bee
21918	0	3078	12.0	2678.2	97.5	0.140	0.562	0.122	4.554	93517	72.6	4.267	265	6.7	22.9	6.5	0.237	5529	4215	ma101107_rel.cz11b_bee
19465	0	2765	10.8	2411.0	89.6	0.142	0.568	0.124	4.715	81767	65.7	4.201	270	8.5	25.8	10.5	0.283	5226	180	ma101107_rel.cz11c_bee
22112	0	3104	12.1	2633.4	98.9	0.140	0.561	0.119	4.582	93581	73.7	4.232	267	6.6	22.4	6.5	0.109	5546	4900	ma101107_rel.cz11d_bee
qr100.L1
qr100.L1: range queries with 100 insert/s per client
Performance metrics for all DBMS, not just the ones listed above. Some are normalized by throughput, others are not. Legend for results is here.
ips	qps	rps	rmbps	wps	wmbps	rpq	rkbpq	wpi	wkbpi	csps	cpups	cspq	cpupq	dbgb1	dbgb2	rss	maxop	p50	p99	tag
399	16259	10	0.0	9.3	0.6	0.001	0.003	0.023	1.645	61983	50.9	3.812	250	6.7	22.5	6.5	0.008	4029	3532	ma101107_rel.cz11a_bee
399	16028	14	0.1	8.2	0.6	0.001	0.003	0.021	1.524	61135	50.9	3.814	254	6.7	22.9	6.5	0.010	3996	3500	ma101107_rel.cz11b_bee
399	15989	12	0.0	2.2	0.4	0.001	0.003	0.006	1.131	60944	50.9	3.812	255	8.5	25.8	9.7	0.011	3980	3484	ma101107_rel.cz11c_bee
399	16092	12	0.0	19.7	0.9	0.001	0.003	0.049	2.406	61430	51.0	3.818	254	6.6	22.4	6.5	0.012	4012	3500	ma101107_rel.cz11d_bee
qp100.L2
qp100.L2: point queries with 100 insert/s per client
Performance metrics for all DBMS, not just the ones listed above. Some are normalized by throughput, others are not. Legend for results is here.
ips	qps	rps	rmbps	wps	wmbps	rpq	rkbpq	wpi	wkbpi	csps	cpups	cspq	cpupq	dbgb1	dbgb2	rss	maxop	p50	p99	tag
399	19804	13	0.1	21.2	1.0	0.001	0.003	0.053	2.520	78848	51.0	3.981	206	6.7	22.5	6.5	0.008	4981	4509	ma101107_rel.cz11a_bee
399	18924	14	0.1	20.0	0.9	0.001	0.003	0.050	2.391	74496	50.7	3.937	214	6.7	22.9	6.6	0.010	4797	3948	ma101107_rel.cz11b_bee
399	19178	13	0.0	2.6	0.5	0.001	0.003	0.007	1.158	75669	50.7	3.946	211	8.5	25.8	9.7	0.012	4908	3916	ma101107_rel.cz11c_bee
399	19075	14	0.1	25.4	1.1	0.001	0.003	0.064	2.834	75405	50.7	3.953	213	6.6	22.4	6.5	0.009	4891	3964	ma101107_rel.cz11d_bee
qr500.L3
qr500.L3: range queries with 500 insert/s per client
Performance metrics for all DBMS, not just the ones listed above. Some are normalized by throughput, others are not. Legend for results is here.
ips	qps	rps	rmbps	wps	wmbps	rpq	rkbpq	wpi	wkbpi	csps	cpups	cspq	cpupq	dbgb1	dbgb2	rss	maxop	p50	p99	tag
1993	16269	72	0.3	240.5	8.7	0.004	0.018	0.121	4.455	62602	52.6	3.848	259	6.7	22.5	6.5	0.024	4044	3532	ma101107_rel.cz11a_bee
1994	16138	73	0.3	245.5	8.6	0.005	0.018	0.123	4.429	62149	52.5	3.851	260	6.7	22.9	6.6	0.042	4013	3468	ma101107_rel.cz11b_bee
1993	16099	73	0.3	260.1	9.4	0.005	0.018	0.130	4.817	61896	52.4	3.845	260	8.5	25.8	9.7	0.121	4012	3436	ma101107_rel.cz11c_bee
1994	16294	72	0.3	227.2	8.3	0.004	0.018	0.114	4.258	62675	52.7	3.846	259	6.6	22.4	6.5	0.019	4076	3516	ma101107_rel.cz11d_bee
qp500.L4
qp500.L4: point queries with 500 insert/s per client
Performance metrics for all DBMS, not just the ones listed above. Some are normalized by throughput, others are not. Legend for results is here.
ips	qps	rps	rmbps	wps	wmbps	rpq	rkbpq	wpi	wkbpi	csps	cpups	cspq	cpupq	dbgb1	dbgb2	rss	maxop	p50	p99	tag
1994	19191	74	0.3	195.9	7.4	0.004	0.015	0.098	3.802	77261	52.4	4.026	218	6.7	22.5	6.5	0.019	4827	4395	ma101107_rel.cz11a_bee
1993	19189	74	0.3	202.0	7.4	0.004	0.015	0.101	3.810	77308	52.4	4.029	218	6.7	22.9	6.5	0.018	4855	4411	ma101107_rel.cz11b_bee
1994	19213	73	0.3	193.6	7.5	0.004	0.015	0.097	3.827	77145	52.5	4.015	219	8.5	25.8	9.7	0.017	4829	4427	ma101107_rel.cz11c_bee
1994	19208	73	0.3	211.7	7.8	0.004	0.015	0.106	4.025	77412	52.4	4.030	218	6.6	22.4	6.5	0.018	4859	4395	ma101107_rel.cz11d_bee
qr1000.L5
qr1000.L5: range queries with 1000 insert/s per client
Performance metrics for all DBMS, not just the ones listed above. Some are normalized by throughput, others are not. Legend for results is here.
ips	qps	rps	rmbps	wps	wmbps	rpq	rkbpq	wpi	wkbpi	csps	cpups	cspq	cpupq	dbgb1	dbgb2	rss	maxop	p50	p99	tag
3989	15856	137	0.5	425.7	15.8	0.009	0.035	0.107	4.053	61745	54.3	3.894	274	6.7	22.5	6.5	0.025	3931	3420	ma101107_rel.cz11a_bee
3989	15676	135	0.5	436.5	15.7	0.009	0.034	0.109	4.035	61213	54.2	3.905	277	6.7	22.9	6.5	0.077	3933	3404	ma101107_rel.cz11b_bee
3989	15638	136	0.5	456.3	16.8	0.009	0.035	0.114	4.301	60982	54.0	3.899	276	8.5	25.8	9.7	0.103	3900	3276	ma101107_rel.cz11c_bee
3989	15793	130	0.5	422.5	15.7	0.008	0.033	0.106	4.032	61493	54.3	3.894	275	6.6	22.4	6.5	0.040	3964	3404	ma101107_rel.cz11d_bee
qp1000.L6
qp1000.L6: point queries with 1000 insert/s per client
Performance metrics for all DBMS, not just the ones listed above. Some are normalized by throughput, others are not. Legend for results is here.
ips	qps	rps	rmbps	wps	wmbps	rpq	rkbpq	wpi	wkbpi	csps	cpups	cspq	cpupq	dbgb1	dbgb2	rss	maxop	p50	p99	tag
3989	18791	139	0.5	420.7	15.6	0.007	0.030	0.105	4.009	75952	55.2	4.042	235	6.7	22.5	6.5	0.016	4715	4413	ma101107_rel.cz11a_bee
3989	18808	141	0.6	440.2	15.8	0.007	0.030	0.110	4.060	76093	55.2	4.046	235	6.7	22.9	6.5	0.020	4731	4381	ma101107_rel.cz11b_bee
3989	18826	140	0.5	452.7	16.6	0.007	0.030	0.113	4.271	75807	55.3	4.027	235	8.5	25.8	9.7	0.063	4747	4381	ma101107_rel.cz11c_bee
3989	18780	144	0.6	422.9	15.7	0.008	0.031	0.106	4.028	75746	55.4	4.033	236	6.6	22.4	6.5	0.022	4717	3981	ma101107_rel.cz11d_bee
l.i0
- l.i0: load without secondary indexes
- Legend for results is here.
- Each entry lists the percentage of responses that fit in that bucket (slower than max time for previous bucket, faster than min time for next bucket).
Insert response time histogram
256us	1ms	4ms	16ms	64ms	256ms	1s	4s	16s	gt	max	tag
0.000	3.082	94.691	2.171	0.037	0.019	0.000	0.000	0.000	0.000	0.196	ma101107_rel.cz11a_bee
0.000	2.473	95.289	2.143	0.075	0.017	0.000	0.000	0.001	0.001	19.505	ma101107_rel.cz11b_bee
0.000	2.562	95.150	2.202	0.065	0.017	0.001	0.000	0.001	0.001	56.292	ma101107_rel.cz11c_bee
0.000	2.832	94.928	2.173	0.048	0.019	0.000	0.000	0.000	0.000	0.191	ma101107_rel.cz11d_bee
l.x
- l.x: create secondary indexes
- Legend for results is here.
- Each entry lists the percentage of responses that fit in that bucket (slower than max time for previous bucket, faster than min time for next bucket).
TODO - determine whether there is data for create index response time
l.i1
- l.i1: continue load after secondary indexes created with 50 inserts per transaction
- Legend for results is here.
- Each entry lists the percentage of responses that fit in that bucket (slower than max time for previous bucket, faster than min time for next bucket).
Insert response time histogram
256us	1ms	4ms	16ms	64ms	256ms	1s	4s	16s	gt	max	tag
0.000	0.000	63.882	35.728	0.380	0.010	nonzero	0.000	0.000	0.000	0.294	ma101107_rel.cz11a_bee
0.000	0.000	62.906	33.202	3.859	0.032	0.001	0.000	0.000	0.000	0.515	ma101107_rel.cz11b_bee
0.000	0.000	80.939	15.100	3.350	0.537	0.074	nonzero	0.000	0.000	1.143	ma101107_rel.cz11c_bee
0.000	0.000	63.224	36.385	0.381	0.009	nonzero	0.000	0.000	0.000	0.345	ma101107_rel.cz11d_bee
Delete response time histogram
256us	1ms	4ms	16ms	64ms	256ms	1s	4s	16s	gt	max	tag
0.000	0.000	77.259	22.493	0.240	0.008	nonzero	0.000	0.000	0.000	0.293	ma101107_rel.cz11a_bee
0.000	0.000	76.929	19.992	3.054	0.024	nonzero	0.000	0.000	0.000	0.352	ma101107_rel.cz11b_bee
0.000	nonzero	86.025	10.400	3.020	0.480	0.074	0.000	0.000	0.000	0.911	ma101107_rel.cz11c_bee
0.000	0.000	77.090	22.669	0.233	0.008	nonzero	0.000	0.000	0.000	0.339	ma101107_rel.cz11d_bee
l.i2
- l.i2: continue load after secondary indexes created with 5 inserts per transaction
- Legend for results is here.
- Each entry lists the percentage of responses that fit in that bucket (slower than max time for previous bucket, faster than min time for next bucket).
Insert response time histogram
256us	1ms	4ms	16ms	64ms	256ms	1s	4s	16s	gt	max	tag
0.011	82.903	15.979	1.102	0.004	0.001	0.000	0.000	0.000	0.000	0.145	ma101107_rel.cz11a_bee
0.072	83.677	14.958	1.227	0.065	0.001	0.000	0.000	0.000	0.000	0.237	ma101107_rel.cz11b_bee
0.348	85.303	12.647	1.099	0.590	0.013	nonzero	0.000	0.000	0.000	0.283	ma101107_rel.cz11c_bee
0.008	82.505	16.379	1.103	0.003	0.001	0.000	0.000	0.000	0.000	0.109	ma101107_rel.cz11d_bee
Delete response time histogram
256us	1ms	4ms	16ms	64ms	256ms	1s	4s	16s	gt	max	tag
0.026	83.191	15.635	1.143	0.004	0.001	0.000	0.000	0.000	0.000	0.144	ma101107_rel.cz11a_bee
0.125	83.946	14.618	1.252	0.057	0.001	0.000	0.000	0.000	0.000	0.220	ma101107_rel.cz11b_bee
0.573	85.326	12.461	1.103	0.525	0.012	nonzero	0.000	0.000	0.000	0.285	ma101107_rel.cz11c_bee
0.027	82.897	15.929	1.142	0.003	0.001	0.000	0.000	0.000	0.000	0.110	ma101107_rel.cz11d_bee
qr100.L1
- qr100.L1: range queries with 100 insert/s per client
- Legend for results is here.
- Each entry lists the percentage of responses that fit in that bucket (slower than max time for previous bucket, faster than min time for next bucket).
Query response time histogram
256us	1ms	4ms	16ms	64ms	256ms	1s	4s	16s	gt	max	tag
70.969	29.013	0.016	0.002	0.000	0.000	0.000	0.000	0.000	0.000	0.008	ma101107_rel.cz11a_bee
68.939	31.044	0.016	0.002	0.000	0.000	0.000	0.000	0.000	0.000	0.010	ma101107_rel.cz11b_bee
68.761	31.221	0.016	0.001	0.000	0.000	0.000	0.000	0.000	0.000	0.011	ma101107_rel.cz11c_bee
69.361	30.623	0.015	0.001	0.000	0.000	0.000	0.000	0.000	0.000	0.012	ma101107_rel.cz11d_bee
Insert response time histogram
256us	1ms	4ms	16ms	64ms	256ms	1s	4s	16s	gt	max	tag
0.000	0.000	57.799	42.194	0.007	0.000	0.000	0.000	0.000	0.000	0.019	ma101107_rel.cz11a_bee
0.000	0.000	87.910	12.090	0.000	0.000	0.000	0.000	0.000	0.000	0.012	ma101107_rel.cz11b_bee
0.000	0.000	74.403	25.597	0.000	0.000	0.000	0.000	0.000	0.000	0.016	ma101107_rel.cz11c_bee
0.000	0.000	75.174	24.826	0.000	0.000	0.000	0.000	0.000	0.000	0.014	ma101107_rel.cz11d_bee
Delete response time histogram
256us	1ms	4ms	16ms	64ms	256ms	1s	4s	16s	gt	max	tag
0.000	0.000	59.639	40.347	0.014	0.000	0.000	0.000	0.000	0.000	0.019	ma101107_rel.cz11a_bee
0.000	0.000	87.910	12.090	0.000	0.000	0.000	0.000	0.000	0.000	0.013	ma101107_rel.cz11b_bee
0.000	0.000	74.785	25.215	0.000	0.000	0.000	0.000	0.000	0.000	0.015	ma101107_rel.cz11c_bee
0.000	0.000	75.528	24.472	0.000	0.000	0.000	0.000	0.000	0.000	0.014	ma101107_rel.cz11d_bee
qp100.L2
- qp100.L2: point queries with 100 insert/s per client
- Legend for results is here.
- Each entry lists the percentage of responses that fit in that bucket (slower than max time for previous bucket, faster than min time for next bucket).
Query response time histogram
256us	1ms	4ms	16ms	64ms	256ms	1s	4s	16s	gt	max	tag
98.034	1.923	0.042	0.001	0.000	0.000	0.000	0.000	0.000	0.000	0.008	ma101107_rel.cz11a_bee
94.936	5.019	0.044	0.002	0.000	0.000	0.000	0.000	0.000	0.000	0.010	ma101107_rel.cz11b_bee
95.727	4.228	0.044	0.001	0.000	0.000	0.000	0.000	0.000	0.000	0.012	ma101107_rel.cz11c_bee
95.813	4.141	0.045	0.001	0.000	0.000	0.000	0.000	0.000	0.000	0.009	ma101107_rel.cz11d_bee
Insert response time histogram
256us	1ms	4ms	16ms	64ms	256ms	1s	4s	16s	gt	max	tag
0.000	0.000	81.306	18.694	0.000	0.000	0.000	0.000	0.000	0.000	0.015	ma101107_rel.cz11a_bee
0.000	0.000	87.646	12.354	0.000	0.000	0.000	0.000	0.000	0.000	0.015	ma101107_rel.cz11b_bee
0.000	0.000	75.514	24.486	0.000	0.000	0.000	0.000	0.000	0.000	0.015	ma101107_rel.cz11c_bee
0.000	0.000	86.646	13.347	0.007	0.000	0.000	0.000	0.000	0.000	0.016	ma101107_rel.cz11d_bee
Delete response time histogram
256us	1ms	4ms	16ms	64ms	256ms	1s	4s	16s	gt	max	tag
0.000	0.000	81.500	18.500	0.000	0.000	0.000	0.000	0.000	0.000	0.014	ma101107_rel.cz11a_bee
0.000	0.000	87.785	12.215	0.000	0.000	0.000	0.000	0.000	0.000	0.016	ma101107_rel.cz11b_bee
0.000	0.000	75.826	24.167	0.007	0.000	0.000	0.000	0.000	0.000	0.017	ma101107_rel.cz11c_bee
0.000	0.000	86.625	13.375	0.000	0.000	0.000	0.000	0.000	0.000	0.015	ma101107_rel.cz11d_bee
qr500.L3
- qr500.L3: range queries with 500 insert/s per client
- Legend for results is here.
- Each entry lists the percentage of responses that fit in that bucket (slower than max time for previous bucket, faster than min time for next bucket).
Query response time histogram
256us	1ms	4ms	16ms	64ms	256ms	1s	4s	16s	gt	max	tag
72.673	27.227	0.088	0.012	nonzero	0.000	0.000	0.000	0.000	0.000	0.024	ma101107_rel.cz11a_bee
71.593	28.304	0.087	0.016	nonzero	0.000	0.000	0.000	0.000	0.000	0.042	ma101107_rel.cz11b_bee
71.673	28.212	0.095	0.018	0.002	nonzero	0.000	0.000	0.000	0.000	0.121	ma101107_rel.cz11c_bee
72.381	27.521	0.087	0.011	nonzero	0.000	0.000	0.000	0.000	0.000	0.019	ma101107_rel.cz11d_bee
Insert response time histogram
256us	1ms	4ms	16ms	64ms	256ms	1s	4s	16s	gt	max	tag
0.000	0.000	93.333	6.599	0.068	0.000	0.000	0.000	0.000	0.000	0.040	ma101107_rel.cz11a_bee
0.000	0.000	93.126	6.711	0.161	0.001	0.000	0.000	0.000	0.000	0.065	ma101107_rel.cz11b_bee
0.000	0.000	92.004	7.714	0.265	0.017	0.000	0.000	0.000	0.000	0.146	ma101107_rel.cz11c_bee
0.000	0.000	93.469	6.476	0.054	0.000	0.000	0.000	0.000	0.000	0.030	ma101107_rel.cz11d_bee
Delete response time histogram
256us	1ms	4ms	16ms	64ms	256ms	1s	4s	16s	gt	max	tag
0.000	0.000	95.182	4.783	0.035	0.000	0.000	0.000	0.000	0.000	0.040	ma101107_rel.cz11a_bee
0.000	0.000	95.106	4.814	0.081	0.000	0.000	0.000	0.000	0.000	0.039	ma101107_rel.cz11b_bee
0.000	0.000	94.540	5.317	0.139	0.004	0.000	0.000	0.000	0.000	0.134	ma101107_rel.cz11c_bee
0.000	0.000	95.265	4.715	0.019	0.000	0.000	0.000	0.000	0.000	0.029	ma101107_rel.cz11d_bee
qp500.L4
- qp500.L4: point queries with 500 insert/s per client
- Legend for results is here.
- Each entry lists the percentage of responses that fit in that bucket (slower than max time for previous bucket, faster than min time for next bucket).
Query response time histogram
256us	1ms	4ms	16ms	64ms	256ms	1s	4s	16s	gt	max	tag
96.132	3.759	0.099	0.010	nonzero	0.000	0.000	0.000	0.000	0.000	0.019	ma101107_rel.cz11a_bee
95.938	3.943	0.108	0.012	nonzero	0.000	0.000	0.000	0.000	0.000	0.018	ma101107_rel.cz11b_bee
96.086	3.794	0.108	0.012	nonzero	0.000	0.000	0.000	0.000	0.000	0.017	ma101107_rel.cz11c_bee
96.113	3.766	0.110	0.011	nonzero	0.000	0.000	0.000	0.000	0.000	0.018	ma101107_rel.cz11d_bee
Insert response time histogram
256us	1ms	4ms	16ms	64ms	256ms	1s	4s	16s	gt	max	tag
0.000	0.000	95.129	4.835	0.036	0.000	0.000	0.000	0.000	0.000	0.030	ma101107_rel.cz11a_bee
0.000	0.000	92.156	7.754	0.090	0.000	0.000	0.000	0.000	0.000	0.040	ma101107_rel.cz11b_bee
0.000	0.000	90.347	9.496	0.157	0.000	0.000	0.000	0.000	0.000	0.048	ma101107_rel.cz11c_bee
0.000	0.000	93.353	6.603	0.044	0.000	0.000	0.000	0.000	0.000	0.039	ma101107_rel.cz11d_bee
Delete response time histogram
256us	1ms	4ms	16ms	64ms	256ms	1s	4s	16s	gt	max	tag
0.000	0.000	96.296	3.690	0.014	0.000	0.000	0.000	0.000	0.000	0.028	ma101107_rel.cz11a_bee
0.000	0.000	94.221	5.740	0.039	0.000	0.000	0.000	0.000	0.000	0.040	ma101107_rel.cz11b_bee
0.000	0.000	93.086	6.818	0.096	0.000	0.000	0.000	0.000	0.000	0.044	ma101107_rel.cz11c_bee
0.000	0.000	95.157	4.821	0.022	0.000	0.000	0.000	0.000	0.000	0.039	ma101107_rel.cz11d_bee
qr1000.L5
- qr1000.L5: range queries with 1000 insert/s per client
- Legend for results is here.
- Each entry lists the percentage of responses that fit in that bucket (slower than max time for previous bucket, faster than min time for next bucket).
Query response time histogram
256us	1ms	4ms	16ms	64ms	256ms	1s	4s	16s	gt	max	tag
72.121	27.597	0.255	0.027	nonzero	0.000	0.000	0.000	0.000	0.000	0.025	ma101107_rel.cz11a_bee
70.838	28.872	0.254	0.034	0.001	nonzero	0.000	0.000	0.000	0.000	0.077	ma101107_rel.cz11b_bee
71.344	28.328	0.283	0.040	0.004	nonzero	0.000	0.000	0.000	0.000	0.103	ma101107_rel.cz11c_bee
71.551	28.145	0.278	0.026	nonzero	0.000	0.000	0.000	0.000	0.000	0.040	ma101107_rel.cz11d_bee
Insert response time histogram
256us	1ms	4ms	16ms	64ms	256ms	1s	4s	16s	gt	max	tag
0.000	0.000	73.843	25.893	0.264	0.000	0.000	0.000	0.000	0.000	0.042	ma101107_rel.cz11a_bee
0.000	0.000	72.099	27.505	0.395	0.001	0.000	0.000	0.000	0.000	0.069	ma101107_rel.cz11b_bee
0.000	0.000	71.402	27.980	0.610	0.008	0.000	0.000	0.000	0.000	0.133	ma101107_rel.cz11c_bee
0.000	0.000	69.611	30.113	0.276	0.000	0.000	0.000	0.000	0.000	0.039	ma101107_rel.cz11d_bee
Delete response time histogram
256us	1ms	4ms	16ms	64ms	256ms	1s	4s	16s	gt	max	tag
0.000	0.000	79.099	20.728	0.174	0.000	0.000	0.000	0.000	0.000	0.044	ma101107_rel.cz11a_bee
0.000	0.000	77.497	22.257	0.245	0.001	0.000	0.000	0.000	0.000	0.071	ma101107_rel.cz11b_bee
0.000	0.000	76.966	22.653	0.380	0.001	0.000	0.000	0.000	0.000	0.108	ma101107_rel.cz11c_bee
0.000	0.000	75.333	24.503	0.164	0.000	0.000	0.000	0.000	0.000	0.042	ma101107_rel.cz11d_bee
qp1000.L6
- qp1000.L6: point queries with 1000 insert/s per client
- Legend for results is here.
- Each entry lists the percentage of responses that fit in that bucket (slower than max time for previous bucket, faster than min time for next bucket).
Query response time histogram
256us	1ms	4ms	16ms	64ms	256ms	1s	4s	16s	gt	max	tag
93.645	6.233	0.111	0.012	nonzero	0.000	0.000	0.000	0.000	0.000	0.016	ma101107_rel.cz11a_bee
93.720	6.162	0.107	0.011	nonzero	0.000	0.000	0.000	0.000	0.000	0.020	ma101107_rel.cz11b_bee
93.542	6.339	0.108	0.011	nonzero	0.000	0.000	0.000	0.000	0.000	0.063	ma101107_rel.cz11c_bee
93.194	6.697	0.098	0.011	nonzero	0.000	0.000	0.000	0.000	0.000	0.022	ma101107_rel.cz11d_bee
Insert response time histogram
256us	1ms	4ms	16ms	64ms	256ms	1s	4s	16s	gt	max	tag
0.000	0.000	76.844	22.881	0.276	0.000	0.000	0.000	0.000	0.000	0.038	ma101107_rel.cz11a_bee
0.000	0.000	80.263	19.380	0.358	0.000	0.000	0.000	0.000	0.000	0.050	ma101107_rel.cz11b_bee
0.000	0.000	78.049	21.422	0.526	0.003	0.000	0.000	0.000	0.000	0.071	ma101107_rel.cz11c_bee
0.000	0.000	82.680	17.042	0.278	0.000	0.000	0.000	0.000	0.000	0.044	ma101107_rel.cz11d_bee
Delete response time histogram
256us	1ms	4ms	16ms	64ms	256ms	1s	4s	16s	gt	max	tag
0.000	0.000	81.510	18.310	0.181	0.000	0.000	0.000	0.000	0.000	0.042	ma101107_rel.cz11a_bee
0.000	0.000	84.139	15.667	0.194	0.000	0.000	0.000	0.000	0.000	0.038	ma101107_rel.cz11b_bee
0.000	0.000	82.430	17.262	0.308	0.001	0.000	0.000	0.000	0.000	0.064	ma101107_rel.cz11c_bee
0.000	0.000	86.371	13.469	0.160	0.000	0.000	0.000	0.000	0.000	0.051	ma101107_rel.cz11d_bee