Introduction
This is a report for the insert benchmark with 32M docs and 4 client(s). It is generated by scripts (bash, awk, sed) and Tufte might not be impressed. An overview of the insert benchmark is here and a short update is here. Below, by DBMS, I mean DBMS+version.config. An example is my8020.c10b40 where my means MySQL, 8020 is version 8.0.20 and c10b40 is the name for the configuration file.
The test server has 8 AMD cores, 16G RAM and an NVMe SSD. It is described here as the Beelink. The benchmark was run with 1 client and there were 1 or 3 connections per client (1 for queries or inserts without rate limits, 1+1 for rate limited inserts+deletes). It uses 4 tables with a table per client. It loads 8M rows per table without secondary indexes, creates 3 secondary indexes per table, then inserts 40m+10m rows per table with a delete per insert to avoid growing the table. It then does 6 read+write tests for 1800s each that do queries as fast as possible with 100,100,500,500,1000,1000 inserts/s and the same for deletes/s per client concurrent with the queries. The database is cached in memory. Clients and the DBMS share one server. The per-database configs are in the per-database subdirectories here.
The tested DBMS are:
- ma100244_rel.cz11a_bee - MariaDB 10.2.44 with the cz11a_bee config that uses innodb_flush_method=O_DIRECT_NO_FSYNC
- ma100339_rel.cz11a_bee - MariaDB 10.3.39 with the cz11a_bee config
- ma100433_rel.cz11a_bee - MariaDB 10.4.33 with the cz11a_bee config
- ma100524_rel.cz11a_bee - MariaDB 10.5.24 with the cz11a_bee config
- ma100617_rel.cz11a_bee - MariaDB 10.6.17 with the cz11a_bee config
- ma101107_rel.cz11a_bee - MariaDB 10.11.7 with the cz11a_bee config
- ma101107_rel.cz11b_bee - MariaDB 10.11.7 with the cz11b_bee config that uses innodb_flush_method=O_DIRECT
- ma101107_rel.cz11c_bee - MariaDB 10.11.7 with the cz11c_bee config that uses innodb_flush_method=fsync
- ma101107_rel.cz11d_bee - MariaDB 10.11.7 with the cz11d_bee config that uses innodb_change_buffering=all
- ma110401_rel.cz11b_bee - MariaDB 11.4.1 with the cz11b_bee config that uses innodb_flush_method=O_DIRECT
- ma110401_rel.cz11c_bee - MariaDB 11.4.1 with the cz11c_bee config that uses innodb_flush_method=fsync
Contents
- Summary
- l.i0: load without secondary indexes
- l.x: create secondary indexes
- l.i1: continue load after secondary indexes created with 50 inserts per transaction
- l.i2: continue load after secondary indexes created with 5 inserts per transaction
- qr100.L1: range queries with 100 insert/s per client
- qp100.L2: point queries with 100 insert/s per client
- qr500.L3: range queries with 500 insert/s per client
- qp500.L4: point queries with 500 insert/s per client
- qr1000.L5: range queries with 1000 insert/s per client
- qp1000.L6: point queries with 1000 insert/s per client
Summary
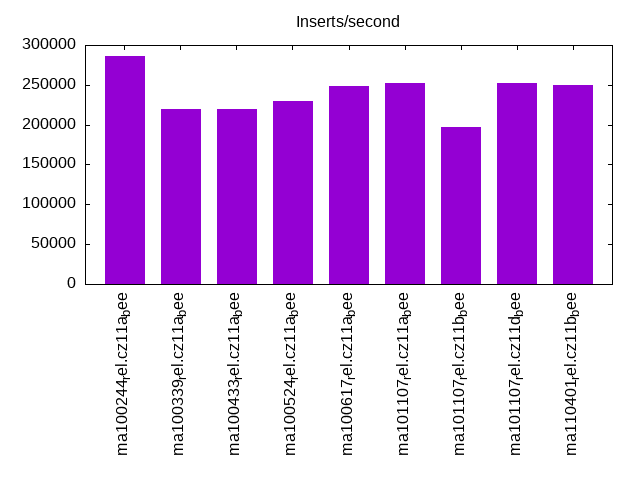
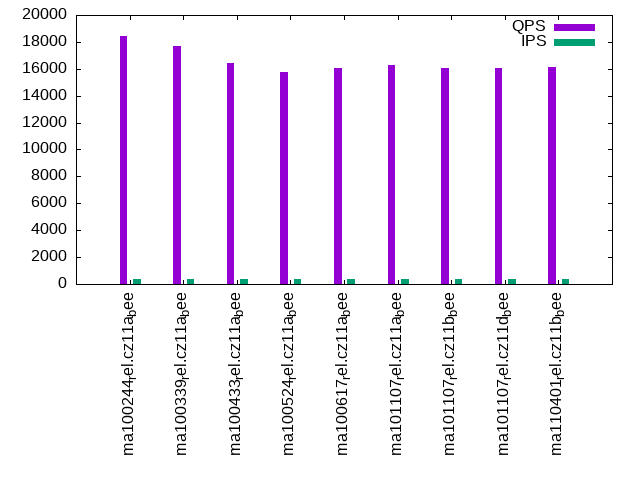
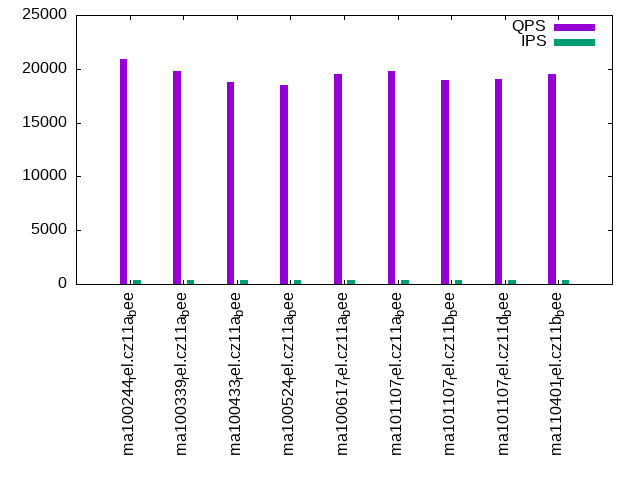
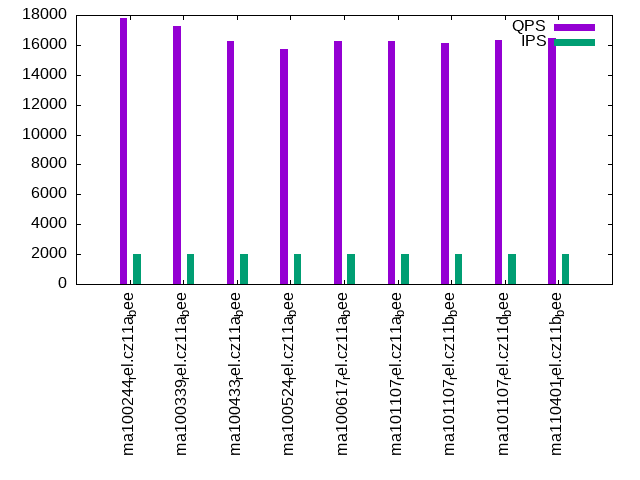
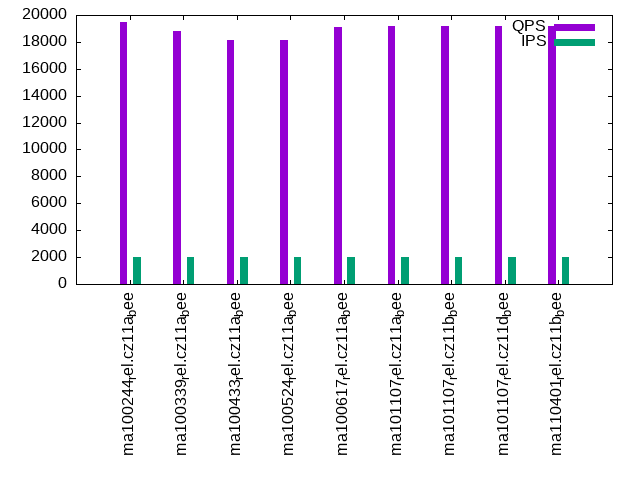
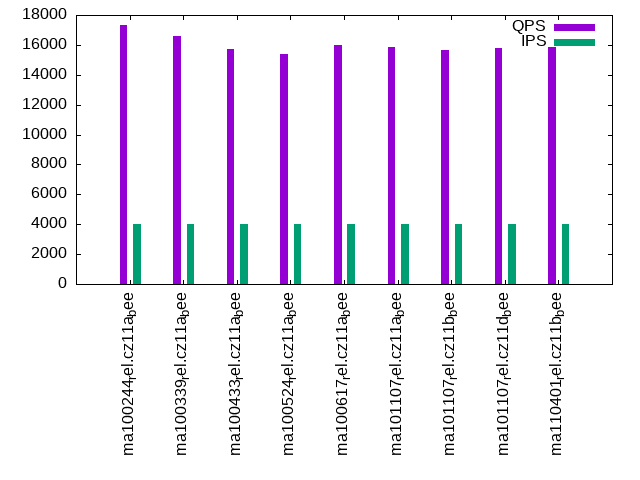
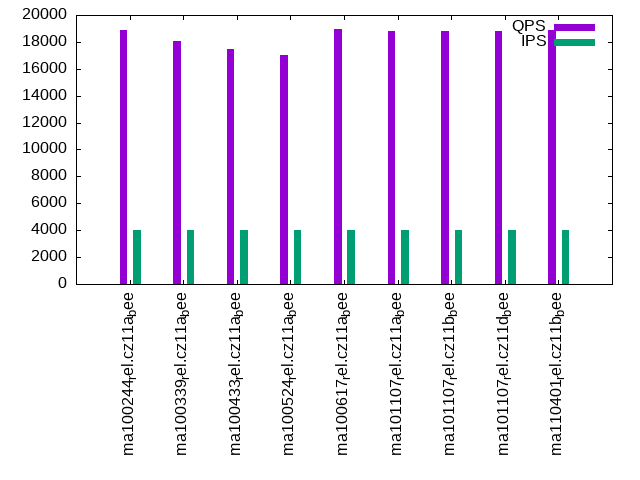
The numbers are inserts/s for l.i0, l.i1 and l.i2, indexed docs (or rows) /s for l.x and queries/s for qr100, qp100 thru qr1000, qp1000" The values are the average rate over the entire test for inserts (IPS) and queries (QPS). The range of values for IPS and QPS is split into 3 parts: bottom 25%, middle 50%, top 25%. Values in the bottom 25% have a red background, values in the top 25% have a green background and values in the middle have no color. A gray background is used for values that can be ignored because the DBMS did not sustain the target insert rate. Red backgrounds are not used when the minimum value is within 80% of the max value.
| dbms | l.i0 | l.x | l.i1 | l.i2 | qr100 | qp100 | qr500 | qp500 | qr1000 | qp1000 |
|---|---|---|---|---|---|---|---|---|---|---|
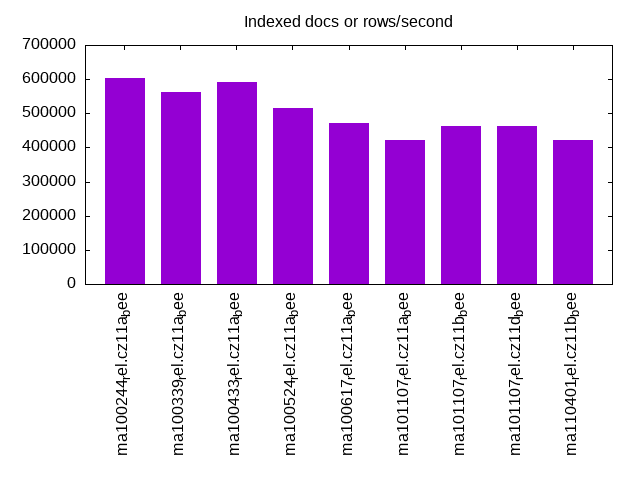
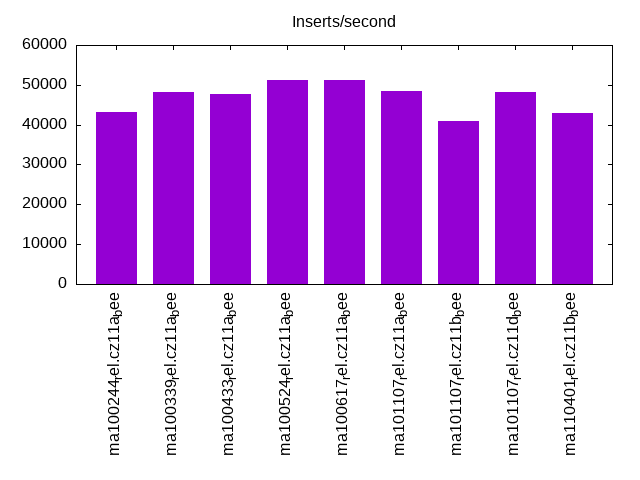
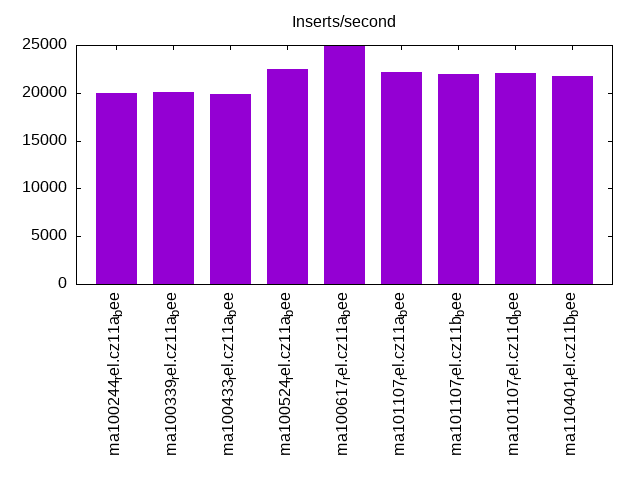
| ma100244_rel.cz11a_bee | 285714 | 603775 | 43278 | 19990 | 18411 | 20957 | 17799 | 19513 | 17320 | 18897 |
| ma100339_rel.cz11a_bee | 219178 | 561405 | 48106 | 20090 | 17720 | 19830 | 17258 | 18796 | 16575 | 18093 |
| ma100433_rel.cz11a_bee | 219178 | 592594 | 47591 | 19920 | 16424 | 18731 | 16258 | 18135 | 15744 | 17476 |
| ma100524_rel.cz11a_bee | 230216 | 516131 | 51184 | 22522 | 15786 | 18452 | 15725 | 18167 | 15412 | 17035 |
| ma100617_rel.cz11a_bee | 248062 | 470590 | 51249 | 24891 | 16040 | 19524 | 16238 | 19138 | 15971 | 18966 |
| ma101107_rel.cz11a_bee | 251968 | 421054 | 48558 | 22222 | 16259 | 19804 | 16269 | 19191 | 15856 | 18791 |
| ma101107_rel.cz11b_bee | 197531 | 463770 | 40879 | 21918 | 16028 | 18924 | 16138 | 19189 | 15676 | 18808 |
| ma101107_rel.cz11d_bee | 251968 | 463770 | 48324 | 22112 | 16092 | 19075 | 16294 | 19208 | 15793 | 18780 |
| ma110401_rel.cz11b_bee | 250000 | 421054 | 42941 | 21751 | 16142 | 19489 | 16469 | 19158 | 15856 | 18863 |
This table has relative throughput, throughput for the DBMS relative to the DBMS in the first line, using the absolute throughput from the previous table. Values less than 0.95 have a yellow background. Values greater than 1.05 have a blue background.
| dbms | l.i0 | l.x | l.i1 | l.i2 | qr100 | qp100 | qr500 | qp500 | qr1000 | qp1000 |
|---|---|---|---|---|---|---|---|---|---|---|
| ma100244_rel.cz11a_bee | 1.00 | 1.00 | 1.00 | 1.00 | 1.00 | 1.00 | 1.00 | 1.00 | 1.00 | 1.00 |
| ma100339_rel.cz11a_bee | 0.77 | 0.93 | 1.11 | 1.01 | 0.96 | 0.95 | 0.97 | 0.96 | 0.96 | 0.96 |
| ma100433_rel.cz11a_bee | 0.77 | 0.98 | 1.10 | 1.00 | 0.89 | 0.89 | 0.91 | 0.93 | 0.91 | 0.92 |
| ma100524_rel.cz11a_bee | 0.81 | 0.85 | 1.18 | 1.13 | 0.86 | 0.88 | 0.88 | 0.93 | 0.89 | 0.90 |
| ma100617_rel.cz11a_bee | 0.87 | 0.78 | 1.18 | 1.25 | 0.87 | 0.93 | 0.91 | 0.98 | 0.92 | 1.00 |
| ma101107_rel.cz11a_bee | 0.88 | 0.70 | 1.12 | 1.11 | 0.88 | 0.94 | 0.91 | 0.98 | 0.92 | 0.99 |
| ma101107_rel.cz11b_bee | 0.69 | 0.77 | 0.94 | 1.10 | 0.87 | 0.90 | 0.91 | 0.98 | 0.91 | 1.00 |
| ma101107_rel.cz11d_bee | 0.88 | 0.77 | 1.12 | 1.11 | 0.87 | 0.91 | 0.92 | 0.98 | 0.91 | 0.99 |
| ma110401_rel.cz11b_bee | 0.88 | 0.70 | 0.99 | 1.09 | 0.88 | 0.93 | 0.93 | 0.98 | 0.92 | 1.00 |
This lists the average rate of inserts/s for the tests that do inserts concurrent with queries. For such tests the query rate is listed in the table above. The read+write tests are setup so that the insert rate should match the target rate every second. Cells that are not at least 95% of the target have a red background to indicate a failure to satisfy the target.
| dbms | qr100.L1 | qp100.L2 | qr500.L3 | qp500.L4 | qr1000.L5 | qp1000.L6 |
|---|---|---|---|---|---|---|
| ma100244_rel.cz11a_bee | 399 | 399 | 1994 | 1994 | 3989 | 3989 |
| ma100339_rel.cz11a_bee | 399 | 399 | 1994 | 1994 | 3987 | 3987 |
| ma100433_rel.cz11a_bee | 399 | 399 | 1994 | 1994 | 3989 | 3989 |
| ma100524_rel.cz11a_bee | 399 | 399 | 1993 | 1994 | 3989 | 3989 |
| ma100617_rel.cz11a_bee | 399 | 399 | 1994 | 1994 | 3989 | 3989 |
| ma101107_rel.cz11a_bee | 399 | 399 | 1993 | 1994 | 3989 | 3989 |
| ma101107_rel.cz11b_bee | 399 | 399 | 1994 | 1993 | 3989 | 3989 |
| ma101107_rel.cz11d_bee | 399 | 399 | 1994 | 1994 | 3989 | 3989 |
| ma110401_rel.cz11b_bee | 399 | 399 | 1993 | 1994 | 3989 | 3989 |
| target | 400 | 400 | 2000 | 2000 | 4000 | 4000 |
l.i0
l.i0: load without secondary indexes. Graphs for performance per 1-second interval are here.
Average throughput:
Insert response time histogram: each cell has the percentage of responses that take <= the time in the header and max is the max response time in seconds. For the max column values in the top 25% of the range have a red background and in the bottom 25% of the range have a green background. The red background is not used when the min value is within 80% of the max value.
| dbms | 256us | 1ms | 4ms | 16ms | 64ms | 256ms | 1s | 4s | 16s | gt | max |
|---|---|---|---|---|---|---|---|---|---|---|---|
| ma100244_rel.cz11a_bee | 12.431 | 86.986 | 0.549 | 0.017 | 0.016 | 0.150 | |||||
| ma100339_rel.cz11a_bee | 1.176 | 97.269 | 1.509 | 0.029 | 0.016 | 0.154 | |||||
| ma100433_rel.cz11a_bee | 0.385 | 98.043 | 1.526 | 0.030 | 0.016 | 0.147 | |||||
| ma100524_rel.cz11a_bee | 0.961 | 97.745 | 1.038 | 0.236 | 0.020 | 0.146 | |||||
| ma100617_rel.cz11a_bee | 0.795 | 96.750 | 2.400 | 0.034 | 0.020 | 0.217 | |||||
| ma101107_rel.cz11a_bee | 3.082 | 94.691 | 2.171 | 0.037 | 0.019 | 0.196 | |||||
| ma101107_rel.cz11b_bee | 2.473 | 95.289 | 2.143 | 0.075 | 0.017 | 0.001 | 0.001 | 19.505 | |||
| ma101107_rel.cz11d_bee | 2.832 | 94.928 | 2.173 | 0.048 | 0.019 | 0.191 | |||||
| ma110401_rel.cz11b_bee | 2.108 | 95.707 | 2.125 | 0.040 | 0.019 | 0.200 |
Performance metrics for the DBMS listed above. Some are normalized by throughput, others are not. Legend for results is here.
ips	qps	rps	rmbps	wps	wmbps	rpq	rkbpq	wpi	wkbpi	csps	cpups	cspq	cpupq	dbgb1	dbgb2	rss	maxop	p50	p99	tag
285714	0	1	0.0	1029.7	92.3	0.000	0.000	0.004	0.331	29836	70.8	0.104	20	2.1	18.0	2.2	0.150	80940	58636	ma100244_rel.cz11a_bee
219178	0	0	0.0	876.5	77.9	0.000	0.000	0.004	0.364	33696	78.0	0.154	28	2.1	18.0	2.7	0.154	60624	44251	ma100339_rel.cz11a_bee
219178	0	0	0.0	904.1	78.4	0.000	0.000	0.004	0.366	33638	78.5	0.153	29	2.1	18.0	NA	0.147	60709	46349	ma100433_rel.cz11a_bee
230216	0	0	0.0	1458.8	72.3	0.000	0.000	0.006	0.322	54636	72.4	0.237	25	2.1	18.0	2.3	0.146	63930	47648	ma100524_rel.cz11a_bee
248062	0	0	0.0	756.3	62.4	0.000	0.000	0.003	0.258	40632	73.6	0.164	24	2.1	18.0	2.3	0.217	69125	52843	ma100617_rel.cz11a_bee
251968	0	0	0.0	825.8	65.9	0.000	0.000	0.003	0.268	30027	73.1	0.119	23	2.1	18.0	2.3	0.196	70388	54159	ma101107_rel.cz11a_bee
197531	0	0	0.0	676.1	51.6	0.000	0.000	0.003	0.267	24320	58.4	0.123	24	2.1	18.0	2.3	19.505	68226	0	ma101107_rel.cz11b_bee
251968	0	0	0.0	825.0	65.8	0.000	0.000	0.003	0.267	30437	73.1	0.121	23	2.1	18.0	2.3	0.191	69924	54141	ma101107_rel.cz11d_bee
250000	0	0	0.0	831.5	65.9	0.000	0.000	0.003	0.270	30993	73.2	0.124	23	2.1	18.0	2.3	0.200	69724	50046	ma110401_rel.cz11b_bee
l.x
l.x: create secondary indexes.
Average throughput:
Performance metrics for the DBMS listed above. Some are normalized by throughput, others are not. Legend for results is here.
ips	qps	rps	rmbps	wps	wmbps	rpq	rkbpq	wpi	wkbpi	csps	cpups	cspq	cpupq	dbgb1	dbgb2	rss	maxop	p50	p99	tag
603775	0	0	0.0	2291.6	453.7	0.000	0.000	0.004	0.769	19800	45.7	0.033	6	4.9	20.7	3.0	0.002	NA	NA	ma100244_rel.cz11a_bee
561405	0	0	0.0	2215.1	420.6	0.000	0.000	0.004	0.767	19957	46.6	0.036	7	4.9	20.7	2.9	0.002	NA	NA	ma100339_rel.cz11a_bee
592594	0	0	0.0	2288.0	446.9	0.000	0.000	0.004	0.772	18213	45.6	0.031	6	4.8	20.6	NA	0.002	NA	NA	ma100433_rel.cz11a_bee
516131	0	0	0.0	773.5	350.9	0.000	0.000	0.001	0.696	1920	44.8	0.004	7	4.8	20.6	5.0	0.002	NA	NA	ma100524_rel.cz11a_bee
470590	0	0	0.0	2583.4	351.8	0.000	0.000	0.005	0.766	8846	43.9	0.019	7	4.8	20.6	4.6	0.002	NA	NA	ma100617_rel.cz11a_bee
421054	0	0	0.0	2409.0	307.4	0.000	0.000	0.006	0.748	8497	41.3	0.020	8	4.8	20.6	4.4	0.002	NA	NA	ma101107_rel.cz11a_bee
463770	0	0	0.0	2475.2	329.4	0.000	0.000	0.005	0.727	8168	44.6	0.018	8	4.8	20.6	4.6	0.002	NA	NA	ma101107_rel.cz11b_bee
463770	0	0	0.0	2466.4	347.0	0.000	0.000	0.005	0.766	8053	44.1	0.017	8	4.8	20.6	4.6	0.002	NA	NA	ma101107_rel.cz11d_bee
421054	0	0	0.0	2302.8	305.9	0.000	0.000	0.005	0.744	7891	41.8	0.019	8	4.8	20.6	4.3	0.002	NA	NA	ma110401_rel.cz11b_bee
l.i1
l.i1: continue load after secondary indexes created with 50 inserts per transaction. Graphs for performance per 1-second interval are here.
Average throughput:
Insert response time histogram: each cell has the percentage of responses that take <= the time in the header and max is the max response time in seconds. For the max column values in the top 25% of the range have a red background and in the bottom 25% of the range have a green background. The red background is not used when the min value is within 80% of the max value.
| dbms | 256us | 1ms | 4ms | 16ms | 64ms | 256ms | 1s | 4s | 16s | gt | max |
|---|---|---|---|---|---|---|---|---|---|---|---|
| ma100244_rel.cz11a_bee | 62.852 | 35.788 | 1.359 | 0.001 | 0.128 | ||||||
| ma100339_rel.cz11a_bee | 71.086 | 28.018 | 0.890 | 0.006 | 0.170 | ||||||
| ma100433_rel.cz11a_bee | 70.290 | 28.778 | 0.927 | 0.005 | 0.168 | ||||||
| ma100524_rel.cz11a_bee | 72.617 | 27.129 | 0.196 | 0.015 | 0.043 | nonzero | 1.234 | ||||
| ma100617_rel.cz11a_bee | 65.785 | 34.034 | 0.168 | 0.013 | nonzero | 0.342 | |||||
| ma101107_rel.cz11a_bee | 63.882 | 35.728 | 0.380 | 0.010 | nonzero | 0.294 | |||||
| ma101107_rel.cz11b_bee | 62.906 | 33.202 | 3.859 | 0.032 | 0.001 | 0.515 | |||||
| ma101107_rel.cz11d_bee | 63.224 | 36.385 | 0.381 | 0.009 | nonzero | 0.345 | |||||
| ma110401_rel.cz11b_bee | 65.331 | 31.546 | 3.101 | 0.022 | nonzero | 0.441 |
Delete response time histogram: each cell has the percentage of responses that take <= the time in the header and max is the max response time in seconds. For the max column values in the top 25% of the range have a red background and in the bottom 25% of the range have a green background. The red background is not used when the min value is within 80% of the max value.
| dbms | 256us | 1ms | 4ms | 16ms | 64ms | 256ms | 1s | 4s | 16s | gt | max |
|---|---|---|---|---|---|---|---|---|---|---|---|
| ma100244_rel.cz11a_bee | 64.067 | 34.791 | 1.141 | 0.001 | 0.130 | ||||||
| ma100339_rel.cz11a_bee | 72.320 | 26.911 | 0.763 | 0.006 | 0.165 | ||||||
| ma100433_rel.cz11a_bee | 71.681 | 27.516 | 0.798 | 0.005 | 0.170 | ||||||
| ma100524_rel.cz11a_bee | 75.498 | 24.289 | 0.156 | 0.014 | 0.043 | 0.993 | |||||
| ma100617_rel.cz11a_bee | 85.049 | 14.845 | 0.096 | 0.010 | nonzero | 0.341 | |||||
| ma101107_rel.cz11a_bee | 77.259 | 22.493 | 0.240 | 0.008 | nonzero | 0.293 | |||||
| ma101107_rel.cz11b_bee | 76.929 | 19.992 | 3.054 | 0.024 | nonzero | 0.352 | |||||
| ma101107_rel.cz11d_bee | 77.090 | 22.669 | 0.233 | 0.008 | nonzero | 0.339 | |||||
| ma110401_rel.cz11b_bee | 75.804 | 21.729 | 2.449 | 0.017 | nonzero | 0.324 |
Performance metrics for the DBMS listed above. Some are normalized by throughput, others are not. Legend for results is here.
ips	qps	rps	rmbps	wps	wmbps	rpq	rkbpq	wpi	wkbpi	csps	cpups	cspq	cpupq	dbgb1	dbgb2	rss	maxop	p50	p99	tag
43278	0	0	0.0	5145.7	193.4	0.000	0.000	0.119	4.575	28072	85.4	0.649	158	7.8	23.9	8.9	0.128	10788	8038	ma100244_rel.cz11a_bee
48106	0	0	0.0	5105.7	190.4	0.000	0.000	0.106	4.054	29752	84.6	0.618	141	8.2	24.7	9.4	0.170	12086	8740	ma100339_rel.cz11a_bee
47591	0	0	0.0	5223.2	193.1	0.000	0.000	0.110	4.156	29832	84.5	0.627	142	8.2	24.7	NA	0.168	11937	8787	ma100433_rel.cz11a_bee
51184	0	0	0.0	9666.9	309.3	0.000	0.000	0.189	6.187	72506	84.6	1.417	132	8.2	25.6	9.4	1.234	13235	200	ma100524_rel.cz11a_bee
51249	0	0	0.0	6264.5	226.6	0.000	0.000	0.122	4.527	96959	80.6	1.892	126	6.7	22.7	6.8	0.342	12983	7841	ma100617_rel.cz11a_bee
48558	0	2074	8.1	5851.2	215.6	0.043	0.171	0.120	4.546	75160	75.3	1.548	124	6.7	22.5	6.6	0.294	12241	8239	ma101107_rel.cz11a_bee
40879	0	1767	6.9	5256.3	184.9	0.043	0.173	0.129	4.632	69802	66.4	1.708	130	6.7	22.9	6.6	0.515	10139	5394	ma101107_rel.cz11b_bee
48324	0	2075	8.1	5865.6	215.7	0.043	0.172	0.121	4.570	75476	75.5	1.562	125	6.6	22.4	6.6	0.345	12191	7991	ma101107_rel.cz11d_bee
42941	0	1836	7.2	5427.5	192.4	0.043	0.171	0.126	4.589	70644	67.5	1.645	126	6.6	22.5	6.5	0.441	10788	6443	ma110401_rel.cz11b_bee
l.i2
l.i2: continue load after secondary indexes created with 5 inserts per transaction. Graphs for performance per 1-second interval are here.
Average throughput:
Insert response time histogram: each cell has the percentage of responses that take <= the time in the header and max is the max response time in seconds. For the max column values in the top 25% of the range have a red background and in the bottom 25% of the range have a green background. The red background is not used when the min value is within 80% of the max value.
| dbms | 256us | 1ms | 4ms | 16ms | 64ms | 256ms | 1s | 4s | 16s | gt | max |
|---|---|---|---|---|---|---|---|---|---|---|---|
| ma100244_rel.cz11a_bee | 0.003 | 78.024 | 20.126 | 1.835 | 0.011 | 0.001 | 0.090 | ||||
| ma100339_rel.cz11a_bee | 0.003 | 79.533 | 18.417 | 2.012 | 0.034 | 0.001 | 0.078 | ||||
| ma100433_rel.cz11a_bee | 0.001 | 79.009 | 18.998 | 1.950 | 0.040 | 0.001 | 0.080 | ||||
| ma100524_rel.cz11a_bee | 0.012 | 82.944 | 16.327 | 0.650 | 0.065 | nonzero | 0.072 | ||||
| ma100617_rel.cz11a_bee | 0.014 | 87.824 | 11.224 | 0.933 | 0.004 | nonzero | 0.066 | ||||
| ma101107_rel.cz11a_bee | 0.011 | 82.903 | 15.979 | 1.102 | 0.004 | 0.001 | 0.145 | ||||
| ma101107_rel.cz11b_bee | 0.072 | 83.677 | 14.958 | 1.227 | 0.065 | 0.001 | 0.237 | ||||
| ma101107_rel.cz11d_bee | 0.008 | 82.505 | 16.379 | 1.103 | 0.003 | 0.001 | 0.109 | ||||
| ma110401_rel.cz11b_bee | 0.141 | 84.496 | 14.001 | 1.244 | 0.117 | 0.002 | 0.138 |
Delete response time histogram: each cell has the percentage of responses that take <= the time in the header and max is the max response time in seconds. For the max column values in the top 25% of the range have a red background and in the bottom 25% of the range have a green background. The red background is not used when the min value is within 80% of the max value.
| dbms | 256us | 1ms | 4ms | 16ms | 64ms | 256ms | 1s | 4s | 16s | gt | max |
|---|---|---|---|---|---|---|---|---|---|---|---|
| ma100244_rel.cz11a_bee | 0.004 | 78.008 | 20.151 | 1.826 | 0.010 | 0.001 | 0.090 | ||||
| ma100339_rel.cz11a_bee | 0.005 | 79.638 | 18.296 | 2.027 | 0.034 | 0.001 | 0.077 | ||||
| ma100433_rel.cz11a_bee | 0.004 | 79.246 | 18.745 | 1.965 | 0.039 | 0.001 | 0.079 | ||||
| ma100524_rel.cz11a_bee | 0.019 | 83.164 | 16.102 | 0.649 | 0.065 | nonzero | 0.073 | ||||
| ma100617_rel.cz11a_bee | 0.022 | 87.824 | 11.096 | 1.054 | 0.004 | nonzero | 0.067 | ||||
| ma101107_rel.cz11a_bee | 0.026 | 83.191 | 15.635 | 1.143 | 0.004 | 0.001 | 0.144 | ||||
| ma101107_rel.cz11b_bee | 0.125 | 83.946 | 14.618 | 1.252 | 0.057 | 0.001 | 0.220 | ||||
| ma101107_rel.cz11d_bee | 0.027 | 82.897 | 15.929 | 1.142 | 0.003 | 0.001 | 0.110 | ||||
| ma110401_rel.cz11b_bee | 0.160 | 84.532 | 13.950 | 1.252 | 0.105 | 0.002 | 0.127 |
Performance metrics for the DBMS listed above. Some are normalized by throughput, others are not. Legend for results is here.
ips	qps	rps	rmbps	wps	wmbps	rpq	rkbpq	wpi	wkbpi	csps	cpups	cspq	cpupq	dbgb1	dbgb2	rss	maxop	p50	p99	tag
19990	0	0	0.0	3093.2	118.1	0.000	0.000	0.155	6.050	64983	81.3	3.251	325	7.8	23.9	8.9	0.090	5001	3713	ma100244_rel.cz11a_bee
20090	0	0	0.0	3522.5	132.3	0.000	0.000	0.175	6.744	66595	79.5	3.315	317	8.2	24.7	9.5	0.078	5084	3511	ma100339_rel.cz11a_bee
19920	0	0	0.0	3388.3	127.3	0.000	0.000	0.170	6.543	65692	79.6	3.298	320	8.2	24.7	NA	0.080	5084	3361	ma100433_rel.cz11a_bee
22522	0	0	0.0	9827.6	313.3	0.000	0.000	0.436	14.245	108549	81.1	4.820	288	8.2	25.6	9.4	0.072	5734	190	ma100524_rel.cz11a_bee
24891	0	0	0.0	2830.8	106.5	0.000	0.000	0.114	4.379	91358	79.4	3.670	255	6.7	22.7	6.7	0.066	6213	5504	ma100617_rel.cz11a_bee
22222	0	3118	12.2	2641.7	99.3	0.140	0.561	0.119	4.576	93789	73.6	4.221	265	6.7	22.5	6.5	0.145	5572	5049	ma101107_rel.cz11a_bee
21918	0	3078	12.0	2678.2	97.5	0.140	0.562	0.122	4.554	93517	72.6	4.267	265	6.7	22.9	6.5	0.237	5529	4215	ma101107_rel.cz11b_bee
22112	0	3104	12.1	2633.4	98.9	0.140	0.561	0.119	4.582	93581	73.7	4.232	267	6.6	22.4	6.5	0.109	5546	4900	ma101107_rel.cz11d_bee
21751	0	3051	11.9	2661.6	96.8	0.140	0.561	0.122	4.556	92713	71.9	4.263	264	6.6	22.5	6.5	0.138	5507	4581	ma110401_rel.cz11b_bee
qr100.L1
qr100.L1: range queries with 100 insert/s per client. Graphs for performance per 1-second interval are here.
Average throughput:
Query response time histogram: each cell has the percentage of responses that take <= the time in the header and max is the max response time in seconds. For max values in the top 25% of the range have a red background and in the bottom 25% of the range have a green background. The red background is not used when the min value is within 80% of the max value.
| dbms | 256us | 1ms | 4ms | 16ms | 64ms | 256ms | 1s | 4s | 16s | gt | max |
|---|---|---|---|---|---|---|---|---|---|---|---|
| ma100244_rel.cz11a_bee | 85.149 | 14.732 | 0.114 | 0.005 | nonzero | 0.027 | |||||
| ma100339_rel.cz11a_bee | 81.853 | 18.033 | 0.111 | 0.004 | nonzero | 0.029 | |||||
| ma100433_rel.cz11a_bee | 73.453 | 26.423 | 0.121 | 0.004 | nonzero | 0.026 | |||||
| ma100524_rel.cz11a_bee | 67.703 | 32.250 | 0.046 | 0.001 | 0.010 | ||||||
| ma100617_rel.cz11a_bee | 69.396 | 30.588 | 0.016 | 0.001 | 0.009 | ||||||
| ma101107_rel.cz11a_bee | 70.969 | 29.013 | 0.016 | 0.002 | 0.008 | ||||||
| ma101107_rel.cz11b_bee | 68.939 | 31.044 | 0.016 | 0.002 | 0.010 | ||||||
| ma101107_rel.cz11d_bee | 69.361 | 30.623 | 0.015 | 0.001 | 0.012 | ||||||
| ma110401_rel.cz11b_bee | 70.543 | 29.441 | 0.015 | 0.001 | 0.009 |
Insert response time histogram: each cell has the percentage of responses that take <= the time in the header and max is the max response time in seconds. For max values in the top 25% of the range have a red background and in the bottom 25% of the range have a green background. The red background is not used when the min value is within 80% of the max value.
| dbms | 256us | 1ms | 4ms | 16ms | 64ms | 256ms | 1s | 4s | 16s | gt | max |
|---|---|---|---|---|---|---|---|---|---|---|---|
| ma100244_rel.cz11a_bee | 95.604 | 4.188 | 0.208 | 0.051 | |||||||
| ma100339_rel.cz11a_bee | 94.729 | 4.868 | 0.403 | 0.040 | |||||||
| ma100433_rel.cz11a_bee | 94.549 | 5.146 | 0.306 | 0.044 | |||||||
| ma100524_rel.cz11a_bee | 99.083 | 0.917 | 0.010 | ||||||||
| ma100617_rel.cz11a_bee | 99.806 | 0.188 | 0.007 | 0.016 | |||||||
| ma101107_rel.cz11a_bee | 57.799 | 42.194 | 0.007 | 0.019 | |||||||
| ma101107_rel.cz11b_bee | 87.910 | 12.090 | 0.012 | ||||||||
| ma101107_rel.cz11d_bee | 75.174 | 24.826 | 0.014 | ||||||||
| ma110401_rel.cz11b_bee | 70.424 | 29.563 | 0.014 | 0.017 |
Delete response time histogram: each cell has the percentage of responses that take <= the time in the header and max is the max response time in seconds. For max values in the top 25% of the range have a red background and in the bottom 25% of the range have a green background. The red background is not used when the min value is within 80% of the max value.
| dbms | 256us | 1ms | 4ms | 16ms | 64ms | 256ms | 1s | 4s | 16s | gt | max |
|---|---|---|---|---|---|---|---|---|---|---|---|
| ma100244_rel.cz11a_bee | 96.819 | 3.035 | 0.146 | 0.036 | |||||||
| ma100339_rel.cz11a_bee | 96.174 | 3.625 | 0.201 | 0.038 | |||||||
| ma100433_rel.cz11a_bee | 96.174 | 3.653 | 0.174 | 0.037 | |||||||
| ma100524_rel.cz11a_bee | 99.340 | 0.660 | 0.009 | ||||||||
| ma100617_rel.cz11a_bee | 99.590 | 0.410 | 0.015 | ||||||||
| ma101107_rel.cz11a_bee | 59.639 | 40.347 | 0.014 | 0.019 | |||||||
| ma101107_rel.cz11b_bee | 87.910 | 12.090 | 0.013 | ||||||||
| ma101107_rel.cz11d_bee | 75.528 | 24.472 | 0.014 | ||||||||
| ma110401_rel.cz11b_bee | 71.264 | 28.736 | 0.015 |
Performance metrics for the DBMS listed above. Some are normalized by throughput, others are not. Legend for results is here.
ips	qps	rps	rmbps	wps	wmbps	rpq	rkbpq	wpi	wkbpi	csps	cpups	cspq	cpupq	dbgb1	dbgb2	rss	maxop	p50	p99	tag
399	18411	0	0.0	3088.2	93.7	0.000	0.000	7.748	240.587	81123	51.5	4.406	224	7.8	23.9	8.8	0.027	4557	3981	ma100244_rel.cz11a_bee
399	17720	0	0.0	3108.2	94.3	0.000	0.000	7.798	242.162	78282	51.5	4.418	232	8.2	24.7	9.5	0.029	4475	3836	ma100339_rel.cz11a_bee
399	16424	0	0.0	3103.8	94.1	0.000	0.000	7.787	241.813	73544	51.5	4.478	251	8.2	24.7	NA	0.026	4139	3614	ma100433_rel.cz11a_bee
399	15786	0	0.0	2.2	0.4	0.000	0.000	0.006	1.104	61249	50.7	3.880	257	8.2	25.6	9.4	0.010	3948	3468	ma100524_rel.cz11a_bee
399	16040	0	0.0	13.8	0.8	0.000	0.000	0.035	1.952	61166	51.1	3.813	255	6.7	22.7	6.7	0.009	3964	3438	ma100617_rel.cz11a_bee
399	16259	10	0.0	9.3	0.6	0.001	0.003	0.023	1.645	61983	50.9	3.812	250	6.7	22.5	6.5	0.008	4029	3532	ma101107_rel.cz11a_bee
399	16028	14	0.1	8.2	0.6	0.001	0.003	0.021	1.524	61135	50.9	3.814	254	6.7	22.9	6.5	0.010	3996	3500	ma101107_rel.cz11b_bee
399	16092	12	0.0	19.7	0.9	0.001	0.003	0.049	2.406	61430	51.0	3.818	254	6.6	22.4	6.5	0.012	4012	3500	ma101107_rel.cz11d_bee
399	16142	11	0.0	13.7	0.8	0.001	0.003	0.034	1.933	61560	51.0	3.814	253	6.6	22.5	6.5	0.009	4013	3564	ma110401_rel.cz11b_bee
qp100.L2
qp100.L2: point queries with 100 insert/s per client. Graphs for performance per 1-second interval are here.
Average throughput:
Query response time histogram: each cell has the percentage of responses that take <= the time in the header and max is the max response time in seconds. For max values in the top 25% of the range have a red background and in the bottom 25% of the range have a green background. The red background is not used when the min value is within 80% of the max value.
| dbms | 256us | 1ms | 4ms | 16ms | 64ms | 256ms | 1s | 4s | 16s | gt | max |
|---|---|---|---|---|---|---|---|---|---|---|---|
| ma100244_rel.cz11a_bee | 98.347 | 1.626 | 0.026 | 0.001 | nonzero | 0.021 | |||||
| ma100339_rel.cz11a_bee | 97.018 | 2.956 | 0.026 | 0.001 | nonzero | 0.022 | |||||
| ma100433_rel.cz11a_bee | 94.288 | 5.679 | 0.032 | 0.001 | nonzero | 0.021 | |||||
| ma100524_rel.cz11a_bee | 93.770 | 6.222 | 0.008 | nonzero | 0.008 | ||||||
| ma100617_rel.cz11a_bee | 97.055 | 2.901 | 0.043 | 0.001 | 0.008 | ||||||
| ma101107_rel.cz11a_bee | 98.034 | 1.923 | 0.042 | 0.001 | 0.008 | ||||||
| ma101107_rel.cz11b_bee | 94.936 | 5.019 | 0.044 | 0.002 | 0.010 | ||||||
| ma101107_rel.cz11d_bee | 95.813 | 4.141 | 0.045 | 0.001 | 0.009 | ||||||
| ma110401_rel.cz11b_bee | 96.711 | 3.246 | 0.042 | 0.001 | 0.010 |
Insert response time histogram: each cell has the percentage of responses that take <= the time in the header and max is the max response time in seconds. For max values in the top 25% of the range have a red background and in the bottom 25% of the range have a green background. The red background is not used when the min value is within 80% of the max value.
| dbms | 256us | 1ms | 4ms | 16ms | 64ms | 256ms | 1s | 4s | 16s | gt | max |
|---|---|---|---|---|---|---|---|---|---|---|---|
| ma100244_rel.cz11a_bee | 95.465 | 4.174 | 0.361 | 0.047 | |||||||
| ma100339_rel.cz11a_bee | 94.035 | 5.590 | 0.375 | 0.036 | |||||||
| ma100433_rel.cz11a_bee | 94.861 | 4.854 | 0.285 | 0.034 | |||||||
| ma100524_rel.cz11a_bee | 99.160 | 0.840 | 0.009 | ||||||||
| ma100617_rel.cz11a_bee | 99.708 | 0.285 | 0.007 | 0.017 | |||||||
| ma101107_rel.cz11a_bee | 81.306 | 18.694 | 0.015 | ||||||||
| ma101107_rel.cz11b_bee | 87.646 | 12.354 | 0.015 | ||||||||
| ma101107_rel.cz11d_bee | 86.646 | 13.347 | 0.007 | 0.016 | |||||||
| ma110401_rel.cz11b_bee | 88.153 | 11.847 | 0.013 |
Delete response time histogram: each cell has the percentage of responses that take <= the time in the header and max is the max response time in seconds. For max values in the top 25% of the range have a red background and in the bottom 25% of the range have a green background. The red background is not used when the min value is within 80% of the max value.
| dbms | 256us | 1ms | 4ms | 16ms | 64ms | 256ms | 1s | 4s | 16s | gt | max |
|---|---|---|---|---|---|---|---|---|---|---|---|
| ma100244_rel.cz11a_bee | 96.465 | 3.278 | 0.257 | 0.033 | |||||||
| ma100339_rel.cz11a_bee | 95.924 | 3.826 | 0.250 | 0.031 | |||||||
| ma100433_rel.cz11a_bee | 96.382 | 3.410 | 0.208 | 0.033 | |||||||
| ma100524_rel.cz11a_bee | 99.674 | 0.326 | 0.010 | ||||||||
| ma100617_rel.cz11a_bee | 99.646 | 0.347 | 0.007 | 0.016 | |||||||
| ma101107_rel.cz11a_bee | 81.500 | 18.500 | 0.014 | ||||||||
| ma101107_rel.cz11b_bee | 87.785 | 12.215 | 0.016 | ||||||||
| ma101107_rel.cz11d_bee | 86.625 | 13.375 | 0.015 | ||||||||
| ma110401_rel.cz11b_bee | 88.097 | 11.896 | 0.007 | 0.017 |
Performance metrics for the DBMS listed above. Some are normalized by throughput, others are not. Legend for results is here.
ips	qps	rps	rmbps	wps	wmbps	rpq	rkbpq	wpi	wkbpi	csps	cpups	cspq	cpupq	dbgb1	dbgb2	rss	maxop	p50	p99	tag
399	20957	0	0.0	3079.6	93.4	0.000	0.000	7.722	239.790	93836	52.3	4.478	200	7.8	23.9	8.9	0.021	5273	4667	ma100244_rel.cz11a_bee
399	19830	0	0.0	3086.7	93.6	0.000	0.000	7.740	240.375	88523	52.2	4.464	211	8.2	24.7	9.5	0.022	5021	4316	ma100339_rel.cz11a_bee
399	18731	0	0.0	3089.4	93.7	0.000	0.000	7.747	240.574	82779	52.1	4.419	223	8.2	24.7	NA	0.021	4811	4171	ma100433_rel.cz11a_bee
399	18452	0	0.0	2.3	0.4	0.000	0.000	0.006	1.099	69106	50.6	3.745	219	8.2	25.6	9.4	0.008	4619	4299	ma100524_rel.cz11a_bee
399	19524	0	0.0	25.4	1.1	0.000	0.000	0.064	2.806	77448	50.9	3.967	209	6.7	22.7	6.7	0.008	4955	3996	ma100617_rel.cz11a_bee
399	19804	13	0.1	21.2	1.0	0.001	0.003	0.053	2.520	78848	51.0	3.981	206	6.7	22.5	6.5	0.008	4981	4509	ma101107_rel.cz11a_bee
399	18924	14	0.1	20.0	0.9	0.001	0.003	0.050	2.391	74496	50.7	3.937	214	6.7	22.9	6.6	0.010	4797	3948	ma101107_rel.cz11b_bee
399	19075	14	0.1	25.4	1.1	0.001	0.003	0.064	2.834	75405	50.7	3.953	213	6.6	22.4	6.5	0.009	4891	3964	ma101107_rel.cz11d_bee
399	19489	14	0.1	26.1	1.1	0.001	0.003	0.066	2.833	77240	50.7	3.963	208	6.6	22.5	6.5	0.010	5003	4014	ma110401_rel.cz11b_bee
qr500.L3
qr500.L3: range queries with 500 insert/s per client. Graphs for performance per 1-second interval are here.
Average throughput:
Query response time histogram: each cell has the percentage of responses that take <= the time in the header and max is the max response time in seconds. For max values in the top 25% of the range have a red background and in the bottom 25% of the range have a green background. The red background is not used when the min value is within 80% of the max value.
| dbms | 256us | 1ms | 4ms | 16ms | 64ms | 256ms | 1s | 4s | 16s | gt | max |
|---|---|---|---|---|---|---|---|---|---|---|---|
| ma100244_rel.cz11a_bee | 85.099 | 14.449 | 0.410 | 0.041 | 0.001 | 0.036 | |||||
| ma100339_rel.cz11a_bee | 82.509 | 17.128 | 0.319 | 0.042 | 0.001 | 0.056 | |||||
| ma100433_rel.cz11a_bee | 76.213 | 23.401 | 0.342 | 0.042 | 0.001 | 0.038 | |||||
| ma100524_rel.cz11a_bee | 69.002 | 30.861 | 0.116 | 0.022 | nonzero | 0.025 | |||||
| ma100617_rel.cz11a_bee | 72.675 | 27.202 | 0.110 | 0.013 | nonzero | 0.020 | |||||
| ma101107_rel.cz11a_bee | 72.673 | 27.227 | 0.088 | 0.012 | nonzero | 0.024 | |||||
| ma101107_rel.cz11b_bee | 71.593 | 28.304 | 0.087 | 0.016 | nonzero | 0.042 | |||||
| ma101107_rel.cz11d_bee | 72.381 | 27.521 | 0.087 | 0.011 | nonzero | 0.019 | |||||
| ma110401_rel.cz11b_bee | 74.076 | 25.833 | 0.079 | 0.012 | nonzero | 0.031 |
Insert response time histogram: each cell has the percentage of responses that take <= the time in the header and max is the max response time in seconds. For max values in the top 25% of the range have a red background and in the bottom 25% of the range have a green background. The red background is not used when the min value is within 80% of the max value.
| dbms | 256us | 1ms | 4ms | 16ms | 64ms | 256ms | 1s | 4s | 16s | gt | max |
|---|---|---|---|---|---|---|---|---|---|---|---|
| ma100244_rel.cz11a_bee | 77.314 | 20.871 | 1.815 | 0.063 | |||||||
| ma100339_rel.cz11a_bee | 71.251 | 26.001 | 2.747 | 0.054 | |||||||
| ma100433_rel.cz11a_bee | 72.165 | 25.321 | 2.514 | 0.057 | |||||||
| ma100524_rel.cz11a_bee | 95.962 | 3.978 | 0.060 | 0.036 | |||||||
| ma100617_rel.cz11a_bee | 95.310 | 4.640 | 0.050 | 0.039 | |||||||
| ma101107_rel.cz11a_bee | 93.333 | 6.599 | 0.068 | 0.040 | |||||||
| ma101107_rel.cz11b_bee | 93.126 | 6.711 | 0.161 | 0.001 | 0.065 | ||||||
| ma101107_rel.cz11d_bee | 93.469 | 6.476 | 0.054 | 0.030 | |||||||
| ma110401_rel.cz11b_bee | 93.364 | 6.510 | 0.126 | 0.036 |
Delete response time histogram: each cell has the percentage of responses that take <= the time in the header and max is the max response time in seconds. For max values in the top 25% of the range have a red background and in the bottom 25% of the range have a green background. The red background is not used when the min value is within 80% of the max value.
| dbms | 256us | 1ms | 4ms | 16ms | 64ms | 256ms | 1s | 4s | 16s | gt | max |
|---|---|---|---|---|---|---|---|---|---|---|---|
| ma100244_rel.cz11a_bee | 82.043 | 16.636 | 1.319 | 0.001 | 0.067 | ||||||
| ma100339_rel.cz11a_bee | 77.429 | 20.617 | 1.954 | 0.062 | |||||||
| ma100433_rel.cz11a_bee | 78.344 | 19.893 | 1.762 | 0.058 | |||||||
| ma100524_rel.cz11a_bee | 97.531 | 2.447 | 0.022 | 0.037 | |||||||
| ma100617_rel.cz11a_bee | 97.214 | 2.763 | 0.024 | 0.039 | |||||||
| ma101107_rel.cz11a_bee | 95.182 | 4.783 | 0.035 | 0.040 | |||||||
| ma101107_rel.cz11b_bee | 95.106 | 4.814 | 0.081 | 0.039 | |||||||
| ma101107_rel.cz11d_bee | 95.265 | 4.715 | 0.019 | 0.029 | |||||||
| ma110401_rel.cz11b_bee | 95.031 | 4.897 | 0.072 | 0.035 |
Performance metrics for the DBMS listed above. Some are normalized by throughput, others are not. Legend for results is here.
ips	qps	rps	rmbps	wps	wmbps	rpq	rkbpq	wpi	wkbpi	csps	cpups	cspq	cpupq	dbgb1	dbgb2	rss	maxop	p50	p99	tag
1994	17799	0	0.0	10070.0	306.3	0.000	0.000	5.049	157.263	100743	55.2	5.660	248	7.8	23.9	8.9	0.036	4443	3900	ma100244_rel.cz11a_bee
1994	17258	0	0.0	10156.1	309.0	0.000	0.000	5.092	158.631	98427	55.3	5.703	256	8.2	24.7	9.5	0.056	4363	3821	ma100339_rel.cz11a_bee
1994	16258	0	0.0	10116.6	307.8	0.000	0.000	5.073	158.016	94381	55.3	5.805	272	8.2	24.7	NA	0.038	4091	3548	ma100433_rel.cz11a_bee
1993	15725	0	0.0	6.8	2.1	0.000	0.000	0.003	1.084	61188	52.0	3.891	265	8.2	25.6	9.4	0.025	3933	3404	ma100524_rel.cz11a_bee
1994	16238	0	0.0	230.0	8.3	0.000	0.000	0.115	4.276	62263	52.4	3.835	258	6.7	22.7	6.7	0.020	4075	3502	ma100617_rel.cz11a_bee
1993	16269	72	0.3	240.5	8.7	0.004	0.018	0.121	4.455	62602	52.6	3.848	259	6.7	22.5	6.5	0.024	4044	3532	ma101107_rel.cz11a_bee
1994	16138	73	0.3	245.5	8.6	0.005	0.018	0.123	4.429	62149	52.5	3.851	260	6.7	22.9	6.6	0.042	4013	3468	ma101107_rel.cz11b_bee
1994	16294	72	0.3	227.2	8.3	0.004	0.018	0.114	4.258	62675	52.7	3.846	259	6.6	22.4	6.5	0.019	4076	3516	ma101107_rel.cz11d_bee
1993	16469	73	0.3	236.5	8.4	0.004	0.018	0.119	4.293	63307	52.5	3.844	255	6.6	22.5	6.5	0.031	4093	3582	ma110401_rel.cz11b_bee
qp500.L4
qp500.L4: point queries with 500 insert/s per client. Graphs for performance per 1-second interval are here.
Average throughput:
Query response time histogram: each cell has the percentage of responses that take <= the time in the header and max is the max response time in seconds. For max values in the top 25% of the range have a red background and in the bottom 25% of the range have a green background. The red background is not used when the min value is within 80% of the max value.
| dbms | 256us | 1ms | 4ms | 16ms | 64ms | 256ms | 1s | 4s | 16s | gt | max |
|---|---|---|---|---|---|---|---|---|---|---|---|
| ma100244_rel.cz11a_bee | 96.597 | 3.251 | 0.141 | 0.011 | nonzero | 0.029 | |||||
| ma100339_rel.cz11a_bee | 95.183 | 4.693 | 0.113 | 0.011 | nonzero | 0.022 | |||||
| ma100433_rel.cz11a_bee | 92.701 | 7.171 | 0.116 | 0.012 | nonzero | 0.030 | |||||
| ma100524_rel.cz11a_bee | 92.284 | 7.694 | 0.018 | 0.004 | nonzero | 0.029 | |||||
| ma100617_rel.cz11a_bee | 96.054 | 3.824 | 0.111 | 0.011 | nonzero | 0.017 | |||||
| ma101107_rel.cz11a_bee | 96.132 | 3.759 | 0.099 | 0.010 | nonzero | 0.019 | |||||
| ma101107_rel.cz11b_bee | 95.938 | 3.943 | 0.108 | 0.012 | nonzero | 0.018 | |||||
| ma101107_rel.cz11d_bee | 96.113 | 3.766 | 0.110 | 0.011 | nonzero | 0.018 | |||||
| ma110401_rel.cz11b_bee | 95.904 | 3.983 | 0.100 | 0.013 | nonzero | 0.018 |
Insert response time histogram: each cell has the percentage of responses that take <= the time in the header and max is the max response time in seconds. For max values in the top 25% of the range have a red background and in the bottom 25% of the range have a green background. The red background is not used when the min value is within 80% of the max value.
| dbms | 256us | 1ms | 4ms | 16ms | 64ms | 256ms | 1s | 4s | 16s | gt | max |
|---|---|---|---|---|---|---|---|---|---|---|---|
| ma100244_rel.cz11a_bee | 82.782 | 15.338 | 1.879 | 0.001 | 0.069 | ||||||
| ma100339_rel.cz11a_bee | 80.006 | 17.908 | 2.085 | 0.001 | 0.066 | ||||||
| ma100433_rel.cz11a_bee | 77.586 | 20.044 | 2.369 | 0.059 | |||||||
| ma100524_rel.cz11a_bee | 97.156 | 2.797 | 0.047 | 0.038 | |||||||
| ma100617_rel.cz11a_bee | 96.814 | 3.151 | 0.035 | 0.039 | |||||||
| ma101107_rel.cz11a_bee | 95.129 | 4.835 | 0.036 | 0.030 | |||||||
| ma101107_rel.cz11b_bee | 92.156 | 7.754 | 0.090 | 0.040 | |||||||
| ma101107_rel.cz11d_bee | 93.353 | 6.603 | 0.044 | 0.039 | |||||||
| ma110401_rel.cz11b_bee | 93.774 | 6.112 | 0.114 | 0.046 |
Delete response time histogram: each cell has the percentage of responses that take <= the time in the header and max is the max response time in seconds. For max values in the top 25% of the range have a red background and in the bottom 25% of the range have a green background. The red background is not used when the min value is within 80% of the max value.
| dbms | 256us | 1ms | 4ms | 16ms | 64ms | 256ms | 1s | 4s | 16s | gt | max |
|---|---|---|---|---|---|---|---|---|---|---|---|
| ma100244_rel.cz11a_bee | 87.026 | 11.749 | 1.225 | 0.052 | |||||||
| ma100339_rel.cz11a_bee | 85.125 | 13.482 | 1.393 | 0.051 | |||||||
| ma100433_rel.cz11a_bee | 83.439 | 15.006 | 1.556 | 0.056 | |||||||
| ma100524_rel.cz11a_bee | 98.268 | 1.706 | 0.026 | 0.038 | |||||||
| ma100617_rel.cz11a_bee | 98.118 | 1.869 | 0.013 | 0.037 | |||||||
| ma101107_rel.cz11a_bee | 96.296 | 3.690 | 0.014 | 0.028 | |||||||
| ma101107_rel.cz11b_bee | 94.221 | 5.740 | 0.039 | 0.040 | |||||||
| ma101107_rel.cz11d_bee | 95.157 | 4.821 | 0.022 | 0.039 | |||||||
| ma110401_rel.cz11b_bee | 95.283 | 4.657 | 0.060 | 0.045 |
Performance metrics for the DBMS listed above. Some are normalized by throughput, others are not. Legend for results is here.
ips	qps	rps	rmbps	wps	wmbps	rpq	rkbpq	wpi	wkbpi	csps	cpups	cspq	cpupq	dbgb1	dbgb2	rss	maxop	p50	p99	tag
1994	19513	0	0.0	10282.8	312.7	0.000	0.000	5.156	160.562	108909	57.3	5.581	235	7.8	23.9	8.8	0.029	4910	4459	ma100244_rel.cz11a_bee
1994	18796	0	0.0	10284.9	312.9	0.000	0.000	5.157	160.632	106146	57.2	5.647	243	8.2	24.7	9.5	0.022	4731	4299	ma100339_rel.cz11a_bee
1994	18135	0	0.0	10297.2	313.2	0.000	0.000	5.163	160.820	103790	57.2	5.723	252	8.2	24.7	NA	0.030	4571	4155	ma100433_rel.cz11a_bee
1994	18167	0	0.0	6.8	2.1	0.000	0.000	0.003	1.089	67912	52.8	3.738	233	8.2	25.6	9.4	0.029	4539	4221	ma100524_rel.cz11a_bee
1994	19138	0	0.0	202.1	7.5	0.000	0.000	0.101	3.863	76986	52.3	4.023	219	6.7	22.7	6.7	0.017	4843	4379	ma100617_rel.cz11a_bee
1994	19191	74	0.3	195.9	7.4	0.004	0.015	0.098	3.802	77261	52.4	4.026	218	6.7	22.5	6.5	0.019	4827	4395	ma101107_rel.cz11a_bee
1993	19189	74	0.3	202.0	7.4	0.004	0.015	0.101	3.810	77308	52.4	4.029	218	6.7	22.9	6.5	0.018	4855	4411	ma101107_rel.cz11b_bee
1994	19208	73	0.3	211.7	7.8	0.004	0.015	0.106	4.025	77412	52.4	4.030	218	6.6	22.4	6.5	0.018	4859	4395	ma101107_rel.cz11d_bee
1994	19158	73	0.3	204.8	7.5	0.004	0.015	0.103	3.842	77112	52.2	4.025	218	6.6	22.5	6.5	0.018	4813	4331	ma110401_rel.cz11b_bee
qr1000.L5
qr1000.L5: range queries with 1000 insert/s per client. Graphs for performance per 1-second interval are here.
Average throughput:
Query response time histogram: each cell has the percentage of responses that take <= the time in the header and max is the max response time in seconds. For max values in the top 25% of the range have a red background and in the bottom 25% of the range have a green background. The red background is not used when the min value is within 80% of the max value.
| dbms | 256us | 1ms | 4ms | 16ms | 64ms | 256ms | 1s | 4s | 16s | gt | max |
|---|---|---|---|---|---|---|---|---|---|---|---|
| ma100244_rel.cz11a_bee | 84.873 | 14.546 | 0.500 | 0.078 | 0.002 | 0.037 | |||||
| ma100339_rel.cz11a_bee | 81.427 | 17.959 | 0.541 | 0.071 | 0.003 | 0.042 | |||||
| ma100433_rel.cz11a_bee | 76.090 | 23.282 | 0.550 | 0.075 | 0.003 | 0.051 | |||||
| ma100524_rel.cz11a_bee | 71.003 | 28.491 | 0.455 | 0.051 | nonzero | 0.031 | |||||
| ma100617_rel.cz11a_bee | 72.905 | 26.815 | 0.252 | 0.027 | nonzero | 0.028 | |||||
| ma101107_rel.cz11a_bee | 72.121 | 27.597 | 0.255 | 0.027 | nonzero | 0.025 | |||||
| ma101107_rel.cz11b_bee | 70.838 | 28.872 | 0.254 | 0.034 | 0.001 | nonzero | 0.077 | ||||
| ma101107_rel.cz11d_bee | 71.551 | 28.145 | 0.278 | 0.026 | nonzero | 0.040 | |||||
| ma110401_rel.cz11b_bee | 72.217 | 27.531 | 0.225 | 0.026 | nonzero | 0.028 |
Insert response time histogram: each cell has the percentage of responses that take <= the time in the header and max is the max response time in seconds. For max values in the top 25% of the range have a red background and in the bottom 25% of the range have a green background. The red background is not used when the min value is within 80% of the max value.
| dbms | 256us | 1ms | 4ms | 16ms | 64ms | 256ms | 1s | 4s | 16s | gt | max |
|---|---|---|---|---|---|---|---|---|---|---|---|
| ma100244_rel.cz11a_bee | 58.472 | 37.326 | 4.202 | 0.001 | 0.067 | ||||||
| ma100339_rel.cz11a_bee | 61.134 | 35.042 | 3.822 | 0.002 | 0.074 | ||||||
| ma100433_rel.cz11a_bee | 59.494 | 36.493 | 4.012 | 0.001 | 0.070 | ||||||
| ma100524_rel.cz11a_bee | 64.597 | 33.784 | 1.619 | 0.054 | |||||||
| ma100617_rel.cz11a_bee | 78.119 | 21.629 | 0.251 | 0.050 | |||||||
| ma101107_rel.cz11a_bee | 73.843 | 25.893 | 0.264 | 0.042 | |||||||
| ma101107_rel.cz11b_bee | 72.099 | 27.505 | 0.395 | 0.001 | 0.069 | ||||||
| ma101107_rel.cz11d_bee | 69.611 | 30.113 | 0.276 | 0.039 | |||||||
| ma110401_rel.cz11b_bee | 76.920 | 22.660 | 0.420 | 0.051 |
Delete response time histogram: each cell has the percentage of responses that take <= the time in the header and max is the max response time in seconds. For max values in the top 25% of the range have a red background and in the bottom 25% of the range have a green background. The red background is not used when the min value is within 80% of the max value.
| dbms | 256us | 1ms | 4ms | 16ms | 64ms | 256ms | 1s | 4s | 16s | gt | max |
|---|---|---|---|---|---|---|---|---|---|---|---|
| ma100244_rel.cz11a_bee | 65.162 | 31.508 | 3.330 | 0.063 | |||||||
| ma100339_rel.cz11a_bee | 68.388 | 28.774 | 2.838 | 0.001 | 0.070 | ||||||
| ma100433_rel.cz11a_bee | 67.332 | 29.547 | 3.122 | 0.062 | |||||||
| ma100524_rel.cz11a_bee | 71.760 | 27.213 | 1.028 | 0.058 | |||||||
| ma100617_rel.cz11a_bee | 83.255 | 16.540 | 0.205 | 0.042 | |||||||
| ma101107_rel.cz11a_bee | 79.099 | 20.728 | 0.174 | 0.044 | |||||||
| ma101107_rel.cz11b_bee | 77.497 | 22.257 | 0.245 | 0.001 | 0.071 | ||||||
| ma101107_rel.cz11d_bee | 75.333 | 24.503 | 0.164 | 0.042 | |||||||
| ma110401_rel.cz11b_bee | 81.279 | 18.439 | 0.282 | 0.053 |
Performance metrics for the DBMS listed above. Some are normalized by throughput, others are not. Legend for results is here.
ips	qps	rps	rmbps	wps	wmbps	rpq	rkbpq	wpi	wkbpi	csps	cpups	cspq	cpupq	dbgb1	dbgb2	rss	maxop	p50	p99	tag
3989	17320	0	0.0	10190.0	312.0	0.000	0.000	2.555	80.088	98566	57.7	5.691	267	7.8	23.9	8.8	0.037	4365	3852	ma100244_rel.cz11a_bee
3987	16575	0	0.0	10529.8	322.4	0.000	0.000	2.641	82.798	97344	57.5	5.873	278	8.2	24.7	9.5	0.042	4187	3644	ma100339_rel.cz11a_bee
3989	15744	0	0.0	10405.4	318.6	0.000	0.000	2.609	81.784	93425	57.7	5.934	293	8.2	24.7	NA	0.051	3996	3470	ma100433_rel.cz11a_bee
3989	15412	0	0.0	5361.8	163.1	0.000	0.000	1.344	41.873	84473	55.3	5.481	287	8.2	25.6	9.4	0.031	3852	3308	ma100524_rel.cz11a_bee
3989	15971	0	0.0	401.7	15.0	0.000	0.000	0.101	3.847	62072	54.2	3.886	271	6.7	22.7	6.7	0.028	4012	3452	ma100617_rel.cz11a_bee
3989	15856	137	0.5	425.7	15.8	0.009	0.035	0.107	4.053	61745	54.3	3.894	274	6.7	22.5	6.5	0.025	3931	3420	ma101107_rel.cz11a_bee
3989	15676	135	0.5	436.5	15.7	0.009	0.034	0.109	4.035	61213	54.2	3.905	277	6.7	22.9	6.5	0.077	3933	3404	ma101107_rel.cz11b_bee
3989	15793	130	0.5	422.5	15.7	0.008	0.033	0.106	4.032	61493	54.3	3.894	275	6.6	22.4	6.5	0.040	3964	3404	ma101107_rel.cz11d_bee
3989	15856	138	0.5	442.3	15.9	0.009	0.035	0.111	4.070	61653	54.2	3.888	273	6.6	22.5	6.5	0.028	3966	3422	ma110401_rel.cz11b_bee
qp1000.L6
qp1000.L6: point queries with 1000 insert/s per client. Graphs for performance per 1-second interval are here.
Average throughput:
Query response time histogram: each cell has the percentage of responses that take <= the time in the header and max is the max response time in seconds. For max values in the top 25% of the range have a red background and in the bottom 25% of the range have a green background. The red background is not used when the min value is within 80% of the max value.
| dbms | 256us | 1ms | 4ms | 16ms | 64ms | 256ms | 1s | 4s | 16s | gt | max |
|---|---|---|---|---|---|---|---|---|---|---|---|
| ma100244_rel.cz11a_bee | 96.079 | 3.708 | 0.181 | 0.032 | 0.001 | 0.042 | |||||
| ma100339_rel.cz11a_bee | 94.091 | 5.703 | 0.179 | 0.026 | 0.001 | 0.038 | |||||
| ma100433_rel.cz11a_bee | 90.413 | 9.374 | 0.184 | 0.028 | 0.001 | 0.033 | |||||
| ma100524_rel.cz11a_bee | 87.494 | 12.276 | 0.208 | 0.023 | nonzero | 0.030 | |||||
| ma100617_rel.cz11a_bee | 94.652 | 5.225 | 0.110 | 0.013 | nonzero | 0.029 | |||||
| ma101107_rel.cz11a_bee | 93.645 | 6.233 | 0.111 | 0.012 | nonzero | 0.016 | |||||
| ma101107_rel.cz11b_bee | 93.720 | 6.162 | 0.107 | 0.011 | nonzero | 0.020 | |||||
| ma101107_rel.cz11d_bee | 93.194 | 6.697 | 0.098 | 0.011 | nonzero | 0.022 | |||||
| ma110401_rel.cz11b_bee | 93.863 | 6.024 | 0.100 | 0.013 | nonzero | 0.025 |
Insert response time histogram: each cell has the percentage of responses that take <= the time in the header and max is the max response time in seconds. For max values in the top 25% of the range have a red background and in the bottom 25% of the range have a green background. The red background is not used when the min value is within 80% of the max value.
| dbms | 256us | 1ms | 4ms | 16ms | 64ms | 256ms | 1s | 4s | 16s | gt | max |
|---|---|---|---|---|---|---|---|---|---|---|---|
| ma100244_rel.cz11a_bee | 63.572 | 31.534 | 4.893 | 0.001 | 0.068 | ||||||
| ma100339_rel.cz11a_bee | 66.365 | 29.410 | 4.221 | 0.004 | 0.084 | ||||||
| ma100433_rel.cz11a_bee | 64.490 | 30.873 | 4.636 | 0.001 | 0.066 | ||||||
| ma100524_rel.cz11a_bee | 62.524 | 34.760 | 2.716 | 0.054 | |||||||
| ma100617_rel.cz11a_bee | 80.290 | 19.301 | 0.408 | 0.054 | |||||||
| ma101107_rel.cz11a_bee | 76.844 | 22.881 | 0.276 | 0.038 | |||||||
| ma101107_rel.cz11b_bee | 80.263 | 19.380 | 0.358 | 0.050 | |||||||
| ma101107_rel.cz11d_bee | 82.680 | 17.042 | 0.278 | 0.044 | |||||||
| ma110401_rel.cz11b_bee | 84.777 | 14.833 | 0.390 | 0.053 |
Delete response time histogram: each cell has the percentage of responses that take <= the time in the header and max is the max response time in seconds. For max values in the top 25% of the range have a red background and in the bottom 25% of the range have a green background. The red background is not used when the min value is within 80% of the max value.
| dbms | 256us | 1ms | 4ms | 16ms | 64ms | 256ms | 1s | 4s | 16s | gt | max |
|---|---|---|---|---|---|---|---|---|---|---|---|
| ma100244_rel.cz11a_bee | 69.903 | 26.408 | 3.688 | 0.001 | 0.067 | ||||||
| ma100339_rel.cz11a_bee | 73.563 | 23.320 | 3.115 | 0.001 | 0.072 | ||||||
| ma100433_rel.cz11a_bee | 71.824 | 24.800 | 3.374 | 0.003 | 0.069 | ||||||
| ma100524_rel.cz11a_bee | 69.446 | 28.818 | 1.735 | 0.001 | 0.067 | ||||||
| ma100617_rel.cz11a_bee | 84.628 | 15.036 | 0.335 | 0.060 | |||||||
| ma101107_rel.cz11a_bee | 81.510 | 18.310 | 0.181 | 0.042 | |||||||
| ma101107_rel.cz11b_bee | 84.139 | 15.667 | 0.194 | 0.038 | |||||||
| ma101107_rel.cz11d_bee | 86.371 | 13.469 | 0.160 | 0.051 | |||||||
| ma110401_rel.cz11b_bee | 87.701 | 12.081 | 0.218 | 0.053 |
Performance metrics for the DBMS listed above. Some are normalized by throughput, others are not. Legend for results is here.
ips	qps	rps	rmbps	wps	wmbps	rpq	rkbpq	wpi	wkbpi	csps	cpups	cspq	cpupq	dbgb1	dbgb2	rss	maxop	p50	p99	tag
3989	18897	0	0.0	10547.4	322.7	0.000	0.000	2.644	82.850	104909	60.2	5.552	255	7.8	23.9	8.8	0.042	4747	4283	ma100244_rel.cz11a_bee
3987	18093	0	0.0	10694.4	327.3	0.000	0.000	2.683	84.066	102940	60.1	5.689	266	8.2	24.7	9.5	0.038	4525	4123	ma100339_rel.cz11a_bee
3989	17476	0	0.0	10701.6	327.5	0.000	0.000	2.683	84.079	100649	60.1	5.759	275	8.2	24.7	NA	0.033	4411	4012	ma100433_rel.cz11a_bee
3989	17035	0	0.0	10275.7	310.7	0.000	0.000	2.576	79.760	109689	58.3	6.439	274	8.2	25.6	9.4	0.030	4283	3947	ma100524_rel.cz11a_bee
3989	18966	0	0.0	423.2	15.6	0.000	0.000	0.106	4.010	76387	55.1	4.028	232	6.7	22.7	6.7	0.029	4763	4474	ma100617_rel.cz11a_bee
3989	18791	139	0.5	420.7	15.6	0.007	0.030	0.105	4.009	75952	55.2	4.042	235	6.7	22.5	6.5	0.016	4715	4413	ma101107_rel.cz11a_bee
3989	18808	141	0.6	440.2	15.8	0.007	0.030	0.110	4.060	76093	55.2	4.046	235	6.7	22.9	6.5	0.020	4731	4381	ma101107_rel.cz11b_bee
3989	18780	144	0.6	422.9	15.7	0.008	0.031	0.106	4.028	75746	55.4	4.033	236	6.6	22.4	6.5	0.022	4717	3981	ma101107_rel.cz11d_bee
3989	18863	143	0.6	436.6	15.7	0.008	0.030	0.109	4.031	76306	55.0	4.045	233	6.6	22.5	6.5	0.025	4715	4379	ma110401_rel.cz11b_bee
l.i0
l.i0: load without secondary indexes
Performance metrics for all DBMS, not just the ones listed above. Some are normalized by throughput, others are not. Legend for results is here.
ips	qps	rps	rmbps	wps	wmbps	rpq	rkbpq	wpi	wkbpi	csps	cpups	cspq	cpupq	dbgb1	dbgb2	rss	maxop	p50	p99	tag
285714	0	1	0.0	1029.7	92.3	0.000	0.000	0.004	0.331	29836	70.8	0.104	20	2.1	18.0	2.2	0.150	80940	58636	ma100244_rel.cz11a_bee
219178	0	0	0.0	876.5	77.9	0.000	0.000	0.004	0.364	33696	78.0	0.154	28	2.1	18.0	2.7	0.154	60624	44251	ma100339_rel.cz11a_bee
219178	0	0	0.0	904.1	78.4	0.000	0.000	0.004	0.366	33638	78.5	0.153	29	2.1	18.0	NA	0.147	60709	46349	ma100433_rel.cz11a_bee
230216	0	0	0.0	1458.8	72.3	0.000	0.000	0.006	0.322	54636	72.4	0.237	25	2.1	18.0	2.3	0.146	63930	47648	ma100524_rel.cz11a_bee
248062	0	0	0.0	756.3	62.4	0.000	0.000	0.003	0.258	40632	73.6	0.164	24	2.1	18.0	2.3	0.217	69125	52843	ma100617_rel.cz11a_bee
251968	0	0	0.0	825.8	65.9	0.000	0.000	0.003	0.268	30027	73.1	0.119	23	2.1	18.0	2.3	0.196	70388	54159	ma101107_rel.cz11a_bee
197531	0	0	0.0	676.1	51.6	0.000	0.000	0.003	0.267	24320	58.4	0.123	24	2.1	18.0	2.3	19.505	68226	0	ma101107_rel.cz11b_bee
251968	0	0	0.0	825.0	65.8	0.000	0.000	0.003	0.267	30437	73.1	0.121	23	2.1	18.0	2.3	0.191	69924	54141	ma101107_rel.cz11d_bee
250000	0	0	0.0	831.5	65.9	0.000	0.000	0.003	0.270	30993	73.2	0.124	23	2.1	18.0	2.3	0.200	69724	50046	ma110401_rel.cz11b_bee
l.x
l.x: create secondary indexes
Performance metrics for all DBMS, not just the ones listed above. Some are normalized by throughput, others are not. Legend for results is here.
ips	qps	rps	rmbps	wps	wmbps	rpq	rkbpq	wpi	wkbpi	csps	cpups	cspq	cpupq	dbgb1	dbgb2	rss	maxop	p50	p99	tag
603775	0	0	0.0	2291.6	453.7	0.000	0.000	0.004	0.769	19800	45.7	0.033	6	4.9	20.7	3.0	0.002	NA	NA	ma100244_rel.cz11a_bee
561405	0	0	0.0	2215.1	420.6	0.000	0.000	0.004	0.767	19957	46.6	0.036	7	4.9	20.7	2.9	0.002	NA	NA	ma100339_rel.cz11a_bee
592594	0	0	0.0	2288.0	446.9	0.000	0.000	0.004	0.772	18213	45.6	0.031	6	4.8	20.6	NA	0.002	NA	NA	ma100433_rel.cz11a_bee
516131	0	0	0.0	773.5	350.9	0.000	0.000	0.001	0.696	1920	44.8	0.004	7	4.8	20.6	5.0	0.002	NA	NA	ma100524_rel.cz11a_bee
470590	0	0	0.0	2583.4	351.8	0.000	0.000	0.005	0.766	8846	43.9	0.019	7	4.8	20.6	4.6	0.002	NA	NA	ma100617_rel.cz11a_bee
421054	0	0	0.0	2409.0	307.4	0.000	0.000	0.006	0.748	8497	41.3	0.020	8	4.8	20.6	4.4	0.002	NA	NA	ma101107_rel.cz11a_bee
463770	0	0	0.0	2475.2	329.4	0.000	0.000	0.005	0.727	8168	44.6	0.018	8	4.8	20.6	4.6	0.002	NA	NA	ma101107_rel.cz11b_bee
463770	0	0	0.0	2466.4	347.0	0.000	0.000	0.005	0.766	8053	44.1	0.017	8	4.8	20.6	4.6	0.002	NA	NA	ma101107_rel.cz11d_bee
421054	0	0	0.0	2302.8	305.9	0.000	0.000	0.005	0.744	7891	41.8	0.019	8	4.8	20.6	4.3	0.002	NA	NA	ma110401_rel.cz11b_bee
l.i1
l.i1: continue load after secondary indexes created with 50 inserts per transaction
Performance metrics for all DBMS, not just the ones listed above. Some are normalized by throughput, others are not. Legend for results is here.
ips	qps	rps	rmbps	wps	wmbps	rpq	rkbpq	wpi	wkbpi	csps	cpups	cspq	cpupq	dbgb1	dbgb2	rss	maxop	p50	p99	tag
43278	0	0	0.0	5145.7	193.4	0.000	0.000	0.119	4.575	28072	85.4	0.649	158	7.8	23.9	8.9	0.128	10788	8038	ma100244_rel.cz11a_bee
48106	0	0	0.0	5105.7	190.4	0.000	0.000	0.106	4.054	29752	84.6	0.618	141	8.2	24.7	9.4	0.170	12086	8740	ma100339_rel.cz11a_bee
47591	0	0	0.0	5223.2	193.1	0.000	0.000	0.110	4.156	29832	84.5	0.627	142	8.2	24.7	NA	0.168	11937	8787	ma100433_rel.cz11a_bee
51184	0	0	0.0	9666.9	309.3	0.000	0.000	0.189	6.187	72506	84.6	1.417	132	8.2	25.6	9.4	1.234	13235	200	ma100524_rel.cz11a_bee
51249	0	0	0.0	6264.5	226.6	0.000	0.000	0.122	4.527	96959	80.6	1.892	126	6.7	22.7	6.8	0.342	12983	7841	ma100617_rel.cz11a_bee
48558	0	2074	8.1	5851.2	215.6	0.043	0.171	0.120	4.546	75160	75.3	1.548	124	6.7	22.5	6.6	0.294	12241	8239	ma101107_rel.cz11a_bee
40879	0	1767	6.9	5256.3	184.9	0.043	0.173	0.129	4.632	69802	66.4	1.708	130	6.7	22.9	6.6	0.515	10139	5394	ma101107_rel.cz11b_bee
48324	0	2075	8.1	5865.6	215.7	0.043	0.172	0.121	4.570	75476	75.5	1.562	125	6.6	22.4	6.6	0.345	12191	7991	ma101107_rel.cz11d_bee
42941	0	1836	7.2	5427.5	192.4	0.043	0.171	0.126	4.589	70644	67.5	1.645	126	6.6	22.5	6.5	0.441	10788	6443	ma110401_rel.cz11b_bee
l.i2
l.i2: continue load after secondary indexes created with 5 inserts per transaction
Performance metrics for all DBMS, not just the ones listed above. Some are normalized by throughput, others are not. Legend for results is here.
ips	qps	rps	rmbps	wps	wmbps	rpq	rkbpq	wpi	wkbpi	csps	cpups	cspq	cpupq	dbgb1	dbgb2	rss	maxop	p50	p99	tag
19990	0	0	0.0	3093.2	118.1	0.000	0.000	0.155	6.050	64983	81.3	3.251	325	7.8	23.9	8.9	0.090	5001	3713	ma100244_rel.cz11a_bee
20090	0	0	0.0	3522.5	132.3	0.000	0.000	0.175	6.744	66595	79.5	3.315	317	8.2	24.7	9.5	0.078	5084	3511	ma100339_rel.cz11a_bee
19920	0	0	0.0	3388.3	127.3	0.000	0.000	0.170	6.543	65692	79.6	3.298	320	8.2	24.7	NA	0.080	5084	3361	ma100433_rel.cz11a_bee
22522	0	0	0.0	9827.6	313.3	0.000	0.000	0.436	14.245	108549	81.1	4.820	288	8.2	25.6	9.4	0.072	5734	190	ma100524_rel.cz11a_bee
24891	0	0	0.0	2830.8	106.5	0.000	0.000	0.114	4.379	91358	79.4	3.670	255	6.7	22.7	6.7	0.066	6213	5504	ma100617_rel.cz11a_bee
22222	0	3118	12.2	2641.7	99.3	0.140	0.561	0.119	4.576	93789	73.6	4.221	265	6.7	22.5	6.5	0.145	5572	5049	ma101107_rel.cz11a_bee
21918	0	3078	12.0	2678.2	97.5	0.140	0.562	0.122	4.554	93517	72.6	4.267	265	6.7	22.9	6.5	0.237	5529	4215	ma101107_rel.cz11b_bee
22112	0	3104	12.1	2633.4	98.9	0.140	0.561	0.119	4.582	93581	73.7	4.232	267	6.6	22.4	6.5	0.109	5546	4900	ma101107_rel.cz11d_bee
21751	0	3051	11.9	2661.6	96.8	0.140	0.561	0.122	4.556	92713	71.9	4.263	264	6.6	22.5	6.5	0.138	5507	4581	ma110401_rel.cz11b_bee
qr100.L1
qr100.L1: range queries with 100 insert/s per client
Performance metrics for all DBMS, not just the ones listed above. Some are normalized by throughput, others are not. Legend for results is here.
ips	qps	rps	rmbps	wps	wmbps	rpq	rkbpq	wpi	wkbpi	csps	cpups	cspq	cpupq	dbgb1	dbgb2	rss	maxop	p50	p99	tag
399	18411	0	0.0	3088.2	93.7	0.000	0.000	7.748	240.587	81123	51.5	4.406	224	7.8	23.9	8.8	0.027	4557	3981	ma100244_rel.cz11a_bee
399	17720	0	0.0	3108.2	94.3	0.000	0.000	7.798	242.162	78282	51.5	4.418	232	8.2	24.7	9.5	0.029	4475	3836	ma100339_rel.cz11a_bee
399	16424	0	0.0	3103.8	94.1	0.000	0.000	7.787	241.813	73544	51.5	4.478	251	8.2	24.7	NA	0.026	4139	3614	ma100433_rel.cz11a_bee
399	15786	0	0.0	2.2	0.4	0.000	0.000	0.006	1.104	61249	50.7	3.880	257	8.2	25.6	9.4	0.010	3948	3468	ma100524_rel.cz11a_bee
399	16040	0	0.0	13.8	0.8	0.000	0.000	0.035	1.952	61166	51.1	3.813	255	6.7	22.7	6.7	0.009	3964	3438	ma100617_rel.cz11a_bee
399	16259	10	0.0	9.3	0.6	0.001	0.003	0.023	1.645	61983	50.9	3.812	250	6.7	22.5	6.5	0.008	4029	3532	ma101107_rel.cz11a_bee
399	16028	14	0.1	8.2	0.6	0.001	0.003	0.021	1.524	61135	50.9	3.814	254	6.7	22.9	6.5	0.010	3996	3500	ma101107_rel.cz11b_bee
399	16092	12	0.0	19.7	0.9	0.001	0.003	0.049	2.406	61430	51.0	3.818	254	6.6	22.4	6.5	0.012	4012	3500	ma101107_rel.cz11d_bee
399	16142	11	0.0	13.7	0.8	0.001	0.003	0.034	1.933	61560	51.0	3.814	253	6.6	22.5	6.5	0.009	4013	3564	ma110401_rel.cz11b_bee
qp100.L2
qp100.L2: point queries with 100 insert/s per client
Performance metrics for all DBMS, not just the ones listed above. Some are normalized by throughput, others are not. Legend for results is here.
ips	qps	rps	rmbps	wps	wmbps	rpq	rkbpq	wpi	wkbpi	csps	cpups	cspq	cpupq	dbgb1	dbgb2	rss	maxop	p50	p99	tag
399	20957	0	0.0	3079.6	93.4	0.000	0.000	7.722	239.790	93836	52.3	4.478	200	7.8	23.9	8.9	0.021	5273	4667	ma100244_rel.cz11a_bee
399	19830	0	0.0	3086.7	93.6	0.000	0.000	7.740	240.375	88523	52.2	4.464	211	8.2	24.7	9.5	0.022	5021	4316	ma100339_rel.cz11a_bee
399	18731	0	0.0	3089.4	93.7	0.000	0.000	7.747	240.574	82779	52.1	4.419	223	8.2	24.7	NA	0.021	4811	4171	ma100433_rel.cz11a_bee
399	18452	0	0.0	2.3	0.4	0.000	0.000	0.006	1.099	69106	50.6	3.745	219	8.2	25.6	9.4	0.008	4619	4299	ma100524_rel.cz11a_bee
399	19524	0	0.0	25.4	1.1	0.000	0.000	0.064	2.806	77448	50.9	3.967	209	6.7	22.7	6.7	0.008	4955	3996	ma100617_rel.cz11a_bee
399	19804	13	0.1	21.2	1.0	0.001	0.003	0.053	2.520	78848	51.0	3.981	206	6.7	22.5	6.5	0.008	4981	4509	ma101107_rel.cz11a_bee
399	18924	14	0.1	20.0	0.9	0.001	0.003	0.050	2.391	74496	50.7	3.937	214	6.7	22.9	6.6	0.010	4797	3948	ma101107_rel.cz11b_bee
399	19075	14	0.1	25.4	1.1	0.001	0.003	0.064	2.834	75405	50.7	3.953	213	6.6	22.4	6.5	0.009	4891	3964	ma101107_rel.cz11d_bee
399	19489	14	0.1	26.1	1.1	0.001	0.003	0.066	2.833	77240	50.7	3.963	208	6.6	22.5	6.5	0.010	5003	4014	ma110401_rel.cz11b_bee
qr500.L3
qr500.L3: range queries with 500 insert/s per client
Performance metrics for all DBMS, not just the ones listed above. Some are normalized by throughput, others are not. Legend for results is here.
ips	qps	rps	rmbps	wps	wmbps	rpq	rkbpq	wpi	wkbpi	csps	cpups	cspq	cpupq	dbgb1	dbgb2	rss	maxop	p50	p99	tag
1994	17799	0	0.0	10070.0	306.3	0.000	0.000	5.049	157.263	100743	55.2	5.660	248	7.8	23.9	8.9	0.036	4443	3900	ma100244_rel.cz11a_bee
1994	17258	0	0.0	10156.1	309.0	0.000	0.000	5.092	158.631	98427	55.3	5.703	256	8.2	24.7	9.5	0.056	4363	3821	ma100339_rel.cz11a_bee
1994	16258	0	0.0	10116.6	307.8	0.000	0.000	5.073	158.016	94381	55.3	5.805	272	8.2	24.7	NA	0.038	4091	3548	ma100433_rel.cz11a_bee
1993	15725	0	0.0	6.8	2.1	0.000	0.000	0.003	1.084	61188	52.0	3.891	265	8.2	25.6	9.4	0.025	3933	3404	ma100524_rel.cz11a_bee
1994	16238	0	0.0	230.0	8.3	0.000	0.000	0.115	4.276	62263	52.4	3.835	258	6.7	22.7	6.7	0.020	4075	3502	ma100617_rel.cz11a_bee
1993	16269	72	0.3	240.5	8.7	0.004	0.018	0.121	4.455	62602	52.6	3.848	259	6.7	22.5	6.5	0.024	4044	3532	ma101107_rel.cz11a_bee
1994	16138	73	0.3	245.5	8.6	0.005	0.018	0.123	4.429	62149	52.5	3.851	260	6.7	22.9	6.6	0.042	4013	3468	ma101107_rel.cz11b_bee
1994	16294	72	0.3	227.2	8.3	0.004	0.018	0.114	4.258	62675	52.7	3.846	259	6.6	22.4	6.5	0.019	4076	3516	ma101107_rel.cz11d_bee
1993	16469	73	0.3	236.5	8.4	0.004	0.018	0.119	4.293	63307	52.5	3.844	255	6.6	22.5	6.5	0.031	4093	3582	ma110401_rel.cz11b_bee
qp500.L4
qp500.L4: point queries with 500 insert/s per client
Performance metrics for all DBMS, not just the ones listed above. Some are normalized by throughput, others are not. Legend for results is here.
ips	qps	rps	rmbps	wps	wmbps	rpq	rkbpq	wpi	wkbpi	csps	cpups	cspq	cpupq	dbgb1	dbgb2	rss	maxop	p50	p99	tag
1994	19513	0	0.0	10282.8	312.7	0.000	0.000	5.156	160.562	108909	57.3	5.581	235	7.8	23.9	8.8	0.029	4910	4459	ma100244_rel.cz11a_bee
1994	18796	0	0.0	10284.9	312.9	0.000	0.000	5.157	160.632	106146	57.2	5.647	243	8.2	24.7	9.5	0.022	4731	4299	ma100339_rel.cz11a_bee
1994	18135	0	0.0	10297.2	313.2	0.000	0.000	5.163	160.820	103790	57.2	5.723	252	8.2	24.7	NA	0.030	4571	4155	ma100433_rel.cz11a_bee
1994	18167	0	0.0	6.8	2.1	0.000	0.000	0.003	1.089	67912	52.8	3.738	233	8.2	25.6	9.4	0.029	4539	4221	ma100524_rel.cz11a_bee
1994	19138	0	0.0	202.1	7.5	0.000	0.000	0.101	3.863	76986	52.3	4.023	219	6.7	22.7	6.7	0.017	4843	4379	ma100617_rel.cz11a_bee
1994	19191	74	0.3	195.9	7.4	0.004	0.015	0.098	3.802	77261	52.4	4.026	218	6.7	22.5	6.5	0.019	4827	4395	ma101107_rel.cz11a_bee
1993	19189	74	0.3	202.0	7.4	0.004	0.015	0.101	3.810	77308	52.4	4.029	218	6.7	22.9	6.5	0.018	4855	4411	ma101107_rel.cz11b_bee
1994	19208	73	0.3	211.7	7.8	0.004	0.015	0.106	4.025	77412	52.4	4.030	218	6.6	22.4	6.5	0.018	4859	4395	ma101107_rel.cz11d_bee
1994	19158	73	0.3	204.8	7.5	0.004	0.015	0.103	3.842	77112	52.2	4.025	218	6.6	22.5	6.5	0.018	4813	4331	ma110401_rel.cz11b_bee
qr1000.L5
qr1000.L5: range queries with 1000 insert/s per client
Performance metrics for all DBMS, not just the ones listed above. Some are normalized by throughput, others are not. Legend for results is here.
ips	qps	rps	rmbps	wps	wmbps	rpq	rkbpq	wpi	wkbpi	csps	cpups	cspq	cpupq	dbgb1	dbgb2	rss	maxop	p50	p99	tag
3989	17320	0	0.0	10190.0	312.0	0.000	0.000	2.555	80.088	98566	57.7	5.691	267	7.8	23.9	8.8	0.037	4365	3852	ma100244_rel.cz11a_bee
3987	16575	0	0.0	10529.8	322.4	0.000	0.000	2.641	82.798	97344	57.5	5.873	278	8.2	24.7	9.5	0.042	4187	3644	ma100339_rel.cz11a_bee
3989	15744	0	0.0	10405.4	318.6	0.000	0.000	2.609	81.784	93425	57.7	5.934	293	8.2	24.7	NA	0.051	3996	3470	ma100433_rel.cz11a_bee
3989	15412	0	0.0	5361.8	163.1	0.000	0.000	1.344	41.873	84473	55.3	5.481	287	8.2	25.6	9.4	0.031	3852	3308	ma100524_rel.cz11a_bee
3989	15971	0	0.0	401.7	15.0	0.000	0.000	0.101	3.847	62072	54.2	3.886	271	6.7	22.7	6.7	0.028	4012	3452	ma100617_rel.cz11a_bee
3989	15856	137	0.5	425.7	15.8	0.009	0.035	0.107	4.053	61745	54.3	3.894	274	6.7	22.5	6.5	0.025	3931	3420	ma101107_rel.cz11a_bee
3989	15676	135	0.5	436.5	15.7	0.009	0.034	0.109	4.035	61213	54.2	3.905	277	6.7	22.9	6.5	0.077	3933	3404	ma101107_rel.cz11b_bee
3989	15793	130	0.5	422.5	15.7	0.008	0.033	0.106	4.032	61493	54.3	3.894	275	6.6	22.4	6.5	0.040	3964	3404	ma101107_rel.cz11d_bee
3989	15856	138	0.5	442.3	15.9	0.009	0.035	0.111	4.070	61653	54.2	3.888	273	6.6	22.5	6.5	0.028	3966	3422	ma110401_rel.cz11b_bee
qp1000.L6
qp1000.L6: point queries with 1000 insert/s per client
Performance metrics for all DBMS, not just the ones listed above. Some are normalized by throughput, others are not. Legend for results is here.
ips	qps	rps	rmbps	wps	wmbps	rpq	rkbpq	wpi	wkbpi	csps	cpups	cspq	cpupq	dbgb1	dbgb2	rss	maxop	p50	p99	tag
3989	18897	0	0.0	10547.4	322.7	0.000	0.000	2.644	82.850	104909	60.2	5.552	255	7.8	23.9	8.8	0.042	4747	4283	ma100244_rel.cz11a_bee
3987	18093	0	0.0	10694.4	327.3	0.000	0.000	2.683	84.066	102940	60.1	5.689	266	8.2	24.7	9.5	0.038	4525	4123	ma100339_rel.cz11a_bee
3989	17476	0	0.0	10701.6	327.5	0.000	0.000	2.683	84.079	100649	60.1	5.759	275	8.2	24.7	NA	0.033	4411	4012	ma100433_rel.cz11a_bee
3989	17035	0	0.0	10275.7	310.7	0.000	0.000	2.576	79.760	109689	58.3	6.439	274	8.2	25.6	9.4	0.030	4283	3947	ma100524_rel.cz11a_bee
3989	18966	0	0.0	423.2	15.6	0.000	0.000	0.106	4.010	76387	55.1	4.028	232	6.7	22.7	6.7	0.029	4763	4474	ma100617_rel.cz11a_bee
3989	18791	139	0.5	420.7	15.6	0.007	0.030	0.105	4.009	75952	55.2	4.042	235	6.7	22.5	6.5	0.016	4715	4413	ma101107_rel.cz11a_bee
3989	18808	141	0.6	440.2	15.8	0.007	0.030	0.110	4.060	76093	55.2	4.046	235	6.7	22.9	6.5	0.020	4731	4381	ma101107_rel.cz11b_bee
3989	18780	144	0.6	422.9	15.7	0.008	0.031	0.106	4.028	75746	55.4	4.033	236	6.6	22.4	6.5	0.022	4717	3981	ma101107_rel.cz11d_bee
3989	18863	143	0.6	436.6	15.7	0.008	0.030	0.109	4.031	76306	55.0	4.045	233	6.6	22.5	6.5	0.025	4715	4379	ma110401_rel.cz11b_bee
l.i0
- l.i0: load without secondary indexes
- Legend for results is here.
- Each entry lists the percentage of responses that fit in that bucket (slower than max time for previous bucket, faster than min time for next bucket).
Insert response time histogram
256us	1ms	4ms	16ms	64ms	256ms	1s	4s	16s	gt	max	tag
0.000	12.431	86.986	0.549	0.017	0.016	0.000	0.000	0.000	0.000	0.150	ma100244_rel.cz11a_bee
0.000	1.176	97.269	1.509	0.029	0.016	0.000	0.000	0.000	0.000	0.154	ma100339_rel.cz11a_bee
0.000	0.385	98.043	1.526	0.030	0.016	0.000	0.000	0.000	0.000	0.147	ma100433_rel.cz11a_bee
0.000	0.961	97.745	1.038	0.236	0.020	0.000	0.000	0.000	0.000	0.146	ma100524_rel.cz11a_bee
0.000	0.795	96.750	2.400	0.034	0.020	0.000	0.000	0.000	0.000	0.217	ma100617_rel.cz11a_bee
0.000	3.082	94.691	2.171	0.037	0.019	0.000	0.000	0.000	0.000	0.196	ma101107_rel.cz11a_bee
0.000	2.473	95.289	2.143	0.075	0.017	0.000	0.000	0.001	0.001	19.505	ma101107_rel.cz11b_bee
0.000	2.832	94.928	2.173	0.048	0.019	0.000	0.000	0.000	0.000	0.191	ma101107_rel.cz11d_bee
0.000	2.108	95.707	2.125	0.040	0.019	0.000	0.000	0.000	0.000	0.200	ma110401_rel.cz11b_bee
l.x
- l.x: create secondary indexes
- Legend for results is here.
- Each entry lists the percentage of responses that fit in that bucket (slower than max time for previous bucket, faster than min time for next bucket).
TODO - determine whether there is data for create index response time
l.i1
- l.i1: continue load after secondary indexes created with 50 inserts per transaction
- Legend for results is here.
- Each entry lists the percentage of responses that fit in that bucket (slower than max time for previous bucket, faster than min time for next bucket).
Insert response time histogram
256us	1ms	4ms	16ms	64ms	256ms	1s	4s	16s	gt	max	tag
0.000	0.000	62.852	35.788	1.359	0.001	0.000	0.000	0.000	0.000	0.128	ma100244_rel.cz11a_bee
0.000	0.000	71.086	28.018	0.890	0.006	0.000	0.000	0.000	0.000	0.170	ma100339_rel.cz11a_bee
0.000	0.000	70.290	28.778	0.927	0.005	0.000	0.000	0.000	0.000	0.168	ma100433_rel.cz11a_bee
0.000	0.000	72.617	27.129	0.196	0.015	0.043	nonzero	0.000	0.000	1.234	ma100524_rel.cz11a_bee
0.000	0.000	65.785	34.034	0.168	0.013	nonzero	0.000	0.000	0.000	0.342	ma100617_rel.cz11a_bee
0.000	0.000	63.882	35.728	0.380	0.010	nonzero	0.000	0.000	0.000	0.294	ma101107_rel.cz11a_bee
0.000	0.000	62.906	33.202	3.859	0.032	0.001	0.000	0.000	0.000	0.515	ma101107_rel.cz11b_bee
0.000	0.000	63.224	36.385	0.381	0.009	nonzero	0.000	0.000	0.000	0.345	ma101107_rel.cz11d_bee
0.000	0.000	65.331	31.546	3.101	0.022	nonzero	0.000	0.000	0.000	0.441	ma110401_rel.cz11b_bee
Delete response time histogram
256us	1ms	4ms	16ms	64ms	256ms	1s	4s	16s	gt	max	tag
0.000	0.000	64.067	34.791	1.141	0.001	0.000	0.000	0.000	0.000	0.130	ma100244_rel.cz11a_bee
0.000	0.000	72.320	26.911	0.763	0.006	0.000	0.000	0.000	0.000	0.165	ma100339_rel.cz11a_bee
0.000	0.000	71.681	27.516	0.798	0.005	0.000	0.000	0.000	0.000	0.170	ma100433_rel.cz11a_bee
0.000	0.000	75.498	24.289	0.156	0.014	0.043	0.000	0.000	0.000	0.993	ma100524_rel.cz11a_bee
0.000	0.000	85.049	14.845	0.096	0.010	nonzero	0.000	0.000	0.000	0.341	ma100617_rel.cz11a_bee
0.000	0.000	77.259	22.493	0.240	0.008	nonzero	0.000	0.000	0.000	0.293	ma101107_rel.cz11a_bee
0.000	0.000	76.929	19.992	3.054	0.024	nonzero	0.000	0.000	0.000	0.352	ma101107_rel.cz11b_bee
0.000	0.000	77.090	22.669	0.233	0.008	nonzero	0.000	0.000	0.000	0.339	ma101107_rel.cz11d_bee
0.000	0.000	75.804	21.729	2.449	0.017	nonzero	0.000	0.000	0.000	0.324	ma110401_rel.cz11b_bee
l.i2
- l.i2: continue load after secondary indexes created with 5 inserts per transaction
- Legend for results is here.
- Each entry lists the percentage of responses that fit in that bucket (slower than max time for previous bucket, faster than min time for next bucket).
Insert response time histogram
256us	1ms	4ms	16ms	64ms	256ms	1s	4s	16s	gt	max	tag
0.003	78.024	20.126	1.835	0.011	0.001	0.000	0.000	0.000	0.000	0.090	ma100244_rel.cz11a_bee
0.003	79.533	18.417	2.012	0.034	0.001	0.000	0.000	0.000	0.000	0.078	ma100339_rel.cz11a_bee
0.001	79.009	18.998	1.950	0.040	0.001	0.000	0.000	0.000	0.000	0.080	ma100433_rel.cz11a_bee
0.012	82.944	16.327	0.650	0.065	nonzero	0.000	0.000	0.000	0.000	0.072	ma100524_rel.cz11a_bee
0.014	87.824	11.224	0.933	0.004	nonzero	0.000	0.000	0.000	0.000	0.066	ma100617_rel.cz11a_bee
0.011	82.903	15.979	1.102	0.004	0.001	0.000	0.000	0.000	0.000	0.145	ma101107_rel.cz11a_bee
0.072	83.677	14.958	1.227	0.065	0.001	0.000	0.000	0.000	0.000	0.237	ma101107_rel.cz11b_bee
0.008	82.505	16.379	1.103	0.003	0.001	0.000	0.000	0.000	0.000	0.109	ma101107_rel.cz11d_bee
0.141	84.496	14.001	1.244	0.117	0.002	0.000	0.000	0.000	0.000	0.138	ma110401_rel.cz11b_bee
Delete response time histogram
256us	1ms	4ms	16ms	64ms	256ms	1s	4s	16s	gt	max	tag
0.004	78.008	20.151	1.826	0.010	0.001	0.000	0.000	0.000	0.000	0.090	ma100244_rel.cz11a_bee
0.005	79.638	18.296	2.027	0.034	0.001	0.000	0.000	0.000	0.000	0.077	ma100339_rel.cz11a_bee
0.004	79.246	18.745	1.965	0.039	0.001	0.000	0.000	0.000	0.000	0.079	ma100433_rel.cz11a_bee
0.019	83.164	16.102	0.649	0.065	nonzero	0.000	0.000	0.000	0.000	0.073	ma100524_rel.cz11a_bee
0.022	87.824	11.096	1.054	0.004	nonzero	0.000	0.000	0.000	0.000	0.067	ma100617_rel.cz11a_bee
0.026	83.191	15.635	1.143	0.004	0.001	0.000	0.000	0.000	0.000	0.144	ma101107_rel.cz11a_bee
0.125	83.946	14.618	1.252	0.057	0.001	0.000	0.000	0.000	0.000	0.220	ma101107_rel.cz11b_bee
0.027	82.897	15.929	1.142	0.003	0.001	0.000	0.000	0.000	0.000	0.110	ma101107_rel.cz11d_bee
0.160	84.532	13.950	1.252	0.105	0.002	0.000	0.000	0.000	0.000	0.127	ma110401_rel.cz11b_bee
qr100.L1
- qr100.L1: range queries with 100 insert/s per client
- Legend for results is here.
- Each entry lists the percentage of responses that fit in that bucket (slower than max time for previous bucket, faster than min time for next bucket).
Query response time histogram
256us	1ms	4ms	16ms	64ms	256ms	1s	4s	16s	gt	max	tag
85.149	14.732	0.114	0.005	nonzero	0.000	0.000	0.000	0.000	0.000	0.027	ma100244_rel.cz11a_bee
81.853	18.033	0.111	0.004	nonzero	0.000	0.000	0.000	0.000	0.000	0.029	ma100339_rel.cz11a_bee
73.453	26.423	0.121	0.004	nonzero	0.000	0.000	0.000	0.000	0.000	0.026	ma100433_rel.cz11a_bee
67.703	32.250	0.046	0.001	0.000	0.000	0.000	0.000	0.000	0.000	0.010	ma100524_rel.cz11a_bee
69.396	30.588	0.016	0.001	0.000	0.000	0.000	0.000	0.000	0.000	0.009	ma100617_rel.cz11a_bee
70.969	29.013	0.016	0.002	0.000	0.000	0.000	0.000	0.000	0.000	0.008	ma101107_rel.cz11a_bee
68.939	31.044	0.016	0.002	0.000	0.000	0.000	0.000	0.000	0.000	0.010	ma101107_rel.cz11b_bee
69.361	30.623	0.015	0.001	0.000	0.000	0.000	0.000	0.000	0.000	0.012	ma101107_rel.cz11d_bee
70.543	29.441	0.015	0.001	0.000	0.000	0.000	0.000	0.000	0.000	0.009	ma110401_rel.cz11b_bee
Insert response time histogram
256us	1ms	4ms	16ms	64ms	256ms	1s	4s	16s	gt	max	tag
0.000	0.000	95.604	4.188	0.208	0.000	0.000	0.000	0.000	0.000	0.051	ma100244_rel.cz11a_bee
0.000	0.000	94.729	4.868	0.403	0.000	0.000	0.000	0.000	0.000	0.040	ma100339_rel.cz11a_bee
0.000	0.000	94.549	5.146	0.306	0.000	0.000	0.000	0.000	0.000	0.044	ma100433_rel.cz11a_bee
0.000	0.000	99.083	0.917	0.000	0.000	0.000	0.000	0.000	0.000	0.010	ma100524_rel.cz11a_bee
0.000	0.000	99.806	0.188	0.007	0.000	0.000	0.000	0.000	0.000	0.016	ma100617_rel.cz11a_bee
0.000	0.000	57.799	42.194	0.007	0.000	0.000	0.000	0.000	0.000	0.019	ma101107_rel.cz11a_bee
0.000	0.000	87.910	12.090	0.000	0.000	0.000	0.000	0.000	0.000	0.012	ma101107_rel.cz11b_bee
0.000	0.000	75.174	24.826	0.000	0.000	0.000	0.000	0.000	0.000	0.014	ma101107_rel.cz11d_bee
0.000	0.000	70.424	29.563	0.014	0.000	0.000	0.000	0.000	0.000	0.017	ma110401_rel.cz11b_bee
Delete response time histogram
256us	1ms	4ms	16ms	64ms	256ms	1s	4s	16s	gt	max	tag
0.000	0.000	96.819	3.035	0.146	0.000	0.000	0.000	0.000	0.000	0.036	ma100244_rel.cz11a_bee
0.000	0.000	96.174	3.625	0.201	0.000	0.000	0.000	0.000	0.000	0.038	ma100339_rel.cz11a_bee
0.000	0.000	96.174	3.653	0.174	0.000	0.000	0.000	0.000	0.000	0.037	ma100433_rel.cz11a_bee
0.000	0.000	99.340	0.660	0.000	0.000	0.000	0.000	0.000	0.000	0.009	ma100524_rel.cz11a_bee
0.000	0.000	99.590	0.410	0.000	0.000	0.000	0.000	0.000	0.000	0.015	ma100617_rel.cz11a_bee
0.000	0.000	59.639	40.347	0.014	0.000	0.000	0.000	0.000	0.000	0.019	ma101107_rel.cz11a_bee
0.000	0.000	87.910	12.090	0.000	0.000	0.000	0.000	0.000	0.000	0.013	ma101107_rel.cz11b_bee
0.000	0.000	75.528	24.472	0.000	0.000	0.000	0.000	0.000	0.000	0.014	ma101107_rel.cz11d_bee
0.000	0.000	71.264	28.736	0.000	0.000	0.000	0.000	0.000	0.000	0.015	ma110401_rel.cz11b_bee
qp100.L2
- qp100.L2: point queries with 100 insert/s per client
- Legend for results is here.
- Each entry lists the percentage of responses that fit in that bucket (slower than max time for previous bucket, faster than min time for next bucket).
Query response time histogram
256us	1ms	4ms	16ms	64ms	256ms	1s	4s	16s	gt	max	tag
98.347	1.626	0.026	0.001	nonzero	0.000	0.000	0.000	0.000	0.000	0.021	ma100244_rel.cz11a_bee
97.018	2.956	0.026	0.001	nonzero	0.000	0.000	0.000	0.000	0.000	0.022	ma100339_rel.cz11a_bee
94.288	5.679	0.032	0.001	nonzero	0.000	0.000	0.000	0.000	0.000	0.021	ma100433_rel.cz11a_bee
93.770	6.222	0.008	nonzero	0.000	0.000	0.000	0.000	0.000	0.000	0.008	ma100524_rel.cz11a_bee
97.055	2.901	0.043	0.001	0.000	0.000	0.000	0.000	0.000	0.000	0.008	ma100617_rel.cz11a_bee
98.034	1.923	0.042	0.001	0.000	0.000	0.000	0.000	0.000	0.000	0.008	ma101107_rel.cz11a_bee
94.936	5.019	0.044	0.002	0.000	0.000	0.000	0.000	0.000	0.000	0.010	ma101107_rel.cz11b_bee
95.813	4.141	0.045	0.001	0.000	0.000	0.000	0.000	0.000	0.000	0.009	ma101107_rel.cz11d_bee
96.711	3.246	0.042	0.001	0.000	0.000	0.000	0.000	0.000	0.000	0.010	ma110401_rel.cz11b_bee
Insert response time histogram
256us	1ms	4ms	16ms	64ms	256ms	1s	4s	16s	gt	max	tag
0.000	0.000	95.465	4.174	0.361	0.000	0.000	0.000	0.000	0.000	0.047	ma100244_rel.cz11a_bee
0.000	0.000	94.035	5.590	0.375	0.000	0.000	0.000	0.000	0.000	0.036	ma100339_rel.cz11a_bee
0.000	0.000	94.861	4.854	0.285	0.000	0.000	0.000	0.000	0.000	0.034	ma100433_rel.cz11a_bee
0.000	0.000	99.160	0.840	0.000	0.000	0.000	0.000	0.000	0.000	0.009	ma100524_rel.cz11a_bee
0.000	0.000	99.708	0.285	0.007	0.000	0.000	0.000	0.000	0.000	0.017	ma100617_rel.cz11a_bee
0.000	0.000	81.306	18.694	0.000	0.000	0.000	0.000	0.000	0.000	0.015	ma101107_rel.cz11a_bee
0.000	0.000	87.646	12.354	0.000	0.000	0.000	0.000	0.000	0.000	0.015	ma101107_rel.cz11b_bee
0.000	0.000	86.646	13.347	0.007	0.000	0.000	0.000	0.000	0.000	0.016	ma101107_rel.cz11d_bee
0.000	0.000	88.153	11.847	0.000	0.000	0.000	0.000	0.000	0.000	0.013	ma110401_rel.cz11b_bee
Delete response time histogram
256us	1ms	4ms	16ms	64ms	256ms	1s	4s	16s	gt	max	tag
0.000	0.000	96.465	3.278	0.257	0.000	0.000	0.000	0.000	0.000	0.033	ma100244_rel.cz11a_bee
0.000	0.000	95.924	3.826	0.250	0.000	0.000	0.000	0.000	0.000	0.031	ma100339_rel.cz11a_bee
0.000	0.000	96.382	3.410	0.208	0.000	0.000	0.000	0.000	0.000	0.033	ma100433_rel.cz11a_bee
0.000	0.000	99.674	0.326	0.000	0.000	0.000	0.000	0.000	0.000	0.010	ma100524_rel.cz11a_bee
0.000	0.000	99.646	0.347	0.007	0.000	0.000	0.000	0.000	0.000	0.016	ma100617_rel.cz11a_bee
0.000	0.000	81.500	18.500	0.000	0.000	0.000	0.000	0.000	0.000	0.014	ma101107_rel.cz11a_bee
0.000	0.000	87.785	12.215	0.000	0.000	0.000	0.000	0.000	0.000	0.016	ma101107_rel.cz11b_bee
0.000	0.000	86.625	13.375	0.000	0.000	0.000	0.000	0.000	0.000	0.015	ma101107_rel.cz11d_bee
0.000	0.000	88.097	11.896	0.007	0.000	0.000	0.000	0.000	0.000	0.017	ma110401_rel.cz11b_bee
qr500.L3
- qr500.L3: range queries with 500 insert/s per client
- Legend for results is here.
- Each entry lists the percentage of responses that fit in that bucket (slower than max time for previous bucket, faster than min time for next bucket).
Query response time histogram
256us	1ms	4ms	16ms	64ms	256ms	1s	4s	16s	gt	max	tag
85.099	14.449	0.410	0.041	0.001	0.000	0.000	0.000	0.000	0.000	0.036	ma100244_rel.cz11a_bee
82.509	17.128	0.319	0.042	0.001	0.000	0.000	0.000	0.000	0.000	0.056	ma100339_rel.cz11a_bee
76.213	23.401	0.342	0.042	0.001	0.000	0.000	0.000	0.000	0.000	0.038	ma100433_rel.cz11a_bee
69.002	30.861	0.116	0.022	nonzero	0.000	0.000	0.000	0.000	0.000	0.025	ma100524_rel.cz11a_bee
72.675	27.202	0.110	0.013	nonzero	0.000	0.000	0.000	0.000	0.000	0.020	ma100617_rel.cz11a_bee
72.673	27.227	0.088	0.012	nonzero	0.000	0.000	0.000	0.000	0.000	0.024	ma101107_rel.cz11a_bee
71.593	28.304	0.087	0.016	nonzero	0.000	0.000	0.000	0.000	0.000	0.042	ma101107_rel.cz11b_bee
72.381	27.521	0.087	0.011	nonzero	0.000	0.000	0.000	0.000	0.000	0.019	ma101107_rel.cz11d_bee
74.076	25.833	0.079	0.012	nonzero	0.000	0.000	0.000	0.000	0.000	0.031	ma110401_rel.cz11b_bee
Insert response time histogram
256us	1ms	4ms	16ms	64ms	256ms	1s	4s	16s	gt	max	tag
0.000	0.000	77.314	20.871	1.815	0.000	0.000	0.000	0.000	0.000	0.063	ma100244_rel.cz11a_bee
0.000	0.000	71.251	26.001	2.747	0.000	0.000	0.000	0.000	0.000	0.054	ma100339_rel.cz11a_bee
0.000	0.000	72.165	25.321	2.514	0.000	0.000	0.000	0.000	0.000	0.057	ma100433_rel.cz11a_bee
0.000	0.000	95.962	3.978	0.060	0.000	0.000	0.000	0.000	0.000	0.036	ma100524_rel.cz11a_bee
0.000	0.000	95.310	4.640	0.050	0.000	0.000	0.000	0.000	0.000	0.039	ma100617_rel.cz11a_bee
0.000	0.000	93.333	6.599	0.068	0.000	0.000	0.000	0.000	0.000	0.040	ma101107_rel.cz11a_bee
0.000	0.000	93.126	6.711	0.161	0.001	0.000	0.000	0.000	0.000	0.065	ma101107_rel.cz11b_bee
0.000	0.000	93.469	6.476	0.054	0.000	0.000	0.000	0.000	0.000	0.030	ma101107_rel.cz11d_bee
0.000	0.000	93.364	6.510	0.126	0.000	0.000	0.000	0.000	0.000	0.036	ma110401_rel.cz11b_bee
Delete response time histogram
256us	1ms	4ms	16ms	64ms	256ms	1s	4s	16s	gt	max	tag
0.000	0.000	82.043	16.636	1.319	0.001	0.000	0.000	0.000	0.000	0.067	ma100244_rel.cz11a_bee
0.000	0.000	77.429	20.617	1.954	0.000	0.000	0.000	0.000	0.000	0.062	ma100339_rel.cz11a_bee
0.000	0.000	78.344	19.893	1.762	0.000	0.000	0.000	0.000	0.000	0.058	ma100433_rel.cz11a_bee
0.000	0.000	97.531	2.447	0.022	0.000	0.000	0.000	0.000	0.000	0.037	ma100524_rel.cz11a_bee
0.000	0.000	97.214	2.763	0.024	0.000	0.000	0.000	0.000	0.000	0.039	ma100617_rel.cz11a_bee
0.000	0.000	95.182	4.783	0.035	0.000	0.000	0.000	0.000	0.000	0.040	ma101107_rel.cz11a_bee
0.000	0.000	95.106	4.814	0.081	0.000	0.000	0.000	0.000	0.000	0.039	ma101107_rel.cz11b_bee
0.000	0.000	95.265	4.715	0.019	0.000	0.000	0.000	0.000	0.000	0.029	ma101107_rel.cz11d_bee
0.000	0.000	95.031	4.897	0.072	0.000	0.000	0.000	0.000	0.000	0.035	ma110401_rel.cz11b_bee
qp500.L4
- qp500.L4: point queries with 500 insert/s per client
- Legend for results is here.
- Each entry lists the percentage of responses that fit in that bucket (slower than max time for previous bucket, faster than min time for next bucket).
Query response time histogram
256us	1ms	4ms	16ms	64ms	256ms	1s	4s	16s	gt	max	tag
96.597	3.251	0.141	0.011	nonzero	0.000	0.000	0.000	0.000	0.000	0.029	ma100244_rel.cz11a_bee
95.183	4.693	0.113	0.011	nonzero	0.000	0.000	0.000	0.000	0.000	0.022	ma100339_rel.cz11a_bee
92.701	7.171	0.116	0.012	nonzero	0.000	0.000	0.000	0.000	0.000	0.030	ma100433_rel.cz11a_bee
92.284	7.694	0.018	0.004	nonzero	0.000	0.000	0.000	0.000	0.000	0.029	ma100524_rel.cz11a_bee
96.054	3.824	0.111	0.011	nonzero	0.000	0.000	0.000	0.000	0.000	0.017	ma100617_rel.cz11a_bee
96.132	3.759	0.099	0.010	nonzero	0.000	0.000	0.000	0.000	0.000	0.019	ma101107_rel.cz11a_bee
95.938	3.943	0.108	0.012	nonzero	0.000	0.000	0.000	0.000	0.000	0.018	ma101107_rel.cz11b_bee
96.113	3.766	0.110	0.011	nonzero	0.000	0.000	0.000	0.000	0.000	0.018	ma101107_rel.cz11d_bee
95.904	3.983	0.100	0.013	nonzero	0.000	0.000	0.000	0.000	0.000	0.018	ma110401_rel.cz11b_bee
Insert response time histogram
256us	1ms	4ms	16ms	64ms	256ms	1s	4s	16s	gt	max	tag
0.000	0.000	82.782	15.338	1.879	0.001	0.000	0.000	0.000	0.000	0.069	ma100244_rel.cz11a_bee
0.000	0.000	80.006	17.908	2.085	0.001	0.000	0.000	0.000	0.000	0.066	ma100339_rel.cz11a_bee
0.000	0.000	77.586	20.044	2.369	0.000	0.000	0.000	0.000	0.000	0.059	ma100433_rel.cz11a_bee
0.000	0.000	97.156	2.797	0.047	0.000	0.000	0.000	0.000	0.000	0.038	ma100524_rel.cz11a_bee
0.000	0.000	96.814	3.151	0.035	0.000	0.000	0.000	0.000	0.000	0.039	ma100617_rel.cz11a_bee
0.000	0.000	95.129	4.835	0.036	0.000	0.000	0.000	0.000	0.000	0.030	ma101107_rel.cz11a_bee
0.000	0.000	92.156	7.754	0.090	0.000	0.000	0.000	0.000	0.000	0.040	ma101107_rel.cz11b_bee
0.000	0.000	93.353	6.603	0.044	0.000	0.000	0.000	0.000	0.000	0.039	ma101107_rel.cz11d_bee
0.000	0.000	93.774	6.112	0.114	0.000	0.000	0.000	0.000	0.000	0.046	ma110401_rel.cz11b_bee
Delete response time histogram
256us	1ms	4ms	16ms	64ms	256ms	1s	4s	16s	gt	max	tag
0.000	0.000	87.026	11.749	1.225	0.000	0.000	0.000	0.000	0.000	0.052	ma100244_rel.cz11a_bee
0.000	0.000	85.125	13.482	1.393	0.000	0.000	0.000	0.000	0.000	0.051	ma100339_rel.cz11a_bee
0.000	0.000	83.439	15.006	1.556	0.000	0.000	0.000	0.000	0.000	0.056	ma100433_rel.cz11a_bee
0.000	0.000	98.268	1.706	0.026	0.000	0.000	0.000	0.000	0.000	0.038	ma100524_rel.cz11a_bee
0.000	0.000	98.118	1.869	0.013	0.000	0.000	0.000	0.000	0.000	0.037	ma100617_rel.cz11a_bee
0.000	0.000	96.296	3.690	0.014	0.000	0.000	0.000	0.000	0.000	0.028	ma101107_rel.cz11a_bee
0.000	0.000	94.221	5.740	0.039	0.000	0.000	0.000	0.000	0.000	0.040	ma101107_rel.cz11b_bee
0.000	0.000	95.157	4.821	0.022	0.000	0.000	0.000	0.000	0.000	0.039	ma101107_rel.cz11d_bee
0.000	0.000	95.283	4.657	0.060	0.000	0.000	0.000	0.000	0.000	0.045	ma110401_rel.cz11b_bee
qr1000.L5
- qr1000.L5: range queries with 1000 insert/s per client
- Legend for results is here.
- Each entry lists the percentage of responses that fit in that bucket (slower than max time for previous bucket, faster than min time for next bucket).
Query response time histogram
256us	1ms	4ms	16ms	64ms	256ms	1s	4s	16s	gt	max	tag
84.873	14.546	0.500	0.078	0.002	0.000	0.000	0.000	0.000	0.000	0.037	ma100244_rel.cz11a_bee
81.427	17.959	0.541	0.071	0.003	0.000	0.000	0.000	0.000	0.000	0.042	ma100339_rel.cz11a_bee
76.090	23.282	0.550	0.075	0.003	0.000	0.000	0.000	0.000	0.000	0.051	ma100433_rel.cz11a_bee
71.003	28.491	0.455	0.051	nonzero	0.000	0.000	0.000	0.000	0.000	0.031	ma100524_rel.cz11a_bee
72.905	26.815	0.252	0.027	nonzero	0.000	0.000	0.000	0.000	0.000	0.028	ma100617_rel.cz11a_bee
72.121	27.597	0.255	0.027	nonzero	0.000	0.000	0.000	0.000	0.000	0.025	ma101107_rel.cz11a_bee
70.838	28.872	0.254	0.034	0.001	nonzero	0.000	0.000	0.000	0.000	0.077	ma101107_rel.cz11b_bee
71.551	28.145	0.278	0.026	nonzero	0.000	0.000	0.000	0.000	0.000	0.040	ma101107_rel.cz11d_bee
72.217	27.531	0.225	0.026	nonzero	0.000	0.000	0.000	0.000	0.000	0.028	ma110401_rel.cz11b_bee
Insert response time histogram
256us	1ms	4ms	16ms	64ms	256ms	1s	4s	16s	gt	max	tag
0.000	0.000	58.472	37.326	4.202	0.001	0.000	0.000	0.000	0.000	0.067	ma100244_rel.cz11a_bee
0.000	0.000	61.134	35.042	3.822	0.002	0.000	0.000	0.000	0.000	0.074	ma100339_rel.cz11a_bee
0.000	0.000	59.494	36.493	4.012	0.001	0.000	0.000	0.000	0.000	0.070	ma100433_rel.cz11a_bee
0.000	0.000	64.597	33.784	1.619	0.000	0.000	0.000	0.000	0.000	0.054	ma100524_rel.cz11a_bee
0.000	0.000	78.119	21.629	0.251	0.000	0.000	0.000	0.000	0.000	0.050	ma100617_rel.cz11a_bee
0.000	0.000	73.843	25.893	0.264	0.000	0.000	0.000	0.000	0.000	0.042	ma101107_rel.cz11a_bee
0.000	0.000	72.099	27.505	0.395	0.001	0.000	0.000	0.000	0.000	0.069	ma101107_rel.cz11b_bee
0.000	0.000	69.611	30.113	0.276	0.000	0.000	0.000	0.000	0.000	0.039	ma101107_rel.cz11d_bee
0.000	0.000	76.920	22.660	0.420	0.000	0.000	0.000	0.000	0.000	0.051	ma110401_rel.cz11b_bee
Delete response time histogram
256us	1ms	4ms	16ms	64ms	256ms	1s	4s	16s	gt	max	tag
0.000	0.000	65.162	31.508	3.330	0.000	0.000	0.000	0.000	0.000	0.063	ma100244_rel.cz11a_bee
0.000	0.000	68.388	28.774	2.838	0.001	0.000	0.000	0.000	0.000	0.070	ma100339_rel.cz11a_bee
0.000	0.000	67.332	29.547	3.122	0.000	0.000	0.000	0.000	0.000	0.062	ma100433_rel.cz11a_bee
0.000	0.000	71.760	27.213	1.028	0.000	0.000	0.000	0.000	0.000	0.058	ma100524_rel.cz11a_bee
0.000	0.000	83.255	16.540	0.205	0.000	0.000	0.000	0.000	0.000	0.042	ma100617_rel.cz11a_bee
0.000	0.000	79.099	20.728	0.174	0.000	0.000	0.000	0.000	0.000	0.044	ma101107_rel.cz11a_bee
0.000	0.000	77.497	22.257	0.245	0.001	0.000	0.000	0.000	0.000	0.071	ma101107_rel.cz11b_bee
0.000	0.000	75.333	24.503	0.164	0.000	0.000	0.000	0.000	0.000	0.042	ma101107_rel.cz11d_bee
0.000	0.000	81.279	18.439	0.282	0.000	0.000	0.000	0.000	0.000	0.053	ma110401_rel.cz11b_bee
qp1000.L6
- qp1000.L6: point queries with 1000 insert/s per client
- Legend for results is here.
- Each entry lists the percentage of responses that fit in that bucket (slower than max time for previous bucket, faster than min time for next bucket).
Query response time histogram
256us	1ms	4ms	16ms	64ms	256ms	1s	4s	16s	gt	max	tag
96.079	3.708	0.181	0.032	0.001	0.000	0.000	0.000	0.000	0.000	0.042	ma100244_rel.cz11a_bee
94.091	5.703	0.179	0.026	0.001	0.000	0.000	0.000	0.000	0.000	0.038	ma100339_rel.cz11a_bee
90.413	9.374	0.184	0.028	0.001	0.000	0.000	0.000	0.000	0.000	0.033	ma100433_rel.cz11a_bee
87.494	12.276	0.208	0.023	nonzero	0.000	0.000	0.000	0.000	0.000	0.030	ma100524_rel.cz11a_bee
94.652	5.225	0.110	0.013	nonzero	0.000	0.000	0.000	0.000	0.000	0.029	ma100617_rel.cz11a_bee
93.645	6.233	0.111	0.012	nonzero	0.000	0.000	0.000	0.000	0.000	0.016	ma101107_rel.cz11a_bee
93.720	6.162	0.107	0.011	nonzero	0.000	0.000	0.000	0.000	0.000	0.020	ma101107_rel.cz11b_bee
93.194	6.697	0.098	0.011	nonzero	0.000	0.000	0.000	0.000	0.000	0.022	ma101107_rel.cz11d_bee
93.863	6.024	0.100	0.013	nonzero	0.000	0.000	0.000	0.000	0.000	0.025	ma110401_rel.cz11b_bee
Insert response time histogram
256us	1ms	4ms	16ms	64ms	256ms	1s	4s	16s	gt	max	tag
0.000	0.000	63.572	31.534	4.893	0.001	0.000	0.000	0.000	0.000	0.068	ma100244_rel.cz11a_bee
0.000	0.000	66.365	29.410	4.221	0.004	0.000	0.000	0.000	0.000	0.084	ma100339_rel.cz11a_bee
0.000	0.000	64.490	30.873	4.636	0.001	0.000	0.000	0.000	0.000	0.066	ma100433_rel.cz11a_bee
0.000	0.000	62.524	34.760	2.716	0.000	0.000	0.000	0.000	0.000	0.054	ma100524_rel.cz11a_bee
0.000	0.000	80.290	19.301	0.408	0.000	0.000	0.000	0.000	0.000	0.054	ma100617_rel.cz11a_bee
0.000	0.000	76.844	22.881	0.276	0.000	0.000	0.000	0.000	0.000	0.038	ma101107_rel.cz11a_bee
0.000	0.000	80.263	19.380	0.358	0.000	0.000	0.000	0.000	0.000	0.050	ma101107_rel.cz11b_bee
0.000	0.000	82.680	17.042	0.278	0.000	0.000	0.000	0.000	0.000	0.044	ma101107_rel.cz11d_bee
0.000	0.000	84.777	14.833	0.390	0.000	0.000	0.000	0.000	0.000	0.053	ma110401_rel.cz11b_bee
Delete response time histogram
256us	1ms	4ms	16ms	64ms	256ms	1s	4s	16s	gt	max	tag
0.000	0.000	69.903	26.408	3.688	0.001	0.000	0.000	0.000	0.000	0.067	ma100244_rel.cz11a_bee
0.000	0.000	73.563	23.320	3.115	0.001	0.000	0.000	0.000	0.000	0.072	ma100339_rel.cz11a_bee
0.000	0.000	71.824	24.800	3.374	0.003	0.000	0.000	0.000	0.000	0.069	ma100433_rel.cz11a_bee
0.000	0.000	69.446	28.818	1.735	0.001	0.000	0.000	0.000	0.000	0.067	ma100524_rel.cz11a_bee
0.000	0.000	84.628	15.036	0.335	0.000	0.000	0.000	0.000	0.000	0.060	ma100617_rel.cz11a_bee
0.000	0.000	81.510	18.310	0.181	0.000	0.000	0.000	0.000	0.000	0.042	ma101107_rel.cz11a_bee
0.000	0.000	84.139	15.667	0.194	0.000	0.000	0.000	0.000	0.000	0.038	ma101107_rel.cz11b_bee
0.000	0.000	86.371	13.469	0.160	0.000	0.000	0.000	0.000	0.000	0.051	ma101107_rel.cz11d_bee
0.000	0.000	87.701	12.081	0.218	0.000	0.000	0.000	0.000	0.000	0.053	ma110401_rel.cz11b_bee