Introduction
This is a report for the insert benchmark with 30M docs and 1 client(s). It is generated by scripts (bash, awk, sed) and Tufte might not be impressed. An overview of the insert benchmark is here and a short update is here. Below, by DBMS, I mean DBMS+version.config. An example is my8020.c10b40 where my means MySQL, 8020 is version 8.0.20 and c10b40 is the name for the configuration file.
The test server has 8 AMD cores, 16G RAM and an NVMe SSD. It is described here as the Beelink. The benchmark was run with 1 client and there were 1 or 3 connections per client (1 for queries or inserts without rate limits, 1+1 for rate limited inserts+deletes). It uses 1 table. It loads 30M rows per table without secondary indexes, creates 3 secondary indexes per table, then inserts 40m+10m rows per table with a delete per insert to avoid growing the table. It then does 6 read+write tests for 1800s each that do queries as fast as possible with 100,100,500,500,1000,1000 inserts/s and the same for deletes/s per client concurrent with the queries. The database is cached in memory. Clients and the DBMS share one server. The per-database configs are in the per-database subdirectories here.
The tested DBMS are:
- ma100433_rel.cz11a_bee - MariaDB 10.4.33 with the cz11a_bee config
- ma100433_rel.cz11abpi1_bee - MariaDB 10.4.33 with the cz11abpi1_bee config that is like cz11a_bee except innodb_buffer_pool_instances and innodb_page_cleaners are reduced to =1
- ma100433_rel.cz11aredo1_bee - MariaDB 10.4.33 with the cz11a_bee config that is like cz11a_bee except there is only 1 large redo log instead of 10 small ones
Contents
- Summary
- l.i0: load without secondary indexes
- l.x: create secondary indexes
- l.i1: continue load after secondary indexes created with 50 inserts per transaction
- l.i2: continue load after secondary indexes created with 5 inserts per transaction
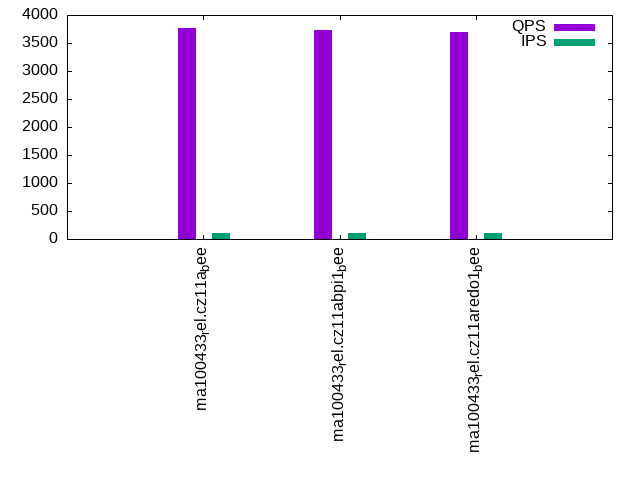
- qr100.L1: range queries with 100 insert/s per client
- qp100.L2: point queries with 100 insert/s per client
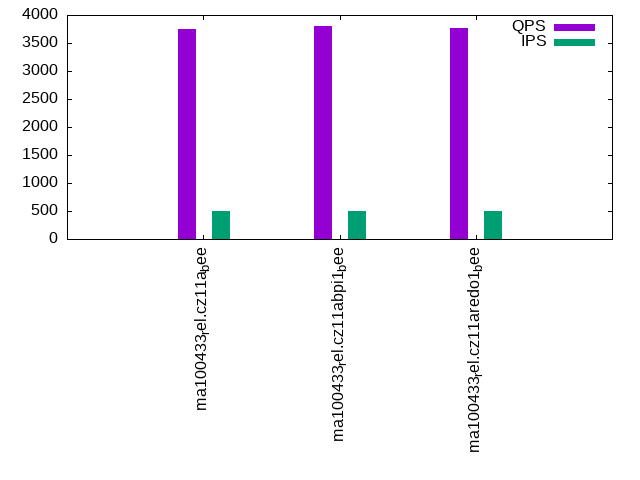
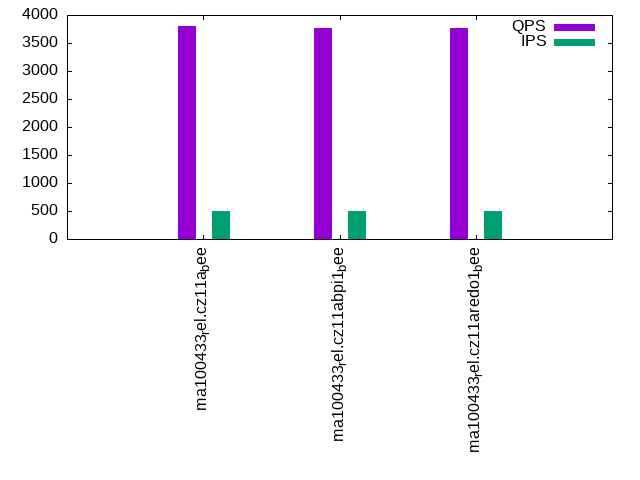
- qr500.L3: range queries with 500 insert/s per client
- qp500.L4: point queries with 500 insert/s per client
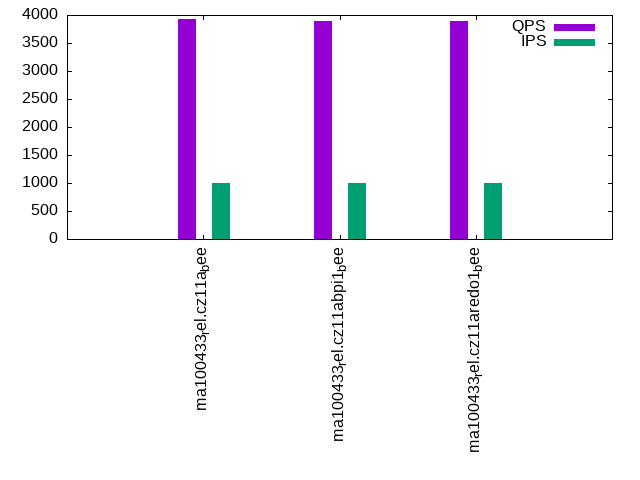
- qr1000.L5: range queries with 1000 insert/s per client
- qp1000.L6: point queries with 1000 insert/s per client
Summary
The numbers are inserts/s for l.i0, l.i1 and l.i2, indexed docs (or rows) /s for l.x and queries/s for qr100, qp100 thru qr1000, qp1000" The values are the average rate over the entire test for inserts (IPS) and queries (QPS). The range of values for IPS and QPS is split into 3 parts: bottom 25%, middle 50%, top 25%. Values in the bottom 25% have a red background, values in the top 25% have a green background and values in the middle have no color. A gray background is used for values that can be ignored because the DBMS did not sustain the target insert rate. Red backgrounds are not used when the minimum value is within 80% of the max value.
| dbms | l.i0 | l.x | l.i1 | l.i2 | qr100 | qp100 | qr500 | qp500 | qr1000 | qp1000 |
|---|---|---|---|---|---|---|---|---|---|---|
| ma100433_rel.cz11a_bee | 83102 | 152285 | 16522 | 10040 | 3713 | 3764 | 3757 | 3805 | 3814 | 3920 |
| ma100433_rel.cz11abpi1_bee | 82192 | 152285 | 15754 | 9794 | 3700 | 3729 | 3812 | 3768 | 3841 | 3889 |
| ma100433_rel.cz11aredo1_bee | 82873 | 152285 | 16116 | 9881 | 3698 | 3690 | 3760 | 3776 | 3789 | 3900 |
This table has relative throughput, throughput for the DBMS relative to the DBMS in the first line, using the absolute throughput from the previous table. Values less than 0.95 have a yellow background. Values greater than 1.05 have a blue background.
| dbms | l.i0 | l.x | l.i1 | l.i2 | qr100 | qp100 | qr500 | qp500 | qr1000 | qp1000 |
|---|---|---|---|---|---|---|---|---|---|---|
| ma100433_rel.cz11a_bee | 1.00 | 1.00 | 1.00 | 1.00 | 1.00 | 1.00 | 1.00 | 1.00 | 1.00 | 1.00 |
| ma100433_rel.cz11abpi1_bee | 0.99 | 1.00 | 0.95 | 0.98 | 1.00 | 0.99 | 1.01 | 0.99 | 1.01 | 0.99 |
| ma100433_rel.cz11aredo1_bee | 1.00 | 1.00 | 0.98 | 0.98 | 1.00 | 0.98 | 1.00 | 0.99 | 0.99 | 0.99 |
This lists the average rate of inserts/s for the tests that do inserts concurrent with queries. For such tests the query rate is listed in the table above. The read+write tests are setup so that the insert rate should match the target rate every second. Cells that are not at least 95% of the target have a red background to indicate a failure to satisfy the target.
| dbms | qr100.L1 | qp100.L2 | qr500.L3 | qp500.L4 | qr1000.L5 | qp1000.L6 |
|---|---|---|---|---|---|---|
| ma100433_rel.cz11a_bee | 100 | 100 | 499 | 499 | 998 | 998 |
| ma100433_rel.cz11abpi1_bee | 100 | 100 | 499 | 499 | 998 | 998 |
| ma100433_rel.cz11aredo1_bee | 100 | 100 | 499 | 499 | 998 | 998 |
| target | 100 | 100 | 500 | 500 | 1000 | 1000 |
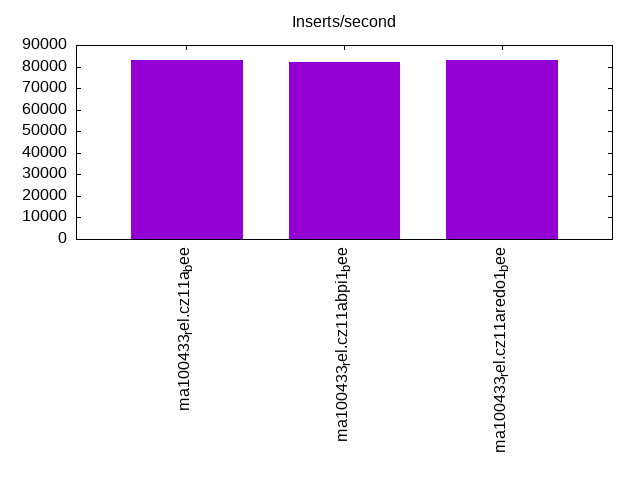
l.i0
l.i0: load without secondary indexes. Graphs for performance per 1-second interval are here.
Average throughput:
Insert response time histogram: each cell has the percentage of responses that take <= the time in the header and max is the max response time in seconds. For the max column values in the top 25% of the range have a red background and in the bottom 25% of the range have a green background. The red background is not used when the min value is within 80% of the max value.
| dbms | 256us | 1ms | 4ms | 16ms | 64ms | 256ms | 1s | 4s | 16s | gt | max |
|---|---|---|---|---|---|---|---|---|---|---|---|
| ma100433_rel.cz11a_bee | 2.219 | 97.372 | 0.370 | 0.035 | 0.004 | 0.153 | |||||
| ma100433_rel.cz11abpi1_bee | 3.266 | 96.211 | 0.481 | 0.039 | 0.004 | 0.145 | |||||
| ma100433_rel.cz11aredo1_bee | 2.866 | 96.651 | 0.449 | 0.030 | 0.004 | 0.141 |
Performance metrics for the DBMS listed above. Some are normalized by throughput, others are not. Legend for results is here.
ips	qps	rps	rmbps	wps	wmbps	rpq	rkbpq	wpi	wkbpi	csps	cpups	cspq	cpupq	dbgb1	dbgb2	rss	maxop	p50	p99	tag
83102	0	0	0.0	459.9	32.9	0.000	0.000	0.006	0.405	27677	33.9	0.333	33	2.0	17.8	NA	0.153	83807	69221	ma100433_rel.cz11a_bee
82192	0	0	0.0	522.6	34.8	0.000	0.000	0.006	0.433	27618	33.8	0.336	33	2.0	17.8	NA	0.145	82909	67026	ma100433_rel.cz11abpi1_bee
82873	0	0	0.0	505.9	34.2	0.000	0.000	0.006	0.422	27773	33.9	0.335	33	2.0	17.8	NA	0.141	83409	67256	ma100433_rel.cz11aredo1_bee
l.x
l.x: create secondary indexes.
Average throughput:

Performance metrics for the DBMS listed above. Some are normalized by throughput, others are not. Legend for results is here.
ips	qps	rps	rmbps	wps	wmbps	rpq	rkbpq	wpi	wkbpi	csps	cpups	cspq	cpupq	dbgb1	dbgb2	rss	maxop	p50	p99	tag
152285	0	0	0.0	779.4	134.6	0.000	0.000	0.005	0.905	6906	12.4	0.045	7	4.5	20.3	NA	0.001	NA	NA	ma100433_rel.cz11a_bee
152285	0	0	0.0	771.1	134.7	0.000	0.000	0.005	0.906	2832	12.2	0.019	6	4.5	20.3	NA	0.002	NA	NA	ma100433_rel.cz11abpi1_bee
152285	0	0	0.0	782.8	134.7	0.000	0.000	0.005	0.906	6967	12.6	0.046	7	4.5	20.3	NA	0.002	NA	NA	ma100433_rel.cz11aredo1_bee
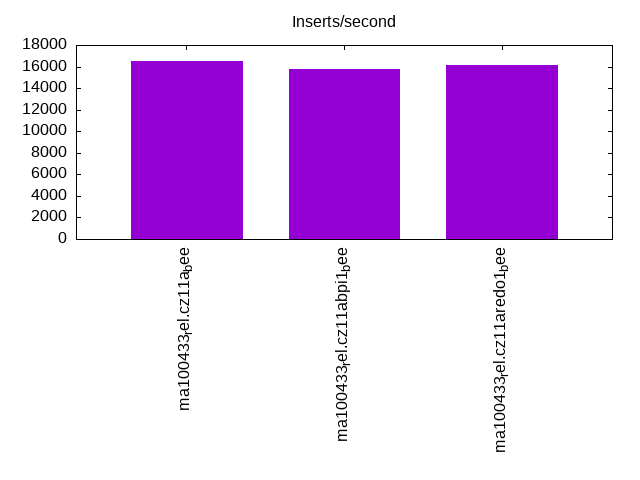
l.i1
l.i1: continue load after secondary indexes created with 50 inserts per transaction. Graphs for performance per 1-second interval are here.
Average throughput:
Insert response time histogram: each cell has the percentage of responses that take <= the time in the header and max is the max response time in seconds. For the max column values in the top 25% of the range have a red background and in the bottom 25% of the range have a green background. The red background is not used when the min value is within 80% of the max value.
| dbms | 256us | 1ms | 4ms | 16ms | 64ms | 256ms | 1s | 4s | 16s | gt | max |
|---|---|---|---|---|---|---|---|---|---|---|---|
| ma100433_rel.cz11a_bee | 89.775 | 10.104 | 0.120 | 0.001 | 0.122 | ||||||
| ma100433_rel.cz11abpi1_bee | 88.758 | 11.060 | 0.181 | 0.001 | 0.121 | ||||||
| ma100433_rel.cz11aredo1_bee | 88.265 | 11.605 | 0.129 | 0.001 | 0.118 |
Delete response time histogram: each cell has the percentage of responses that take <= the time in the header and max is the max response time in seconds. For the max column values in the top 25% of the range have a red background and in the bottom 25% of the range have a green background. The red background is not used when the min value is within 80% of the max value.
| dbms | 256us | 1ms | 4ms | 16ms | 64ms | 256ms | 1s | 4s | 16s | gt | max |
|---|---|---|---|---|---|---|---|---|---|---|---|
| ma100433_rel.cz11a_bee | 92.937 | 7.026 | 0.036 | 0.001 | 0.074 | ||||||
| ma100433_rel.cz11abpi1_bee | 92.196 | 7.750 | 0.054 | nonzero | 0.072 | ||||||
| ma100433_rel.cz11aredo1_bee | 91.534 | 8.421 | 0.045 | 0.001 | 0.069 |
Performance metrics for the DBMS listed above. Some are normalized by throughput, others are not. Legend for results is here.
ips	qps	rps	rmbps	wps	wmbps	rpq	rkbpq	wpi	wkbpi	csps	cpups	cspq	cpupq	dbgb1	dbgb2	rss	maxop	p50	p99	tag
16522	0	0	0.0	6187.7	210.2	0.000	0.000	0.375	13.029	39510	51.5	2.391	249	6.1	22.0	NA	0.122	17231	4845	ma100433_rel.cz11a_bee
15754	0	0	0.0	4794.6	167.1	0.000	0.000	0.304	10.860	33184	49.6	2.106	252	6.1	22.0	NA	0.121	16182	4697	ma100433_rel.cz11abpi1_bee
16116	0	0	0.0	7232.7	240.9	0.000	0.000	0.449	15.308	42411	51.1	2.632	254	6.1	22.0	NA	0.118	16581	5344	ma100433_rel.cz11aredo1_bee
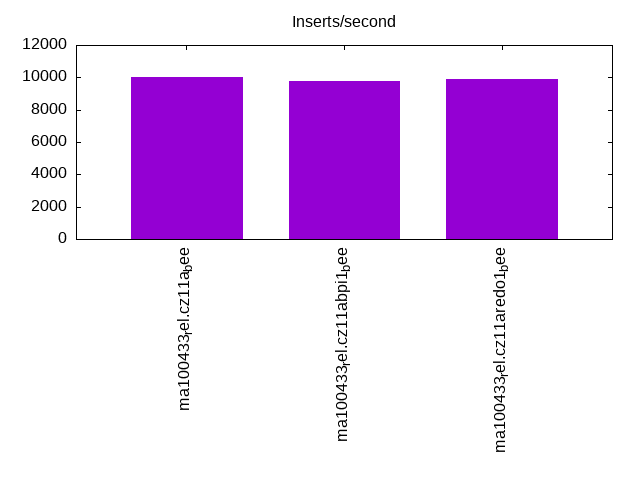
l.i2
l.i2: continue load after secondary indexes created with 5 inserts per transaction. Graphs for performance per 1-second interval are here.
Average throughput:
Insert response time histogram: each cell has the percentage of responses that take <= the time in the header and max is the max response time in seconds. For the max column values in the top 25% of the range have a red background and in the bottom 25% of the range have a green background. The red background is not used when the min value is within 80% of the max value.
| dbms | 256us | 1ms | 4ms | 16ms | 64ms | 256ms | 1s | 4s | 16s | gt | max |
|---|---|---|---|---|---|---|---|---|---|---|---|
| ma100433_rel.cz11a_bee | 0.175 | 98.321 | 0.371 | 1.130 | 0.003 | 0.046 | |||||
| ma100433_rel.cz11abpi1_bee | 0.321 | 98.198 | 0.351 | 1.127 | 0.003 | 0.050 | |||||
| ma100433_rel.cz11aredo1_bee | 0.155 | 98.229 | 0.411 | 1.202 | 0.003 | 0.049 |
Delete response time histogram: each cell has the percentage of responses that take <= the time in the header and max is the max response time in seconds. For the max column values in the top 25% of the range have a red background and in the bottom 25% of the range have a green background. The red background is not used when the min value is within 80% of the max value.
| dbms | 256us | 1ms | 4ms | 16ms | 64ms | 256ms | 1s | 4s | 16s | gt | max |
|---|---|---|---|---|---|---|---|---|---|---|---|
| ma100433_rel.cz11a_bee | 2.983 | 95.468 | 0.424 | 1.123 | 0.002 | 0.046 | |||||
| ma100433_rel.cz11abpi1_bee | 3.198 | 95.367 | 0.310 | 1.122 | 0.003 | 0.050 | |||||
| ma100433_rel.cz11aredo1_bee | 2.585 | 95.757 | 0.458 | 1.198 | 0.002 | 0.048 |
Performance metrics for the DBMS listed above. Some are normalized by throughput, others are not. Legend for results is here.
ips	qps	rps	rmbps	wps	wmbps	rpq	rkbpq	wpi	wkbpi	csps	cpups	cspq	cpupq	dbgb1	dbgb2	rss	maxop	p50	p99	tag
10040	0	0	0.0	7876.3	249.8	0.000	0.000	0.784	25.472	121492	46.5	12.101	371	6.1	22.0	NA	0.046	10014	8629	ma100433_rel.cz11a_bee
9794	0	0	0.0	6254.8	200.6	0.000	0.000	0.639	20.968	115440	45.6	11.786	372	6.1	22.0	NA	0.050	9714	8146	ma100433_rel.cz11abpi1_bee
9881	0	0	0.0	8215.9	259.8	0.000	0.000	0.831	26.924	121046	46.4	12.250	376	6.1	22.0	NA	0.049	9839	8271	ma100433_rel.cz11aredo1_bee
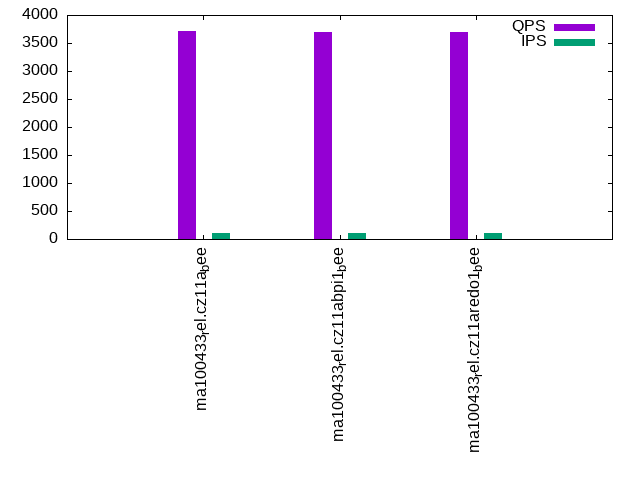
qr100.L1
qr100.L1: range queries with 100 insert/s per client. Graphs for performance per 1-second interval are here.
Average throughput:
Query response time histogram: each cell has the percentage of responses that take <= the time in the header and max is the max response time in seconds. For max values in the top 25% of the range have a red background and in the bottom 25% of the range have a green background. The red background is not used when the min value is within 80% of the max value.
| dbms | 256us | 1ms | 4ms | 16ms | 64ms | 256ms | 1s | 4s | 16s | gt | max |
|---|---|---|---|---|---|---|---|---|---|---|---|
| ma100433_rel.cz11a_bee | 62.255 | 37.741 | 0.003 | nonzero | nonzero | 0.021 | |||||
| ma100433_rel.cz11abpi1_bee | 62.268 | 37.728 | 0.003 | nonzero | nonzero | 0.024 | |||||
| ma100433_rel.cz11aredo1_bee | 61.697 | 38.299 | 0.004 | nonzero | nonzero | 0.024 |
Insert response time histogram: each cell has the percentage of responses that take <= the time in the header and max is the max response time in seconds. For max values in the top 25% of the range have a red background and in the bottom 25% of the range have a green background. The red background is not used when the min value is within 80% of the max value.
| dbms | 256us | 1ms | 4ms | 16ms | 64ms | 256ms | 1s | 4s | 16s | gt | max |
|---|---|---|---|---|---|---|---|---|---|---|---|
| ma100433_rel.cz11a_bee | 95.250 | 3.167 | 1.583 | 0.038 | |||||||
| ma100433_rel.cz11abpi1_bee | 95.194 | 2.833 | 1.972 | 0.040 | |||||||
| ma100433_rel.cz11aredo1_bee | 95.500 | 3.306 | 1.194 | 0.037 |
Delete response time histogram: each cell has the percentage of responses that take <= the time in the header and max is the max response time in seconds. For max values in the top 25% of the range have a red background and in the bottom 25% of the range have a green background. The red background is not used when the min value is within 80% of the max value.
| dbms | 256us | 1ms | 4ms | 16ms | 64ms | 256ms | 1s | 4s | 16s | gt | max |
|---|---|---|---|---|---|---|---|---|---|---|---|
| ma100433_rel.cz11a_bee | 96.167 | 2.944 | 0.889 | 0.038 | |||||||
| ma100433_rel.cz11abpi1_bee | 96.083 | 2.639 | 1.278 | 0.032 | |||||||
| ma100433_rel.cz11aredo1_bee | 96.056 | 3.083 | 0.861 | 0.032 |
Performance metrics for the DBMS listed above. Some are normalized by throughput, others are not. Legend for results is here.
ips	qps	rps	rmbps	wps	wmbps	rpq	rkbpq	wpi	wkbpi	csps	cpups	cspq	cpupq	dbgb1	dbgb2	rss	maxop	p50	p99	tag
100	3713	0	0.0	786.2	23.7	0.000	0.000	7.878	243.009	17838	13.7	4.805	295	6.1	22.0	NA	0.021	3660	3500	ma100433_rel.cz11a_bee
100	3700	0	0.0	782.3	23.7	0.000	0.000	7.839	242.769	17857	13.6	4.826	294	6.1	22.0	NA	0.024	3675	3500	ma100433_rel.cz11abpi1_bee
100	3698	0	0.0	790.2	23.8	0.000	0.000	7.918	244.254	17808	13.8	4.816	299	6.1	22.0	NA	0.024	3660	3484	ma100433_rel.cz11aredo1_bee
qp100.L2
qp100.L2: point queries with 100 insert/s per client. Graphs for performance per 1-second interval are here.
Average throughput:
Query response time histogram: each cell has the percentage of responses that take <= the time in the header and max is the max response time in seconds. For max values in the top 25% of the range have a red background and in the bottom 25% of the range have a green background. The red background is not used when the min value is within 80% of the max value.
| dbms | 256us | 1ms | 4ms | 16ms | 64ms | 256ms | 1s | 4s | 16s | gt | max |
|---|---|---|---|---|---|---|---|---|---|---|---|
| ma100433_rel.cz11a_bee | 76.429 | 23.569 | 0.002 | nonzero | nonzero | 0.023 | |||||
| ma100433_rel.cz11abpi1_bee | 76.544 | 23.453 | 0.002 | nonzero | nonzero | 0.017 | |||||
| ma100433_rel.cz11aredo1_bee | 72.391 | 27.606 | 0.002 | nonzero | nonzero | 0.018 |
Insert response time histogram: each cell has the percentage of responses that take <= the time in the header and max is the max response time in seconds. For max values in the top 25% of the range have a red background and in the bottom 25% of the range have a green background. The red background is not used when the min value is within 80% of the max value.
| dbms | 256us | 1ms | 4ms | 16ms | 64ms | 256ms | 1s | 4s | 16s | gt | max |
|---|---|---|---|---|---|---|---|---|---|---|---|
| ma100433_rel.cz11a_bee | 95.222 | 3.583 | 1.194 | 0.048 | |||||||
| ma100433_rel.cz11abpi1_bee | 94.889 | 3.250 | 1.861 | 0.038 | |||||||
| ma100433_rel.cz11aredo1_bee | 95.500 | 3.361 | 1.139 | 0.034 |
Delete response time histogram: each cell has the percentage of responses that take <= the time in the header and max is the max response time in seconds. For max values in the top 25% of the range have a red background and in the bottom 25% of the range have a green background. The red background is not used when the min value is within 80% of the max value.
| dbms | 256us | 1ms | 4ms | 16ms | 64ms | 256ms | 1s | 4s | 16s | gt | max |
|---|---|---|---|---|---|---|---|---|---|---|---|
| ma100433_rel.cz11a_bee | 96.361 | 2.750 | 0.889 | 0.043 | |||||||
| ma100433_rel.cz11abpi1_bee | 95.528 | 3.056 | 1.417 | 0.034 | |||||||
| ma100433_rel.cz11aredo1_bee | 95.861 | 3.333 | 0.806 | 0.034 |
Performance metrics for the DBMS listed above. Some are normalized by throughput, others are not. Legend for results is here.
ips	qps	rps	rmbps	wps	wmbps	rpq	rkbpq	wpi	wkbpi	csps	cpups	cspq	cpupq	dbgb1	dbgb2	rss	maxop	p50	p99	tag
100	3764	0	0.0	784.4	23.6	0.000	0.000	7.859	242.401	18800	14.3	4.995	304	6.1	22.0	NA	0.023	3596	3276	ma100433_rel.cz11a_bee
100	3729	0	0.0	778.6	23.5	0.000	0.000	7.801	241.543	18713	14.6	5.018	313	6.1	22.0	NA	0.017	3565	3292	ma100433_rel.cz11abpi1_bee
100	3690	0	0.0	785.6	23.7	0.000	0.000	7.872	242.820	18511	14.3	5.017	310	6.1	22.0	NA	0.018	3548	3276	ma100433_rel.cz11aredo1_bee
qr500.L3
qr500.L3: range queries with 500 insert/s per client. Graphs for performance per 1-second interval are here.
Average throughput:
Query response time histogram: each cell has the percentage of responses that take <= the time in the header and max is the max response time in seconds. For max values in the top 25% of the range have a red background and in the bottom 25% of the range have a green background. The red background is not used when the min value is within 80% of the max value.
| dbms | 256us | 1ms | 4ms | 16ms | 64ms | 256ms | 1s | 4s | 16s | gt | max |
|---|---|---|---|---|---|---|---|---|---|---|---|
| ma100433_rel.cz11a_bee | 64.700 | 35.273 | 0.022 | 0.004 | 0.001 | 0.030 | |||||
| ma100433_rel.cz11abpi1_bee | 66.245 | 33.729 | 0.020 | 0.005 | nonzero | 0.025 | |||||
| ma100433_rel.cz11aredo1_bee | 64.619 | 35.354 | 0.022 | 0.005 | 0.001 | 0.026 |
Insert response time histogram: each cell has the percentage of responses that take <= the time in the header and max is the max response time in seconds. For max values in the top 25% of the range have a red background and in the bottom 25% of the range have a green background. The red background is not used when the min value is within 80% of the max value.
| dbms | 256us | 1ms | 4ms | 16ms | 64ms | 256ms | 1s | 4s | 16s | gt | max |
|---|---|---|---|---|---|---|---|---|---|---|---|
| ma100433_rel.cz11a_bee | 87.678 | 9.194 | 3.128 | 0.046 | |||||||
| ma100433_rel.cz11abpi1_bee | 87.739 | 8.944 | 3.317 | 0.047 | |||||||
| ma100433_rel.cz11aredo1_bee | 87.672 | 8.978 | 3.350 | 0.047 |
Delete response time histogram: each cell has the percentage of responses that take <= the time in the header and max is the max response time in seconds. For max values in the top 25% of the range have a red background and in the bottom 25% of the range have a green background. The red background is not used when the min value is within 80% of the max value.
| dbms | 256us | 1ms | 4ms | 16ms | 64ms | 256ms | 1s | 4s | 16s | gt | max |
|---|---|---|---|---|---|---|---|---|---|---|---|
| ma100433_rel.cz11a_bee | 88.783 | 8.706 | 2.511 | 0.045 | |||||||
| ma100433_rel.cz11abpi1_bee | 88.639 | 8.572 | 2.789 | 0.046 | |||||||
| ma100433_rel.cz11aredo1_bee | 88.761 | 8.433 | 2.806 | 0.036 |
Performance metrics for the DBMS listed above. Some are normalized by throughput, others are not. Legend for results is here.
ips	qps	rps	rmbps	wps	wmbps	rpq	rkbpq	wpi	wkbpi	csps	cpups	cspq	cpupq	dbgb1	dbgb2	rss	maxop	p50	p99	tag
499	3757	0	0.0	3292.3	99.9	0.000	0.000	6.596	204.868	25610	15.7	6.816	334	6.1	22.0	NA	0.030	3724	3452	ma100433_rel.cz11a_bee
499	3812	0	0.0	3190.0	96.9	0.000	0.000	6.392	198.728	25811	15.7	6.771	329	6.1	22.0	NA	0.025	3771	3499	ma100433_rel.cz11abpi1_bee
499	3760	0	0.0	3288.8	99.7	0.000	0.000	6.589	204.655	25618	15.9	6.814	338	6.1	22.0	NA	0.026	3724	3436	ma100433_rel.cz11aredo1_bee
qp500.L4
qp500.L4: point queries with 500 insert/s per client. Graphs for performance per 1-second interval are here.
Average throughput:
Query response time histogram: each cell has the percentage of responses that take <= the time in the header and max is the max response time in seconds. For max values in the top 25% of the range have a red background and in the bottom 25% of the range have a green background. The red background is not used when the min value is within 80% of the max value.
| dbms | 256us | 1ms | 4ms | 16ms | 64ms | 256ms | 1s | 4s | 16s | gt | max |
|---|---|---|---|---|---|---|---|---|---|---|---|
| ma100433_rel.cz11a_bee | 77.171 | 22.820 | 0.008 | 0.001 | nonzero | 0.024 | |||||
| ma100433_rel.cz11abpi1_bee | 74.118 | 25.873 | 0.008 | 0.001 | nonzero | 0.023 | |||||
| ma100433_rel.cz11aredo1_bee | 72.955 | 27.035 | 0.008 | 0.001 | nonzero | 0.017 |
Insert response time histogram: each cell has the percentage of responses that take <= the time in the header and max is the max response time in seconds. For max values in the top 25% of the range have a red background and in the bottom 25% of the range have a green background. The red background is not used when the min value is within 80% of the max value.
| dbms | 256us | 1ms | 4ms | 16ms | 64ms | 256ms | 1s | 4s | 16s | gt | max |
|---|---|---|---|---|---|---|---|---|---|---|---|
| ma100433_rel.cz11a_bee | 87.483 | 9.322 | 3.194 | 0.045 | |||||||
| ma100433_rel.cz11abpi1_bee | 87.694 | 9.278 | 3.028 | 0.045 | |||||||
| ma100433_rel.cz11aredo1_bee | 87.750 | 9.156 | 3.094 | 0.058 |
Delete response time histogram: each cell has the percentage of responses that take <= the time in the header and max is the max response time in seconds. For max values in the top 25% of the range have a red background and in the bottom 25% of the range have a green background. The red background is not used when the min value is within 80% of the max value.
| dbms | 256us | 1ms | 4ms | 16ms | 64ms | 256ms | 1s | 4s | 16s | gt | max |
|---|---|---|---|---|---|---|---|---|---|---|---|
| ma100433_rel.cz11a_bee | 88.806 | 8.622 | 2.572 | 0.044 | |||||||
| ma100433_rel.cz11abpi1_bee | 88.661 | 8.767 | 2.572 | 0.037 | |||||||
| ma100433_rel.cz11aredo1_bee | 88.756 | 8.956 | 2.289 | 0.042 |
Performance metrics for the DBMS listed above. Some are normalized by throughput, others are not. Legend for results is here.
ips	qps	rps	rmbps	wps	wmbps	rpq	rkbpq	wpi	wkbpi	csps	cpups	cspq	cpupq	dbgb1	dbgb2	rss	maxop	p50	p99	tag
499	3805	0	0.0	3288.8	99.7	0.000	0.000	6.593	204.772	26618	16.7	6.996	351	6.1	22.0	NA	0.024	3692	3324	ma100433_rel.cz11a_bee
499	3768	0	0.0	3276.8	99.5	0.000	0.000	6.565	204.122	26732	16.7	7.094	355	6.1	22.0	NA	0.023	3662	3324	ma100433_rel.cz11abpi1_bee
499	3776	0	0.0	3295.2	99.9	0.000	0.000	6.602	205.054	26538	16.8	7.028	356	6.1	22.0	NA	0.017	3676	3308	ma100433_rel.cz11aredo1_bee
qr1000.L5
qr1000.L5: range queries with 1000 insert/s per client. Graphs for performance per 1-second interval are here.
Average throughput:

Query response time histogram: each cell has the percentage of responses that take <= the time in the header and max is the max response time in seconds. For max values in the top 25% of the range have a red background and in the bottom 25% of the range have a green background. The red background is not used when the min value is within 80% of the max value.
| dbms | 256us | 1ms | 4ms | 16ms | 64ms | 256ms | 1s | 4s | 16s | gt | max |
|---|---|---|---|---|---|---|---|---|---|---|---|
| ma100433_rel.cz11a_bee | 67.370 | 32.519 | 0.099 | 0.011 | 0.001 | 0.025 | |||||
| ma100433_rel.cz11abpi1_bee | 67.521 | 32.393 | 0.079 | 0.007 | 0.001 | 0.025 | |||||
| ma100433_rel.cz11aredo1_bee | 66.180 | 33.708 | 0.101 | 0.010 | 0.001 | 0.032 |
Insert response time histogram: each cell has the percentage of responses that take <= the time in the header and max is the max response time in seconds. For max values in the top 25% of the range have a red background and in the bottom 25% of the range have a green background. The red background is not used when the min value is within 80% of the max value.
| dbms | 256us | 1ms | 4ms | 16ms | 64ms | 256ms | 1s | 4s | 16s | gt | max |
|---|---|---|---|---|---|---|---|---|---|---|---|
| ma100433_rel.cz11a_bee | 80.289 | 16.486 | 3.225 | 0.044 | |||||||
| ma100433_rel.cz11abpi1_bee | 83.528 | 14.267 | 2.206 | 0.064 | |||||||
| ma100433_rel.cz11aredo1_bee | 80.422 | 16.403 | 3.175 | 0.052 |
Delete response time histogram: each cell has the percentage of responses that take <= the time in the header and max is the max response time in seconds. For max values in the top 25% of the range have a red background and in the bottom 25% of the range have a green background. The red background is not used when the min value is within 80% of the max value.
| dbms | 256us | 1ms | 4ms | 16ms | 64ms | 256ms | 1s | 4s | 16s | gt | max |
|---|---|---|---|---|---|---|---|---|---|---|---|
| ma100433_rel.cz11a_bee | 83.203 | 14.142 | 2.656 | 0.040 | |||||||
| ma100433_rel.cz11abpi1_bee | 86.283 | 12.081 | 1.636 | 0.040 | |||||||
| ma100433_rel.cz11aredo1_bee | 83.292 | 14.161 | 2.547 | 0.043 |
Performance metrics for the DBMS listed above. Some are normalized by throughput, others are not. Legend for results is here.
ips	qps	rps	rmbps	wps	wmbps	rpq	rkbpq	wpi	wkbpi	csps	cpups	cspq	cpupq	dbgb1	dbgb2	rss	maxop	p50	p99	tag
998	3814	0	0.0	5912.1	179.5	0.000	0.000	5.922	184.111	35759	18.3	9.374	384	6.1	22.0	NA	0.025	3788	3420	ma100433_rel.cz11a_bee
998	3841	0	0.0	5247.3	159.5	0.000	0.000	5.256	163.657	33739	18.0	8.783	375	6.1	22.0	NA	0.025	3806	3452	ma100433_rel.cz11abpi1_bee
998	3789	0	0.0	5913.4	179.5	0.000	0.000	5.924	184.162	35624	18.4	9.401	388	6.1	22.0	NA	0.032	3757	3372	ma100433_rel.cz11aredo1_bee
qp1000.L6
qp1000.L6: point queries with 1000 insert/s per client. Graphs for performance per 1-second interval are here.
Average throughput:
Query response time histogram: each cell has the percentage of responses that take <= the time in the header and max is the max response time in seconds. For max values in the top 25% of the range have a red background and in the bottom 25% of the range have a green background. The red background is not used when the min value is within 80% of the max value.
| dbms | 256us | 1ms | 4ms | 16ms | 64ms | 256ms | 1s | 4s | 16s | gt | max |
|---|---|---|---|---|---|---|---|---|---|---|---|
| ma100433_rel.cz11a_bee | 80.806 | 19.163 | 0.029 | 0.002 | nonzero | 0.021 | |||||
| ma100433_rel.cz11abpi1_bee | 79.256 | 20.714 | 0.028 | 0.001 | nonzero | 0.025 | |||||
| ma100433_rel.cz11aredo1_bee | 78.788 | 21.178 | 0.032 | 0.002 | nonzero | 0.022 |
Insert response time histogram: each cell has the percentage of responses that take <= the time in the header and max is the max response time in seconds. For max values in the top 25% of the range have a red background and in the bottom 25% of the range have a green background. The red background is not used when the min value is within 80% of the max value.
| dbms | 256us | 1ms | 4ms | 16ms | 64ms | 256ms | 1s | 4s | 16s | gt | max |
|---|---|---|---|---|---|---|---|---|---|---|---|
| ma100433_rel.cz11a_bee | 81.250 | 15.883 | 2.867 | 0.049 | |||||||
| ma100433_rel.cz11abpi1_bee | 84.175 | 13.606 | 2.219 | 0.053 | |||||||
| ma100433_rel.cz11aredo1_bee | 80.742 | 16.294 | 2.964 | 0.041 |
Delete response time histogram: each cell has the percentage of responses that take <= the time in the header and max is the max response time in seconds. For max values in the top 25% of the range have a red background and in the bottom 25% of the range have a green background. The red background is not used when the min value is within 80% of the max value.
| dbms | 256us | 1ms | 4ms | 16ms | 64ms | 256ms | 1s | 4s | 16s | gt | max |
|---|---|---|---|---|---|---|---|---|---|---|---|
| ma100433_rel.cz11a_bee | 83.639 | 14.183 | 2.178 | 0.035 | |||||||
| ma100433_rel.cz11abpi1_bee | 86.467 | 11.792 | 1.742 | 0.041 | |||||||
| ma100433_rel.cz11aredo1_bee | 83.256 | 14.314 | 2.431 | 0.046 |
Performance metrics for the DBMS listed above. Some are normalized by throughput, others are not. Legend for results is here.
ips	qps	rps	rmbps	wps	wmbps	rpq	rkbpq	wpi	wkbpi	csps	cpups	cspq	cpupq	dbgb1	dbgb2	rss	maxop	p50	p99	tag
998	3920	0	0.0	5904.8	179.3	0.000	0.000	5.915	183.894	37029	19.2	9.445	392	6.1	22.0	NA	0.021	3852	3388	ma100433_rel.cz11a_bee
998	3889	0	0.0	5227.8	159.0	0.000	0.000	5.237	163.050	34844	18.8	8.959	387	6.1	22.0	NA	0.025	3806	3372	ma100433_rel.cz11abpi1_bee
998	3900	0	0.0	5910.6	179.5	0.000	0.000	5.921	184.075	36936	19.4	9.472	398	6.1	22.0	NA	0.022	3822	3372	ma100433_rel.cz11aredo1_bee
l.i0
l.i0: load without secondary indexes
Performance metrics for all DBMS, not just the ones listed above. Some are normalized by throughput, others are not. Legend for results is here.
ips	qps	rps	rmbps	wps	wmbps	rpq	rkbpq	wpi	wkbpi	csps	cpups	cspq	cpupq	dbgb1	dbgb2	rss	maxop	p50	p99	tag
83102	0	0	0.0	459.9	32.9	0.000	0.000	0.006	0.405	27677	33.9	0.333	33	2.0	17.8	NA	0.153	83807	69221	ma100433_rel.cz11a_bee
82192	0	0	0.0	522.6	34.8	0.000	0.000	0.006	0.433	27618	33.8	0.336	33	2.0	17.8	NA	0.145	82909	67026	ma100433_rel.cz11abpi1_bee
82873	0	0	0.0	505.9	34.2	0.000	0.000	0.006	0.422	27773	33.9	0.335	33	2.0	17.8	NA	0.141	83409	67256	ma100433_rel.cz11aredo1_bee
l.x
l.x: create secondary indexes
Performance metrics for all DBMS, not just the ones listed above. Some are normalized by throughput, others are not. Legend for results is here.
ips	qps	rps	rmbps	wps	wmbps	rpq	rkbpq	wpi	wkbpi	csps	cpups	cspq	cpupq	dbgb1	dbgb2	rss	maxop	p50	p99	tag
152285	0	0	0.0	779.4	134.6	0.000	0.000	0.005	0.905	6906	12.4	0.045	7	4.5	20.3	NA	0.001	NA	NA	ma100433_rel.cz11a_bee
152285	0	0	0.0	771.1	134.7	0.000	0.000	0.005	0.906	2832	12.2	0.019	6	4.5	20.3	NA	0.002	NA	NA	ma100433_rel.cz11abpi1_bee
152285	0	0	0.0	782.8	134.7	0.000	0.000	0.005	0.906	6967	12.6	0.046	7	4.5	20.3	NA	0.002	NA	NA	ma100433_rel.cz11aredo1_bee
l.i1
l.i1: continue load after secondary indexes created with 50 inserts per transaction
Performance metrics for all DBMS, not just the ones listed above. Some are normalized by throughput, others are not. Legend for results is here.
ips	qps	rps	rmbps	wps	wmbps	rpq	rkbpq	wpi	wkbpi	csps	cpups	cspq	cpupq	dbgb1	dbgb2	rss	maxop	p50	p99	tag
16522	0	0	0.0	6187.7	210.2	0.000	0.000	0.375	13.029	39510	51.5	2.391	249	6.1	22.0	NA	0.122	17231	4845	ma100433_rel.cz11a_bee
15754	0	0	0.0	4794.6	167.1	0.000	0.000	0.304	10.860	33184	49.6	2.106	252	6.1	22.0	NA	0.121	16182	4697	ma100433_rel.cz11abpi1_bee
16116	0	0	0.0	7232.7	240.9	0.000	0.000	0.449	15.308	42411	51.1	2.632	254	6.1	22.0	NA	0.118	16581	5344	ma100433_rel.cz11aredo1_bee
l.i2
l.i2: continue load after secondary indexes created with 5 inserts per transaction
Performance metrics for all DBMS, not just the ones listed above. Some are normalized by throughput, others are not. Legend for results is here.
ips	qps	rps	rmbps	wps	wmbps	rpq	rkbpq	wpi	wkbpi	csps	cpups	cspq	cpupq	dbgb1	dbgb2	rss	maxop	p50	p99	tag
10040	0	0	0.0	7876.3	249.8	0.000	0.000	0.784	25.472	121492	46.5	12.101	371	6.1	22.0	NA	0.046	10014	8629	ma100433_rel.cz11a_bee
9794	0	0	0.0	6254.8	200.6	0.000	0.000	0.639	20.968	115440	45.6	11.786	372	6.1	22.0	NA	0.050	9714	8146	ma100433_rel.cz11abpi1_bee
9881	0	0	0.0	8215.9	259.8	0.000	0.000	0.831	26.924	121046	46.4	12.250	376	6.1	22.0	NA	0.049	9839	8271	ma100433_rel.cz11aredo1_bee
qr100.L1
qr100.L1: range queries with 100 insert/s per client
Performance metrics for all DBMS, not just the ones listed above. Some are normalized by throughput, others are not. Legend for results is here.
ips	qps	rps	rmbps	wps	wmbps	rpq	rkbpq	wpi	wkbpi	csps	cpups	cspq	cpupq	dbgb1	dbgb2	rss	maxop	p50	p99	tag
100	3713	0	0.0	786.2	23.7	0.000	0.000	7.878	243.009	17838	13.7	4.805	295	6.1	22.0	NA	0.021	3660	3500	ma100433_rel.cz11a_bee
100	3700	0	0.0	782.3	23.7	0.000	0.000	7.839	242.769	17857	13.6	4.826	294	6.1	22.0	NA	0.024	3675	3500	ma100433_rel.cz11abpi1_bee
100	3698	0	0.0	790.2	23.8	0.000	0.000	7.918	244.254	17808	13.8	4.816	299	6.1	22.0	NA	0.024	3660	3484	ma100433_rel.cz11aredo1_bee
qp100.L2
qp100.L2: point queries with 100 insert/s per client
Performance metrics for all DBMS, not just the ones listed above. Some are normalized by throughput, others are not. Legend for results is here.
ips	qps	rps	rmbps	wps	wmbps	rpq	rkbpq	wpi	wkbpi	csps	cpups	cspq	cpupq	dbgb1	dbgb2	rss	maxop	p50	p99	tag
100	3764	0	0.0	784.4	23.6	0.000	0.000	7.859	242.401	18800	14.3	4.995	304	6.1	22.0	NA	0.023	3596	3276	ma100433_rel.cz11a_bee
100	3729	0	0.0	778.6	23.5	0.000	0.000	7.801	241.543	18713	14.6	5.018	313	6.1	22.0	NA	0.017	3565	3292	ma100433_rel.cz11abpi1_bee
100	3690	0	0.0	785.6	23.7	0.000	0.000	7.872	242.820	18511	14.3	5.017	310	6.1	22.0	NA	0.018	3548	3276	ma100433_rel.cz11aredo1_bee
qr500.L3
qr500.L3: range queries with 500 insert/s per client
Performance metrics for all DBMS, not just the ones listed above. Some are normalized by throughput, others are not. Legend for results is here.
ips	qps	rps	rmbps	wps	wmbps	rpq	rkbpq	wpi	wkbpi	csps	cpups	cspq	cpupq	dbgb1	dbgb2	rss	maxop	p50	p99	tag
499	3757	0	0.0	3292.3	99.9	0.000	0.000	6.596	204.868	25610	15.7	6.816	334	6.1	22.0	NA	0.030	3724	3452	ma100433_rel.cz11a_bee
499	3812	0	0.0	3190.0	96.9	0.000	0.000	6.392	198.728	25811	15.7	6.771	329	6.1	22.0	NA	0.025	3771	3499	ma100433_rel.cz11abpi1_bee
499	3760	0	0.0	3288.8	99.7	0.000	0.000	6.589	204.655	25618	15.9	6.814	338	6.1	22.0	NA	0.026	3724	3436	ma100433_rel.cz11aredo1_bee
qp500.L4
qp500.L4: point queries with 500 insert/s per client
Performance metrics for all DBMS, not just the ones listed above. Some are normalized by throughput, others are not. Legend for results is here.
ips	qps	rps	rmbps	wps	wmbps	rpq	rkbpq	wpi	wkbpi	csps	cpups	cspq	cpupq	dbgb1	dbgb2	rss	maxop	p50	p99	tag
499	3805	0	0.0	3288.8	99.7	0.000	0.000	6.593	204.772	26618	16.7	6.996	351	6.1	22.0	NA	0.024	3692	3324	ma100433_rel.cz11a_bee
499	3768	0	0.0	3276.8	99.5	0.000	0.000	6.565	204.122	26732	16.7	7.094	355	6.1	22.0	NA	0.023	3662	3324	ma100433_rel.cz11abpi1_bee
499	3776	0	0.0	3295.2	99.9	0.000	0.000	6.602	205.054	26538	16.8	7.028	356	6.1	22.0	NA	0.017	3676	3308	ma100433_rel.cz11aredo1_bee
qr1000.L5
qr1000.L5: range queries with 1000 insert/s per client
Performance metrics for all DBMS, not just the ones listed above. Some are normalized by throughput, others are not. Legend for results is here.
ips	qps	rps	rmbps	wps	wmbps	rpq	rkbpq	wpi	wkbpi	csps	cpups	cspq	cpupq	dbgb1	dbgb2	rss	maxop	p50	p99	tag
998	3814	0	0.0	5912.1	179.5	0.000	0.000	5.922	184.111	35759	18.3	9.374	384	6.1	22.0	NA	0.025	3788	3420	ma100433_rel.cz11a_bee
998	3841	0	0.0	5247.3	159.5	0.000	0.000	5.256	163.657	33739	18.0	8.783	375	6.1	22.0	NA	0.025	3806	3452	ma100433_rel.cz11abpi1_bee
998	3789	0	0.0	5913.4	179.5	0.000	0.000	5.924	184.162	35624	18.4	9.401	388	6.1	22.0	NA	0.032	3757	3372	ma100433_rel.cz11aredo1_bee
qp1000.L6
qp1000.L6: point queries with 1000 insert/s per client
Performance metrics for all DBMS, not just the ones listed above. Some are normalized by throughput, others are not. Legend for results is here.
ips	qps	rps	rmbps	wps	wmbps	rpq	rkbpq	wpi	wkbpi	csps	cpups	cspq	cpupq	dbgb1	dbgb2	rss	maxop	p50	p99	tag
998	3920	0	0.0	5904.8	179.3	0.000	0.000	5.915	183.894	37029	19.2	9.445	392	6.1	22.0	NA	0.021	3852	3388	ma100433_rel.cz11a_bee
998	3889	0	0.0	5227.8	159.0	0.000	0.000	5.237	163.050	34844	18.8	8.959	387	6.1	22.0	NA	0.025	3806	3372	ma100433_rel.cz11abpi1_bee
998	3900	0	0.0	5910.6	179.5	0.000	0.000	5.921	184.075	36936	19.4	9.472	398	6.1	22.0	NA	0.022	3822	3372	ma100433_rel.cz11aredo1_bee
l.i0
- l.i0: load without secondary indexes
- Legend for results is here.
- Each entry lists the percentage of responses that fit in that bucket (slower than max time for previous bucket, faster than min time for next bucket).
Insert response time histogram
256us	1ms	4ms	16ms	64ms	256ms	1s	4s	16s	gt	max	tag
0.000	2.219	97.372	0.370	0.035	0.004	0.000	0.000	0.000	0.000	0.153	ma100433_rel.cz11a_bee
0.000	3.266	96.211	0.481	0.039	0.004	0.000	0.000	0.000	0.000	0.145	ma100433_rel.cz11abpi1_bee
0.000	2.866	96.651	0.449	0.030	0.004	0.000	0.000	0.000	0.000	0.141	ma100433_rel.cz11aredo1_bee
l.x
- l.x: create secondary indexes
- Legend for results is here.
- Each entry lists the percentage of responses that fit in that bucket (slower than max time for previous bucket, faster than min time for next bucket).
TODO - determine whether there is data for create index response time
l.i1
- l.i1: continue load after secondary indexes created with 50 inserts per transaction
- Legend for results is here.
- Each entry lists the percentage of responses that fit in that bucket (slower than max time for previous bucket, faster than min time for next bucket).
Insert response time histogram
256us	1ms	4ms	16ms	64ms	256ms	1s	4s	16s	gt	max	tag
0.000	0.000	89.775	10.104	0.120	0.001	0.000	0.000	0.000	0.000	0.122	ma100433_rel.cz11a_bee
0.000	0.000	88.758	11.060	0.181	0.001	0.000	0.000	0.000	0.000	0.121	ma100433_rel.cz11abpi1_bee
0.000	0.000	88.265	11.605	0.129	0.001	0.000	0.000	0.000	0.000	0.118	ma100433_rel.cz11aredo1_bee
Delete response time histogram
256us	1ms	4ms	16ms	64ms	256ms	1s	4s	16s	gt	max	tag
0.000	0.000	92.937	7.026	0.036	0.001	0.000	0.000	0.000	0.000	0.074	ma100433_rel.cz11a_bee
0.000	0.000	92.196	7.750	0.054	nonzero	0.000	0.000	0.000	0.000	0.072	ma100433_rel.cz11abpi1_bee
0.000	0.000	91.534	8.421	0.045	0.001	0.000	0.000	0.000	0.000	0.069	ma100433_rel.cz11aredo1_bee
l.i2
- l.i2: continue load after secondary indexes created with 5 inserts per transaction
- Legend for results is here.
- Each entry lists the percentage of responses that fit in that bucket (slower than max time for previous bucket, faster than min time for next bucket).
Insert response time histogram
256us	1ms	4ms	16ms	64ms	256ms	1s	4s	16s	gt	max	tag
0.175	98.321	0.371	1.130	0.003	0.000	0.000	0.000	0.000	0.000	0.046	ma100433_rel.cz11a_bee
0.321	98.198	0.351	1.127	0.003	0.000	0.000	0.000	0.000	0.000	0.050	ma100433_rel.cz11abpi1_bee
0.155	98.229	0.411	1.202	0.003	0.000	0.000	0.000	0.000	0.000	0.049	ma100433_rel.cz11aredo1_bee
Delete response time histogram
256us	1ms	4ms	16ms	64ms	256ms	1s	4s	16s	gt	max	tag
2.983	95.468	0.424	1.123	0.002	0.000	0.000	0.000	0.000	0.000	0.046	ma100433_rel.cz11a_bee
3.198	95.367	0.310	1.122	0.003	0.000	0.000	0.000	0.000	0.000	0.050	ma100433_rel.cz11abpi1_bee
2.585	95.757	0.458	1.198	0.002	0.000	0.000	0.000	0.000	0.000	0.048	ma100433_rel.cz11aredo1_bee
qr100.L1
- qr100.L1: range queries with 100 insert/s per client
- Legend for results is here.
- Each entry lists the percentage of responses that fit in that bucket (slower than max time for previous bucket, faster than min time for next bucket).
Query response time histogram
256us	1ms	4ms	16ms	64ms	256ms	1s	4s	16s	gt	max	tag
62.255	37.741	0.003	nonzero	nonzero	0.000	0.000	0.000	0.000	0.000	0.021	ma100433_rel.cz11a_bee
62.268	37.728	0.003	nonzero	nonzero	0.000	0.000	0.000	0.000	0.000	0.024	ma100433_rel.cz11abpi1_bee
61.697	38.299	0.004	nonzero	nonzero	0.000	0.000	0.000	0.000	0.000	0.024	ma100433_rel.cz11aredo1_bee
Insert response time histogram
256us	1ms	4ms	16ms	64ms	256ms	1s	4s	16s	gt	max	tag
0.000	0.000	95.250	3.167	1.583	0.000	0.000	0.000	0.000	0.000	0.038	ma100433_rel.cz11a_bee
0.000	0.000	95.194	2.833	1.972	0.000	0.000	0.000	0.000	0.000	0.040	ma100433_rel.cz11abpi1_bee
0.000	0.000	95.500	3.306	1.194	0.000	0.000	0.000	0.000	0.000	0.037	ma100433_rel.cz11aredo1_bee
Delete response time histogram
256us	1ms	4ms	16ms	64ms	256ms	1s	4s	16s	gt	max	tag
0.000	0.000	96.167	2.944	0.889	0.000	0.000	0.000	0.000	0.000	0.038	ma100433_rel.cz11a_bee
0.000	0.000	96.083	2.639	1.278	0.000	0.000	0.000	0.000	0.000	0.032	ma100433_rel.cz11abpi1_bee
0.000	0.000	96.056	3.083	0.861	0.000	0.000	0.000	0.000	0.000	0.032	ma100433_rel.cz11aredo1_bee
qp100.L2
- qp100.L2: point queries with 100 insert/s per client
- Legend for results is here.
- Each entry lists the percentage of responses that fit in that bucket (slower than max time for previous bucket, faster than min time for next bucket).
Query response time histogram
256us	1ms	4ms	16ms	64ms	256ms	1s	4s	16s	gt	max	tag
76.429	23.569	0.002	nonzero	nonzero	0.000	0.000	0.000	0.000	0.000	0.023	ma100433_rel.cz11a_bee
76.544	23.453	0.002	nonzero	nonzero	0.000	0.000	0.000	0.000	0.000	0.017	ma100433_rel.cz11abpi1_bee
72.391	27.606	0.002	nonzero	nonzero	0.000	0.000	0.000	0.000	0.000	0.018	ma100433_rel.cz11aredo1_bee
Insert response time histogram
256us	1ms	4ms	16ms	64ms	256ms	1s	4s	16s	gt	max	tag
0.000	0.000	95.222	3.583	1.194	0.000	0.000	0.000	0.000	0.000	0.048	ma100433_rel.cz11a_bee
0.000	0.000	94.889	3.250	1.861	0.000	0.000	0.000	0.000	0.000	0.038	ma100433_rel.cz11abpi1_bee
0.000	0.000	95.500	3.361	1.139	0.000	0.000	0.000	0.000	0.000	0.034	ma100433_rel.cz11aredo1_bee
Delete response time histogram
256us	1ms	4ms	16ms	64ms	256ms	1s	4s	16s	gt	max	tag
0.000	0.000	96.361	2.750	0.889	0.000	0.000	0.000	0.000	0.000	0.043	ma100433_rel.cz11a_bee
0.000	0.000	95.528	3.056	1.417	0.000	0.000	0.000	0.000	0.000	0.034	ma100433_rel.cz11abpi1_bee
0.000	0.000	95.861	3.333	0.806	0.000	0.000	0.000	0.000	0.000	0.034	ma100433_rel.cz11aredo1_bee
qr500.L3
- qr500.L3: range queries with 500 insert/s per client
- Legend for results is here.
- Each entry lists the percentage of responses that fit in that bucket (slower than max time for previous bucket, faster than min time for next bucket).
Query response time histogram
256us	1ms	4ms	16ms	64ms	256ms	1s	4s	16s	gt	max	tag
64.700	35.273	0.022	0.004	0.001	0.000	0.000	0.000	0.000	0.000	0.030	ma100433_rel.cz11a_bee
66.245	33.729	0.020	0.005	nonzero	0.000	0.000	0.000	0.000	0.000	0.025	ma100433_rel.cz11abpi1_bee
64.619	35.354	0.022	0.005	0.001	0.000	0.000	0.000	0.000	0.000	0.026	ma100433_rel.cz11aredo1_bee
Insert response time histogram
256us	1ms	4ms	16ms	64ms	256ms	1s	4s	16s	gt	max	tag
0.000	0.000	87.678	9.194	3.128	0.000	0.000	0.000	0.000	0.000	0.046	ma100433_rel.cz11a_bee
0.000	0.000	87.739	8.944	3.317	0.000	0.000	0.000	0.000	0.000	0.047	ma100433_rel.cz11abpi1_bee
0.000	0.000	87.672	8.978	3.350	0.000	0.000	0.000	0.000	0.000	0.047	ma100433_rel.cz11aredo1_bee
Delete response time histogram
256us	1ms	4ms	16ms	64ms	256ms	1s	4s	16s	gt	max	tag
0.000	0.000	88.783	8.706	2.511	0.000	0.000	0.000	0.000	0.000	0.045	ma100433_rel.cz11a_bee
0.000	0.000	88.639	8.572	2.789	0.000	0.000	0.000	0.000	0.000	0.046	ma100433_rel.cz11abpi1_bee
0.000	0.000	88.761	8.433	2.806	0.000	0.000	0.000	0.000	0.000	0.036	ma100433_rel.cz11aredo1_bee
qp500.L4
- qp500.L4: point queries with 500 insert/s per client
- Legend for results is here.
- Each entry lists the percentage of responses that fit in that bucket (slower than max time for previous bucket, faster than min time for next bucket).
Query response time histogram
256us	1ms	4ms	16ms	64ms	256ms	1s	4s	16s	gt	max	tag
77.171	22.820	0.008	0.001	nonzero	0.000	0.000	0.000	0.000	0.000	0.024	ma100433_rel.cz11a_bee
74.118	25.873	0.008	0.001	nonzero	0.000	0.000	0.000	0.000	0.000	0.023	ma100433_rel.cz11abpi1_bee
72.955	27.035	0.008	0.001	nonzero	0.000	0.000	0.000	0.000	0.000	0.017	ma100433_rel.cz11aredo1_bee
Insert response time histogram
256us	1ms	4ms	16ms	64ms	256ms	1s	4s	16s	gt	max	tag
0.000	0.000	87.483	9.322	3.194	0.000	0.000	0.000	0.000	0.000	0.045	ma100433_rel.cz11a_bee
0.000	0.000	87.694	9.278	3.028	0.000	0.000	0.000	0.000	0.000	0.045	ma100433_rel.cz11abpi1_bee
0.000	0.000	87.750	9.156	3.094	0.000	0.000	0.000	0.000	0.000	0.058	ma100433_rel.cz11aredo1_bee
Delete response time histogram
256us	1ms	4ms	16ms	64ms	256ms	1s	4s	16s	gt	max	tag
0.000	0.000	88.806	8.622	2.572	0.000	0.000	0.000	0.000	0.000	0.044	ma100433_rel.cz11a_bee
0.000	0.000	88.661	8.767	2.572	0.000	0.000	0.000	0.000	0.000	0.037	ma100433_rel.cz11abpi1_bee
0.000	0.000	88.756	8.956	2.289	0.000	0.000	0.000	0.000	0.000	0.042	ma100433_rel.cz11aredo1_bee
qr1000.L5
- qr1000.L5: range queries with 1000 insert/s per client
- Legend for results is here.
- Each entry lists the percentage of responses that fit in that bucket (slower than max time for previous bucket, faster than min time for next bucket).
Query response time histogram
256us	1ms	4ms	16ms	64ms	256ms	1s	4s	16s	gt	max	tag
67.370	32.519	0.099	0.011	0.001	0.000	0.000	0.000	0.000	0.000	0.025	ma100433_rel.cz11a_bee
67.521	32.393	0.079	0.007	0.001	0.000	0.000	0.000	0.000	0.000	0.025	ma100433_rel.cz11abpi1_bee
66.180	33.708	0.101	0.010	0.001	0.000	0.000	0.000	0.000	0.000	0.032	ma100433_rel.cz11aredo1_bee
Insert response time histogram
256us	1ms	4ms	16ms	64ms	256ms	1s	4s	16s	gt	max	tag
0.000	0.000	80.289	16.486	3.225	0.000	0.000	0.000	0.000	0.000	0.044	ma100433_rel.cz11a_bee
0.000	0.000	83.528	14.267	2.206	0.000	0.000	0.000	0.000	0.000	0.064	ma100433_rel.cz11abpi1_bee
0.000	0.000	80.422	16.403	3.175	0.000	0.000	0.000	0.000	0.000	0.052	ma100433_rel.cz11aredo1_bee
Delete response time histogram
256us	1ms	4ms	16ms	64ms	256ms	1s	4s	16s	gt	max	tag
0.000	0.000	83.203	14.142	2.656	0.000	0.000	0.000	0.000	0.000	0.040	ma100433_rel.cz11a_bee
0.000	0.000	86.283	12.081	1.636	0.000	0.000	0.000	0.000	0.000	0.040	ma100433_rel.cz11abpi1_bee
0.000	0.000	83.292	14.161	2.547	0.000	0.000	0.000	0.000	0.000	0.043	ma100433_rel.cz11aredo1_bee
qp1000.L6
- qp1000.L6: point queries with 1000 insert/s per client
- Legend for results is here.
- Each entry lists the percentage of responses that fit in that bucket (slower than max time for previous bucket, faster than min time for next bucket).
Query response time histogram
256us	1ms	4ms	16ms	64ms	256ms	1s	4s	16s	gt	max	tag
80.806	19.163	0.029	0.002	nonzero	0.000	0.000	0.000	0.000	0.000	0.021	ma100433_rel.cz11a_bee
79.256	20.714	0.028	0.001	nonzero	0.000	0.000	0.000	0.000	0.000	0.025	ma100433_rel.cz11abpi1_bee
78.788	21.178	0.032	0.002	nonzero	0.000	0.000	0.000	0.000	0.000	0.022	ma100433_rel.cz11aredo1_bee
Insert response time histogram
256us	1ms	4ms	16ms	64ms	256ms	1s	4s	16s	gt	max	tag
0.000	0.000	81.250	15.883	2.867	0.000	0.000	0.000	0.000	0.000	0.049	ma100433_rel.cz11a_bee
0.000	0.000	84.175	13.606	2.219	0.000	0.000	0.000	0.000	0.000	0.053	ma100433_rel.cz11abpi1_bee
0.000	0.000	80.742	16.294	2.964	0.000	0.000	0.000	0.000	0.000	0.041	ma100433_rel.cz11aredo1_bee
Delete response time histogram
256us	1ms	4ms	16ms	64ms	256ms	1s	4s	16s	gt	max	tag
0.000	0.000	83.639	14.183	2.178	0.000	0.000	0.000	0.000	0.000	0.035	ma100433_rel.cz11a_bee
0.000	0.000	86.467	11.792	1.742	0.000	0.000	0.000	0.000	0.000	0.041	ma100433_rel.cz11abpi1_bee
0.000	0.000	83.256	14.314	2.431	0.000	0.000	0.000	0.000	0.000	0.046	ma100433_rel.cz11aredo1_bee