Introduction
This is a report for the insert benchmark with 30M docs and 1 client(s). It is generated by scripts (bash, awk, sed) and Tufte might not be impressed. An overview of the insert benchmark is here and a short update is here. Below, by DBMS, I mean DBMS+version.config. An example is my8020.c10b40 where my means MySQL, 8020 is version 8.0.20 and c10b40 is the name for the configuration file.
The test server has 8 AMD cores, 16G RAM and an NVMe SSD. It is described here as the Beelink. The benchmark was run with 1 client and there were 1 or 3 connections per client (1 for queries or inserts without rate limits, 1+1 for rate limited inserts+deletes). It uses 1 table. It loads 30M rows per table without secondary indexes, creates 3 secondary indexes per table, then inserts 40m+10m rows per table with a delete per insert to avoid growing the table. It then does 6 read+write tests for 1800s each that do queries as fast as possible with 100,100,500,500,1000,1000 inserts/s and the same for deletes/s per client concurrent with the queries. The database is cached in memory. Clients and the DBMS share one server. The per-database configs are in the per-database subdirectories here.
The tested DBMS are:
- ma110401_rel.cz11b_bee - MariaDB 11.4.1 with the cz11b_bee config that uses innodb_flush_method=O_DIRECT
- ma110401_rel.cz11b1_bee - MariaDB 11.4.1 with the cz11b1_bee config that uses innodb_flush_method=O_DIRECT and a smaller buffer pool and redo log
- ma110401_rel.cz11c_bee - MariaDB 11.4.1 with the cz11c_bee config that uses innodb_flush_method=fsync
Contents
- Summary
- l.i0: load without secondary indexes
- l.x: create secondary indexes
- l.i1: continue load after secondary indexes created with 50 inserts per transaction
- l.i2: continue load after secondary indexes created with 5 inserts per transaction
- qr100.L1: range queries with 100 insert/s per client
- qp100.L2: point queries with 100 insert/s per client
- qr500.L3: range queries with 500 insert/s per client
- qp500.L4: point queries with 500 insert/s per client
- qr1000.L5: range queries with 1000 insert/s per client
- qp1000.L6: point queries with 1000 insert/s per client
Summary
The numbers are inserts/s for l.i0, l.i1 and l.i2, indexed docs (or rows) /s for l.x and queries/s for qr100, qp100 thru qr1000, qp1000" The values are the average rate over the entire test for inserts (IPS) and queries (QPS). The range of values for IPS and QPS is split into 3 parts: bottom 25%, middle 50%, top 25%. Values in the bottom 25% have a red background, values in the top 25% have a green background and values in the middle have no color. A gray background is used for values that can be ignored because the DBMS did not sustain the target insert rate. Red backgrounds are not used when the minimum value is within 80% of the max value.
| dbms | l.i0 | l.x | l.i1 | l.i2 | qr100 | qp100 | qr500 | qp500 | qr1000 | qp1000 |
|---|---|---|---|---|---|---|---|---|---|---|
| ma110401_rel.cz11b_bee | 82192 | 128206 | 17770 | 10799 | 3667 | 3728 | 3593 | 3835 | 3618 | 3836 |
| ma110401_rel.cz11b1_bee | 82645 | 128756 | 15094 | 10214 | 3633 | 3674 | 3559 | 3765 | 3552 | 3784 |
| ma110401_rel.cz11c_bee | 83102 | 128206 | 17264 | 10707 | 3642 | 3597 | 3622 | 3849 | 3645 | 3836 |
This table has relative throughput, throughput for the DBMS relative to the DBMS in the first line, using the absolute throughput from the previous table. Values less than 0.95 have a yellow background. Values greater than 1.05 have a blue background.
| dbms | l.i0 | l.x | l.i1 | l.i2 | qr100 | qp100 | qr500 | qp500 | qr1000 | qp1000 |
|---|---|---|---|---|---|---|---|---|---|---|
| ma110401_rel.cz11b_bee | 1.00 | 1.00 | 1.00 | 1.00 | 1.00 | 1.00 | 1.00 | 1.00 | 1.00 | 1.00 |
| ma110401_rel.cz11b1_bee | 1.01 | 1.00 | 0.85 | 0.95 | 0.99 | 0.99 | 0.99 | 0.98 | 0.98 | 0.99 |
| ma110401_rel.cz11c_bee | 1.01 | 1.00 | 0.97 | 0.99 | 0.99 | 0.96 | 1.01 | 1.00 | 1.01 | 1.00 |
This lists the average rate of inserts/s for the tests that do inserts concurrent with queries. For such tests the query rate is listed in the table above. The read+write tests are setup so that the insert rate should match the target rate every second. Cells that are not at least 95% of the target have a red background to indicate a failure to satisfy the target.
| dbms | qr100.L1 | qp100.L2 | qr500.L3 | qp500.L4 | qr1000.L5 | qp1000.L6 |
|---|---|---|---|---|---|---|
| ma110401_rel.cz11b_bee | 100 | 100 | 499 | 499 | 998 | 998 |
| ma110401_rel.cz11b1_bee | 100 | 100 | 499 | 499 | 998 | 998 |
| ma110401_rel.cz11c_bee | 100 | 100 | 499 | 499 | 998 | 998 |
| target | 100 | 100 | 500 | 500 | 1000 | 1000 |
l.i0
l.i0: load without secondary indexes. Graphs for performance per 1-second interval are here.
Average throughput:
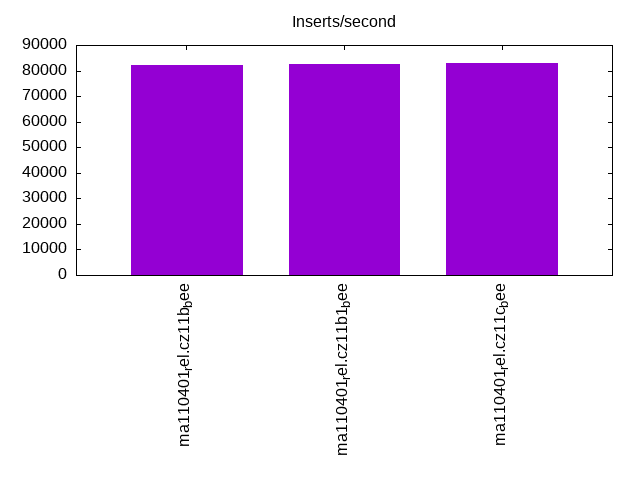
Insert response time histogram: each cell has the percentage of responses that take <= the time in the header and max is the max response time in seconds. For the max column values in the top 25% of the range have a red background and in the bottom 25% of the range have a green background. The red background is not used when the min value is within 80% of the max value.
| dbms | 256us | 1ms | 4ms | 16ms | 64ms | 256ms | 1s | 4s | 16s | gt | max |
|---|---|---|---|---|---|---|---|---|---|---|---|
| ma110401_rel.cz11b_bee | 2.688 | 96.998 | 0.187 | 0.122 | 0.005 | 0.206 | |||||
| ma110401_rel.cz11b1_bee | 4.149 | 95.520 | 0.200 | 0.123 | 0.008 | 0.204 | |||||
| ma110401_rel.cz11c_bee | 4.374 | 95.313 | 0.190 | 0.119 | 0.005 | 0.204 |
Performance metrics for the DBMS listed above. Some are normalized by throughput, others are not. Legend for results is here.
ips	qps	rps	rmbps	wps	wmbps	rpq	rkbpq	wpi	wkbpi	csps	cpups	cspq	cpupq	dbgb1	dbgb2	rss	maxop	p50	p99	tag
82192	0	0	0.0	252.5	21.1	0.000	0.000	0.003	0.262	11329	25.9	0.138	25	2.0	17.8	2.3	0.206	82810	69657	ma110401_rel.cz11b_bee
82645	0	0	0.0	369.2	23.0	0.000	0.000	0.004	0.284	11860	25.9	0.144	25	2.0	6.8	2.3	0.204	83507	69839	ma110401_rel.cz11b1_bee
83102	0	0	0.0	52.5	21.2	0.000	0.000	0.001	0.262	11328	25.9	0.136	25	2.0	17.8	2.3	0.204	83805	68653	ma110401_rel.cz11c_bee
l.x
l.x: create secondary indexes.
Average throughput:
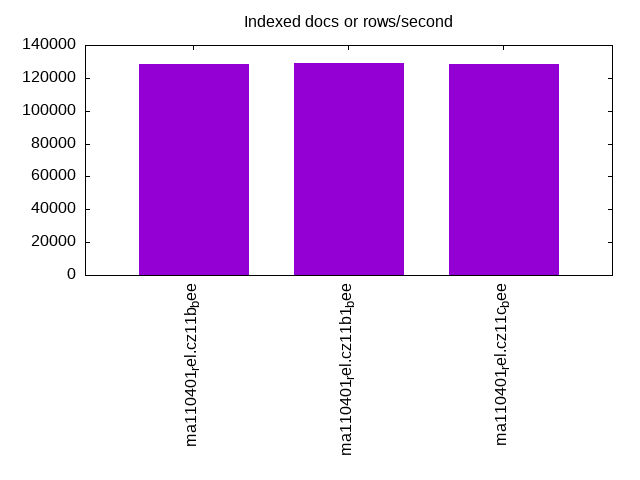
Performance metrics for the DBMS listed above. Some are normalized by throughput, others are not. Legend for results is here.
ips	qps	rps	rmbps	wps	wmbps	rpq	rkbpq	wpi	wkbpi	csps	cpups	cspq	cpupq	dbgb1	dbgb2	rss	maxop	p50	p99	tag
128206	0	0	0.0	807.7	109.8	0.000	0.000	0.006	0.877	2916	12.1	0.023	8	4.5	20.3	3.8	0.002	NA	NA	ma110401_rel.cz11b_bee
128756	0	0	0.0	728.2	108.6	0.000	0.000	0.006	0.864	2389	12.0	0.019	7	4.5	9.3	3.8	0.002	NA	NA	ma110401_rel.cz11b1_bee
128206	0	0	0.0	270.9	109.8	0.000	0.000	0.002	0.877	3184	12.0	0.025	7	4.5	20.3	3.8	0.002	NA	NA	ma110401_rel.cz11c_bee
l.i1
l.i1: continue load after secondary indexes created with 50 inserts per transaction. Graphs for performance per 1-second interval are here.
Average throughput:
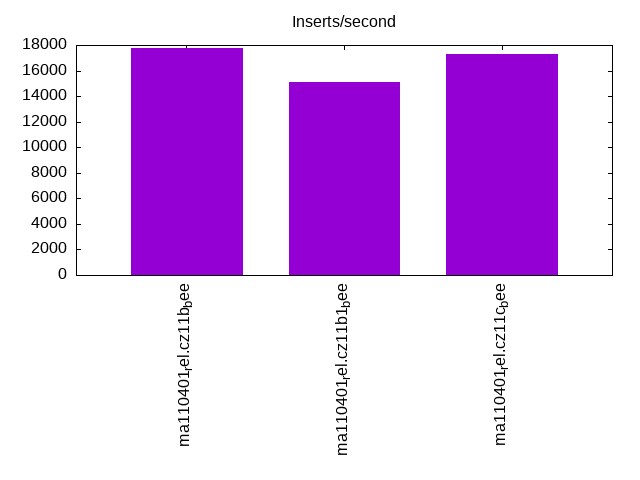
Insert response time histogram: each cell has the percentage of responses that take <= the time in the header and max is the max response time in seconds. For the max column values in the top 25% of the range have a red background and in the bottom 25% of the range have a green background. The red background is not used when the min value is within 80% of the max value.
| dbms | 256us | 1ms | 4ms | 16ms | 64ms | 256ms | 1s | 4s | 16s | gt | max |
|---|---|---|---|---|---|---|---|---|---|---|---|
| ma110401_rel.cz11b_bee | 94.301 | 5.211 | 0.485 | 0.004 | 0.189 | ||||||
| ma110401_rel.cz11b1_bee | 88.582 | 10.022 | 1.392 | 0.004 | 0.158 | ||||||
| ma110401_rel.cz11c_bee | 93.966 | 5.289 | 0.732 | 0.012 | 0.001 | 0.451 |
Delete response time histogram: each cell has the percentage of responses that take <= the time in the header and max is the max response time in seconds. For the max column values in the top 25% of the range have a red background and in the bottom 25% of the range have a green background. The red background is not used when the min value is within 80% of the max value.
| dbms | 256us | 1ms | 4ms | 16ms | 64ms | 256ms | 1s | 4s | 16s | gt | max |
|---|---|---|---|---|---|---|---|---|---|---|---|
| ma110401_rel.cz11b_bee | 96.023 | 3.587 | 0.388 | 0.003 | 0.188 | ||||||
| ma110401_rel.cz11b1_bee | 90.808 | 8.017 | 1.173 | 0.002 | 0.148 | ||||||
| ma110401_rel.cz11c_bee | 95.709 | 3.675 | 0.605 | 0.011 | nonzero | 0.424 |
Performance metrics for the DBMS listed above. Some are normalized by throughput, others are not. Legend for results is here.
ips	qps	rps	rmbps	wps	wmbps	rpq	rkbpq	wpi	wkbpi	csps	cpups	cspq	cpupq	dbgb1	dbgb2	rss	maxop	p50	p99	tag
17770	0	685	2.7	2634.6	95.1	0.039	0.154	0.148	5.483	46630	32.8	2.624	148	6.2	22.0	6.1	0.189	18380	5194	ma110401_rel.cz11b_bee
15094	0	60	0.2	6985.5	217.9	0.004	0.016	0.463	14.784	62069	30.4	4.112	161	6.1	11.0	6.0	0.158	15233	5244	ma110401_rel.cz11b1_bee
17264	0	663	2.6	2422.0	92.6	0.038	0.154	0.140	5.492	42459	32.3	2.459	150	6.2	22.0	6.1	0.451	17780	4895	ma110401_rel.cz11c_bee
l.i2
l.i2: continue load after secondary indexes created with 5 inserts per transaction. Graphs for performance per 1-second interval are here.
Average throughput:
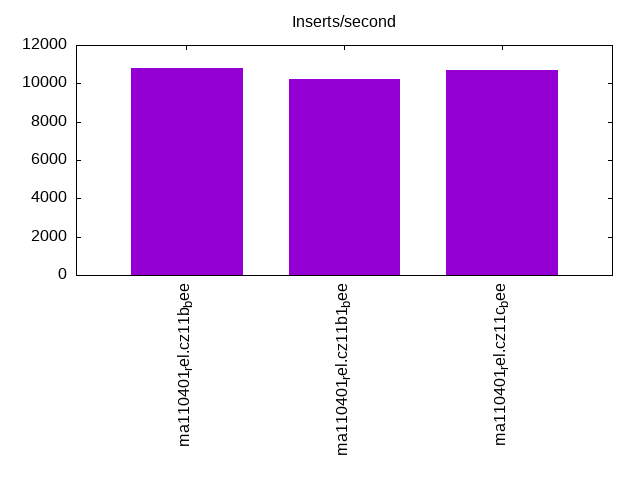
Insert response time histogram: each cell has the percentage of responses that take <= the time in the header and max is the max response time in seconds. For the max column values in the top 25% of the range have a red background and in the bottom 25% of the range have a green background. The red background is not used when the min value is within 80% of the max value.
| dbms | 256us | 1ms | 4ms | 16ms | 64ms | 256ms | 1s | 4s | 16s | gt | max |
|---|---|---|---|---|---|---|---|---|---|---|---|
| ma110401_rel.cz11b_bee | 0.358 | 99.424 | 0.111 | 0.104 | 0.003 | nonzero | 0.064 | ||||
| ma110401_rel.cz11b1_bee | 0.665 | 98.651 | 0.305 | 0.371 | 0.008 | 0.045 | |||||
| ma110401_rel.cz11c_bee | 0.708 | 99.044 | 0.116 | 0.124 | 0.008 | nonzero | 0.093 |
Delete response time histogram: each cell has the percentage of responses that take <= the time in the header and max is the max response time in seconds. For the max column values in the top 25% of the range have a red background and in the bottom 25% of the range have a green background. The red background is not used when the min value is within 80% of the max value.
| dbms | 256us | 1ms | 4ms | 16ms | 64ms | 256ms | 1s | 4s | 16s | gt | max |
|---|---|---|---|---|---|---|---|---|---|---|---|
| ma110401_rel.cz11b_bee | 1.129 | 98.652 | 0.117 | 0.098 | 0.003 | nonzero | 0.064 | ||||
| ma110401_rel.cz11b1_bee | 1.519 | 97.830 | 0.296 | 0.349 | 0.007 | 0.045 | |||||
| ma110401_rel.cz11c_bee | 1.406 | 98.354 | 0.116 | 0.117 | 0.007 | nonzero | 0.067 |
Performance metrics for the DBMS listed above. Some are normalized by throughput, others are not. Legend for results is here.
ips	qps	rps	rmbps	wps	wmbps	rpq	rkbpq	wpi	wkbpi	csps	cpups	cspq	cpupq	dbgb1	dbgb2	rss	maxop	p50	p99	tag
10799	0	1719	6.7	1320.2	49.4	0.159	0.637	0.122	4.680	60542	34.8	5.606	258	6.2	22.0	6.1	0.064	10913	9004	ma110401_rel.cz11b_bee
10214	0	0	0.0	4089.2	129.1	0.000	0.000	0.400	12.944	67045	34.8	6.564	273	6.1	11.0	6.0	0.045	10129	8450	ma110401_rel.cz11b1_bee
10707	0	1702	6.6	1253.1	48.8	0.159	0.636	0.117	4.666	58604	34.6	5.474	259	6.2	22.0	6.1	0.093	10918	8426	ma110401_rel.cz11c_bee
qr100.L1
qr100.L1: range queries with 100 insert/s per client. Graphs for performance per 1-second interval are here.
Average throughput:
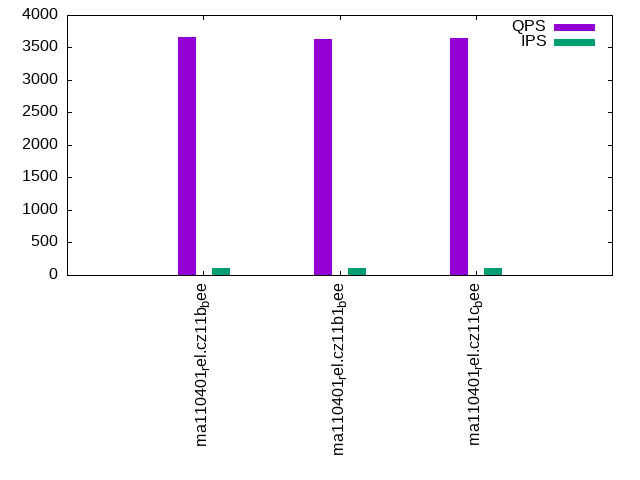
Query response time histogram: each cell has the percentage of responses that take <= the time in the header and max is the max response time in seconds. For max values in the top 25% of the range have a red background and in the bottom 25% of the range have a green background. The red background is not used when the min value is within 80% of the max value.
| dbms | 256us | 1ms | 4ms | 16ms | 64ms | 256ms | 1s | 4s | 16s | gt | max |
|---|---|---|---|---|---|---|---|---|---|---|---|
| ma110401_rel.cz11b_bee | 60.353 | 39.646 | nonzero | nonzero | 0.004 | ||||||
| ma110401_rel.cz11b1_bee | 58.305 | 41.695 | nonzero | 0.003 | |||||||
| ma110401_rel.cz11c_bee | 59.249 | 40.751 | nonzero | nonzero | 0.014 |
Insert response time histogram: each cell has the percentage of responses that take <= the time in the header and max is the max response time in seconds. For max values in the top 25% of the range have a red background and in the bottom 25% of the range have a green background. The red background is not used when the min value is within 80% of the max value.
| dbms | 256us | 1ms | 4ms | 16ms | 64ms | 256ms | 1s | 4s | 16s | gt | max |
|---|---|---|---|---|---|---|---|---|---|---|---|
| ma110401_rel.cz11b_bee | 53.250 | 46.722 | 0.028 | 0.020 | |||||||
| ma110401_rel.cz11b1_bee | 99.944 | 0.028 | 0.028 | 0.023 | |||||||
| ma110401_rel.cz11c_bee | 53.306 | 46.694 | 0.012 |
Delete response time histogram: each cell has the percentage of responses that take <= the time in the header and max is the max response time in seconds. For max values in the top 25% of the range have a red background and in the bottom 25% of the range have a green background. The red background is not used when the min value is within 80% of the max value.
| dbms | 256us | 1ms | 4ms | 16ms | 64ms | 256ms | 1s | 4s | 16s | gt | max |
|---|---|---|---|---|---|---|---|---|---|---|---|
| ma110401_rel.cz11b_bee | 53.306 | 46.694 | 0.012 | ||||||||
| ma110401_rel.cz11b1_bee | 100.000 | 0.003 | |||||||||
| ma110401_rel.cz11c_bee | 53.278 | 46.722 | 0.013 |
Performance metrics for the DBMS listed above. Some are normalized by throughput, others are not. Legend for results is here.
ips	qps	rps	rmbps	wps	wmbps	rpq	rkbpq	wpi	wkbpi	csps	cpups	cspq	cpupq	dbgb1	dbgb2	rss	maxop	p50	p99	tag
100	3667	3	0.0	8.2	0.3	0.001	0.003	0.082	2.944	14247	13.0	3.885	284	6.2	22.0	6.1	0.004	3644	3484	ma110401_rel.cz11b_bee
100	3633	0	0.0	8.1	0.3	0.000	0.000	0.082	2.959	14113	12.8	3.885	282	6.1	11.0	5.9	0.003	3612	3452	ma110401_rel.cz11b1_bee
100	3642	3	0.0	8.1	0.3	0.001	0.003	0.081	2.962	14149	12.8	3.885	281	6.2	22.0	6.1	0.014	3612	3468	ma110401_rel.cz11c_bee
qp100.L2
qp100.L2: point queries with 100 insert/s per client. Graphs for performance per 1-second interval are here.
Average throughput:
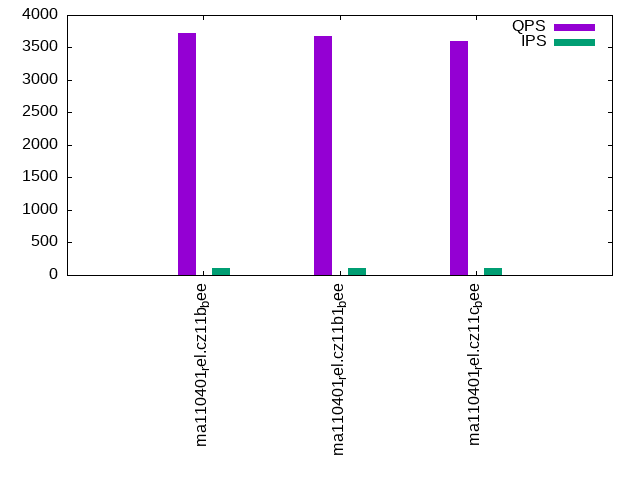
Query response time histogram: each cell has the percentage of responses that take <= the time in the header and max is the max response time in seconds. For max values in the top 25% of the range have a red background and in the bottom 25% of the range have a green background. The red background is not used when the min value is within 80% of the max value.
| dbms | 256us | 1ms | 4ms | 16ms | 64ms | 256ms | 1s | 4s | 16s | gt | max |
|---|---|---|---|---|---|---|---|---|---|---|---|
| ma110401_rel.cz11b_bee | 77.686 | 22.312 | 0.002 | nonzero | 0.007 | ||||||
| ma110401_rel.cz11b1_bee | 69.983 | 30.015 | 0.001 | nonzero | 0.005 | ||||||
| ma110401_rel.cz11c_bee | 63.743 | 36.256 | 0.001 | nonzero | 0.004 |
Insert response time histogram: each cell has the percentage of responses that take <= the time in the header and max is the max response time in seconds. For max values in the top 25% of the range have a red background and in the bottom 25% of the range have a green background. The red background is not used when the min value is within 80% of the max value.
| dbms | 256us | 1ms | 4ms | 16ms | 64ms | 256ms | 1s | 4s | 16s | gt | max |
|---|---|---|---|---|---|---|---|---|---|---|---|
| ma110401_rel.cz11b_bee | 53.306 | 46.694 | 0.012 | ||||||||
| ma110401_rel.cz11b1_bee | 99.972 | 0.028 | 0.022 | ||||||||
| ma110401_rel.cz11c_bee | 53.000 | 47.000 | 0.012 |
Delete response time histogram: each cell has the percentage of responses that take <= the time in the header and max is the max response time in seconds. For max values in the top 25% of the range have a red background and in the bottom 25% of the range have a green background. The red background is not used when the min value is within 80% of the max value.
| dbms | 256us | 1ms | 4ms | 16ms | 64ms | 256ms | 1s | 4s | 16s | gt | max |
|---|---|---|---|---|---|---|---|---|---|---|---|
| ma110401_rel.cz11b_bee | 53.333 | 46.667 | 0.012 | ||||||||
| ma110401_rel.cz11b1_bee | 99.972 | 0.028 | 0.021 | ||||||||
| ma110401_rel.cz11c_bee | 53.111 | 46.889 | 0.012 |
Performance metrics for the DBMS listed above. Some are normalized by throughput, others are not. Legend for results is here.
ips	qps	rps	rmbps	wps	wmbps	rpq	rkbpq	wpi	wkbpi	csps	cpups	cspq	cpupq	dbgb1	dbgb2	rss	maxop	p50	p99	tag
100	3728	3	0.0	14.0	0.5	0.001	0.003	0.140	4.715	15297	14.3	4.103	307	6.2	22.0	6.1	0.007	3580	3355	ma110401_rel.cz11b_bee
100	3674	0	0.0	21.1	0.7	0.000	0.000	0.211	6.827	15101	14.3	4.110	311	6.1	11.0	5.9	0.005	3519	3308	ma110401_rel.cz11b1_bee
100	3597	3	0.0	19.8	0.6	0.001	0.003	0.198	6.484	14778	14.1	4.108	314	6.2	22.0	6.1	0.004	3500	3307	ma110401_rel.cz11c_bee
qr500.L3
qr500.L3: range queries with 500 insert/s per client. Graphs for performance per 1-second interval are here.
Average throughput:
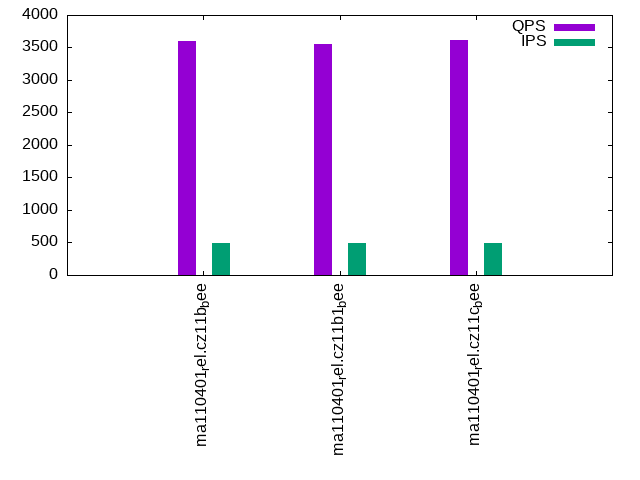
Query response time histogram: each cell has the percentage of responses that take <= the time in the header and max is the max response time in seconds. For max values in the top 25% of the range have a red background and in the bottom 25% of the range have a green background. The red background is not used when the min value is within 80% of the max value.
| dbms | 256us | 1ms | 4ms | 16ms | 64ms | 256ms | 1s | 4s | 16s | gt | max |
|---|---|---|---|---|---|---|---|---|---|---|---|
| ma110401_rel.cz11b_bee | 56.843 | 43.156 | 0.001 | 0.003 | |||||||
| ma110401_rel.cz11b1_bee | 54.207 | 45.790 | 0.002 | 0.001 | nonzero | 0.018 | |||||
| ma110401_rel.cz11c_bee | 58.087 | 41.912 | 0.001 | nonzero | 0.010 |
Insert response time histogram: each cell has the percentage of responses that take <= the time in the header and max is the max response time in seconds. For max values in the top 25% of the range have a red background and in the bottom 25% of the range have a green background. The red background is not used when the min value is within 80% of the max value.
| dbms | 256us | 1ms | 4ms | 16ms | 64ms | 256ms | 1s | 4s | 16s | gt | max |
|---|---|---|---|---|---|---|---|---|---|---|---|
| ma110401_rel.cz11b_bee | 90.122 | 9.878 | 0.012 | ||||||||
| ma110401_rel.cz11b1_bee | 99.317 | 0.556 | 0.128 | 0.025 | |||||||
| ma110401_rel.cz11c_bee | 90.111 | 9.889 | 0.014 |
Delete response time histogram: each cell has the percentage of responses that take <= the time in the header and max is the max response time in seconds. For max values in the top 25% of the range have a red background and in the bottom 25% of the range have a green background. The red background is not used when the min value is within 80% of the max value.
| dbms | 256us | 1ms | 4ms | 16ms | 64ms | 256ms | 1s | 4s | 16s | gt | max |
|---|---|---|---|---|---|---|---|---|---|---|---|
| ma110401_rel.cz11b_bee | 90.583 | 9.417 | 0.014 | ||||||||
| ma110401_rel.cz11b1_bee | 99.644 | 0.278 | 0.078 | 0.023 | |||||||
| ma110401_rel.cz11c_bee | 90.544 | 9.456 | 0.013 |
Performance metrics for the DBMS listed above. Some are normalized by throughput, others are not. Legend for results is here.
ips	qps	rps	rmbps	wps	wmbps	rpq	rkbpq	wpi	wkbpi	csps	cpups	cspq	cpupq	dbgb1	dbgb2	rss	maxop	p50	p99	tag
499	3593	17	0.1	3.1	0.6	0.005	0.019	0.006	1.165	14154	13.6	3.939	303	6.2	22.0	6.1	0.003	3580	3452	ma110401_rel.cz11b_bee
499	3559	0	0.0	186.4	5.8	0.000	0.000	0.374	11.925	14899	13.9	4.186	312	6.1	11.0	6.0	0.018	3532	3372	ma110401_rel.cz11b1_bee
499	3622	17	0.1	8.5	0.7	0.005	0.019	0.017	1.499	14286	13.8	3.945	305	6.2	22.0	6.1	0.010	3596	3468	ma110401_rel.cz11c_bee
qp500.L4
qp500.L4: point queries with 500 insert/s per client. Graphs for performance per 1-second interval are here.
Average throughput:
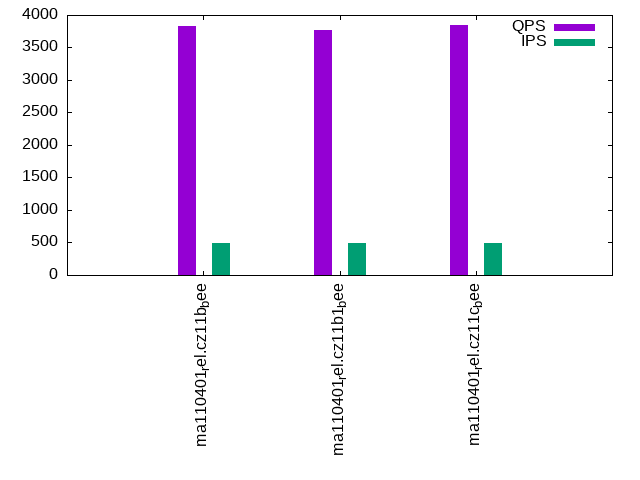
Query response time histogram: each cell has the percentage of responses that take <= the time in the header and max is the max response time in seconds. For max values in the top 25% of the range have a red background and in the bottom 25% of the range have a green background. The red background is not used when the min value is within 80% of the max value.
| dbms | 256us | 1ms | 4ms | 16ms | 64ms | 256ms | 1s | 4s | 16s | gt | max |
|---|---|---|---|---|---|---|---|---|---|---|---|
| ma110401_rel.cz11b_bee | 81.114 | 18.884 | 0.002 | nonzero | 0.005 | ||||||
| ma110401_rel.cz11b1_bee | 75.810 | 24.188 | 0.002 | nonzero | 0.014 | ||||||
| ma110401_rel.cz11c_bee | 81.591 | 18.407 | 0.002 | nonzero | 0.005 |
Insert response time histogram: each cell has the percentage of responses that take <= the time in the header and max is the max response time in seconds. For max values in the top 25% of the range have a red background and in the bottom 25% of the range have a green background. The red background is not used when the min value is within 80% of the max value.
| dbms | 256us | 1ms | 4ms | 16ms | 64ms | 256ms | 1s | 4s | 16s | gt | max |
|---|---|---|---|---|---|---|---|---|---|---|---|
| ma110401_rel.cz11b_bee | 89.967 | 10.033 | 0.014 | ||||||||
| ma110401_rel.cz11b1_bee | 99.261 | 0.639 | 0.100 | 0.021 | |||||||
| ma110401_rel.cz11c_bee | 90.006 | 9.983 | 0.011 | 0.023 |
Delete response time histogram: each cell has the percentage of responses that take <= the time in the header and max is the max response time in seconds. For max values in the top 25% of the range have a red background and in the bottom 25% of the range have a green background. The red background is not used when the min value is within 80% of the max value.
| dbms | 256us | 1ms | 4ms | 16ms | 64ms | 256ms | 1s | 4s | 16s | gt | max |
|---|---|---|---|---|---|---|---|---|---|---|---|
| ma110401_rel.cz11b_bee | 90.439 | 9.556 | 0.006 | 0.021 | |||||||
| ma110401_rel.cz11b1_bee | 99.606 | 0.350 | 0.044 | 0.023 | |||||||
| ma110401_rel.cz11c_bee | 90.467 | 9.528 | 0.006 | 0.019 |
Performance metrics for the DBMS listed above. Some are normalized by throughput, others are not. Legend for results is here.
ips	qps	rps	rmbps	wps	wmbps	rpq	rkbpq	wpi	wkbpi	csps	cpups	cspq	cpupq	dbgb1	dbgb2	rss	maxop	p50	p99	tag
499	3835	17	0.1	80.7	2.7	0.005	0.018	0.162	5.595	16376	15.6	4.270	325	6.2	22.0	6.1	0.005	3627	3356	ma110401_rel.cz11b_bee
499	3765	0	0.0	179.8	5.6	0.000	0.000	0.360	11.520	16543	15.6	4.394	331	6.1	11.0	5.9	0.014	3580	3339	ma110401_rel.cz11b1_bee
499	3849	18	0.1	78.0	2.7	0.005	0.018	0.156	5.551	16342	15.8	4.246	328	6.2	22.0	6.1	0.005	3628	3373	ma110401_rel.cz11c_bee
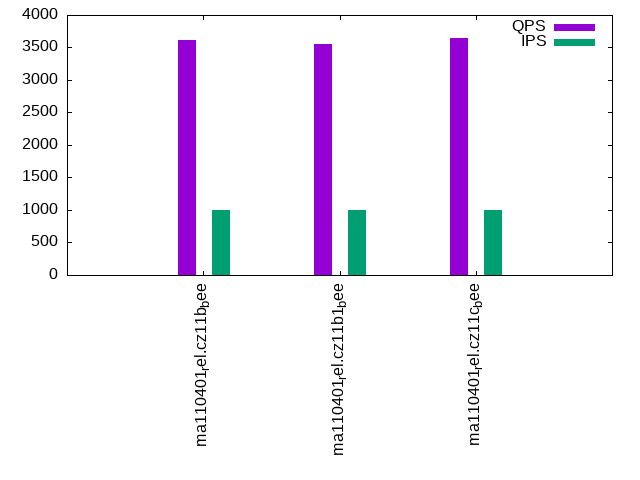
qr1000.L5
qr1000.L5: range queries with 1000 insert/s per client. Graphs for performance per 1-second interval are here.
Average throughput:
Query response time histogram: each cell has the percentage of responses that take <= the time in the header and max is the max response time in seconds. For max values in the top 25% of the range have a red background and in the bottom 25% of the range have a green background. The red background is not used when the min value is within 80% of the max value.
| dbms | 256us | 1ms | 4ms | 16ms | 64ms | 256ms | 1s | 4s | 16s | gt | max |
|---|---|---|---|---|---|---|---|---|---|---|---|
| ma110401_rel.cz11b_bee | 58.142 | 41.854 | 0.003 | 0.001 | 0.014 | ||||||
| ma110401_rel.cz11b1_bee | 53.826 | 46.166 | 0.005 | 0.002 | nonzero | 0.017 | |||||
| ma110401_rel.cz11c_bee | 59.086 | 40.910 | 0.003 | 0.001 | nonzero | 0.035 |
Insert response time histogram: each cell has the percentage of responses that take <= the time in the header and max is the max response time in seconds. For max values in the top 25% of the range have a red background and in the bottom 25% of the range have a green background. The red background is not used when the min value is within 80% of the max value.
| dbms | 256us | 1ms | 4ms | 16ms | 64ms | 256ms | 1s | 4s | 16s | gt | max |
|---|---|---|---|---|---|---|---|---|---|---|---|
| ma110401_rel.cz11b_bee | 95.061 | 4.928 | 0.011 | 0.032 | |||||||
| ma110401_rel.cz11b1_bee | 98.961 | 0.917 | 0.122 | 0.050 | |||||||
| ma110401_rel.cz11c_bee | 95.000 | 4.978 | 0.022 | 0.051 |
Delete response time histogram: each cell has the percentage of responses that take <= the time in the header and max is the max response time in seconds. For max values in the top 25% of the range have a red background and in the bottom 25% of the range have a green background. The red background is not used when the min value is within 80% of the max value.
| dbms | 256us | 1ms | 4ms | 16ms | 64ms | 256ms | 1s | 4s | 16s | gt | max |
|---|---|---|---|---|---|---|---|---|---|---|---|
| ma110401_rel.cz11b_bee | 95.183 | 4.806 | 0.011 | 0.030 | |||||||
| ma110401_rel.cz11b1_bee | 99.408 | 0.533 | 0.058 | 0.039 | |||||||
| ma110401_rel.cz11c_bee | 95.153 | 4.831 | 0.017 | 0.040 |
Performance metrics for the DBMS listed above. Some are normalized by throughput, others are not. Legend for results is here.
ips	qps	rps	rmbps	wps	wmbps	rpq	rkbpq	wpi	wkbpi	csps	cpups	cspq	cpupq	dbgb1	dbgb2	rss	maxop	p50	p99	tag
998	3618	35	0.1	94.7	3.6	0.010	0.039	0.095	3.713	15105	14.9	4.175	329	6.2	22.0	6.1	0.014	3580	3420	ma110401_rel.cz11b_bee
998	3552	0	0.0	355.1	11.1	0.000	0.000	0.356	11.425	15976	14.9	4.498	336	6.1	11.0	6.0	0.017	3516	3340	ma110401_rel.cz11b1_bee
998	3645	35	0.1	86.9	3.5	0.010	0.038	0.087	3.572	15057	14.9	4.131	327	6.2	22.0	6.1	0.035	3612	3468	ma110401_rel.cz11c_bee
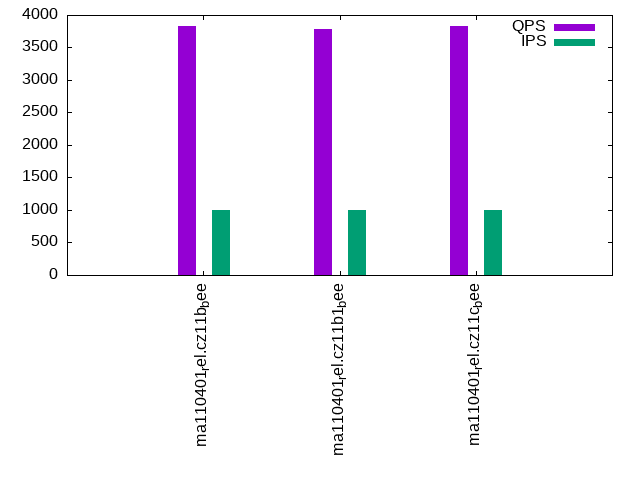
qp1000.L6
qp1000.L6: point queries with 1000 insert/s per client. Graphs for performance per 1-second interval are here.
Average throughput:
Query response time histogram: each cell has the percentage of responses that take <= the time in the header and max is the max response time in seconds. For max values in the top 25% of the range have a red background and in the bottom 25% of the range have a green background. The red background is not used when the min value is within 80% of the max value.
| dbms | 256us | 1ms | 4ms | 16ms | 64ms | 256ms | 1s | 4s | 16s | gt | max |
|---|---|---|---|---|---|---|---|---|---|---|---|
| ma110401_rel.cz11b_bee | 80.549 | 19.448 | 0.003 | nonzero | 0.006 | ||||||
| ma110401_rel.cz11b1_bee | 74.359 | 25.638 | 0.003 | nonzero | 0.008 | ||||||
| ma110401_rel.cz11c_bee | 78.207 | 21.791 | 0.002 | nonzero | 0.008 |
Insert response time histogram: each cell has the percentage of responses that take <= the time in the header and max is the max response time in seconds. For max values in the top 25% of the range have a red background and in the bottom 25% of the range have a green background. The red background is not used when the min value is within 80% of the max value.
| dbms | 256us | 1ms | 4ms | 16ms | 64ms | 256ms | 1s | 4s | 16s | gt | max |
|---|---|---|---|---|---|---|---|---|---|---|---|
| ma110401_rel.cz11b_bee | 95.008 | 4.983 | 0.008 | 0.042 | |||||||
| ma110401_rel.cz11b1_bee | 98.878 | 0.992 | 0.131 | 0.041 | |||||||
| ma110401_rel.cz11c_bee | 95.039 | 4.942 | 0.019 | 0.048 |
Delete response time histogram: each cell has the percentage of responses that take <= the time in the header and max is the max response time in seconds. For max values in the top 25% of the range have a red background and in the bottom 25% of the range have a green background. The red background is not used when the min value is within 80% of the max value.
| dbms | 256us | 1ms | 4ms | 16ms | 64ms | 256ms | 1s | 4s | 16s | gt | max |
|---|---|---|---|---|---|---|---|---|---|---|---|
| ma110401_rel.cz11b_bee | 95.169 | 4.822 | 0.008 | 0.042 | |||||||
| ma110401_rel.cz11b1_bee | 99.422 | 0.514 | 0.064 | 0.038 | |||||||
| ma110401_rel.cz11c_bee | 95.158 | 4.836 | 0.006 | 0.033 |
Performance metrics for the DBMS listed above. Some are normalized by throughput, others are not. Legend for results is here.
ips	qps	rps	rmbps	wps	wmbps	rpq	rkbpq	wpi	wkbpi	csps	cpups	cspq	cpupq	dbgb1	dbgb2	rss	maxop	p50	p99	tag
998	3836	35	0.1	92.1	3.5	0.009	0.036	0.092	3.629	16918	16.4	4.411	342	6.2	22.0	6.1	0.006	3628	3356	ma110401_rel.cz11b_bee
998	3784	0	0.0	357.2	11.2	0.000	0.000	0.358	11.484	17880	16.3	4.726	345	6.1	11.0	6.0	0.008	3596	3292	ma110401_rel.cz11b1_bee
998	3836	34	0.1	86.6	3.5	0.009	0.036	0.087	3.555	16780	16.2	4.374	338	6.2	22.0	6.1	0.008	3628	3340	ma110401_rel.cz11c_bee
l.i0
l.i0: load without secondary indexes
Performance metrics for all DBMS, not just the ones listed above. Some are normalized by throughput, others are not. Legend for results is here.
ips	qps	rps	rmbps	wps	wmbps	rpq	rkbpq	wpi	wkbpi	csps	cpups	cspq	cpupq	dbgb1	dbgb2	rss	maxop	p50	p99	tag
82192	0	0	0.0	252.5	21.1	0.000	0.000	0.003	0.262	11329	25.9	0.138	25	2.0	17.8	2.3	0.206	82810	69657	ma110401_rel.cz11b_bee
82645	0	0	0.0	369.2	23.0	0.000	0.000	0.004	0.284	11860	25.9	0.144	25	2.0	6.8	2.3	0.204	83507	69839	ma110401_rel.cz11b1_bee
83102	0	0	0.0	52.5	21.2	0.000	0.000	0.001	0.262	11328	25.9	0.136	25	2.0	17.8	2.3	0.204	83805	68653	ma110401_rel.cz11c_bee
l.x
l.x: create secondary indexes
Performance metrics for all DBMS, not just the ones listed above. Some are normalized by throughput, others are not. Legend for results is here.
ips	qps	rps	rmbps	wps	wmbps	rpq	rkbpq	wpi	wkbpi	csps	cpups	cspq	cpupq	dbgb1	dbgb2	rss	maxop	p50	p99	tag
128206	0	0	0.0	807.7	109.8	0.000	0.000	0.006	0.877	2916	12.1	0.023	8	4.5	20.3	3.8	0.002	NA	NA	ma110401_rel.cz11b_bee
128756	0	0	0.0	728.2	108.6	0.000	0.000	0.006	0.864	2389	12.0	0.019	7	4.5	9.3	3.8	0.002	NA	NA	ma110401_rel.cz11b1_bee
128206	0	0	0.0	270.9	109.8	0.000	0.000	0.002	0.877	3184	12.0	0.025	7	4.5	20.3	3.8	0.002	NA	NA	ma110401_rel.cz11c_bee
l.i1
l.i1: continue load after secondary indexes created with 50 inserts per transaction
Performance metrics for all DBMS, not just the ones listed above. Some are normalized by throughput, others are not. Legend for results is here.
ips	qps	rps	rmbps	wps	wmbps	rpq	rkbpq	wpi	wkbpi	csps	cpups	cspq	cpupq	dbgb1	dbgb2	rss	maxop	p50	p99	tag
17770	0	685	2.7	2634.6	95.1	0.039	0.154	0.148	5.483	46630	32.8	2.624	148	6.2	22.0	6.1	0.189	18380	5194	ma110401_rel.cz11b_bee
15094	0	60	0.2	6985.5	217.9	0.004	0.016	0.463	14.784	62069	30.4	4.112	161	6.1	11.0	6.0	0.158	15233	5244	ma110401_rel.cz11b1_bee
17264	0	663	2.6	2422.0	92.6	0.038	0.154	0.140	5.492	42459	32.3	2.459	150	6.2	22.0	6.1	0.451	17780	4895	ma110401_rel.cz11c_bee
l.i2
l.i2: continue load after secondary indexes created with 5 inserts per transaction
Performance metrics for all DBMS, not just the ones listed above. Some are normalized by throughput, others are not. Legend for results is here.
ips	qps	rps	rmbps	wps	wmbps	rpq	rkbpq	wpi	wkbpi	csps	cpups	cspq	cpupq	dbgb1	dbgb2	rss	maxop	p50	p99	tag
10799	0	1719	6.7	1320.2	49.4	0.159	0.637	0.122	4.680	60542	34.8	5.606	258	6.2	22.0	6.1	0.064	10913	9004	ma110401_rel.cz11b_bee
10214	0	0	0.0	4089.2	129.1	0.000	0.000	0.400	12.944	67045	34.8	6.564	273	6.1	11.0	6.0	0.045	10129	8450	ma110401_rel.cz11b1_bee
10707	0	1702	6.6	1253.1	48.8	0.159	0.636	0.117	4.666	58604	34.6	5.474	259	6.2	22.0	6.1	0.093	10918	8426	ma110401_rel.cz11c_bee
qr100.L1
qr100.L1: range queries with 100 insert/s per client
Performance metrics for all DBMS, not just the ones listed above. Some are normalized by throughput, others are not. Legend for results is here.
ips	qps	rps	rmbps	wps	wmbps	rpq	rkbpq	wpi	wkbpi	csps	cpups	cspq	cpupq	dbgb1	dbgb2	rss	maxop	p50	p99	tag
100	3667	3	0.0	8.2	0.3	0.001	0.003	0.082	2.944	14247	13.0	3.885	284	6.2	22.0	6.1	0.004	3644	3484	ma110401_rel.cz11b_bee
100	3633	0	0.0	8.1	0.3	0.000	0.000	0.082	2.959	14113	12.8	3.885	282	6.1	11.0	5.9	0.003	3612	3452	ma110401_rel.cz11b1_bee
100	3642	3	0.0	8.1	0.3	0.001	0.003	0.081	2.962	14149	12.8	3.885	281	6.2	22.0	6.1	0.014	3612	3468	ma110401_rel.cz11c_bee
qp100.L2
qp100.L2: point queries with 100 insert/s per client
Performance metrics for all DBMS, not just the ones listed above. Some are normalized by throughput, others are not. Legend for results is here.
ips	qps	rps	rmbps	wps	wmbps	rpq	rkbpq	wpi	wkbpi	csps	cpups	cspq	cpupq	dbgb1	dbgb2	rss	maxop	p50	p99	tag
100	3728	3	0.0	14.0	0.5	0.001	0.003	0.140	4.715	15297	14.3	4.103	307	6.2	22.0	6.1	0.007	3580	3355	ma110401_rel.cz11b_bee
100	3674	0	0.0	21.1	0.7	0.000	0.000	0.211	6.827	15101	14.3	4.110	311	6.1	11.0	5.9	0.005	3519	3308	ma110401_rel.cz11b1_bee
100	3597	3	0.0	19.8	0.6	0.001	0.003	0.198	6.484	14778	14.1	4.108	314	6.2	22.0	6.1	0.004	3500	3307	ma110401_rel.cz11c_bee
qr500.L3
qr500.L3: range queries with 500 insert/s per client
Performance metrics for all DBMS, not just the ones listed above. Some are normalized by throughput, others are not. Legend for results is here.
ips	qps	rps	rmbps	wps	wmbps	rpq	rkbpq	wpi	wkbpi	csps	cpups	cspq	cpupq	dbgb1	dbgb2	rss	maxop	p50	p99	tag
499	3593	17	0.1	3.1	0.6	0.005	0.019	0.006	1.165	14154	13.6	3.939	303	6.2	22.0	6.1	0.003	3580	3452	ma110401_rel.cz11b_bee
499	3559	0	0.0	186.4	5.8	0.000	0.000	0.374	11.925	14899	13.9	4.186	312	6.1	11.0	6.0	0.018	3532	3372	ma110401_rel.cz11b1_bee
499	3622	17	0.1	8.5	0.7	0.005	0.019	0.017	1.499	14286	13.8	3.945	305	6.2	22.0	6.1	0.010	3596	3468	ma110401_rel.cz11c_bee
qp500.L4
qp500.L4: point queries with 500 insert/s per client
Performance metrics for all DBMS, not just the ones listed above. Some are normalized by throughput, others are not. Legend for results is here.
ips	qps	rps	rmbps	wps	wmbps	rpq	rkbpq	wpi	wkbpi	csps	cpups	cspq	cpupq	dbgb1	dbgb2	rss	maxop	p50	p99	tag
499	3835	17	0.1	80.7	2.7	0.005	0.018	0.162	5.595	16376	15.6	4.270	325	6.2	22.0	6.1	0.005	3627	3356	ma110401_rel.cz11b_bee
499	3765	0	0.0	179.8	5.6	0.000	0.000	0.360	11.520	16543	15.6	4.394	331	6.1	11.0	5.9	0.014	3580	3339	ma110401_rel.cz11b1_bee
499	3849	18	0.1	78.0	2.7	0.005	0.018	0.156	5.551	16342	15.8	4.246	328	6.2	22.0	6.1	0.005	3628	3373	ma110401_rel.cz11c_bee
qr1000.L5
qr1000.L5: range queries with 1000 insert/s per client
Performance metrics for all DBMS, not just the ones listed above. Some are normalized by throughput, others are not. Legend for results is here.
ips	qps	rps	rmbps	wps	wmbps	rpq	rkbpq	wpi	wkbpi	csps	cpups	cspq	cpupq	dbgb1	dbgb2	rss	maxop	p50	p99	tag
998	3618	35	0.1	94.7	3.6	0.010	0.039	0.095	3.713	15105	14.9	4.175	329	6.2	22.0	6.1	0.014	3580	3420	ma110401_rel.cz11b_bee
998	3552	0	0.0	355.1	11.1	0.000	0.000	0.356	11.425	15976	14.9	4.498	336	6.1	11.0	6.0	0.017	3516	3340	ma110401_rel.cz11b1_bee
998	3645	35	0.1	86.9	3.5	0.010	0.038	0.087	3.572	15057	14.9	4.131	327	6.2	22.0	6.1	0.035	3612	3468	ma110401_rel.cz11c_bee
qp1000.L6
qp1000.L6: point queries with 1000 insert/s per client
Performance metrics for all DBMS, not just the ones listed above. Some are normalized by throughput, others are not. Legend for results is here.
ips	qps	rps	rmbps	wps	wmbps	rpq	rkbpq	wpi	wkbpi	csps	cpups	cspq	cpupq	dbgb1	dbgb2	rss	maxop	p50	p99	tag
998	3836	35	0.1	92.1	3.5	0.009	0.036	0.092	3.629	16918	16.4	4.411	342	6.2	22.0	6.1	0.006	3628	3356	ma110401_rel.cz11b_bee
998	3784	0	0.0	357.2	11.2	0.000	0.000	0.358	11.484	17880	16.3	4.726	345	6.1	11.0	6.0	0.008	3596	3292	ma110401_rel.cz11b1_bee
998	3836	34	0.1	86.6	3.5	0.009	0.036	0.087	3.555	16780	16.2	4.374	338	6.2	22.0	6.1	0.008	3628	3340	ma110401_rel.cz11c_bee
l.i0
- l.i0: load without secondary indexes
- Legend for results is here.
- Each entry lists the percentage of responses that fit in that bucket (slower than max time for previous bucket, faster than min time for next bucket).
Insert response time histogram
256us	1ms	4ms	16ms	64ms	256ms	1s	4s	16s	gt	max	tag
0.000	2.688	96.998	0.187	0.122	0.005	0.000	0.000	0.000	0.000	0.206	ma110401_rel.cz11b_bee
0.000	4.149	95.520	0.200	0.123	0.008	0.000	0.000	0.000	0.000	0.204	ma110401_rel.cz11b1_bee
0.000	4.374	95.313	0.190	0.119	0.005	0.000	0.000	0.000	0.000	0.204	ma110401_rel.cz11c_bee
l.x
- l.x: create secondary indexes
- Legend for results is here.
- Each entry lists the percentage of responses that fit in that bucket (slower than max time for previous bucket, faster than min time for next bucket).
TODO - determine whether there is data for create index response time
l.i1
- l.i1: continue load after secondary indexes created with 50 inserts per transaction
- Legend for results is here.
- Each entry lists the percentage of responses that fit in that bucket (slower than max time for previous bucket, faster than min time for next bucket).
Insert response time histogram
256us	1ms	4ms	16ms	64ms	256ms	1s	4s	16s	gt	max	tag
0.000	0.000	94.301	5.211	0.485	0.004	0.000	0.000	0.000	0.000	0.189	ma110401_rel.cz11b_bee
0.000	0.000	88.582	10.022	1.392	0.004	0.000	0.000	0.000	0.000	0.158	ma110401_rel.cz11b1_bee
0.000	0.000	93.966	5.289	0.732	0.012	0.001	0.000	0.000	0.000	0.451	ma110401_rel.cz11c_bee
Delete response time histogram
256us	1ms	4ms	16ms	64ms	256ms	1s	4s	16s	gt	max	tag
0.000	0.000	96.023	3.587	0.388	0.003	0.000	0.000	0.000	0.000	0.188	ma110401_rel.cz11b_bee
0.000	0.000	90.808	8.017	1.173	0.002	0.000	0.000	0.000	0.000	0.148	ma110401_rel.cz11b1_bee
0.000	0.000	95.709	3.675	0.605	0.011	nonzero	0.000	0.000	0.000	0.424	ma110401_rel.cz11c_bee
l.i2
- l.i2: continue load after secondary indexes created with 5 inserts per transaction
- Legend for results is here.
- Each entry lists the percentage of responses that fit in that bucket (slower than max time for previous bucket, faster than min time for next bucket).
Insert response time histogram
256us	1ms	4ms	16ms	64ms	256ms	1s	4s	16s	gt	max	tag
0.358	99.424	0.111	0.104	0.003	nonzero	0.000	0.000	0.000	0.000	0.064	ma110401_rel.cz11b_bee
0.665	98.651	0.305	0.371	0.008	0.000	0.000	0.000	0.000	0.000	0.045	ma110401_rel.cz11b1_bee
0.708	99.044	0.116	0.124	0.008	nonzero	0.000	0.000	0.000	0.000	0.093	ma110401_rel.cz11c_bee
Delete response time histogram
256us	1ms	4ms	16ms	64ms	256ms	1s	4s	16s	gt	max	tag
1.129	98.652	0.117	0.098	0.003	nonzero	0.000	0.000	0.000	0.000	0.064	ma110401_rel.cz11b_bee
1.519	97.830	0.296	0.349	0.007	0.000	0.000	0.000	0.000	0.000	0.045	ma110401_rel.cz11b1_bee
1.406	98.354	0.116	0.117	0.007	nonzero	0.000	0.000	0.000	0.000	0.067	ma110401_rel.cz11c_bee
qr100.L1
- qr100.L1: range queries with 100 insert/s per client
- Legend for results is here.
- Each entry lists the percentage of responses that fit in that bucket (slower than max time for previous bucket, faster than min time for next bucket).
Query response time histogram
256us	1ms	4ms	16ms	64ms	256ms	1s	4s	16s	gt	max	tag
60.353	39.646	nonzero	nonzero	0.000	0.000	0.000	0.000	0.000	0.000	0.004	ma110401_rel.cz11b_bee
58.305	41.695	nonzero	0.000	0.000	0.000	0.000	0.000	0.000	0.000	0.003	ma110401_rel.cz11b1_bee
59.249	40.751	nonzero	nonzero	0.000	0.000	0.000	0.000	0.000	0.000	0.014	ma110401_rel.cz11c_bee
Insert response time histogram
256us	1ms	4ms	16ms	64ms	256ms	1s	4s	16s	gt	max	tag
0.000	0.000	53.250	46.722	0.028	0.000	0.000	0.000	0.000	0.000	0.020	ma110401_rel.cz11b_bee
0.000	0.000	99.944	0.028	0.028	0.000	0.000	0.000	0.000	0.000	0.023	ma110401_rel.cz11b1_bee
0.000	0.000	53.306	46.694	0.000	0.000	0.000	0.000	0.000	0.000	0.012	ma110401_rel.cz11c_bee
Delete response time histogram
256us	1ms	4ms	16ms	64ms	256ms	1s	4s	16s	gt	max	tag
0.000	0.000	53.306	46.694	0.000	0.000	0.000	0.000	0.000	0.000	0.012	ma110401_rel.cz11b_bee
0.000	0.000	100.000	0.000	0.000	0.000	0.000	0.000	0.000	0.000	0.003	ma110401_rel.cz11b1_bee
0.000	0.000	53.278	46.722	0.000	0.000	0.000	0.000	0.000	0.000	0.013	ma110401_rel.cz11c_bee
qp100.L2
- qp100.L2: point queries with 100 insert/s per client
- Legend for results is here.
- Each entry lists the percentage of responses that fit in that bucket (slower than max time for previous bucket, faster than min time for next bucket).
Query response time histogram
256us	1ms	4ms	16ms	64ms	256ms	1s	4s	16s	gt	max	tag
77.686	22.312	0.002	nonzero	0.000	0.000	0.000	0.000	0.000	0.000	0.007	ma110401_rel.cz11b_bee
69.983	30.015	0.001	nonzero	0.000	0.000	0.000	0.000	0.000	0.000	0.005	ma110401_rel.cz11b1_bee
63.743	36.256	0.001	nonzero	0.000	0.000	0.000	0.000	0.000	0.000	0.004	ma110401_rel.cz11c_bee
Insert response time histogram
256us	1ms	4ms	16ms	64ms	256ms	1s	4s	16s	gt	max	tag
0.000	0.000	53.306	46.694	0.000	0.000	0.000	0.000	0.000	0.000	0.012	ma110401_rel.cz11b_bee
0.000	0.000	99.972	0.000	0.028	0.000	0.000	0.000	0.000	0.000	0.022	ma110401_rel.cz11b1_bee
0.000	0.000	53.000	47.000	0.000	0.000	0.000	0.000	0.000	0.000	0.012	ma110401_rel.cz11c_bee
Delete response time histogram
256us	1ms	4ms	16ms	64ms	256ms	1s	4s	16s	gt	max	tag
0.000	0.000	53.333	46.667	0.000	0.000	0.000	0.000	0.000	0.000	0.012	ma110401_rel.cz11b_bee
0.000	0.000	99.972	0.000	0.028	0.000	0.000	0.000	0.000	0.000	0.021	ma110401_rel.cz11b1_bee
0.000	0.000	53.111	46.889	0.000	0.000	0.000	0.000	0.000	0.000	0.012	ma110401_rel.cz11c_bee
qr500.L3
- qr500.L3: range queries with 500 insert/s per client
- Legend for results is here.
- Each entry lists the percentage of responses that fit in that bucket (slower than max time for previous bucket, faster than min time for next bucket).
Query response time histogram
256us	1ms	4ms	16ms	64ms	256ms	1s	4s	16s	gt	max	tag
56.843	43.156	0.001	0.000	0.000	0.000	0.000	0.000	0.000	0.000	0.003	ma110401_rel.cz11b_bee
54.207	45.790	0.002	0.001	nonzero	0.000	0.000	0.000	0.000	0.000	0.018	ma110401_rel.cz11b1_bee
58.087	41.912	0.001	nonzero	0.000	0.000	0.000	0.000	0.000	0.000	0.010	ma110401_rel.cz11c_bee
Insert response time histogram
256us	1ms	4ms	16ms	64ms	256ms	1s	4s	16s	gt	max	tag
0.000	0.000	90.122	9.878	0.000	0.000	0.000	0.000	0.000	0.000	0.012	ma110401_rel.cz11b_bee
0.000	0.000	99.317	0.556	0.128	0.000	0.000	0.000	0.000	0.000	0.025	ma110401_rel.cz11b1_bee
0.000	0.000	90.111	9.889	0.000	0.000	0.000	0.000	0.000	0.000	0.014	ma110401_rel.cz11c_bee
Delete response time histogram
256us	1ms	4ms	16ms	64ms	256ms	1s	4s	16s	gt	max	tag
0.000	0.000	90.583	9.417	0.000	0.000	0.000	0.000	0.000	0.000	0.014	ma110401_rel.cz11b_bee
0.000	0.000	99.644	0.278	0.078	0.000	0.000	0.000	0.000	0.000	0.023	ma110401_rel.cz11b1_bee
0.000	0.000	90.544	9.456	0.000	0.000	0.000	0.000	0.000	0.000	0.013	ma110401_rel.cz11c_bee
qp500.L4
- qp500.L4: point queries with 500 insert/s per client
- Legend for results is here.
- Each entry lists the percentage of responses that fit in that bucket (slower than max time for previous bucket, faster than min time for next bucket).
Query response time histogram
256us	1ms	4ms	16ms	64ms	256ms	1s	4s	16s	gt	max	tag
81.114	18.884	0.002	nonzero	0.000	0.000	0.000	0.000	0.000	0.000	0.005	ma110401_rel.cz11b_bee
75.810	24.188	0.002	nonzero	0.000	0.000	0.000	0.000	0.000	0.000	0.014	ma110401_rel.cz11b1_bee
81.591	18.407	0.002	nonzero	0.000	0.000	0.000	0.000	0.000	0.000	0.005	ma110401_rel.cz11c_bee
Insert response time histogram
256us	1ms	4ms	16ms	64ms	256ms	1s	4s	16s	gt	max	tag
0.000	0.000	89.967	10.033	0.000	0.000	0.000	0.000	0.000	0.000	0.014	ma110401_rel.cz11b_bee
0.000	0.000	99.261	0.639	0.100	0.000	0.000	0.000	0.000	0.000	0.021	ma110401_rel.cz11b1_bee
0.000	0.000	90.006	9.983	0.011	0.000	0.000	0.000	0.000	0.000	0.023	ma110401_rel.cz11c_bee
Delete response time histogram
256us	1ms	4ms	16ms	64ms	256ms	1s	4s	16s	gt	max	tag
0.000	0.000	90.439	9.556	0.006	0.000	0.000	0.000	0.000	0.000	0.021	ma110401_rel.cz11b_bee
0.000	0.000	99.606	0.350	0.044	0.000	0.000	0.000	0.000	0.000	0.023	ma110401_rel.cz11b1_bee
0.000	0.000	90.467	9.528	0.006	0.000	0.000	0.000	0.000	0.000	0.019	ma110401_rel.cz11c_bee
qr1000.L5
- qr1000.L5: range queries with 1000 insert/s per client
- Legend for results is here.
- Each entry lists the percentage of responses that fit in that bucket (slower than max time for previous bucket, faster than min time for next bucket).
Query response time histogram
256us	1ms	4ms	16ms	64ms	256ms	1s	4s	16s	gt	max	tag
58.142	41.854	0.003	0.001	0.000	0.000	0.000	0.000	0.000	0.000	0.014	ma110401_rel.cz11b_bee
53.826	46.166	0.005	0.002	nonzero	0.000	0.000	0.000	0.000	0.000	0.017	ma110401_rel.cz11b1_bee
59.086	40.910	0.003	0.001	nonzero	0.000	0.000	0.000	0.000	0.000	0.035	ma110401_rel.cz11c_bee
Insert response time histogram
256us	1ms	4ms	16ms	64ms	256ms	1s	4s	16s	gt	max	tag
0.000	0.000	95.061	4.928	0.011	0.000	0.000	0.000	0.000	0.000	0.032	ma110401_rel.cz11b_bee
0.000	0.000	98.961	0.917	0.122	0.000	0.000	0.000	0.000	0.000	0.050	ma110401_rel.cz11b1_bee
0.000	0.000	95.000	4.978	0.022	0.000	0.000	0.000	0.000	0.000	0.051	ma110401_rel.cz11c_bee
Delete response time histogram
256us	1ms	4ms	16ms	64ms	256ms	1s	4s	16s	gt	max	tag
0.000	0.000	95.183	4.806	0.011	0.000	0.000	0.000	0.000	0.000	0.030	ma110401_rel.cz11b_bee
0.000	0.000	99.408	0.533	0.058	0.000	0.000	0.000	0.000	0.000	0.039	ma110401_rel.cz11b1_bee
0.000	0.000	95.153	4.831	0.017	0.000	0.000	0.000	0.000	0.000	0.040	ma110401_rel.cz11c_bee
qp1000.L6
- qp1000.L6: point queries with 1000 insert/s per client
- Legend for results is here.
- Each entry lists the percentage of responses that fit in that bucket (slower than max time for previous bucket, faster than min time for next bucket).
Query response time histogram
256us	1ms	4ms	16ms	64ms	256ms	1s	4s	16s	gt	max	tag
80.549	19.448	0.003	nonzero	0.000	0.000	0.000	0.000	0.000	0.000	0.006	ma110401_rel.cz11b_bee
74.359	25.638	0.003	nonzero	0.000	0.000	0.000	0.000	0.000	0.000	0.008	ma110401_rel.cz11b1_bee
78.207	21.791	0.002	nonzero	0.000	0.000	0.000	0.000	0.000	0.000	0.008	ma110401_rel.cz11c_bee
Insert response time histogram
256us	1ms	4ms	16ms	64ms	256ms	1s	4s	16s	gt	max	tag
0.000	0.000	95.008	4.983	0.008	0.000	0.000	0.000	0.000	0.000	0.042	ma110401_rel.cz11b_bee
0.000	0.000	98.878	0.992	0.131	0.000	0.000	0.000	0.000	0.000	0.041	ma110401_rel.cz11b1_bee
0.000	0.000	95.039	4.942	0.019	0.000	0.000	0.000	0.000	0.000	0.048	ma110401_rel.cz11c_bee
Delete response time histogram
256us	1ms	4ms	16ms	64ms	256ms	1s	4s	16s	gt	max	tag
0.000	0.000	95.169	4.822	0.008	0.000	0.000	0.000	0.000	0.000	0.042	ma110401_rel.cz11b_bee
0.000	0.000	99.422	0.514	0.064	0.000	0.000	0.000	0.000	0.000	0.038	ma110401_rel.cz11b1_bee
0.000	0.000	95.158	4.836	0.006	0.000	0.000	0.000	0.000	0.000	0.033	ma110401_rel.cz11c_bee