Introduction
This is a report for the insert benchmark with 30M docs and 1 client(s). It is generated by scripts (bash, awk, sed) and Tufte might not be impressed. An overview of the insert benchmark is here and a short update is here. Below, by DBMS, I mean DBMS+version.config. An example is my8020.c10b40 where my means MySQL, 8020 is version 8.0.20 and c10b40 is the name for the configuration file.
The test server has 8 AMD cores, 16G RAM and an NVMe SSD. It is described here as the Beelink. The benchmark was run with 1 client and there were 1 or 3 connections per client (1 for queries or inserts without rate limits, 1+1 for rate limited inserts+deletes). It uses 1 table. It loads 30M rows per table without secondary indexes, creates 3 secondary indexes per table, then inserts 40m+10m rows per table with a delete per insert to avoid growing the table. It then does 6 read+write tests for 1800s each that do queries as fast as possible with 100,100,500,500,1000,1000 inserts/s and the same for deletes/s per client concurrent with the queries. The database is cached in memory. Clients and the DBMS share one server. The per-database configs are in the per-database subdirectories here.
The tested DBMS are:
- ma101107_rel.cz11a_bee - MariaDB 10.11.7 with the cz11a_bee config
- ma101107_rel.cz11a1_bee - MariaDB 10.11.7 with the cz11a1_bee config that uses a smaller buffer pool and redo log
- ma101107_rel.cz11b_bee - MariaDB 10.11.7 with the cz11b_bee config that uses innodb_flush_method=O_DIRECT
- ma101107_rel.cz11c_bee - MariaDB 10.11.7 with the cz11c_bee config that uses innodb_flush_method=fsync
- ma101107_rel.cz11d_bee - MariaDB 10.11.7 with the cz11d_bee config that uses innodb_change_buffering=all
- ma101107_rel.cz11d1_bee - MariaDB 10.11.7 with the cz11d1_bee config that uses innodb_change_buffering=alland a smaller buffer pool and redo log
Contents
- Summary
- l.i0: load without secondary indexes
- l.x: create secondary indexes
- l.i1: continue load after secondary indexes created with 50 inserts per transaction
- l.i2: continue load after secondary indexes created with 5 inserts per transaction
- qr100.L1: range queries with 100 insert/s per client
- qp100.L2: point queries with 100 insert/s per client
- qr500.L3: range queries with 500 insert/s per client
- qp500.L4: point queries with 500 insert/s per client
- qr1000.L5: range queries with 1000 insert/s per client
- qp1000.L6: point queries with 1000 insert/s per client
Summary
The numbers are inserts/s for l.i0, l.i1 and l.i2, indexed docs (or rows) /s for l.x and queries/s for qr100, qp100 thru qr1000, qp1000" The values are the average rate over the entire test for inserts (IPS) and queries (QPS). The range of values for IPS and QPS is split into 3 parts: bottom 25%, middle 50%, top 25%. Values in the bottom 25% have a red background, values in the top 25% have a green background and values in the middle have no color. A gray background is used for values that can be ignored because the DBMS did not sustain the target insert rate. Red backgrounds are not used when the minimum value is within 80% of the max value.
| dbms | l.i0 | l.x | l.i1 | l.i2 | qr100 | qp100 | qr500 | qp500 | qr1000 | qp1000 |
|---|---|---|---|---|---|---|---|---|---|---|
| ma101107_rel.cz11a_bee | 83799 | 130435 | 19066 | 11136 | 3565 | 3729 | 3516 | 3818 | 3574 | 3824 |
| ma101107_rel.cz11a1_bee | 83565 | 129870 | 18459 | 11111 | 3529 | 3752 | 3550 | 3751 | 3536 | 3756 |
| ma101107_rel.cz11b_bee | 83565 | 130435 | 17730 | 10941 | 3670 | 3588 | 3621 | 3791 | 3578 | 3768 |
| ma101107_rel.cz11c_bee | 84270 | 130435 | 17219 | 10799 | 3599 | 3644 | 3568 | 3724 | 3554 | 3919 |
| ma101107_rel.cz11d_bee | 83799 | 130435 | 19175 | 11198 | 3614 | 3720 | 3580 | 3802 | 3597 | 3807 |
| ma101107_rel.cz11d1_bee | 83565 | 129870 | 18391 | 11074 | 3663 | 3728 | 3628 | 3817 | 3589 | 3805 |
This table has relative throughput, throughput for the DBMS relative to the DBMS in the first line, using the absolute throughput from the previous table. Values less than 0.95 have a yellow background. Values greater than 1.05 have a blue background.
| dbms | l.i0 | l.x | l.i1 | l.i2 | qr100 | qp100 | qr500 | qp500 | qr1000 | qp1000 |
|---|---|---|---|---|---|---|---|---|---|---|
| ma101107_rel.cz11a_bee | 1.00 | 1.00 | 1.00 | 1.00 | 1.00 | 1.00 | 1.00 | 1.00 | 1.00 | 1.00 |
| ma101107_rel.cz11a1_bee | 1.00 | 1.00 | 0.97 | 1.00 | 0.99 | 1.01 | 1.01 | 0.98 | 0.99 | 0.98 |
| ma101107_rel.cz11b_bee | 1.00 | 1.00 | 0.93 | 0.98 | 1.03 | 0.96 | 1.03 | 0.99 | 1.00 | 0.99 |
| ma101107_rel.cz11c_bee | 1.01 | 1.00 | 0.90 | 0.97 | 1.01 | 0.98 | 1.01 | 0.98 | 0.99 | 1.02 |
| ma101107_rel.cz11d_bee | 1.00 | 1.00 | 1.01 | 1.01 | 1.01 | 1.00 | 1.02 | 1.00 | 1.01 | 1.00 |
| ma101107_rel.cz11d1_bee | 1.00 | 1.00 | 0.96 | 0.99 | 1.03 | 1.00 | 1.03 | 1.00 | 1.00 | 1.00 |
This lists the average rate of inserts/s for the tests that do inserts concurrent with queries. For such tests the query rate is listed in the table above. The read+write tests are setup so that the insert rate should match the target rate every second. Cells that are not at least 95% of the target have a red background to indicate a failure to satisfy the target.
| dbms | qr100.L1 | qp100.L2 | qr500.L3 | qp500.L4 | qr1000.L5 | qp1000.L6 |
|---|---|---|---|---|---|---|
| ma101107_rel.cz11a_bee | 100 | 100 | 499 | 499 | 998 | 998 |
| ma101107_rel.cz11a1_bee | 100 | 100 | 499 | 499 | 998 | 998 |
| ma101107_rel.cz11b_bee | 100 | 100 | 499 | 499 | 998 | 998 |
| ma101107_rel.cz11c_bee | 100 | 100 | 499 | 499 | 998 | 998 |
| ma101107_rel.cz11d_bee | 100 | 100 | 499 | 499 | 998 | 998 |
| ma101107_rel.cz11d1_bee | 100 | 100 | 499 | 499 | 998 | 998 |
| target | 100 | 100 | 500 | 500 | 1000 | 1000 |
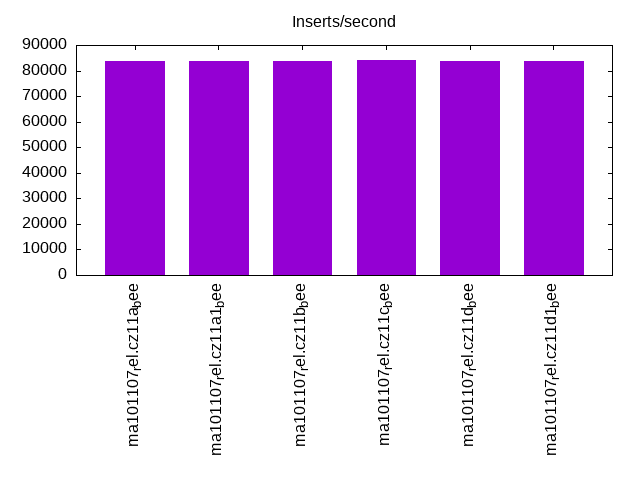
l.i0
l.i0: load without secondary indexes. Graphs for performance per 1-second interval are here.
Average throughput:
Insert response time histogram: each cell has the percentage of responses that take <= the time in the header and max is the max response time in seconds. For the max column values in the top 25% of the range have a red background and in the bottom 25% of the range have a green background. The red background is not used when the min value is within 80% of the max value.
| dbms | 256us | 1ms | 4ms | 16ms | 64ms | 256ms | 1s | 4s | 16s | gt | max |
|---|---|---|---|---|---|---|---|---|---|---|---|
| ma101107_rel.cz11a_bee | 10.964 | 88.724 | 0.197 | 0.111 | 0.005 | 0.182 | |||||
| ma101107_rel.cz11a1_bee | 10.692 | 88.976 | 0.206 | 0.118 | 0.007 | 0.199 | |||||
| ma101107_rel.cz11b_bee | 9.943 | 89.744 | 0.197 | 0.111 | 0.005 | 0.229 | |||||
| ma101107_rel.cz11c_bee | 12.063 | 87.625 | 0.185 | 0.121 | 0.005 | 0.251 | |||||
| ma101107_rel.cz11d_bee | 10.120 | 89.568 | 0.184 | 0.122 | 0.005 | 0.190 | |||||
| ma101107_rel.cz11d1_bee | 11.378 | 88.292 | 0.201 | 0.121 | 0.007 | 0.202 |
Performance metrics for the DBMS listed above. Some are normalized by throughput, others are not. Legend for results is here.
ips	qps	rps	rmbps	wps	wmbps	rpq	rkbpq	wpi	wkbpi	csps	cpups	cspq	cpupq	dbgb1	dbgb2	rss	maxop	p50	p99	tag
83799	0	0	0.0	266.2	21.6	0.000	0.000	0.003	0.264	11299	25.8	0.135	25	2.0	17.8	2.4	0.182	84803	71353	ma101107_rel.cz11a_bee
83565	0	0	0.0	374.7	23.3	0.000	0.000	0.004	0.286	11804	25.7	0.141	25	2.0	6.8	2.3	0.199	84651	69921	ma101107_rel.cz11a1_bee
83565	0	0	0.0	262.2	21.5	0.000	0.000	0.003	0.264	11334	25.9	0.136	25	2.0	17.8	2.4	0.229	84504	70719	ma101107_rel.cz11b_bee
84270	0	0	0.0	54.6	21.5	0.000	0.000	0.001	0.262	11219	26.0	0.133	25	2.0	17.8	2.4	0.251	84902	70520	ma101107_rel.cz11c_bee
83799	0	0	0.0	265.5	21.6	0.000	0.000	0.003	0.263	11312	25.8	0.135	25	2.0	17.8	2.4	0.190	84506	70520	ma101107_rel.cz11d_bee
83565	0	0	0.0	379.3	23.4	0.000	0.000	0.005	0.287	11733	25.7	0.140	25	2.0	6.8	2.3	0.202	84506	70521	ma101107_rel.cz11d1_bee
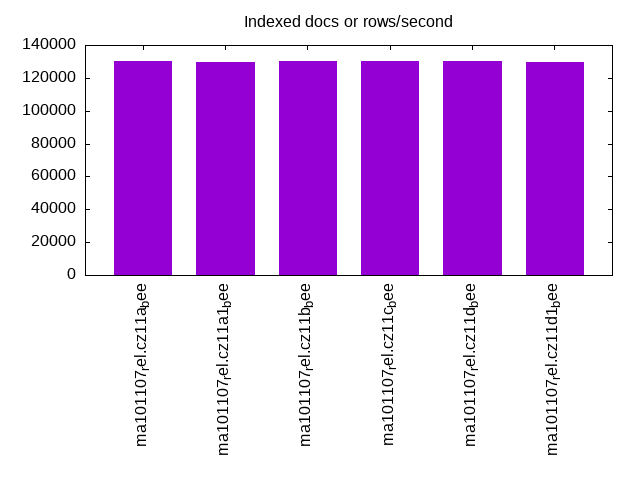
l.x
l.x: create secondary indexes.
Average throughput:
Performance metrics for the DBMS listed above. Some are normalized by throughput, others are not. Legend for results is here.
ips	qps	rps	rmbps	wps	wmbps	rpq	rkbpq	wpi	wkbpi	csps	cpups	cspq	cpupq	dbgb1	dbgb2	rss	maxop	p50	p99	tag
130435	0	0	0.0	823.0	111.7	0.000	0.000	0.006	0.877	3016	12.1	0.023	7	4.5	20.3	3.8	0.002	NA	NA	ma101107_rel.cz11a_bee
129870	0	0	0.0	768.9	109.9	0.000	0.000	0.006	0.866	2564	12.0	0.020	7	4.5	9.3	3.8	0.002	NA	NA	ma101107_rel.cz11a1_bee
130435	0	0	0.0	817.1	111.0	0.000	0.000	0.006	0.872	3151	12.1	0.024	7	4.5	20.3	3.8	0.002	NA	NA	ma101107_rel.cz11b_bee
130435	0	0	0.0	272.3	111.0	0.000	0.000	0.002	0.872	3240	12.2	0.025	7	4.5	20.3	3.8	0.002	NA	NA	ma101107_rel.cz11c_bee
130435	0	0	0.0	814.4	110.7	0.000	0.000	0.006	0.869	3054	12.1	0.023	7	4.5	20.3	3.8	0.002	NA	NA	ma101107_rel.cz11d_bee
129870	0	0	0.0	782.2	110.2	0.000	0.000	0.006	0.869	2584	12.0	0.020	7	4.5	9.3	3.8	0.002	NA	NA	ma101107_rel.cz11d1_bee
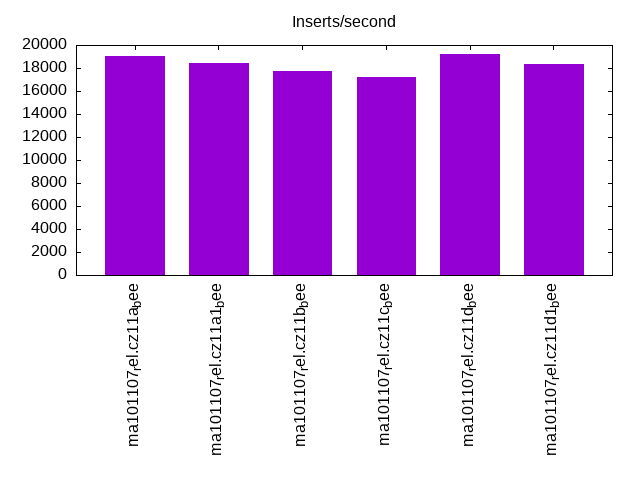
l.i1
l.i1: continue load after secondary indexes created with 50 inserts per transaction. Graphs for performance per 1-second interval are here.
Average throughput:
Insert response time histogram: each cell has the percentage of responses that take <= the time in the header and max is the max response time in seconds. For the max column values in the top 25% of the range have a red background and in the bottom 25% of the range have a green background. The red background is not used when the min value is within 80% of the max value.
| dbms | 256us | 1ms | 4ms | 16ms | 64ms | 256ms | 1s | 4s | 16s | gt | max |
|---|---|---|---|---|---|---|---|---|---|---|---|
| ma101107_rel.cz11a_bee | 95.914 | 4.010 | 0.075 | nonzero | nonzero | 0.263 | |||||
| ma101107_rel.cz11a1_bee | 93.481 | 6.398 | 0.120 | 0.001 | 0.139 | ||||||
| ma101107_rel.cz11b_bee | 94.287 | 5.220 | 0.489 | 0.004 | 0.235 | ||||||
| ma101107_rel.cz11c_bee | 94.149 | 5.084 | 0.751 | 0.015 | nonzero | 0.314 | |||||
| ma101107_rel.cz11d_bee | 95.916 | 4.012 | 0.071 | nonzero | 0.117 | ||||||
| ma101107_rel.cz11d1_bee | 93.264 | 6.610 | 0.125 | 0.001 | 0.136 |
Delete response time histogram: each cell has the percentage of responses that take <= the time in the header and max is the max response time in seconds. For the max column values in the top 25% of the range have a red background and in the bottom 25% of the range have a green background. The red background is not used when the min value is within 80% of the max value.
| dbms | 256us | 1ms | 4ms | 16ms | 64ms | 256ms | 1s | 4s | 16s | gt | max |
|---|---|---|---|---|---|---|---|---|---|---|---|
| ma101107_rel.cz11a_bee | 97.312 | 2.649 | 0.039 | nonzero | 0.255 | ||||||
| ma101107_rel.cz11a1_bee | 95.029 | 4.887 | 0.083 | 0.001 | 0.104 | ||||||
| ma101107_rel.cz11b_bee | 96.131 | 3.470 | 0.396 | 0.003 | 0.234 | ||||||
| ma101107_rel.cz11c_bee | 95.916 | 3.458 | 0.613 | 0.013 | nonzero | 0.269 | |||||
| ma101107_rel.cz11d_bee | 97.301 | 2.656 | 0.043 | 0.063 | |||||||
| ma101107_rel.cz11d1_bee | 94.917 | 4.995 | 0.088 | 0.001 | 0.111 |
Performance metrics for the DBMS listed above. Some are normalized by throughput, others are not. Legend for results is here.
ips	qps	rps	rmbps	wps	wmbps	rpq	rkbpq	wpi	wkbpi	csps	cpups	cspq	cpupq	dbgb1	dbgb2	rss	maxop	p50	p99	tag
19066	0	754	2.9	2800.7	102.6	0.040	0.158	0.147	5.511	50067	34.8	2.626	146	6.2	22.0	6.1	0.263	20328	5294	ma101107_rel.cz11a_bee
18459	0	76	0.3	7907.1	251.6	0.004	0.016	0.428	13.955	73400	35.5	3.976	154	6.2	11.0	6.0	0.139	19279	5394	ma101107_rel.cz11a1_bee
17730	0	698	2.7	2643.1	95.4	0.039	0.158	0.149	5.509	46805	32.9	2.640	148	6.2	22.0	6.1	0.235	18430	5294	ma101107_rel.cz11b_bee
17219	0	677	2.6	2422.3	92.4	0.039	0.157	0.141	5.496	42314	32.5	2.457	151	6.1	22.0	6.1	0.314	17281	4897	ma101107_rel.cz11c_bee
19175	0	756	3.0	2809.4	103.0	0.039	0.158	0.147	5.502	50335	34.9	2.625	146	6.2	22.0	6.1	0.117	20427	5294	ma101107_rel.cz11d_bee
18391	0	75	0.3	7898.0	251.3	0.004	0.016	0.429	13.992	73461	35.5	3.994	154	6.2	11.0	6.0	0.136	19229	5244	ma101107_rel.cz11d1_bee
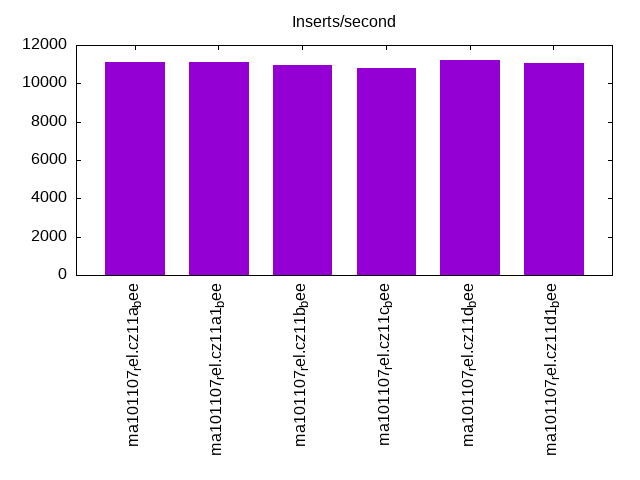
l.i2
l.i2: continue load after secondary indexes created with 5 inserts per transaction. Graphs for performance per 1-second interval are here.
Average throughput:
Insert response time histogram: each cell has the percentage of responses that take <= the time in the header and max is the max response time in seconds. For the max column values in the top 25% of the range have a red background and in the bottom 25% of the range have a green background. The red background is not used when the min value is within 80% of the max value.
| dbms | 256us | 1ms | 4ms | 16ms | 64ms | 256ms | 1s | 4s | 16s | gt | max |
|---|---|---|---|---|---|---|---|---|---|---|---|
| ma101107_rel.cz11a_bee | 0.384 | 99.465 | 0.131 | 0.021 | nonzero | nonzero | 0.065 | ||||
| ma101107_rel.cz11a1_bee | 0.663 | 98.875 | 0.378 | 0.082 | 0.002 | nonzero | 0.072 | ||||
| ma101107_rel.cz11b_bee | 0.518 | 99.260 | 0.117 | 0.102 | 0.002 | 0.063 | |||||
| ma101107_rel.cz11c_bee | 0.344 | 99.411 | 0.113 | 0.122 | 0.009 | nonzero | 0.106 | ||||
| ma101107_rel.cz11d_bee | 0.428 | 99.415 | 0.135 | 0.021 | 0.001 | 0.063 | |||||
| ma101107_rel.cz11d1_bee | 0.606 | 98.930 | 0.379 | 0.083 | 0.002 | nonzero | 0.073 |
Delete response time histogram: each cell has the percentage of responses that take <= the time in the header and max is the max response time in seconds. For the max column values in the top 25% of the range have a red background and in the bottom 25% of the range have a green background. The red background is not used when the min value is within 80% of the max value.
| dbms | 256us | 1ms | 4ms | 16ms | 64ms | 256ms | 1s | 4s | 16s | gt | max |
|---|---|---|---|---|---|---|---|---|---|---|---|
| ma101107_rel.cz11a_bee | 3.060 | 96.786 | 0.134 | 0.020 | nonzero | nonzero | 0.065 | ||||
| ma101107_rel.cz11a1_bee | 3.300 | 96.257 | 0.365 | 0.076 | 0.002 | nonzero | 0.072 | ||||
| ma101107_rel.cz11b_bee | 2.748 | 97.043 | 0.113 | 0.094 | 0.002 | 0.063 | |||||
| ma101107_rel.cz11c_bee | 3.082 | 96.685 | 0.112 | 0.113 | 0.008 | nonzero | 0.106 | ||||
| ma101107_rel.cz11d_bee | 2.951 | 96.891 | 0.137 | 0.021 | 0.001 | 0.063 | |||||
| ma101107_rel.cz11d1_bee | 2.887 | 96.673 | 0.364 | 0.074 | 0.002 | nonzero | 0.072 |
Performance metrics for the DBMS listed above. Some are normalized by throughput, others are not. Legend for results is here.
ips	qps	rps	rmbps	wps	wmbps	rpq	rkbpq	wpi	wkbpi	csps	cpups	cspq	cpupq	dbgb1	dbgb2	rss	maxop	p50	p99	tag
11136	0	1774	6.9	1327.5	50.6	0.159	0.637	0.119	4.652	62221	35.3	5.587	254	6.2	22.0	6.1	0.065	11163	9794	ma101107_rel.cz11a_bee
11111	0	0	0.0	4378.0	140.4	0.000	0.000	0.394	12.939	72944	36.5	6.565	263	6.2	11.0	6.0	0.072	11148	9699	ma101107_rel.cz11a1_bee
10941	0	1744	6.8	1335.0	50.0	0.159	0.638	0.122	4.677	61253	35.0	5.599	256	6.2	22.0	6.1	0.063	11043	9394	ma101107_rel.cz11b_bee
10799	0	1722	6.7	1264.2	49.2	0.159	0.638	0.117	4.668	58906	34.7	5.455	257	6.1	22.0	6.1	0.106	11038	8365	ma101107_rel.cz11c_bee
11198	0	1786	7.0	1355.9	51.5	0.159	0.638	0.121	4.712	62617	35.4	5.592	253	6.2	22.0	6.1	0.063	11223	10149	ma101107_rel.cz11d_bee
11074	0	0	0.0	4360.7	139.8	0.000	0.000	0.394	12.931	72775	36.5	6.572	264	6.2	11.0	6.0	0.073	11133	9594	ma101107_rel.cz11d1_bee
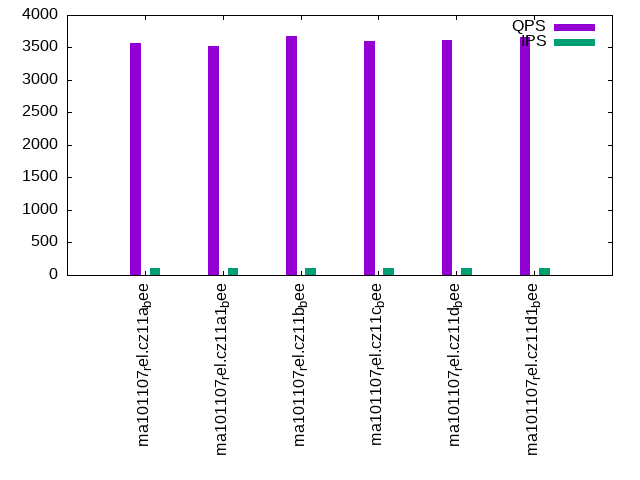
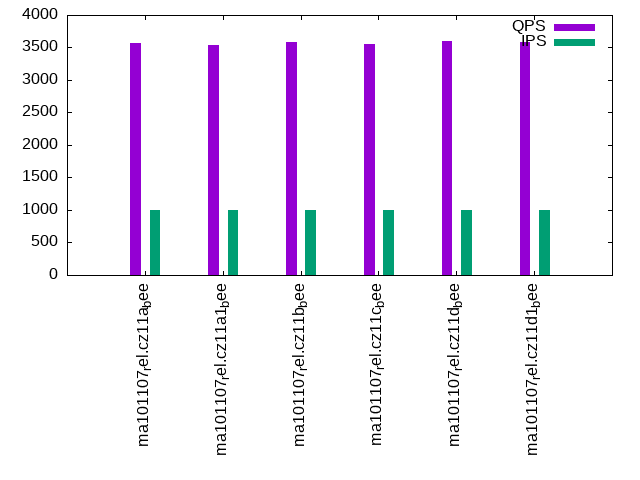
qr100.L1
qr100.L1: range queries with 100 insert/s per client. Graphs for performance per 1-second interval are here.
Average throughput:
Query response time histogram: each cell has the percentage of responses that take <= the time in the header and max is the max response time in seconds. For max values in the top 25% of the range have a red background and in the bottom 25% of the range have a green background. The red background is not used when the min value is within 80% of the max value.
| dbms | 256us | 1ms | 4ms | 16ms | 64ms | 256ms | 1s | 4s | 16s | gt | max |
|---|---|---|---|---|---|---|---|---|---|---|---|
| ma101107_rel.cz11a_bee | 54.960 | 45.040 | nonzero | nonzero | 0.005 | ||||||
| ma101107_rel.cz11a1_bee | 52.340 | 47.660 | nonzero | nonzero | 0.014 | ||||||
| ma101107_rel.cz11b_bee | 59.643 | 40.356 | 0.001 | nonzero | 0.012 | ||||||
| ma101107_rel.cz11c_bee | 56.064 | 43.935 | nonzero | nonzero | nonzero | 0.016 | |||||
| ma101107_rel.cz11d_bee | 57.715 | 42.284 | nonzero | 0.004 | |||||||
| ma101107_rel.cz11d1_bee | 59.825 | 40.174 | 0.001 | nonzero | 0.013 |
Insert response time histogram: each cell has the percentage of responses that take <= the time in the header and max is the max response time in seconds. For max values in the top 25% of the range have a red background and in the bottom 25% of the range have a green background. The red background is not used when the min value is within 80% of the max value.
| dbms | 256us | 1ms | 4ms | 16ms | 64ms | 256ms | 1s | 4s | 16s | gt | max |
|---|---|---|---|---|---|---|---|---|---|---|---|
| ma101107_rel.cz11a_bee | 53.306 | 46.667 | 0.028 | 0.024 | |||||||
| ma101107_rel.cz11a1_bee | 99.944 | 0.028 | 0.028 | 0.021 | |||||||
| ma101107_rel.cz11b_bee | 53.194 | 46.778 | 0.028 | 0.044 | |||||||
| ma101107_rel.cz11c_bee | 53.028 | 46.972 | 0.012 | ||||||||
| ma101107_rel.cz11d_bee | 53.278 | 46.694 | 0.028 | 0.026 | |||||||
| ma101107_rel.cz11d1_bee | 99.917 | 0.083 | 0.015 |
Delete response time histogram: each cell has the percentage of responses that take <= the time in the header and max is the max response time in seconds. For max values in the top 25% of the range have a red background and in the bottom 25% of the range have a green background. The red background is not used when the min value is within 80% of the max value.
| dbms | 256us | 1ms | 4ms | 16ms | 64ms | 256ms | 1s | 4s | 16s | gt | max |
|---|---|---|---|---|---|---|---|---|---|---|---|
| ma101107_rel.cz11a_bee | 53.361 | 46.639 | 0.012 | ||||||||
| ma101107_rel.cz11a1_bee | 99.944 | 0.056 | 0.014 | ||||||||
| ma101107_rel.cz11b_bee | 53.222 | 46.750 | 0.028 | 0.017 | |||||||
| ma101107_rel.cz11c_bee | 53.028 | 46.972 | 0.012 | ||||||||
| ma101107_rel.cz11d_bee | 53.278 | 46.722 | 0.012 | ||||||||
| ma101107_rel.cz11d1_bee | 99.972 | 0.028 | 0.017 |
Performance metrics for the DBMS listed above. Some are normalized by throughput, others are not. Legend for results is here.
ips	qps	rps	rmbps	wps	wmbps	rpq	rkbpq	wpi	wkbpi	csps	cpups	cspq	cpupq	dbgb1	dbgb2	rss	maxop	p50	p99	tag
100	3565	3	0.0	8.0	0.3	0.001	0.004	0.080	2.955	13852	12.8	3.886	287	6.2	22.0	6.1	0.005	3532	3388	ma101107_rel.cz11a_bee
100	3529	0	0.0	8.0	0.3	0.000	0.000	0.080	2.979	13712	12.6	3.886	286	6.2	11.0	6.0	0.014	3515	3372	ma101107_rel.cz11a1_bee
100	3670	3	0.0	8.1	0.3	0.001	0.003	0.082	2.954	14267	12.8	3.888	279	6.2	22.0	6.1	0.012	3627	3452	ma101107_rel.cz11b_bee
100	3599	3	0.0	8.1	0.3	0.001	0.003	0.081	2.963	13976	12.9	3.884	287	6.1	22.0	6.1	0.016	3564	3404	ma101107_rel.cz11c_bee
100	3614	3	0.0	8.0	0.3	0.001	0.004	0.080	2.954	14052	12.9	3.888	286	6.2	22.0	6.1	0.004	3595	3436	ma101107_rel.cz11d_bee
100	3663	0	0.0	8.0	0.3	0.000	0.000	0.080	2.942	14227	12.7	3.883	277	6.2	11.0	6.0	0.013	3628	3452	ma101107_rel.cz11d1_bee
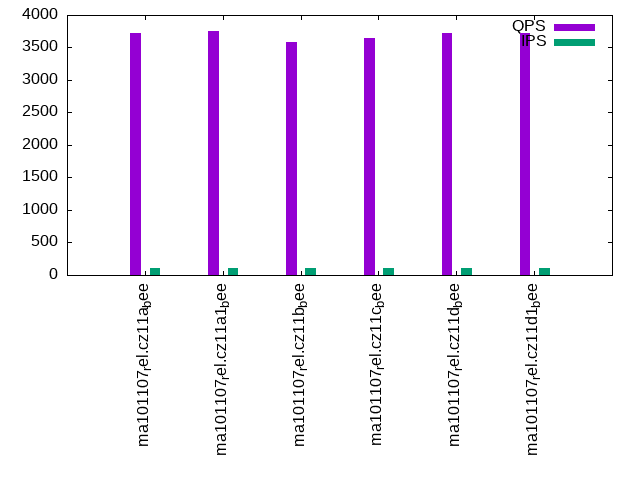
qp100.L2
qp100.L2: point queries with 100 insert/s per client. Graphs for performance per 1-second interval are here.
Average throughput:
Query response time histogram: each cell has the percentage of responses that take <= the time in the header and max is the max response time in seconds. For max values in the top 25% of the range have a red background and in the bottom 25% of the range have a green background. The red background is not used when the min value is within 80% of the max value.
| dbms | 256us | 1ms | 4ms | 16ms | 64ms | 256ms | 1s | 4s | 16s | gt | max |
|---|---|---|---|---|---|---|---|---|---|---|---|
| ma101107_rel.cz11a_bee | 74.190 | 25.809 | 0.002 | nonzero | 0.005 | ||||||
| ma101107_rel.cz11a1_bee | 70.048 | 29.951 | 0.001 | nonzero | 0.005 | ||||||
| ma101107_rel.cz11b_bee | 64.672 | 35.326 | 0.002 | nonzero | 0.005 | ||||||
| ma101107_rel.cz11c_bee | 65.692 | 34.307 | 0.001 | nonzero | 0.005 | ||||||
| ma101107_rel.cz11d_bee | 65.846 | 34.152 | 0.001 | nonzero | 0.005 | ||||||
| ma101107_rel.cz11d1_bee | 71.819 | 28.180 | 0.001 | nonzero | 0.005 |
Insert response time histogram: each cell has the percentage of responses that take <= the time in the header and max is the max response time in seconds. For max values in the top 25% of the range have a red background and in the bottom 25% of the range have a green background. The red background is not used when the min value is within 80% of the max value.
| dbms | 256us | 1ms | 4ms | 16ms | 64ms | 256ms | 1s | 4s | 16s | gt | max |
|---|---|---|---|---|---|---|---|---|---|---|---|
| ma101107_rel.cz11a_bee | 53.194 | 46.806 | 0.012 | ||||||||
| ma101107_rel.cz11a1_bee | 99.944 | 0.056 | 0.014 | ||||||||
| ma101107_rel.cz11b_bee | 53.000 | 47.000 | 0.012 | ||||||||
| ma101107_rel.cz11c_bee | 53.417 | 46.583 | 0.012 | ||||||||
| ma101107_rel.cz11d_bee | 52.944 | 47.056 | 0.012 | ||||||||
| ma101107_rel.cz11d1_bee | 99.972 | 0.028 | 0.015 |
Delete response time histogram: each cell has the percentage of responses that take <= the time in the header and max is the max response time in seconds. For max values in the top 25% of the range have a red background and in the bottom 25% of the range have a green background. The red background is not used when the min value is within 80% of the max value.
| dbms | 256us | 1ms | 4ms | 16ms | 64ms | 256ms | 1s | 4s | 16s | gt | max |
|---|---|---|---|---|---|---|---|---|---|---|---|
| ma101107_rel.cz11a_bee | 53.333 | 46.667 | 0.012 | ||||||||
| ma101107_rel.cz11a1_bee | 100.000 | 0.004 | |||||||||
| ma101107_rel.cz11b_bee | 53.083 | 46.917 | 0.012 | ||||||||
| ma101107_rel.cz11c_bee | 53.417 | 46.583 | 0.012 | ||||||||
| ma101107_rel.cz11d_bee | 53.000 | 47.000 | 0.012 | ||||||||
| ma101107_rel.cz11d1_bee | 99.944 | 0.056 | 0.016 |
Performance metrics for the DBMS listed above. Some are normalized by throughput, others are not. Legend for results is here.
ips	qps	rps	rmbps	wps	wmbps	rpq	rkbpq	wpi	wkbpi	csps	cpups	cspq	cpupq	dbgb1	dbgb2	rss	maxop	p50	p99	tag
100	3729	3	0.0	19.6	0.6	0.001	0.003	0.196	6.478	15342	14.1	4.114	302	6.2	22.0	6.1	0.005	3548	3324	ma101107_rel.cz11a_bee
100	3752	0	0.0	19.6	0.6	0.000	0.000	0.197	6.470	15404	13.9	4.105	296	6.2	11.0	6.0	0.005	3534	3323	ma101107_rel.cz11a1_bee
100	3588	3	0.0	19.9	0.6	0.001	0.004	0.200	6.476	14763	14.3	4.115	319	6.2	22.0	6.1	0.005	3484	3308	ma101107_rel.cz11b_bee
100	3644	3	0.0	25.6	0.8	0.001	0.003	0.257	8.239	14988	14.3	4.114	314	6.1	22.0	6.1	0.005	3500	3324	ma101107_rel.cz11c_bee
100	3720	3	0.0	13.8	0.5	0.001	0.003	0.138	4.716	15277	14.1	4.107	303	6.2	22.0	6.1	0.005	3532	3324	ma101107_rel.cz11d_bee
100	3728	0	0.0	19.6	0.6	0.000	0.000	0.197	6.447	15309	13.7	4.107	294	6.2	11.0	6.0	0.005	3532	3339	ma101107_rel.cz11d1_bee
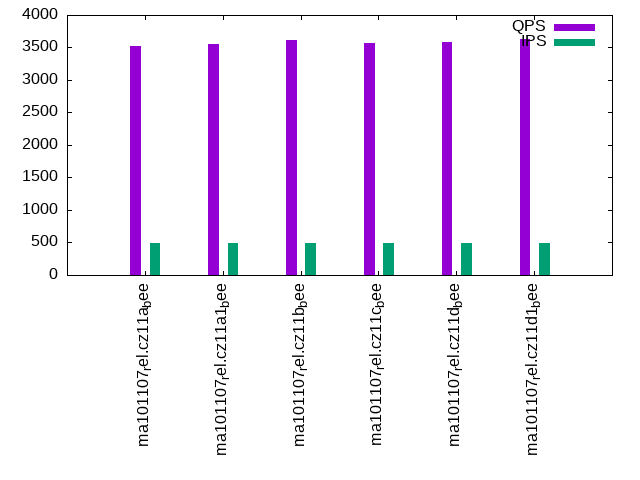
qr500.L3
qr500.L3: range queries with 500 insert/s per client. Graphs for performance per 1-second interval are here.
Average throughput:
Query response time histogram: each cell has the percentage of responses that take <= the time in the header and max is the max response time in seconds. For max values in the top 25% of the range have a red background and in the bottom 25% of the range have a green background. The red background is not used when the min value is within 80% of the max value.
| dbms | 256us | 1ms | 4ms | 16ms | 64ms | 256ms | 1s | 4s | 16s | gt | max |
|---|---|---|---|---|---|---|---|---|---|---|---|
| ma101107_rel.cz11a_bee | 51.804 | 48.195 | 0.001 | nonzero | 0.004 | ||||||
| ma101107_rel.cz11a1_bee | 54.056 | 45.939 | 0.004 | 0.001 | 0.014 | ||||||
| ma101107_rel.cz11b_bee | 57.650 | 42.348 | 0.001 | nonzero | 0.012 | ||||||
| ma101107_rel.cz11c_bee | 55.026 | 44.973 | 0.001 | nonzero | 0.004 | ||||||
| ma101107_rel.cz11d_bee | 55.796 | 44.203 | 0.001 | nonzero | 0.006 | ||||||
| ma101107_rel.cz11d1_bee | 58.370 | 41.625 | 0.004 | 0.001 | nonzero | 0.018 |
Insert response time histogram: each cell has the percentage of responses that take <= the time in the header and max is the max response time in seconds. For max values in the top 25% of the range have a red background and in the bottom 25% of the range have a green background. The red background is not used when the min value is within 80% of the max value.
| dbms | 256us | 1ms | 4ms | 16ms | 64ms | 256ms | 1s | 4s | 16s | gt | max |
|---|---|---|---|---|---|---|---|---|---|---|---|
| ma101107_rel.cz11a_bee | 90.061 | 9.939 | 0.012 | ||||||||
| ma101107_rel.cz11a1_bee | 99.200 | 0.789 | 0.011 | 0.018 | |||||||
| ma101107_rel.cz11b_bee | 90.128 | 9.872 | 0.012 | ||||||||
| ma101107_rel.cz11c_bee | 90.017 | 9.983 | 0.013 | ||||||||
| ma101107_rel.cz11d_bee | 90.106 | 9.894 | 0.012 | ||||||||
| ma101107_rel.cz11d1_bee | 99.283 | 0.689 | 0.028 | 0.025 |
Delete response time histogram: each cell has the percentage of responses that take <= the time in the header and max is the max response time in seconds. For max values in the top 25% of the range have a red background and in the bottom 25% of the range have a green background. The red background is not used when the min value is within 80% of the max value.
| dbms | 256us | 1ms | 4ms | 16ms | 64ms | 256ms | 1s | 4s | 16s | gt | max |
|---|---|---|---|---|---|---|---|---|---|---|---|
| ma101107_rel.cz11a_bee | 90.511 | 9.489 | 0.012 | ||||||||
| ma101107_rel.cz11a1_bee | 99.644 | 0.339 | 0.017 | 0.018 | |||||||
| ma101107_rel.cz11b_bee | 90.550 | 9.450 | 0.012 | ||||||||
| ma101107_rel.cz11c_bee | 90.600 | 9.400 | 0.013 | ||||||||
| ma101107_rel.cz11d_bee | 90.539 | 9.461 | 0.012 | ||||||||
| ma101107_rel.cz11d1_bee | 99.661 | 0.333 | 0.006 | 0.026 |
Performance metrics for the DBMS listed above. Some are normalized by throughput, others are not. Legend for results is here.
ips	qps	rps	rmbps	wps	wmbps	rpq	rkbpq	wpi	wkbpi	csps	cpups	cspq	cpupq	dbgb1	dbgb2	rss	maxop	p50	p99	tag
499	3516	17	0.1	2.6	0.6	0.005	0.020	0.005	1.143	13857	13.7	3.941	312	6.2	22.0	6.1	0.004	3500	3372	ma101107_rel.cz11a_bee
499	3550	0	0.0	189.4	6.0	0.000	0.000	0.380	12.280	14936	13.8	4.207	311	6.2	11.0	6.0	0.014	3516	3356	ma101107_rel.cz11a1_bee
499	3621	17	0.1	7.4	0.7	0.005	0.019	0.015	1.433	14282	13.8	3.944	305	6.2	22.0	6.1	0.012	3595	3452	ma101107_rel.cz11b_bee
499	3568	18	0.1	4.5	0.6	0.005	0.020	0.009	1.260	14070	13.7	3.943	307	6.1	22.0	6.1	0.004	3548	3420	ma101107_rel.cz11c_bee
499	3580	17	0.1	2.6	0.6	0.005	0.019	0.005	1.142	14098	14.0	3.938	313	6.2	22.0	6.1	0.006	3548	3404	ma101107_rel.cz11d_bee
499	3628	0	0.0	178.8	5.7	0.000	0.000	0.358	11.647	15171	14.0	4.181	309	6.2	11.0	6.0	0.018	3597	3422	ma101107_rel.cz11d1_bee
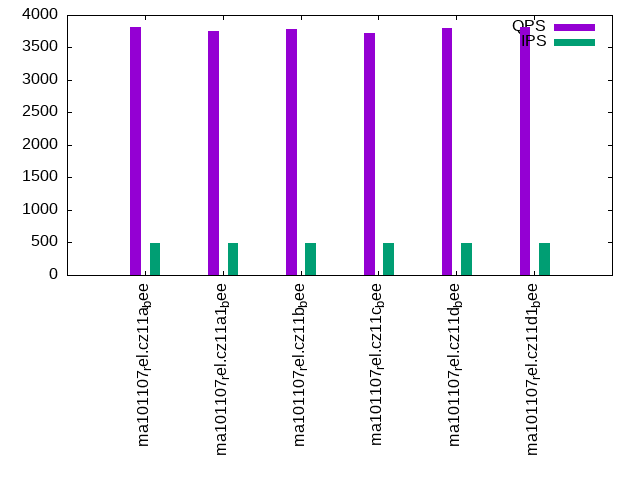
qp500.L4
qp500.L4: point queries with 500 insert/s per client. Graphs for performance per 1-second interval are here.
Average throughput:
Query response time histogram: each cell has the percentage of responses that take <= the time in the header and max is the max response time in seconds. For max values in the top 25% of the range have a red background and in the bottom 25% of the range have a green background. The red background is not used when the min value is within 80% of the max value.
| dbms | 256us | 1ms | 4ms | 16ms | 64ms | 256ms | 1s | 4s | 16s | gt | max |
|---|---|---|---|---|---|---|---|---|---|---|---|
| ma101107_rel.cz11a_bee | 79.062 | 20.937 | 0.002 | nonzero | 0.005 | ||||||
| ma101107_rel.cz11a1_bee | 72.653 | 27.345 | 0.001 | nonzero | 0.006 | ||||||
| ma101107_rel.cz11b_bee | 75.394 | 24.604 | 0.002 | nonzero | 0.009 | ||||||
| ma101107_rel.cz11c_bee | 72.279 | 27.719 | 0.002 | nonzero | nonzero | 0.018 | |||||
| ma101107_rel.cz11d_bee | 75.600 | 24.397 | 0.003 | nonzero | 0.009 | ||||||
| ma101107_rel.cz11d1_bee | 79.665 | 20.334 | 0.002 | nonzero | 0.005 |
Insert response time histogram: each cell has the percentage of responses that take <= the time in the header and max is the max response time in seconds. For max values in the top 25% of the range have a red background and in the bottom 25% of the range have a green background. The red background is not used when the min value is within 80% of the max value.
| dbms | 256us | 1ms | 4ms | 16ms | 64ms | 256ms | 1s | 4s | 16s | gt | max |
|---|---|---|---|---|---|---|---|---|---|---|---|
| ma101107_rel.cz11a_bee | 90.061 | 9.939 | 0.013 | ||||||||
| ma101107_rel.cz11a1_bee | 99.339 | 0.650 | 0.011 | 0.016 | |||||||
| ma101107_rel.cz11b_bee | 90.100 | 9.894 | 0.006 | 0.022 | |||||||
| ma101107_rel.cz11c_bee | 90.017 | 9.950 | 0.033 | 0.030 | |||||||
| ma101107_rel.cz11d_bee | 90.000 | 10.000 | 0.013 | ||||||||
| ma101107_rel.cz11d1_bee | 99.389 | 0.578 | 0.033 | 0.018 |
Delete response time histogram: each cell has the percentage of responses that take <= the time in the header and max is the max response time in seconds. For max values in the top 25% of the range have a red background and in the bottom 25% of the range have a green background. The red background is not used when the min value is within 80% of the max value.
| dbms | 256us | 1ms | 4ms | 16ms | 64ms | 256ms | 1s | 4s | 16s | gt | max |
|---|---|---|---|---|---|---|---|---|---|---|---|
| ma101107_rel.cz11a_bee | 90.472 | 9.528 | 0.012 | ||||||||
| ma101107_rel.cz11a1_bee | 99.689 | 0.300 | 0.011 | 0.016 | |||||||
| ma101107_rel.cz11b_bee | 90.517 | 9.483 | 0.013 | ||||||||
| ma101107_rel.cz11c_bee | 90.456 | 9.533 | 0.011 | 0.020 | |||||||
| ma101107_rel.cz11d_bee | 90.417 | 9.583 | 0.014 | ||||||||
| ma101107_rel.cz11d1_bee | 99.600 | 0.394 | 0.006 | 0.016 |
Performance metrics for the DBMS listed above. Some are normalized by throughput, others are not. Legend for results is here.
ips	qps	rps	rmbps	wps	wmbps	rpq	rkbpq	wpi	wkbpi	csps	cpups	cspq	cpupq	dbgb1	dbgb2	rss	maxop	p50	p99	tag
499	3818	18	0.1	78.6	2.7	0.005	0.018	0.157	5.556	16307	15.6	4.271	327	6.2	22.0	6.1	0.005	3612	3343	ma101107_rel.cz11a_bee
499	3751	0	0.0	181.6	5.8	0.000	0.000	0.364	11.807	16526	15.7	4.406	335	6.2	11.0	6.0	0.006	3579	3324	ma101107_rel.cz11a1_bee
499	3791	18	0.1	79.9	2.7	0.005	0.019	0.160	5.549	16196	15.4	4.272	325	6.2	22.0	6.1	0.009	3580	3340	ma101107_rel.cz11b_bee
499	3724	18	0.1	78.0	2.7	0.005	0.019	0.156	5.555	15838	15.8	4.253	339	6.1	22.0	6.1	0.018	3564	3324	ma101107_rel.cz11c_bee
499	3802	18	0.1	78.8	2.7	0.005	0.018	0.158	5.559	16242	15.5	4.271	326	6.2	22.0	6.1	0.009	3580	3308	ma101107_rel.cz11d_bee
499	3817	0	0.0	181.0	5.7	0.000	0.000	0.363	11.769	16789	15.8	4.398	331	6.2	11.0	6.0	0.005	3612	3355	ma101107_rel.cz11d1_bee
qr1000.L5
qr1000.L5: range queries with 1000 insert/s per client. Graphs for performance per 1-second interval are here.
Average throughput:
Query response time histogram: each cell has the percentage of responses that take <= the time in the header and max is the max response time in seconds. For max values in the top 25% of the range have a red background and in the bottom 25% of the range have a green background. The red background is not used when the min value is within 80% of the max value.
| dbms | 256us | 1ms | 4ms | 16ms | 64ms | 256ms | 1s | 4s | 16s | gt | max |
|---|---|---|---|---|---|---|---|---|---|---|---|
| ma101107_rel.cz11a_bee | 55.299 | 44.696 | 0.005 | 0.001 | 0.007 | ||||||
| ma101107_rel.cz11a1_bee | 53.021 | 46.967 | 0.009 | 0.002 | 0.015 | ||||||
| ma101107_rel.cz11b_bee | 56.042 | 43.953 | 0.003 | 0.002 | 0.013 | ||||||
| ma101107_rel.cz11c_bee | 53.799 | 46.195 | 0.003 | 0.003 | nonzero | 0.038 | |||||
| ma101107_rel.cz11d_bee | 56.328 | 43.668 | 0.003 | 0.001 | 0.011 | ||||||
| ma101107_rel.cz11d1_bee | 56.462 | 43.527 | 0.009 | 0.002 | 0.016 |
Insert response time histogram: each cell has the percentage of responses that take <= the time in the header and max is the max response time in seconds. For max values in the top 25% of the range have a red background and in the bottom 25% of the range have a green background. The red background is not used when the min value is within 80% of the max value.
| dbms | 256us | 1ms | 4ms | 16ms | 64ms | 256ms | 1s | 4s | 16s | gt | max |
|---|---|---|---|---|---|---|---|---|---|---|---|
| ma101107_rel.cz11a_bee | 94.975 | 5.022 | 0.003 | 0.029 | |||||||
| ma101107_rel.cz11a1_bee | 98.961 | 1.006 | 0.033 | 0.037 | |||||||
| ma101107_rel.cz11b_bee | 95.025 | 4.967 | 0.008 | 0.039 | |||||||
| ma101107_rel.cz11c_bee | 94.961 | 5.000 | 0.039 | 0.045 | |||||||
| ma101107_rel.cz11d_bee | 95.019 | 4.978 | 0.003 | 0.028 | |||||||
| ma101107_rel.cz11d1_bee | 98.931 | 1.047 | 0.022 | 0.037 |
Delete response time histogram: each cell has the percentage of responses that take <= the time in the header and max is the max response time in seconds. For max values in the top 25% of the range have a red background and in the bottom 25% of the range have a green background. The red background is not used when the min value is within 80% of the max value.
| dbms | 256us | 1ms | 4ms | 16ms | 64ms | 256ms | 1s | 4s | 16s | gt | max |
|---|---|---|---|---|---|---|---|---|---|---|---|
| ma101107_rel.cz11a_bee | 95.136 | 4.861 | 0.003 | 0.028 | |||||||
| ma101107_rel.cz11a1_bee | 99.478 | 0.497 | 0.025 | 0.035 | |||||||
| ma101107_rel.cz11b_bee | 95.167 | 4.828 | 0.006 | 0.028 | |||||||
| ma101107_rel.cz11c_bee | 95.136 | 4.844 | 0.017 | 0.003 | 0.070 | ||||||
| ma101107_rel.cz11d_bee | 95.119 | 4.878 | 0.003 | 0.028 | |||||||
| ma101107_rel.cz11d1_bee | 99.425 | 0.561 | 0.014 | 0.037 |
Performance metrics for the DBMS listed above. Some are normalized by throughput, others are not. Legend for results is here.
ips	qps	rps	rmbps	wps	wmbps	rpq	rkbpq	wpi	wkbpi	csps	cpups	cspq	cpupq	dbgb1	dbgb2	rss	maxop	p50	p99	tag
998	3574	35	0.1	89.1	3.5	0.010	0.039	0.089	3.581	14887	14.9	4.165	334	6.2	22.0	6.1	0.007	3548	3404	ma101107_rel.cz11a_bee
998	3536	0	0.0	347.9	11.1	0.000	0.000	0.349	11.380	15930	14.8	4.504	335	6.2	11.0	6.0	0.015	3501	3356	ma101107_rel.cz11a1_bee
998	3578	35	0.1	90.6	3.5	0.010	0.039	0.091	3.584	14895	14.8	4.163	331	6.2	22.0	6.1	0.013	3563	3404	ma101107_rel.cz11b_bee
998	3554	35	0.1	86.9	3.5	0.010	0.039	0.087	3.583	14709	14.9	4.139	335	6.1	22.0	6.1	0.038	3532	3356	ma101107_rel.cz11c_bee
998	3597	35	0.1	87.7	3.5	0.010	0.039	0.088	3.552	14953	15.0	4.157	334	6.2	22.0	6.1	0.011	3564	3420	ma101107_rel.cz11d_bee
998	3589	0	0.0	351.7	11.2	0.000	0.000	0.352	11.482	16165	15.0	4.504	334	6.2	11.0	6.0	0.016	3564	3404	ma101107_rel.cz11d1_bee
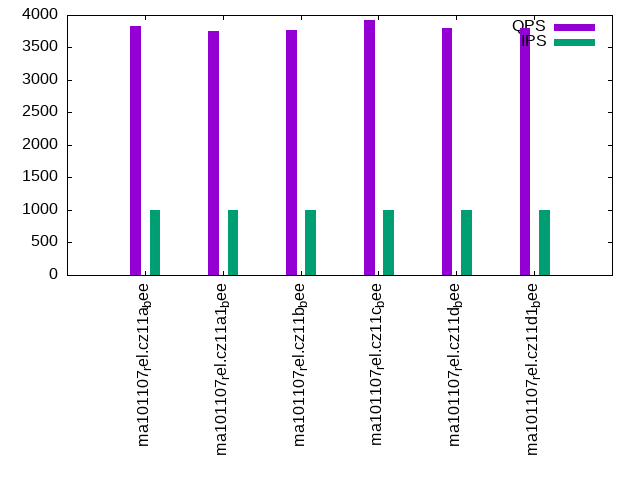
qp1000.L6
qp1000.L6: point queries with 1000 insert/s per client. Graphs for performance per 1-second interval are here.
Average throughput:
Query response time histogram: each cell has the percentage of responses that take <= the time in the header and max is the max response time in seconds. For max values in the top 25% of the range have a red background and in the bottom 25% of the range have a green background. The red background is not used when the min value is within 80% of the max value.
| dbms | 256us | 1ms | 4ms | 16ms | 64ms | 256ms | 1s | 4s | 16s | gt | max |
|---|---|---|---|---|---|---|---|---|---|---|---|
| ma101107_rel.cz11a_bee | 79.122 | 20.876 | 0.002 | nonzero | 0.004 | ||||||
| ma101107_rel.cz11a1_bee | 69.632 | 30.366 | 0.002 | nonzero | 0.010 | ||||||
| ma101107_rel.cz11b_bee | 74.856 | 25.141 | 0.003 | nonzero | 0.011 | ||||||
| ma101107_rel.cz11c_bee | 78.696 | 21.302 | 0.002 | nonzero | 0.004 | ||||||
| ma101107_rel.cz11d_bee | 75.270 | 24.727 | 0.002 | nonzero | 0.005 | ||||||
| ma101107_rel.cz11d1_bee | 75.661 | 24.336 | 0.003 | nonzero | 0.005 |
Insert response time histogram: each cell has the percentage of responses that take <= the time in the header and max is the max response time in seconds. For max values in the top 25% of the range have a red background and in the bottom 25% of the range have a green background. The red background is not used when the min value is within 80% of the max value.
| dbms | 256us | 1ms | 4ms | 16ms | 64ms | 256ms | 1s | 4s | 16s | gt | max |
|---|---|---|---|---|---|---|---|---|---|---|---|
| ma101107_rel.cz11a_bee | 95.039 | 4.956 | 0.006 | 0.028 | |||||||
| ma101107_rel.cz11a1_bee | 99.147 | 0.825 | 0.028 | 0.037 | |||||||
| ma101107_rel.cz11b_bee | 95.011 | 4.983 | 0.006 | 0.039 | |||||||
| ma101107_rel.cz11c_bee | 94.928 | 5.050 | 0.022 | 0.060 | |||||||
| ma101107_rel.cz11d_bee | 95.058 | 4.939 | 0.003 | 0.037 | |||||||
| ma101107_rel.cz11d1_bee | 99.025 | 0.958 | 0.017 | 0.041 |
Delete response time histogram: each cell has the percentage of responses that take <= the time in the header and max is the max response time in seconds. For max values in the top 25% of the range have a red background and in the bottom 25% of the range have a green background. The red background is not used when the min value is within 80% of the max value.
| dbms | 256us | 1ms | 4ms | 16ms | 64ms | 256ms | 1s | 4s | 16s | gt | max |
|---|---|---|---|---|---|---|---|---|---|---|---|
| ma101107_rel.cz11a_bee | 95.194 | 4.806 | 0.012 | ||||||||
| ma101107_rel.cz11a1_bee | 99.525 | 0.453 | 0.022 | 0.037 | |||||||
| ma101107_rel.cz11b_bee | 95.136 | 4.861 | 0.003 | 0.028 | |||||||
| ma101107_rel.cz11c_bee | 95.103 | 4.872 | 0.025 | 0.027 | |||||||
| ma101107_rel.cz11d_bee | 95.169 | 4.828 | 0.003 | 0.026 | |||||||
| ma101107_rel.cz11d1_bee | 99.453 | 0.536 | 0.011 | 0.041 |
Performance metrics for the DBMS listed above. Some are normalized by throughput, others are not. Legend for results is here.
ips	qps	rps	rmbps	wps	wmbps	rpq	rkbpq	wpi	wkbpi	csps	cpups	cspq	cpupq	dbgb1	dbgb2	rss	maxop	p50	p99	tag
998	3824	35	0.1	88.6	3.5	0.009	0.036	0.089	3.566	16846	16.3	4.405	341	6.2	22.0	6.1	0.004	3627	3324	ma101107_rel.cz11a_bee
998	3756	0	0.0	358.3	11.4	0.000	0.000	0.359	11.697	17823	16.5	4.745	351	6.2	11.0	6.0	0.010	3564	3292	ma101107_rel.cz11a1_bee
998	3768	35	0.1	90.0	3.5	0.009	0.037	0.090	3.566	16600	16.5	4.406	350	6.2	22.0	6.1	0.011	3580	3308	ma101107_rel.cz11b_bee
998	3919	34	0.1	86.6	3.5	0.009	0.035	0.087	3.562	17122	16.2	4.369	331	6.1	22.0	6.1	0.004	3724	3324	ma101107_rel.cz11c_bee
998	3807	35	0.1	89.0	3.5	0.009	0.036	0.089	3.573	16754	16.3	4.401	343	6.2	22.0	6.1	0.005	3596	3308	ma101107_rel.cz11d_bee
998	3805	0	0.0	351.9	11.2	0.000	0.000	0.353	11.487	17987	16.5	4.727	347	6.2	11.0	6.0	0.005	3596	3324	ma101107_rel.cz11d1_bee
l.i0
l.i0: load without secondary indexes
Performance metrics for all DBMS, not just the ones listed above. Some are normalized by throughput, others are not. Legend for results is here.
ips	qps	rps	rmbps	wps	wmbps	rpq	rkbpq	wpi	wkbpi	csps	cpups	cspq	cpupq	dbgb1	dbgb2	rss	maxop	p50	p99	tag
83799	0	0	0.0	266.2	21.6	0.000	0.000	0.003	0.264	11299	25.8	0.135	25	2.0	17.8	2.4	0.182	84803	71353	ma101107_rel.cz11a_bee
83565	0	0	0.0	374.7	23.3	0.000	0.000	0.004	0.286	11804	25.7	0.141	25	2.0	6.8	2.3	0.199	84651	69921	ma101107_rel.cz11a1_bee
83565	0	0	0.0	262.2	21.5	0.000	0.000	0.003	0.264	11334	25.9	0.136	25	2.0	17.8	2.4	0.229	84504	70719	ma101107_rel.cz11b_bee
84270	0	0	0.0	54.6	21.5	0.000	0.000	0.001	0.262	11219	26.0	0.133	25	2.0	17.8	2.4	0.251	84902	70520	ma101107_rel.cz11c_bee
83799	0	0	0.0	265.5	21.6	0.000	0.000	0.003	0.263	11312	25.8	0.135	25	2.0	17.8	2.4	0.190	84506	70520	ma101107_rel.cz11d_bee
83565	0	0	0.0	379.3	23.4	0.000	0.000	0.005	0.287	11733	25.7	0.140	25	2.0	6.8	2.3	0.202	84506	70521	ma101107_rel.cz11d1_bee
l.x
l.x: create secondary indexes
Performance metrics for all DBMS, not just the ones listed above. Some are normalized by throughput, others are not. Legend for results is here.
ips	qps	rps	rmbps	wps	wmbps	rpq	rkbpq	wpi	wkbpi	csps	cpups	cspq	cpupq	dbgb1	dbgb2	rss	maxop	p50	p99	tag
130435	0	0	0.0	823.0	111.7	0.000	0.000	0.006	0.877	3016	12.1	0.023	7	4.5	20.3	3.8	0.002	NA	NA	ma101107_rel.cz11a_bee
129870	0	0	0.0	768.9	109.9	0.000	0.000	0.006	0.866	2564	12.0	0.020	7	4.5	9.3	3.8	0.002	NA	NA	ma101107_rel.cz11a1_bee
130435	0	0	0.0	817.1	111.0	0.000	0.000	0.006	0.872	3151	12.1	0.024	7	4.5	20.3	3.8	0.002	NA	NA	ma101107_rel.cz11b_bee
130435	0	0	0.0	272.3	111.0	0.000	0.000	0.002	0.872	3240	12.2	0.025	7	4.5	20.3	3.8	0.002	NA	NA	ma101107_rel.cz11c_bee
130435	0	0	0.0	814.4	110.7	0.000	0.000	0.006	0.869	3054	12.1	0.023	7	4.5	20.3	3.8	0.002	NA	NA	ma101107_rel.cz11d_bee
129870	0	0	0.0	782.2	110.2	0.000	0.000	0.006	0.869	2584	12.0	0.020	7	4.5	9.3	3.8	0.002	NA	NA	ma101107_rel.cz11d1_bee
l.i1
l.i1: continue load after secondary indexes created with 50 inserts per transaction
Performance metrics for all DBMS, not just the ones listed above. Some are normalized by throughput, others are not. Legend for results is here.
ips	qps	rps	rmbps	wps	wmbps	rpq	rkbpq	wpi	wkbpi	csps	cpups	cspq	cpupq	dbgb1	dbgb2	rss	maxop	p50	p99	tag
19066	0	754	2.9	2800.7	102.6	0.040	0.158	0.147	5.511	50067	34.8	2.626	146	6.2	22.0	6.1	0.263	20328	5294	ma101107_rel.cz11a_bee
18459	0	76	0.3	7907.1	251.6	0.004	0.016	0.428	13.955	73400	35.5	3.976	154	6.2	11.0	6.0	0.139	19279	5394	ma101107_rel.cz11a1_bee
17730	0	698	2.7	2643.1	95.4	0.039	0.158	0.149	5.509	46805	32.9	2.640	148	6.2	22.0	6.1	0.235	18430	5294	ma101107_rel.cz11b_bee
17219	0	677	2.6	2422.3	92.4	0.039	0.157	0.141	5.496	42314	32.5	2.457	151	6.1	22.0	6.1	0.314	17281	4897	ma101107_rel.cz11c_bee
19175	0	756	3.0	2809.4	103.0	0.039	0.158	0.147	5.502	50335	34.9	2.625	146	6.2	22.0	6.1	0.117	20427	5294	ma101107_rel.cz11d_bee
18391	0	75	0.3	7898.0	251.3	0.004	0.016	0.429	13.992	73461	35.5	3.994	154	6.2	11.0	6.0	0.136	19229	5244	ma101107_rel.cz11d1_bee
l.i2
l.i2: continue load after secondary indexes created with 5 inserts per transaction
Performance metrics for all DBMS, not just the ones listed above. Some are normalized by throughput, others are not. Legend for results is here.
ips	qps	rps	rmbps	wps	wmbps	rpq	rkbpq	wpi	wkbpi	csps	cpups	cspq	cpupq	dbgb1	dbgb2	rss	maxop	p50	p99	tag
11136	0	1774	6.9	1327.5	50.6	0.159	0.637	0.119	4.652	62221	35.3	5.587	254	6.2	22.0	6.1	0.065	11163	9794	ma101107_rel.cz11a_bee
11111	0	0	0.0	4378.0	140.4	0.000	0.000	0.394	12.939	72944	36.5	6.565	263	6.2	11.0	6.0	0.072	11148	9699	ma101107_rel.cz11a1_bee
10941	0	1744	6.8	1335.0	50.0	0.159	0.638	0.122	4.677	61253	35.0	5.599	256	6.2	22.0	6.1	0.063	11043	9394	ma101107_rel.cz11b_bee
10799	0	1722	6.7	1264.2	49.2	0.159	0.638	0.117	4.668	58906	34.7	5.455	257	6.1	22.0	6.1	0.106	11038	8365	ma101107_rel.cz11c_bee
11198	0	1786	7.0	1355.9	51.5	0.159	0.638	0.121	4.712	62617	35.4	5.592	253	6.2	22.0	6.1	0.063	11223	10149	ma101107_rel.cz11d_bee
11074	0	0	0.0	4360.7	139.8	0.000	0.000	0.394	12.931	72775	36.5	6.572	264	6.2	11.0	6.0	0.073	11133	9594	ma101107_rel.cz11d1_bee
qr100.L1
qr100.L1: range queries with 100 insert/s per client
Performance metrics for all DBMS, not just the ones listed above. Some are normalized by throughput, others are not. Legend for results is here.
ips	qps	rps	rmbps	wps	wmbps	rpq	rkbpq	wpi	wkbpi	csps	cpups	cspq	cpupq	dbgb1	dbgb2	rss	maxop	p50	p99	tag
100	3565	3	0.0	8.0	0.3	0.001	0.004	0.080	2.955	13852	12.8	3.886	287	6.2	22.0	6.1	0.005	3532	3388	ma101107_rel.cz11a_bee
100	3529	0	0.0	8.0	0.3	0.000	0.000	0.080	2.979	13712	12.6	3.886	286	6.2	11.0	6.0	0.014	3515	3372	ma101107_rel.cz11a1_bee
100	3670	3	0.0	8.1	0.3	0.001	0.003	0.082	2.954	14267	12.8	3.888	279	6.2	22.0	6.1	0.012	3627	3452	ma101107_rel.cz11b_bee
100	3599	3	0.0	8.1	0.3	0.001	0.003	0.081	2.963	13976	12.9	3.884	287	6.1	22.0	6.1	0.016	3564	3404	ma101107_rel.cz11c_bee
100	3614	3	0.0	8.0	0.3	0.001	0.004	0.080	2.954	14052	12.9	3.888	286	6.2	22.0	6.1	0.004	3595	3436	ma101107_rel.cz11d_bee
100	3663	0	0.0	8.0	0.3	0.000	0.000	0.080	2.942	14227	12.7	3.883	277	6.2	11.0	6.0	0.013	3628	3452	ma101107_rel.cz11d1_bee
qp100.L2
qp100.L2: point queries with 100 insert/s per client
Performance metrics for all DBMS, not just the ones listed above. Some are normalized by throughput, others are not. Legend for results is here.
ips	qps	rps	rmbps	wps	wmbps	rpq	rkbpq	wpi	wkbpi	csps	cpups	cspq	cpupq	dbgb1	dbgb2	rss	maxop	p50	p99	tag
100	3729	3	0.0	19.6	0.6	0.001	0.003	0.196	6.478	15342	14.1	4.114	302	6.2	22.0	6.1	0.005	3548	3324	ma101107_rel.cz11a_bee
100	3752	0	0.0	19.6	0.6	0.000	0.000	0.197	6.470	15404	13.9	4.105	296	6.2	11.0	6.0	0.005	3534	3323	ma101107_rel.cz11a1_bee
100	3588	3	0.0	19.9	0.6	0.001	0.004	0.200	6.476	14763	14.3	4.115	319	6.2	22.0	6.1	0.005	3484	3308	ma101107_rel.cz11b_bee
100	3644	3	0.0	25.6	0.8	0.001	0.003	0.257	8.239	14988	14.3	4.114	314	6.1	22.0	6.1	0.005	3500	3324	ma101107_rel.cz11c_bee
100	3720	3	0.0	13.8	0.5	0.001	0.003	0.138	4.716	15277	14.1	4.107	303	6.2	22.0	6.1	0.005	3532	3324	ma101107_rel.cz11d_bee
100	3728	0	0.0	19.6	0.6	0.000	0.000	0.197	6.447	15309	13.7	4.107	294	6.2	11.0	6.0	0.005	3532	3339	ma101107_rel.cz11d1_bee
qr500.L3
qr500.L3: range queries with 500 insert/s per client
Performance metrics for all DBMS, not just the ones listed above. Some are normalized by throughput, others are not. Legend for results is here.
ips	qps	rps	rmbps	wps	wmbps	rpq	rkbpq	wpi	wkbpi	csps	cpups	cspq	cpupq	dbgb1	dbgb2	rss	maxop	p50	p99	tag
499	3516	17	0.1	2.6	0.6	0.005	0.020	0.005	1.143	13857	13.7	3.941	312	6.2	22.0	6.1	0.004	3500	3372	ma101107_rel.cz11a_bee
499	3550	0	0.0	189.4	6.0	0.000	0.000	0.380	12.280	14936	13.8	4.207	311	6.2	11.0	6.0	0.014	3516	3356	ma101107_rel.cz11a1_bee
499	3621	17	0.1	7.4	0.7	0.005	0.019	0.015	1.433	14282	13.8	3.944	305	6.2	22.0	6.1	0.012	3595	3452	ma101107_rel.cz11b_bee
499	3568	18	0.1	4.5	0.6	0.005	0.020	0.009	1.260	14070	13.7	3.943	307	6.1	22.0	6.1	0.004	3548	3420	ma101107_rel.cz11c_bee
499	3580	17	0.1	2.6	0.6	0.005	0.019	0.005	1.142	14098	14.0	3.938	313	6.2	22.0	6.1	0.006	3548	3404	ma101107_rel.cz11d_bee
499	3628	0	0.0	178.8	5.7	0.000	0.000	0.358	11.647	15171	14.0	4.181	309	6.2	11.0	6.0	0.018	3597	3422	ma101107_rel.cz11d1_bee
qp500.L4
qp500.L4: point queries with 500 insert/s per client
Performance metrics for all DBMS, not just the ones listed above. Some are normalized by throughput, others are not. Legend for results is here.
ips	qps	rps	rmbps	wps	wmbps	rpq	rkbpq	wpi	wkbpi	csps	cpups	cspq	cpupq	dbgb1	dbgb2	rss	maxop	p50	p99	tag
499	3818	18	0.1	78.6	2.7	0.005	0.018	0.157	5.556	16307	15.6	4.271	327	6.2	22.0	6.1	0.005	3612	3343	ma101107_rel.cz11a_bee
499	3751	0	0.0	181.6	5.8	0.000	0.000	0.364	11.807	16526	15.7	4.406	335	6.2	11.0	6.0	0.006	3579	3324	ma101107_rel.cz11a1_bee
499	3791	18	0.1	79.9	2.7	0.005	0.019	0.160	5.549	16196	15.4	4.272	325	6.2	22.0	6.1	0.009	3580	3340	ma101107_rel.cz11b_bee
499	3724	18	0.1	78.0	2.7	0.005	0.019	0.156	5.555	15838	15.8	4.253	339	6.1	22.0	6.1	0.018	3564	3324	ma101107_rel.cz11c_bee
499	3802	18	0.1	78.8	2.7	0.005	0.018	0.158	5.559	16242	15.5	4.271	326	6.2	22.0	6.1	0.009	3580	3308	ma101107_rel.cz11d_bee
499	3817	0	0.0	181.0	5.7	0.000	0.000	0.363	11.769	16789	15.8	4.398	331	6.2	11.0	6.0	0.005	3612	3355	ma101107_rel.cz11d1_bee
qr1000.L5
qr1000.L5: range queries with 1000 insert/s per client
Performance metrics for all DBMS, not just the ones listed above. Some are normalized by throughput, others are not. Legend for results is here.
ips	qps	rps	rmbps	wps	wmbps	rpq	rkbpq	wpi	wkbpi	csps	cpups	cspq	cpupq	dbgb1	dbgb2	rss	maxop	p50	p99	tag
998	3574	35	0.1	89.1	3.5	0.010	0.039	0.089	3.581	14887	14.9	4.165	334	6.2	22.0	6.1	0.007	3548	3404	ma101107_rel.cz11a_bee
998	3536	0	0.0	347.9	11.1	0.000	0.000	0.349	11.380	15930	14.8	4.504	335	6.2	11.0	6.0	0.015	3501	3356	ma101107_rel.cz11a1_bee
998	3578	35	0.1	90.6	3.5	0.010	0.039	0.091	3.584	14895	14.8	4.163	331	6.2	22.0	6.1	0.013	3563	3404	ma101107_rel.cz11b_bee
998	3554	35	0.1	86.9	3.5	0.010	0.039	0.087	3.583	14709	14.9	4.139	335	6.1	22.0	6.1	0.038	3532	3356	ma101107_rel.cz11c_bee
998	3597	35	0.1	87.7	3.5	0.010	0.039	0.088	3.552	14953	15.0	4.157	334	6.2	22.0	6.1	0.011	3564	3420	ma101107_rel.cz11d_bee
998	3589	0	0.0	351.7	11.2	0.000	0.000	0.352	11.482	16165	15.0	4.504	334	6.2	11.0	6.0	0.016	3564	3404	ma101107_rel.cz11d1_bee
qp1000.L6
qp1000.L6: point queries with 1000 insert/s per client
Performance metrics for all DBMS, not just the ones listed above. Some are normalized by throughput, others are not. Legend for results is here.
ips	qps	rps	rmbps	wps	wmbps	rpq	rkbpq	wpi	wkbpi	csps	cpups	cspq	cpupq	dbgb1	dbgb2	rss	maxop	p50	p99	tag
998	3824	35	0.1	88.6	3.5	0.009	0.036	0.089	3.566	16846	16.3	4.405	341	6.2	22.0	6.1	0.004	3627	3324	ma101107_rel.cz11a_bee
998	3756	0	0.0	358.3	11.4	0.000	0.000	0.359	11.697	17823	16.5	4.745	351	6.2	11.0	6.0	0.010	3564	3292	ma101107_rel.cz11a1_bee
998	3768	35	0.1	90.0	3.5	0.009	0.037	0.090	3.566	16600	16.5	4.406	350	6.2	22.0	6.1	0.011	3580	3308	ma101107_rel.cz11b_bee
998	3919	34	0.1	86.6	3.5	0.009	0.035	0.087	3.562	17122	16.2	4.369	331	6.1	22.0	6.1	0.004	3724	3324	ma101107_rel.cz11c_bee
998	3807	35	0.1	89.0	3.5	0.009	0.036	0.089	3.573	16754	16.3	4.401	343	6.2	22.0	6.1	0.005	3596	3308	ma101107_rel.cz11d_bee
998	3805	0	0.0	351.9	11.2	0.000	0.000	0.353	11.487	17987	16.5	4.727	347	6.2	11.0	6.0	0.005	3596	3324	ma101107_rel.cz11d1_bee
l.i0
- l.i0: load without secondary indexes
- Legend for results is here.
- Each entry lists the percentage of responses that fit in that bucket (slower than max time for previous bucket, faster than min time for next bucket).
Insert response time histogram
256us	1ms	4ms	16ms	64ms	256ms	1s	4s	16s	gt	max	tag
0.000	10.964	88.724	0.197	0.111	0.005	0.000	0.000	0.000	0.000	0.182	ma101107_rel.cz11a_bee
0.000	10.692	88.976	0.206	0.118	0.007	0.000	0.000	0.000	0.000	0.199	ma101107_rel.cz11a1_bee
0.000	9.943	89.744	0.197	0.111	0.005	0.000	0.000	0.000	0.000	0.229	ma101107_rel.cz11b_bee
0.000	12.063	87.625	0.185	0.121	0.005	0.000	0.000	0.000	0.000	0.251	ma101107_rel.cz11c_bee
0.000	10.120	89.568	0.184	0.122	0.005	0.000	0.000	0.000	0.000	0.190	ma101107_rel.cz11d_bee
0.000	11.378	88.292	0.201	0.121	0.007	0.000	0.000	0.000	0.000	0.202	ma101107_rel.cz11d1_bee
l.x
- l.x: create secondary indexes
- Legend for results is here.
- Each entry lists the percentage of responses that fit in that bucket (slower than max time for previous bucket, faster than min time for next bucket).
TODO - determine whether there is data for create index response time
l.i1
- l.i1: continue load after secondary indexes created with 50 inserts per transaction
- Legend for results is here.
- Each entry lists the percentage of responses that fit in that bucket (slower than max time for previous bucket, faster than min time for next bucket).
Insert response time histogram
256us	1ms	4ms	16ms	64ms	256ms	1s	4s	16s	gt	max	tag
0.000	0.000	95.914	4.010	0.075	nonzero	nonzero	0.000	0.000	0.000	0.263	ma101107_rel.cz11a_bee
0.000	0.000	93.481	6.398	0.120	0.001	0.000	0.000	0.000	0.000	0.139	ma101107_rel.cz11a1_bee
0.000	0.000	94.287	5.220	0.489	0.004	0.000	0.000	0.000	0.000	0.235	ma101107_rel.cz11b_bee
0.000	0.000	94.149	5.084	0.751	0.015	nonzero	0.000	0.000	0.000	0.314	ma101107_rel.cz11c_bee
0.000	0.000	95.916	4.012	0.071	nonzero	0.000	0.000	0.000	0.000	0.117	ma101107_rel.cz11d_bee
0.000	0.000	93.264	6.610	0.125	0.001	0.000	0.000	0.000	0.000	0.136	ma101107_rel.cz11d1_bee
Delete response time histogram
256us	1ms	4ms	16ms	64ms	256ms	1s	4s	16s	gt	max	tag
0.000	0.000	97.312	2.649	0.039	nonzero	0.000	0.000	0.000	0.000	0.255	ma101107_rel.cz11a_bee
0.000	0.000	95.029	4.887	0.083	0.001	0.000	0.000	0.000	0.000	0.104	ma101107_rel.cz11a1_bee
0.000	0.000	96.131	3.470	0.396	0.003	0.000	0.000	0.000	0.000	0.234	ma101107_rel.cz11b_bee
0.000	0.000	95.916	3.458	0.613	0.013	nonzero	0.000	0.000	0.000	0.269	ma101107_rel.cz11c_bee
0.000	0.000	97.301	2.656	0.043	0.000	0.000	0.000	0.000	0.000	0.063	ma101107_rel.cz11d_bee
0.000	0.000	94.917	4.995	0.088	0.001	0.000	0.000	0.000	0.000	0.111	ma101107_rel.cz11d1_bee
l.i2
- l.i2: continue load after secondary indexes created with 5 inserts per transaction
- Legend for results is here.
- Each entry lists the percentage of responses that fit in that bucket (slower than max time for previous bucket, faster than min time for next bucket).
Insert response time histogram
256us	1ms	4ms	16ms	64ms	256ms	1s	4s	16s	gt	max	tag
0.384	99.465	0.131	0.021	nonzero	nonzero	0.000	0.000	0.000	0.000	0.065	ma101107_rel.cz11a_bee
0.663	98.875	0.378	0.082	0.002	nonzero	0.000	0.000	0.000	0.000	0.072	ma101107_rel.cz11a1_bee
0.518	99.260	0.117	0.102	0.002	0.000	0.000	0.000	0.000	0.000	0.063	ma101107_rel.cz11b_bee
0.344	99.411	0.113	0.122	0.009	nonzero	0.000	0.000	0.000	0.000	0.106	ma101107_rel.cz11c_bee
0.428	99.415	0.135	0.021	0.001	0.000	0.000	0.000	0.000	0.000	0.063	ma101107_rel.cz11d_bee
0.606	98.930	0.379	0.083	0.002	nonzero	0.000	0.000	0.000	0.000	0.073	ma101107_rel.cz11d1_bee
Delete response time histogram
256us	1ms	4ms	16ms	64ms	256ms	1s	4s	16s	gt	max	tag
3.060	96.786	0.134	0.020	nonzero	nonzero	0.000	0.000	0.000	0.000	0.065	ma101107_rel.cz11a_bee
3.300	96.257	0.365	0.076	0.002	nonzero	0.000	0.000	0.000	0.000	0.072	ma101107_rel.cz11a1_bee
2.748	97.043	0.113	0.094	0.002	0.000	0.000	0.000	0.000	0.000	0.063	ma101107_rel.cz11b_bee
3.082	96.685	0.112	0.113	0.008	nonzero	0.000	0.000	0.000	0.000	0.106	ma101107_rel.cz11c_bee
2.951	96.891	0.137	0.021	0.001	0.000	0.000	0.000	0.000	0.000	0.063	ma101107_rel.cz11d_bee
2.887	96.673	0.364	0.074	0.002	nonzero	0.000	0.000	0.000	0.000	0.072	ma101107_rel.cz11d1_bee
qr100.L1
- qr100.L1: range queries with 100 insert/s per client
- Legend for results is here.
- Each entry lists the percentage of responses that fit in that bucket (slower than max time for previous bucket, faster than min time for next bucket).
Query response time histogram
256us	1ms	4ms	16ms	64ms	256ms	1s	4s	16s	gt	max	tag
54.960	45.040	nonzero	nonzero	0.000	0.000	0.000	0.000	0.000	0.000	0.005	ma101107_rel.cz11a_bee
52.340	47.660	nonzero	nonzero	0.000	0.000	0.000	0.000	0.000	0.000	0.014	ma101107_rel.cz11a1_bee
59.643	40.356	0.001	nonzero	0.000	0.000	0.000	0.000	0.000	0.000	0.012	ma101107_rel.cz11b_bee
56.064	43.935	nonzero	nonzero	nonzero	0.000	0.000	0.000	0.000	0.000	0.016	ma101107_rel.cz11c_bee
57.715	42.284	nonzero	0.000	0.000	0.000	0.000	0.000	0.000	0.000	0.004	ma101107_rel.cz11d_bee
59.825	40.174	0.001	nonzero	0.000	0.000	0.000	0.000	0.000	0.000	0.013	ma101107_rel.cz11d1_bee
Insert response time histogram
256us	1ms	4ms	16ms	64ms	256ms	1s	4s	16s	gt	max	tag
0.000	0.000	53.306	46.667	0.028	0.000	0.000	0.000	0.000	0.000	0.024	ma101107_rel.cz11a_bee
0.000	0.000	99.944	0.028	0.028	0.000	0.000	0.000	0.000	0.000	0.021	ma101107_rel.cz11a1_bee
0.000	0.000	53.194	46.778	0.028	0.000	0.000	0.000	0.000	0.000	0.044	ma101107_rel.cz11b_bee
0.000	0.000	53.028	46.972	0.000	0.000	0.000	0.000	0.000	0.000	0.012	ma101107_rel.cz11c_bee
0.000	0.000	53.278	46.694	0.028	0.000	0.000	0.000	0.000	0.000	0.026	ma101107_rel.cz11d_bee
0.000	0.000	99.917	0.083	0.000	0.000	0.000	0.000	0.000	0.000	0.015	ma101107_rel.cz11d1_bee
Delete response time histogram
256us	1ms	4ms	16ms	64ms	256ms	1s	4s	16s	gt	max	tag
0.000	0.000	53.361	46.639	0.000	0.000	0.000	0.000	0.000	0.000	0.012	ma101107_rel.cz11a_bee
0.000	0.000	99.944	0.056	0.000	0.000	0.000	0.000	0.000	0.000	0.014	ma101107_rel.cz11a1_bee
0.000	0.000	53.222	46.750	0.028	0.000	0.000	0.000	0.000	0.000	0.017	ma101107_rel.cz11b_bee
0.000	0.000	53.028	46.972	0.000	0.000	0.000	0.000	0.000	0.000	0.012	ma101107_rel.cz11c_bee
0.000	0.000	53.278	46.722	0.000	0.000	0.000	0.000	0.000	0.000	0.012	ma101107_rel.cz11d_bee
0.000	0.000	99.972	0.000	0.028	0.000	0.000	0.000	0.000	0.000	0.017	ma101107_rel.cz11d1_bee
qp100.L2
- qp100.L2: point queries with 100 insert/s per client
- Legend for results is here.
- Each entry lists the percentage of responses that fit in that bucket (slower than max time for previous bucket, faster than min time for next bucket).
Query response time histogram
256us	1ms	4ms	16ms	64ms	256ms	1s	4s	16s	gt	max	tag
74.190	25.809	0.002	nonzero	0.000	0.000	0.000	0.000	0.000	0.000	0.005	ma101107_rel.cz11a_bee
70.048	29.951	0.001	nonzero	0.000	0.000	0.000	0.000	0.000	0.000	0.005	ma101107_rel.cz11a1_bee
64.672	35.326	0.002	nonzero	0.000	0.000	0.000	0.000	0.000	0.000	0.005	ma101107_rel.cz11b_bee
65.692	34.307	0.001	nonzero	0.000	0.000	0.000	0.000	0.000	0.000	0.005	ma101107_rel.cz11c_bee
65.846	34.152	0.001	nonzero	0.000	0.000	0.000	0.000	0.000	0.000	0.005	ma101107_rel.cz11d_bee
71.819	28.180	0.001	nonzero	0.000	0.000	0.000	0.000	0.000	0.000	0.005	ma101107_rel.cz11d1_bee
Insert response time histogram
256us	1ms	4ms	16ms	64ms	256ms	1s	4s	16s	gt	max	tag
0.000	0.000	53.194	46.806	0.000	0.000	0.000	0.000	0.000	0.000	0.012	ma101107_rel.cz11a_bee
0.000	0.000	99.944	0.056	0.000	0.000	0.000	0.000	0.000	0.000	0.014	ma101107_rel.cz11a1_bee
0.000	0.000	53.000	47.000	0.000	0.000	0.000	0.000	0.000	0.000	0.012	ma101107_rel.cz11b_bee
0.000	0.000	53.417	46.583	0.000	0.000	0.000	0.000	0.000	0.000	0.012	ma101107_rel.cz11c_bee
0.000	0.000	52.944	47.056	0.000	0.000	0.000	0.000	0.000	0.000	0.012	ma101107_rel.cz11d_bee
0.000	0.000	99.972	0.028	0.000	0.000	0.000	0.000	0.000	0.000	0.015	ma101107_rel.cz11d1_bee
Delete response time histogram
256us	1ms	4ms	16ms	64ms	256ms	1s	4s	16s	gt	max	tag
0.000	0.000	53.333	46.667	0.000	0.000	0.000	0.000	0.000	0.000	0.012	ma101107_rel.cz11a_bee
0.000	0.000	100.000	0.000	0.000	0.000	0.000	0.000	0.000	0.000	0.004	ma101107_rel.cz11a1_bee
0.000	0.000	53.083	46.917	0.000	0.000	0.000	0.000	0.000	0.000	0.012	ma101107_rel.cz11b_bee
0.000	0.000	53.417	46.583	0.000	0.000	0.000	0.000	0.000	0.000	0.012	ma101107_rel.cz11c_bee
0.000	0.000	53.000	47.000	0.000	0.000	0.000	0.000	0.000	0.000	0.012	ma101107_rel.cz11d_bee
0.000	0.000	99.944	0.056	0.000	0.000	0.000	0.000	0.000	0.000	0.016	ma101107_rel.cz11d1_bee
qr500.L3
- qr500.L3: range queries with 500 insert/s per client
- Legend for results is here.
- Each entry lists the percentage of responses that fit in that bucket (slower than max time for previous bucket, faster than min time for next bucket).
Query response time histogram
256us	1ms	4ms	16ms	64ms	256ms	1s	4s	16s	gt	max	tag
51.804	48.195	0.001	nonzero	0.000	0.000	0.000	0.000	0.000	0.000	0.004	ma101107_rel.cz11a_bee
54.056	45.939	0.004	0.001	0.000	0.000	0.000	0.000	0.000	0.000	0.014	ma101107_rel.cz11a1_bee
57.650	42.348	0.001	nonzero	0.000	0.000	0.000	0.000	0.000	0.000	0.012	ma101107_rel.cz11b_bee
55.026	44.973	0.001	nonzero	0.000	0.000	0.000	0.000	0.000	0.000	0.004	ma101107_rel.cz11c_bee
55.796	44.203	0.001	nonzero	0.000	0.000	0.000	0.000	0.000	0.000	0.006	ma101107_rel.cz11d_bee
58.370	41.625	0.004	0.001	nonzero	0.000	0.000	0.000	0.000	0.000	0.018	ma101107_rel.cz11d1_bee
Insert response time histogram
256us	1ms	4ms	16ms	64ms	256ms	1s	4s	16s	gt	max	tag
0.000	0.000	90.061	9.939	0.000	0.000	0.000	0.000	0.000	0.000	0.012	ma101107_rel.cz11a_bee
0.000	0.000	99.200	0.789	0.011	0.000	0.000	0.000	0.000	0.000	0.018	ma101107_rel.cz11a1_bee
0.000	0.000	90.128	9.872	0.000	0.000	0.000	0.000	0.000	0.000	0.012	ma101107_rel.cz11b_bee
0.000	0.000	90.017	9.983	0.000	0.000	0.000	0.000	0.000	0.000	0.013	ma101107_rel.cz11c_bee
0.000	0.000	90.106	9.894	0.000	0.000	0.000	0.000	0.000	0.000	0.012	ma101107_rel.cz11d_bee
0.000	0.000	99.283	0.689	0.028	0.000	0.000	0.000	0.000	0.000	0.025	ma101107_rel.cz11d1_bee
Delete response time histogram
256us	1ms	4ms	16ms	64ms	256ms	1s	4s	16s	gt	max	tag
0.000	0.000	90.511	9.489	0.000	0.000	0.000	0.000	0.000	0.000	0.012	ma101107_rel.cz11a_bee
0.000	0.000	99.644	0.339	0.017	0.000	0.000	0.000	0.000	0.000	0.018	ma101107_rel.cz11a1_bee
0.000	0.000	90.550	9.450	0.000	0.000	0.000	0.000	0.000	0.000	0.012	ma101107_rel.cz11b_bee
0.000	0.000	90.600	9.400	0.000	0.000	0.000	0.000	0.000	0.000	0.013	ma101107_rel.cz11c_bee
0.000	0.000	90.539	9.461	0.000	0.000	0.000	0.000	0.000	0.000	0.012	ma101107_rel.cz11d_bee
0.000	0.000	99.661	0.333	0.006	0.000	0.000	0.000	0.000	0.000	0.026	ma101107_rel.cz11d1_bee
qp500.L4
- qp500.L4: point queries with 500 insert/s per client
- Legend for results is here.
- Each entry lists the percentage of responses that fit in that bucket (slower than max time for previous bucket, faster than min time for next bucket).
Query response time histogram
256us	1ms	4ms	16ms	64ms	256ms	1s	4s	16s	gt	max	tag
79.062	20.937	0.002	nonzero	0.000	0.000	0.000	0.000	0.000	0.000	0.005	ma101107_rel.cz11a_bee
72.653	27.345	0.001	nonzero	0.000	0.000	0.000	0.000	0.000	0.000	0.006	ma101107_rel.cz11a1_bee
75.394	24.604	0.002	nonzero	0.000	0.000	0.000	0.000	0.000	0.000	0.009	ma101107_rel.cz11b_bee
72.279	27.719	0.002	nonzero	nonzero	0.000	0.000	0.000	0.000	0.000	0.018	ma101107_rel.cz11c_bee
75.600	24.397	0.003	nonzero	0.000	0.000	0.000	0.000	0.000	0.000	0.009	ma101107_rel.cz11d_bee
79.665	20.334	0.002	nonzero	0.000	0.000	0.000	0.000	0.000	0.000	0.005	ma101107_rel.cz11d1_bee
Insert response time histogram
256us	1ms	4ms	16ms	64ms	256ms	1s	4s	16s	gt	max	tag
0.000	0.000	90.061	9.939	0.000	0.000	0.000	0.000	0.000	0.000	0.013	ma101107_rel.cz11a_bee
0.000	0.000	99.339	0.650	0.011	0.000	0.000	0.000	0.000	0.000	0.016	ma101107_rel.cz11a1_bee
0.000	0.000	90.100	9.894	0.006	0.000	0.000	0.000	0.000	0.000	0.022	ma101107_rel.cz11b_bee
0.000	0.000	90.017	9.950	0.033	0.000	0.000	0.000	0.000	0.000	0.030	ma101107_rel.cz11c_bee
0.000	0.000	90.000	10.000	0.000	0.000	0.000	0.000	0.000	0.000	0.013	ma101107_rel.cz11d_bee
0.000	0.000	99.389	0.578	0.033	0.000	0.000	0.000	0.000	0.000	0.018	ma101107_rel.cz11d1_bee
Delete response time histogram
256us	1ms	4ms	16ms	64ms	256ms	1s	4s	16s	gt	max	tag
0.000	0.000	90.472	9.528	0.000	0.000	0.000	0.000	0.000	0.000	0.012	ma101107_rel.cz11a_bee
0.000	0.000	99.689	0.300	0.011	0.000	0.000	0.000	0.000	0.000	0.016	ma101107_rel.cz11a1_bee
0.000	0.000	90.517	9.483	0.000	0.000	0.000	0.000	0.000	0.000	0.013	ma101107_rel.cz11b_bee
0.000	0.000	90.456	9.533	0.011	0.000	0.000	0.000	0.000	0.000	0.020	ma101107_rel.cz11c_bee
0.000	0.000	90.417	9.583	0.000	0.000	0.000	0.000	0.000	0.000	0.014	ma101107_rel.cz11d_bee
0.000	0.000	99.600	0.394	0.006	0.000	0.000	0.000	0.000	0.000	0.016	ma101107_rel.cz11d1_bee
qr1000.L5
- qr1000.L5: range queries with 1000 insert/s per client
- Legend for results is here.
- Each entry lists the percentage of responses that fit in that bucket (slower than max time for previous bucket, faster than min time for next bucket).
Query response time histogram
256us	1ms	4ms	16ms	64ms	256ms	1s	4s	16s	gt	max	tag
55.299	44.696	0.005	0.001	0.000	0.000	0.000	0.000	0.000	0.000	0.007	ma101107_rel.cz11a_bee
53.021	46.967	0.009	0.002	0.000	0.000	0.000	0.000	0.000	0.000	0.015	ma101107_rel.cz11a1_bee
56.042	43.953	0.003	0.002	0.000	0.000	0.000	0.000	0.000	0.000	0.013	ma101107_rel.cz11b_bee
53.799	46.195	0.003	0.003	nonzero	0.000	0.000	0.000	0.000	0.000	0.038	ma101107_rel.cz11c_bee
56.328	43.668	0.003	0.001	0.000	0.000	0.000	0.000	0.000	0.000	0.011	ma101107_rel.cz11d_bee
56.462	43.527	0.009	0.002	0.000	0.000	0.000	0.000	0.000	0.000	0.016	ma101107_rel.cz11d1_bee
Insert response time histogram
256us	1ms	4ms	16ms	64ms	256ms	1s	4s	16s	gt	max	tag
0.000	0.000	94.975	5.022	0.003	0.000	0.000	0.000	0.000	0.000	0.029	ma101107_rel.cz11a_bee
0.000	0.000	98.961	1.006	0.033	0.000	0.000	0.000	0.000	0.000	0.037	ma101107_rel.cz11a1_bee
0.000	0.000	95.025	4.967	0.008	0.000	0.000	0.000	0.000	0.000	0.039	ma101107_rel.cz11b_bee
0.000	0.000	94.961	5.000	0.039	0.000	0.000	0.000	0.000	0.000	0.045	ma101107_rel.cz11c_bee
0.000	0.000	95.019	4.978	0.003	0.000	0.000	0.000	0.000	0.000	0.028	ma101107_rel.cz11d_bee
0.000	0.000	98.931	1.047	0.022	0.000	0.000	0.000	0.000	0.000	0.037	ma101107_rel.cz11d1_bee
Delete response time histogram
256us	1ms	4ms	16ms	64ms	256ms	1s	4s	16s	gt	max	tag
0.000	0.000	95.136	4.861	0.003	0.000	0.000	0.000	0.000	0.000	0.028	ma101107_rel.cz11a_bee
0.000	0.000	99.478	0.497	0.025	0.000	0.000	0.000	0.000	0.000	0.035	ma101107_rel.cz11a1_bee
0.000	0.000	95.167	4.828	0.006	0.000	0.000	0.000	0.000	0.000	0.028	ma101107_rel.cz11b_bee
0.000	0.000	95.136	4.844	0.017	0.003	0.000	0.000	0.000	0.000	0.070	ma101107_rel.cz11c_bee
0.000	0.000	95.119	4.878	0.003	0.000	0.000	0.000	0.000	0.000	0.028	ma101107_rel.cz11d_bee
0.000	0.000	99.425	0.561	0.014	0.000	0.000	0.000	0.000	0.000	0.037	ma101107_rel.cz11d1_bee
qp1000.L6
- qp1000.L6: point queries with 1000 insert/s per client
- Legend for results is here.
- Each entry lists the percentage of responses that fit in that bucket (slower than max time for previous bucket, faster than min time for next bucket).
Query response time histogram
256us	1ms	4ms	16ms	64ms	256ms	1s	4s	16s	gt	max	tag
79.122	20.876	0.002	nonzero	0.000	0.000	0.000	0.000	0.000	0.000	0.004	ma101107_rel.cz11a_bee
69.632	30.366	0.002	nonzero	0.000	0.000	0.000	0.000	0.000	0.000	0.010	ma101107_rel.cz11a1_bee
74.856	25.141	0.003	nonzero	0.000	0.000	0.000	0.000	0.000	0.000	0.011	ma101107_rel.cz11b_bee
78.696	21.302	0.002	nonzero	0.000	0.000	0.000	0.000	0.000	0.000	0.004	ma101107_rel.cz11c_bee
75.270	24.727	0.002	nonzero	0.000	0.000	0.000	0.000	0.000	0.000	0.005	ma101107_rel.cz11d_bee
75.661	24.336	0.003	nonzero	0.000	0.000	0.000	0.000	0.000	0.000	0.005	ma101107_rel.cz11d1_bee
Insert response time histogram
256us	1ms	4ms	16ms	64ms	256ms	1s	4s	16s	gt	max	tag
0.000	0.000	95.039	4.956	0.006	0.000	0.000	0.000	0.000	0.000	0.028	ma101107_rel.cz11a_bee
0.000	0.000	99.147	0.825	0.028	0.000	0.000	0.000	0.000	0.000	0.037	ma101107_rel.cz11a1_bee
0.000	0.000	95.011	4.983	0.006	0.000	0.000	0.000	0.000	0.000	0.039	ma101107_rel.cz11b_bee
0.000	0.000	94.928	5.050	0.022	0.000	0.000	0.000	0.000	0.000	0.060	ma101107_rel.cz11c_bee
0.000	0.000	95.058	4.939	0.003	0.000	0.000	0.000	0.000	0.000	0.037	ma101107_rel.cz11d_bee
0.000	0.000	99.025	0.958	0.017	0.000	0.000	0.000	0.000	0.000	0.041	ma101107_rel.cz11d1_bee
Delete response time histogram
256us	1ms	4ms	16ms	64ms	256ms	1s	4s	16s	gt	max	tag
0.000	0.000	95.194	4.806	0.000	0.000	0.000	0.000	0.000	0.000	0.012	ma101107_rel.cz11a_bee
0.000	0.000	99.525	0.453	0.022	0.000	0.000	0.000	0.000	0.000	0.037	ma101107_rel.cz11a1_bee
0.000	0.000	95.136	4.861	0.003	0.000	0.000	0.000	0.000	0.000	0.028	ma101107_rel.cz11b_bee
0.000	0.000	95.103	4.872	0.025	0.000	0.000	0.000	0.000	0.000	0.027	ma101107_rel.cz11c_bee
0.000	0.000	95.169	4.828	0.003	0.000	0.000	0.000	0.000	0.000	0.026	ma101107_rel.cz11d_bee
0.000	0.000	99.453	0.536	0.011	0.000	0.000	0.000	0.000	0.000	0.041	ma101107_rel.cz11d1_bee