Introduction
This is a report for the insert benchmark with 800M docs and 1 client(s). It is generated by scripts (bash, awk, sed) and Tufte might not be impressed. An overview of the insert benchmark is here and a short update is here. Below, by DBMS, I mean DBMS+version.config. An example is my8020.c10b40 where my means MySQL, 8020 is version 8.0.20 and c10b40 is the name for the configuration file.
The test server has 8 AMD cores, 32G RAM and an NVMe SSD. It is described here as the SER7 The benchmark was run with 1 client and there were 1 or 3 connections per client (1 for queries or inserts without rate limits, 1+1 for rate limited inserts+deletes). It uses 1 table. It loads 800M rows per table without secondary indexes, creates 3 secondary indexes per table, then inserts 4m+1m rows per table with a delete per insert to avoid growing the table. It then does 6 read+write tests for 1800s each that do queries as fast as possible with 100,100,500,500,1000,1000 inserts/s and the same for deletes/s per client concurrent with the queries. The database is larger than memory. Clients and the DBMS share one server. The per-database configs are in the per-database subdirectories here.
The tested DBMS are:
- pg162_def.cx9a2_ser7 - Postgres 16.2, cx9a2 config
- pg162_def.cx9a2a_ser7 - Postgres 16.2, cx9a2a config that adds autovacuum_vacuum_cost_delay= 1ms
- pg162_def.cx9a2b_ser7 - Postgres 16.2, cx9a2b config that adds autovacuum_vacuum_cost_delay=0
- pg162_def.cx9a2c_ser7 - Postgres 16.2, cx9a2c config that adds autovacuum_naptime=1s
- pg162_def.cx9a2e_ser7 - Postgres 16.2, cx9a2e config that adds autovacuum_vacuum_scale_factor=0.01
- pg162_def.cx9a2f_ser7 - Postgres 16.2, cx9a2f config that adds autovacuum_vacuum_insert_scale_factor=0.01
- pg162_def.cx9a2g_ser7 - Postgres 16.2, cx9a2g config that adds autovacuum_vacuum_cost_limit=8000
Contents
- Summary
- l.i0: load without secondary indexes
- l.x: create secondary indexes
- l.i1: continue load after secondary indexes created with 50 inserts per transaction
- l.i2: continue load after secondary indexes created with 5 inserts per transaction
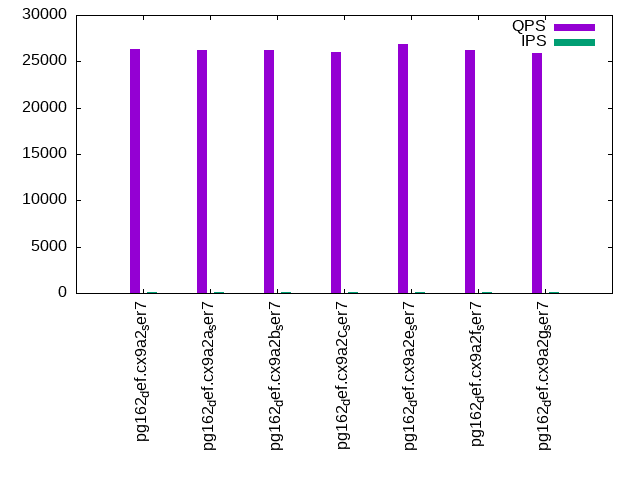
- qr100.L1: range queries with 100 insert/s per client
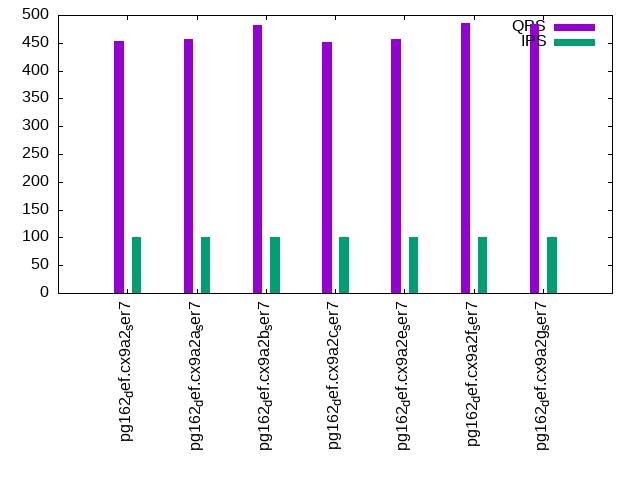
- qp100.L2: point queries with 100 insert/s per client
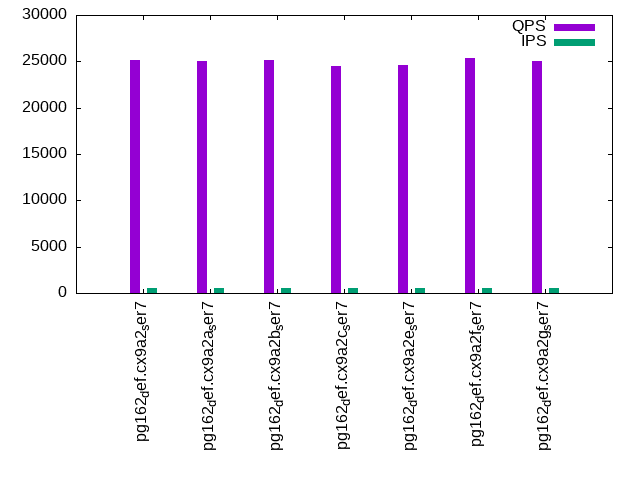
- qr500.L3: range queries with 500 insert/s per client
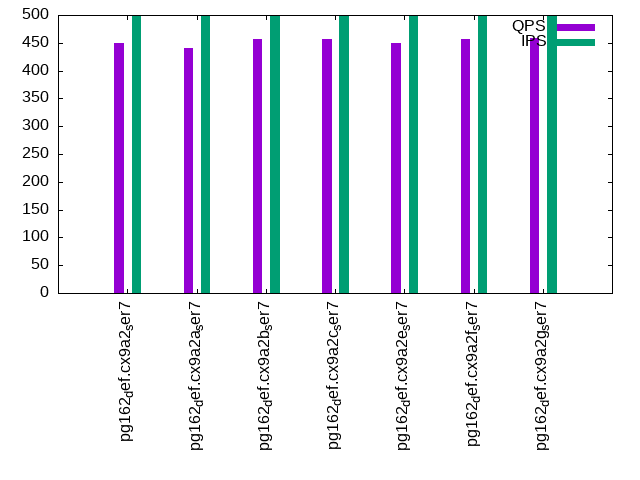
- qp500.L4: point queries with 500 insert/s per client
- qr1000.L5: range queries with 1000 insert/s per client
- qp1000.L6: point queries with 1000 insert/s per client
Summary
The numbers are inserts/s for l.i0, l.i1 and l.i2, indexed docs (or rows) /s for l.x and queries/s for qr100, qp100 thru qr1000, qp1000" The values are the average rate over the entire test for inserts (IPS) and queries (QPS). The range of values for IPS and QPS is split into 3 parts: bottom 25%, middle 50%, top 25%. Values in the bottom 25% have a red background, values in the top 25% have a green background and values in the middle have no color. A gray background is used for values that can be ignored because the DBMS did not sustain the target insert rate. Red backgrounds are not used when the minimum value is within 80% of the max value.
| dbms | l.i0 | l.x | l.i1 | l.i2 | qr100 | qp100 | qr500 | qp500 | qr1000 | qp1000 |
|---|---|---|---|---|---|---|---|---|---|---|
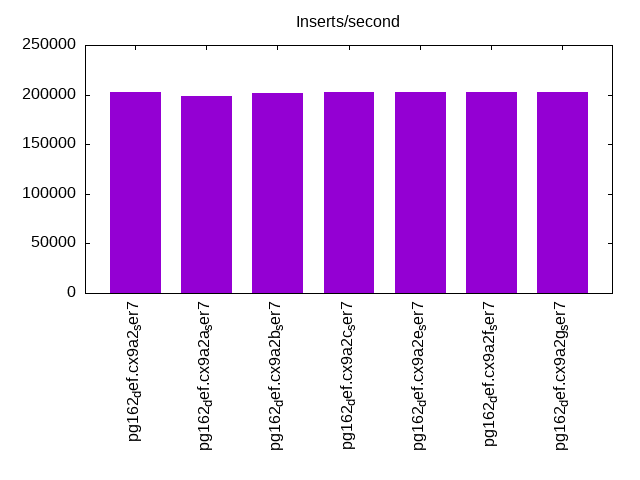
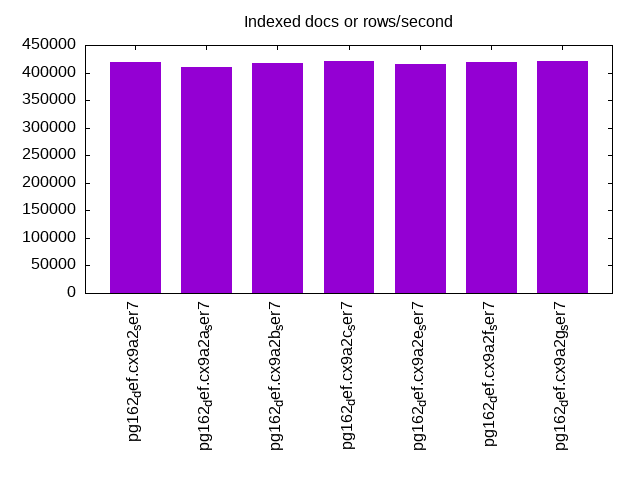
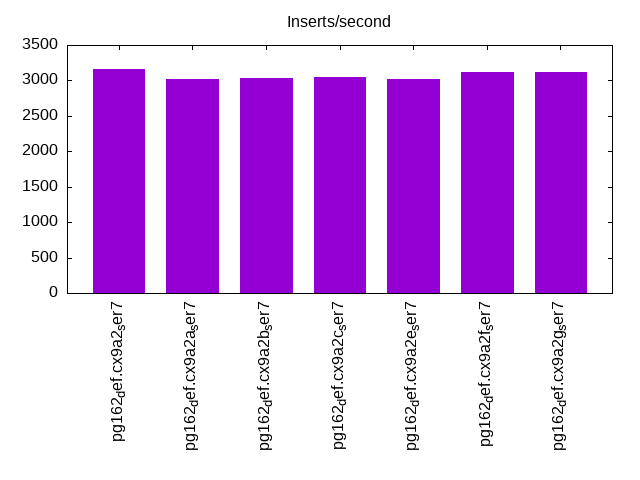
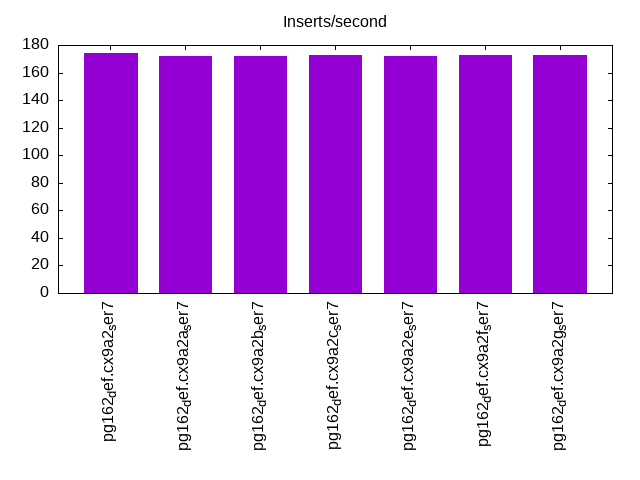
| pg162_def.cx9a2_ser7 | 202994 | 419068 | 3162 | 174 | 26367 | 454 | 25170 | 450 | 22184 | 404 |
| pg162_def.cx9a2a_ser7 | 198758 | 409836 | 3021 | 172 | 26274 | 456 | 24985 | 440 | 21823 | 419 |
| pg162_def.cx9a2b_ser7 | 201765 | 417536 | 3040 | 172 | 26255 | 482 | 25092 | 457 | 22919 | 407 |
| pg162_def.cx9a2c_ser7 | 202737 | 420389 | 3051 | 173 | 25995 | 452 | 24488 | 456 | 22170 | 419 |
| pg162_def.cx9a2e_ser7 | 202122 | 415584 | 3021 | 172 | 26924 | 456 | 24651 | 449 | 22277 | 417 |
| pg162_def.cx9a2f_ser7 | 202891 | 419948 | 3120 | 173 | 26259 | 485 | 25322 | 457 | 22706 | 418 |
| pg162_def.cx9a2g_ser7 | 202686 | 420610 | 3120 | 173 | 25926 | 483 | 25008 | 458 | 22703 | 417 |
This table has relative throughput, throughput for the DBMS relative to the DBMS in the first line, using the absolute throughput from the previous table. Values less than 0.95 have a yellow background. Values greater than 1.05 have a blue background.
| dbms | l.i0 | l.x | l.i1 | l.i2 | qr100 | qp100 | qr500 | qp500 | qr1000 | qp1000 |
|---|---|---|---|---|---|---|---|---|---|---|
| pg162_def.cx9a2_ser7 | 1.00 | 1.00 | 1.00 | 1.00 | 1.00 | 1.00 | 1.00 | 1.00 | 1.00 | 1.00 |
| pg162_def.cx9a2a_ser7 | 0.98 | 0.98 | 0.96 | 0.99 | 1.00 | 1.00 | 0.99 | 0.98 | 0.98 | 1.04 |
| pg162_def.cx9a2b_ser7 | 0.99 | 1.00 | 0.96 | 0.99 | 1.00 | 1.06 | 1.00 | 1.02 | 1.03 | 1.01 |
| pg162_def.cx9a2c_ser7 | 1.00 | 1.00 | 0.96 | 0.99 | 0.99 | 1.00 | 0.97 | 1.01 | 1.00 | 1.04 |
| pg162_def.cx9a2e_ser7 | 1.00 | 0.99 | 0.96 | 0.99 | 1.02 | 1.00 | 0.98 | 1.00 | 1.00 | 1.03 |
| pg162_def.cx9a2f_ser7 | 1.00 | 1.00 | 0.99 | 0.99 | 1.00 | 1.07 | 1.01 | 1.02 | 1.02 | 1.03 |
| pg162_def.cx9a2g_ser7 | 1.00 | 1.00 | 0.99 | 0.99 | 0.98 | 1.06 | 0.99 | 1.02 | 1.02 | 1.03 |
This lists the average rate of inserts/s for the tests that do inserts concurrent with queries. For such tests the query rate is listed in the table above. The read+write tests are setup so that the insert rate should match the target rate every second. Cells that are not at least 95% of the target have a red background to indicate a failure to satisfy the target.
| dbms | qr100.L1 | qp100.L2 | qr500.L3 | qp500.L4 | qr1000.L5 | qp1000.L6 |
|---|---|---|---|---|---|---|
| pg162_def.cx9a2_ser7 | 100 | 100 | 499 | 499 | 982 | 998 |
| pg162_def.cx9a2a_ser7 | 100 | 100 | 499 | 499 | 992 | 999 |
| pg162_def.cx9a2b_ser7 | 100 | 100 | 499 | 499 | 998 | 998 |
| pg162_def.cx9a2c_ser7 | 100 | 100 | 499 | 499 | 998 | 998 |
| pg162_def.cx9a2e_ser7 | 100 | 100 | 499 | 499 | 989 | 999 |
| pg162_def.cx9a2f_ser7 | 100 | 100 | 499 | 499 | 998 | 999 |
| pg162_def.cx9a2g_ser7 | 100 | 100 | 499 | 499 | 998 | 999 |
| target | 100 | 100 | 500 | 500 | 1000 | 1000 |
l.i0
l.i0: load without secondary indexes. Graphs for performance per 1-second interval are here.
Average throughput:
Insert response time histogram: each cell has the percentage of responses that take <= the time in the header and max is the max response time in seconds. For the max column values in the top 25% of the range have a red background and in the bottom 25% of the range have a green background. The red background is not used when the min value is within 80% of the max value.
| dbms | 256us | 1ms | 4ms | 16ms | 64ms | 256ms | 1s | 4s | 16s | gt | max |
|---|---|---|---|---|---|---|---|---|---|---|---|
| pg162_def.cx9a2_ser7 | 99.969 | 0.028 | 0.002 | 0.001 | nonzero | 0.097 | |||||
| pg162_def.cx9a2a_ser7 | 99.942 | 0.052 | 0.003 | 0.002 | nonzero | 0.143 | |||||
| pg162_def.cx9a2b_ser7 | 99.942 | 0.052 | 0.003 | 0.003 | nonzero | 0.133 | |||||
| pg162_def.cx9a2c_ser7 | 99.947 | 0.049 | 0.002 | 0.002 | nonzero | 0.134 | |||||
| pg162_def.cx9a2e_ser7 | 99.925 | 0.069 | 0.003 | 0.003 | nonzero | 0.115 | |||||
| pg162_def.cx9a2f_ser7 | 99.979 | 0.020 | 0.001 | 0.001 | 0.064 | ||||||
| pg162_def.cx9a2g_ser7 | 99.957 | 0.037 | 0.003 | 0.002 | nonzero | 0.096 |
Performance metrics for the DBMS listed above. Some are normalized by throughput, others are not. Legend for results is here.
ips	qps	rps	rmbps	wps	wmbps	rpq	rkbpq	wpi	wkbpi	csps	cpups	cspq	cpupq	dbgb1	dbgb2	rss	maxop	p50	p99	tag
202994	0	34	0.3	289.0	83.5	0.000	0.001	0.001	0.421	24432	11.4	0.120	4	76.5	116.6	18.4	0.097	201956	191689	pg162_def.cx9a2_ser7
198758	0	36	0.3	278.4	81.8	0.000	0.001	0.001	0.421	23534	11.4	0.118	5	76.5	116.6	18.6	0.143	197376	188290	pg162_def.cx9a2a_ser7
201765	0	37	0.3	285.6	83.0	0.000	0.001	0.001	0.421	23817	11.4	0.118	5	76.5	116.6	18.9	0.133	200639	188785	pg162_def.cx9a2b_ser7
202737	0	36	0.3	291.9	83.2	0.000	0.001	0.001	0.420	23985	11.7	0.118	5	76.5	116.6	2.0	0.134	201581	191685	pg162_def.cx9a2c_ser7
202122	0	35	0.3	289.2	83.8	0.000	0.001	0.001	0.424	23693	11.5	0.117	5	76.5	116.6	0.9	0.115	200983	191086	pg162_def.cx9a2e_ser7
202891	0	33	0.3	285.2	82.5	0.000	0.001	0.001	0.416	23934	11.5	0.118	5	76.5	116.6	18.6	0.064	201175	191589	pg162_def.cx9a2f_ser7
202686	0	38	0.3	286.5	83.4	0.000	0.002	0.001	0.422	24168	11.4	0.119	4	76.5	116.6	20.0	0.096	201482	191896	pg162_def.cx9a2g_ser7
l.x
l.x: create secondary indexes.
Average throughput:
Performance metrics for the DBMS listed above. Some are normalized by throughput, others are not. Legend for results is here.
ips	qps	rps	rmbps	wps	wmbps	rpq	rkbpq	wpi	wkbpi	csps	cpups	cspq	cpupq	dbgb1	dbgb2	rss	maxop	p50	p99	tag
419068	0	1491	141.4	411.7	157.4	0.004	0.345	0.001	0.385	1541	6.4	0.004	1	153.6	193.7	22.0	0.003	NA	NA	pg162_def.cx9a2_ser7
409836	0	1450	138.2	404.1	154.7	0.004	0.345	0.001	0.387	1501	6.3	0.004	1	153.6	193.7	22.7	0.005	NA	NA	pg162_def.cx9a2a_ser7
417536	0	1472	140.8	413.7	156.9	0.004	0.345	0.001	0.385	1533	6.4	0.004	1	153.6	193.7	21.9	0.008	NA	NA	pg162_def.cx9a2b_ser7
420389	0	1489	141.7	412.5	157.6	0.004	0.345	0.001	0.384	1610	6.5	0.004	1	153.6	193.7	22.8	0.005	NA	NA	pg162_def.cx9a2c_ser7
415584	0	1468	140.1	404.8	155.2	0.004	0.345	0.001	0.382	1498	6.4	0.004	1	153.6	193.7	21.7	0.006	NA	NA	pg162_def.cx9a2e_ser7
419948	0	1478	141.6	411.1	157.6	0.004	0.345	0.001	0.384	1512	6.4	0.004	1	153.6	193.7	22.3	0.006	NA	NA	pg162_def.cx9a2f_ser7
420610	0	1486	141.9	413.1	158.1	0.004	0.345	0.001	0.385	1543	6.4	0.004	1	153.6	193.7	22.6	0.005	NA	NA	pg162_def.cx9a2g_ser7
l.i1
l.i1: continue load after secondary indexes created with 50 inserts per transaction. Graphs for performance per 1-second interval are here.
Average throughput:
Insert response time histogram: each cell has the percentage of responses that take <= the time in the header and max is the max response time in seconds. For the max column values in the top 25% of the range have a red background and in the bottom 25% of the range have a green background. The red background is not used when the min value is within 80% of the max value.
| dbms | 256us | 1ms | 4ms | 16ms | 64ms | 256ms | 1s | 4s | 16s | gt | max |
|---|---|---|---|---|---|---|---|---|---|---|---|
| pg162_def.cx9a2_ser7 | 92.570 | 7.053 | 0.376 | 0.001 | 0.328 | ||||||
| pg162_def.cx9a2a_ser7 | 88.314 | 11.271 | 0.414 | 0.001 | 0.280 | ||||||
| pg162_def.cx9a2b_ser7 | 93.528 | 6.058 | 0.409 | 0.006 | 0.367 | ||||||
| pg162_def.cx9a2c_ser7 | 92.183 | 7.462 | 0.354 | 0.001 | 0.258 | ||||||
| pg162_def.cx9a2e_ser7 | 90.991 | 8.616 | 0.392 | 0.193 | |||||||
| pg162_def.cx9a2f_ser7 | 94.883 | 5.100 | 0.017 | 0.116 | |||||||
| pg162_def.cx9a2g_ser7 | 95.055 | 4.936 | 0.009 | 0.120 |
Delete response time histogram: each cell has the percentage of responses that take <= the time in the header and max is the max response time in seconds. For the max column values in the top 25% of the range have a red background and in the bottom 25% of the range have a green background. The red background is not used when the min value is within 80% of the max value.
| dbms | 256us | 1ms | 4ms | 16ms | 64ms | 256ms | 1s | 4s | 16s | gt | max |
|---|---|---|---|---|---|---|---|---|---|---|---|
| pg162_def.cx9a2_ser7 | 0.001 | 1.219 | 10.904 | 49.655 | 38.221 | 0.040 | |||||
| pg162_def.cx9a2a_ser7 | 0.006 | 1.354 | 10.203 | 52.163 | 36.275 | 0.037 | |||||
| pg162_def.cx9a2b_ser7 | 0.004 | 1.278 | 12.568 | 49.119 | 37.032 | 0.038 | |||||
| pg162_def.cx9a2c_ser7 | 0.004 | 1.320 | 10.464 | 51.614 | 36.599 | 0.052 | |||||
| pg162_def.cx9a2e_ser7 | 0.004 | 1.239 | 10.505 | 51.515 | 36.737 | 0.039 | |||||
| pg162_def.cx9a2f_ser7 | 0.004 | 1.862 | 10.046 | 52.036 | 36.051 | 0.030 | |||||
| pg162_def.cx9a2g_ser7 | 0.004 | 1.275 | 10.600 | 52.431 | 35.690 | 0.043 |
Performance metrics for the DBMS listed above. Some are normalized by throughput, others are not. Legend for results is here.
ips	qps	rps	rmbps	wps	wmbps	rpq	rkbpq	wpi	wkbpi	csps	cpups	cspq	cpupq	dbgb1	dbgb2	rss	maxop	p50	p99	tag
3162	0	4543	36.2	3514.4	63.8	1.437	11.729	1.111	20.667	11422	7.6	3.612	192	154.3	194.3	20.0	0.328	2798	649	pg162_def.cx9a2_ser7
3021	0	4352	34.7	3421.5	62.1	1.441	11.761	1.133	21.050	11117	7.4	3.680	196	154.3	194.3	14.3	0.280	2997	649	pg162_def.cx9a2a_ser7
3040	0	4371	34.8	3409.8	61.7	1.438	11.736	1.122	20.792	11115	7.3	3.657	192	154.3	194.3	19.4	0.367	3046	549	pg162_def.cx9a2b_ser7
3051	0	4388	35.0	3436.1	62.3	1.438	11.732	1.126	20.914	11244	7.6	3.685	199	154.3	194.3	19.9	0.258	3047	649	pg162_def.cx9a2c_ser7
3021	0	4349	34.6	3370.0	60.9	1.440	11.744	1.115	20.634	11115	7.3	3.679	193	154.3	194.3	20.6	0.193	3000	649	pg162_def.cx9a2e_ser7
3120	0	4513	36.0	3593.4	65.2	1.447	11.807	1.152	21.395	11455	7.6	3.671	195	154.3	194.3	14.2	0.116	3097	1897	pg162_def.cx9a2f_ser7
3120	0	4488	35.6	3554.0	69.1	1.438	11.683	1.139	22.674	11485	7.8	3.681	200	154.3	194.3	16.6	0.120	3097	1897	pg162_def.cx9a2g_ser7
l.i2
l.i2: continue load after secondary indexes created with 5 inserts per transaction. Graphs for performance per 1-second interval are here.
Average throughput:
Insert response time histogram: each cell has the percentage of responses that take <= the time in the header and max is the max response time in seconds. For the max column values in the top 25% of the range have a red background and in the bottom 25% of the range have a green background. The red background is not used when the min value is within 80% of the max value.
| dbms | 256us | 1ms | 4ms | 16ms | 64ms | 256ms | 1s | 4s | 16s | gt | max |
|---|---|---|---|---|---|---|---|---|---|---|---|
| pg162_def.cx9a2_ser7 | 1.966 | 93.493 | 4.449 | 0.091 | 0.001 | 0.085 | |||||
| pg162_def.cx9a2a_ser7 | 1.125 | 94.269 | 4.535 | 0.072 | 0.001 | 0.080 | |||||
| pg162_def.cx9a2b_ser7 | 0.953 | 94.582 | 4.388 | 0.076 | 0.001 | 0.092 | |||||
| pg162_def.cx9a2c_ser7 | 1.004 | 95.304 | 3.656 | 0.034 | 0.001 | 0.127 | |||||
| pg162_def.cx9a2e_ser7 | 1.372 | 95.374 | 3.226 | 0.025 | 0.003 | 0.127 | |||||
| pg162_def.cx9a2f_ser7 | 1.065 | 96.141 | 2.779 | 0.014 | 0.002 | 0.073 | |||||
| pg162_def.cx9a2g_ser7 | 1.295 | 95.868 | 2.825 | 0.011 | 0.001 | 0.110 |
Delete response time histogram: each cell has the percentage of responses that take <= the time in the header and max is the max response time in seconds. For the max column values in the top 25% of the range have a red background and in the bottom 25% of the range have a green background. The red background is not used when the min value is within 80% of the max value.
| dbms | 256us | 1ms | 4ms | 16ms | 64ms | 256ms | 1s | 4s | 16s | gt | max |
|---|---|---|---|---|---|---|---|---|---|---|---|
| pg162_def.cx9a2_ser7 | 99.999 | 0.001 | 0.092 | ||||||||
| pg162_def.cx9a2a_ser7 | 99.999 | 0.001 | 0.090 | ||||||||
| pg162_def.cx9a2b_ser7 | 99.999 | 0.001 | 0.091 | ||||||||
| pg162_def.cx9a2c_ser7 | 99.999 | 0.001 | 0.091 | ||||||||
| pg162_def.cx9a2e_ser7 | 99.999 | 0.001 | 0.091 | ||||||||
| pg162_def.cx9a2f_ser7 | 99.999 | 0.001 | 0.091 | ||||||||
| pg162_def.cx9a2g_ser7 | 99.999 | 0.001 | 0.089 |
Performance metrics for the DBMS listed above. Some are normalized by throughput, others are not. Legend for results is here.
ips	qps	rps	rmbps	wps	wmbps	rpq	rkbpq	wpi	wkbpi	csps	cpups	cspq	cpupq	dbgb1	dbgb2	rss	maxop	p50	p99	tag
174	0	186	1.5	487.9	7.0	1.072	8.744	2.810	41.143	1484	5.9	8.550	2719	154.4	194.5	22.0	0.085	175	155	pg162_def.cx9a2_ser7
172	0	185	1.5	481.3	6.9	1.075	8.770	2.795	41.061	1496	5.9	8.688	2741	154.4	194.5	22.0	0.080	170	155	pg162_def.cx9a2a_ser7
172	0	185	1.5	484.6	6.9	1.073	8.750	2.809	41.256	1493	5.9	8.656	2736	154.4	194.5	22.1	0.092	170	155	pg162_def.cx9a2b_ser7
173	0	186	1.5	485.1	7.0	1.073	8.751	2.799	41.070	1603	6.4	9.251	2954	154.4	194.5	21.9	0.127	170	155	pg162_def.cx9a2c_ser7
172	0	185	1.5	486.5	7.0	1.072	8.748	2.822	41.502	1483	5.9	8.605	2738	154.4	194.5	22.1	0.127	170	155	pg162_def.cx9a2e_ser7
173	0	186	1.5	472.6	6.8	1.072	8.743	2.730	40.193	1501	5.9	8.671	2727	154.4	194.4	13.8	0.073	175	155	pg162_def.cx9a2f_ser7
173	0	185	1.5	484.5	7.1	1.073	8.755	2.804	41.909	1427	6.0	8.261	2778	154.4	192.1	20.6	0.110	170	155	pg162_def.cx9a2g_ser7
qr100.L1
qr100.L1: range queries with 100 insert/s per client. Graphs for performance per 1-second interval are here.
Average throughput:
Query response time histogram: each cell has the percentage of responses that take <= the time in the header and max is the max response time in seconds. For max values in the top 25% of the range have a red background and in the bottom 25% of the range have a green background. The red background is not used when the min value is within 80% of the max value.
| dbms | 256us | 1ms | 4ms | 16ms | 64ms | 256ms | 1s | 4s | 16s | gt | max |
|---|---|---|---|---|---|---|---|---|---|---|---|
| pg162_def.cx9a2_ser7 | 99.993 | 0.007 | nonzero | nonzero | 0.010 | ||||||
| pg162_def.cx9a2a_ser7 | 99.991 | 0.008 | nonzero | nonzero | 0.010 | ||||||
| pg162_def.cx9a2b_ser7 | 99.992 | 0.008 | nonzero | nonzero | 0.010 | ||||||
| pg162_def.cx9a2c_ser7 | 99.992 | 0.007 | nonzero | nonzero | 0.010 | ||||||
| pg162_def.cx9a2e_ser7 | 99.992 | 0.008 | nonzero | nonzero | 0.010 | ||||||
| pg162_def.cx9a2f_ser7 | 99.992 | 0.008 | nonzero | nonzero | 0.010 | ||||||
| pg162_def.cx9a2g_ser7 | 99.993 | 0.007 | nonzero | nonzero | 0.010 |
Insert response time histogram: each cell has the percentage of responses that take <= the time in the header and max is the max response time in seconds. For max values in the top 25% of the range have a red background and in the bottom 25% of the range have a green background. The red background is not used when the min value is within 80% of the max value.
| dbms | 256us | 1ms | 4ms | 16ms | 64ms | 256ms | 1s | 4s | 16s | gt | max |
|---|---|---|---|---|---|---|---|---|---|---|---|
| pg162_def.cx9a2_ser7 | 55.250 | 44.750 | 0.024 | ||||||||
| pg162_def.cx9a2a_ser7 | 54.722 | 45.278 | 0.034 | ||||||||
| pg162_def.cx9a2b_ser7 | 55.250 | 44.750 | 0.027 | ||||||||
| pg162_def.cx9a2c_ser7 | 55.250 | 44.750 | 0.028 | ||||||||
| pg162_def.cx9a2e_ser7 | 55.417 | 44.583 | 0.034 | ||||||||
| pg162_def.cx9a2f_ser7 | 56.083 | 43.917 | 0.024 | ||||||||
| pg162_def.cx9a2g_ser7 | 55.556 | 44.444 | 0.023 |
Delete response time histogram: each cell has the percentage of responses that take <= the time in the header and max is the max response time in seconds. For max values in the top 25% of the range have a red background and in the bottom 25% of the range have a green background. The red background is not used when the min value is within 80% of the max value.
| dbms | 256us | 1ms | 4ms | 16ms | 64ms | 256ms | 1s | 4s | 16s | gt | max |
|---|---|---|---|---|---|---|---|---|---|---|---|
| pg162_def.cx9a2_ser7 | 0.028 | 43.750 | 56.139 | 0.083 | 0.010 | ||||||
| pg162_def.cx9a2a_ser7 | 0.194 | 45.722 | 53.944 | 0.139 | 0.010 | ||||||
| pg162_def.cx9a2b_ser7 | 0.139 | 48.750 | 51.028 | 0.083 | 0.010 | ||||||
| pg162_def.cx9a2c_ser7 | 0.056 | 49.806 | 50.028 | 0.111 | 0.009 | ||||||
| pg162_def.cx9a2e_ser7 | 0.278 | 55.083 | 44.528 | 0.111 | 0.010 | ||||||
| pg162_def.cx9a2f_ser7 | 0.083 | 47.222 | 52.583 | 0.111 | 0.010 | ||||||
| pg162_def.cx9a2g_ser7 | 0.194 | 44.194 | 55.528 | 0.083 | 0.009 |
Performance metrics for the DBMS listed above. Some are normalized by throughput, others are not. Legend for results is here.
ips	qps	rps	rmbps	wps	wmbps	rpq	rkbpq	wpi	wkbpi	csps	cpups	cspq	cpupq	dbgb1	dbgb2	rss	maxop	p50	p99	tag
100	26367	111	0.9	30.7	1.7	0.004	0.036	0.307	17.011	100928	4.7	3.828	14	154.5	192.7	23.1	0.010	26626	19770	pg162_def.cx9a2_ser7
100	26274	111	0.9	28.1	1.6	0.004	0.035	0.282	16.809	100627	4.1	3.830	12	154.5	193.3	23.0	0.010	26986	19866	pg162_def.cx9a2a_ser7
100	26255	112	0.9	29.8	1.7	0.004	0.035	0.298	16.943	100518	5.3	3.828	16	154.5	192.3	23.1	0.010	26994	19467	pg162_def.cx9a2b_ser7
100	25995	111	0.9	31.5	1.7	0.004	0.035	0.315	17.073	99623	4.5	3.832	14	154.5	191.8	23.1	0.010	26341	19676	pg162_def.cx9a2c_ser7
100	26924	111	0.9	31.4	1.7	0.004	0.034	0.315	17.086	103066	4.5	3.828	13	154.5	191.9	23.0	0.010	27205	19833	pg162_def.cx9a2e_ser7
100	26259	111	0.9	32.3	1.7	0.004	0.036	0.324	17.140	100511	4.1	3.828	12	154.5	191.3	23.0	0.010	26824	20201	pg162_def.cx9a2f_ser7
100	25926	111	0.9	33.6	1.7	0.004	0.035	0.337	17.275	99308	4.1	3.830	13	154.5	189.8	22.9	0.010	26847	20277	pg162_def.cx9a2g_ser7
qp100.L2
qp100.L2: point queries with 100 insert/s per client. Graphs for performance per 1-second interval are here.
Average throughput:
Query response time histogram: each cell has the percentage of responses that take <= the time in the header and max is the max response time in seconds. For max values in the top 25% of the range have a red background and in the bottom 25% of the range have a green background. The red background is not used when the min value is within 80% of the max value.
| dbms | 256us | 1ms | 4ms | 16ms | 64ms | 256ms | 1s | 4s | 16s | gt | max |
|---|---|---|---|---|---|---|---|---|---|---|---|
| pg162_def.cx9a2_ser7 | 0.368 | 97.661 | 1.739 | 0.231 | 0.001 | 0.248 | |||||
| pg162_def.cx9a2a_ser7 | 0.356 | 97.658 | 1.840 | 0.145 | 0.001 | nonzero | 0.338 | ||||
| pg162_def.cx9a2b_ser7 | 0.356 | 99.242 | 0.396 | 0.006 | 0.033 | ||||||
| pg162_def.cx9a2c_ser7 | 0.336 | 97.612 | 1.891 | 0.160 | 0.001 | 0.103 | |||||
| pg162_def.cx9a2e_ser7 | 0.358 | 98.155 | 1.263 | 0.221 | 0.004 | nonzero | 0.305 | ||||
| pg162_def.cx9a2f_ser7 | 0.360 | 99.549 | 0.090 | nonzero | 0.048 | ||||||
| pg162_def.cx9a2g_ser7 | 0.327 | 99.598 | 0.074 | nonzero | 0.017 |
Insert response time histogram: each cell has the percentage of responses that take <= the time in the header and max is the max response time in seconds. For max values in the top 25% of the range have a red background and in the bottom 25% of the range have a green background. The red background is not used when the min value is within 80% of the max value.
| dbms | 256us | 1ms | 4ms | 16ms | 64ms | 256ms | 1s | 4s | 16s | gt | max |
|---|---|---|---|---|---|---|---|---|---|---|---|
| pg162_def.cx9a2_ser7 | 82.972 | 12.667 | 4.361 | 0.241 | |||||||
| pg162_def.cx9a2a_ser7 | 83.889 | 12.083 | 4.000 | 0.028 | 0.291 | ||||||
| pg162_def.cx9a2b_ser7 | 90.361 | 9.611 | 0.028 | 0.065 | |||||||
| pg162_def.cx9a2c_ser7 | 82.889 | 12.833 | 4.278 | 0.207 | |||||||
| pg162_def.cx9a2e_ser7 | 85.389 | 9.722 | 4.722 | 0.167 | 0.323 | ||||||
| pg162_def.cx9a2f_ser7 | 93.139 | 6.833 | 0.028 | 0.073 | |||||||
| pg162_def.cx9a2g_ser7 | 94.194 | 5.806 | 0.036 |
Delete response time histogram: each cell has the percentage of responses that take <= the time in the header and max is the max response time in seconds. For max values in the top 25% of the range have a red background and in the bottom 25% of the range have a green background. The red background is not used when the min value is within 80% of the max value.
| dbms | 256us | 1ms | 4ms | 16ms | 64ms | 256ms | 1s | 4s | 16s | gt | max |
|---|---|---|---|---|---|---|---|---|---|---|---|
| pg162_def.cx9a2_ser7 | 0.111 | 44.500 | 54.528 | 0.861 | 0.013 | ||||||
| pg162_def.cx9a2a_ser7 | 0.222 | 42.278 | 56.639 | 0.861 | 0.012 | ||||||
| pg162_def.cx9a2b_ser7 | 0.083 | 43.194 | 56.667 | 0.056 | 0.007 | ||||||
| pg162_def.cx9a2c_ser7 | 0.111 | 40.861 | 58.611 | 0.417 | 0.012 | ||||||
| pg162_def.cx9a2e_ser7 | 0.111 | 38.861 | 60.278 | 0.750 | 0.012 | ||||||
| pg162_def.cx9a2f_ser7 | 0.389 | 41.111 | 58.500 | 0.003 | |||||||
| pg162_def.cx9a2g_ser7 | 0.167 | 46.083 | 53.694 | 0.056 | 0.010 |
Performance metrics for the DBMS listed above. Some are normalized by throughput, others are not. Legend for results is here.
ips	qps	rps	rmbps	wps	wmbps	rpq	rkbpq	wpi	wkbpi	csps	cpups	cspq	cpupq	dbgb1	dbgb2	rss	maxop	p50	p99	tag
100	454	6050	47.5	187.5	2.9	13.340	107.240	1.881	29.440	14539	1.9	32.059	335	154.5	190.5	22.9	0.248	495	64	pg162_def.cx9a2_ser7
100	456	6078	47.7	189.0	2.9	13.341	107.264	1.894	29.546	14564	1.8	31.967	316	154.5	190.6	22.8	0.338	495	112	pg162_def.cx9a2a_ser7
100	482	6385	50.1	188.6	2.9	13.258	106.579	1.890	29.520	15335	2.1	31.843	349	154.5	190.4	22.9	0.033	496	304	pg162_def.cx9a2b_ser7
100	452	6030	47.3	188.7	2.9	13.342	107.263	1.891	29.533	14586	2.0	32.269	354	154.5	190.3	22.9	0.103	495	112	pg162_def.cx9a2c_ser7
100	456	6081	47.8	188.7	2.9	13.331	107.202	1.891	29.521	14575	1.9	31.948	333	154.5	190.3	22.8	0.305	495	48	pg162_def.cx9a2e_ser7
100	485	6429	50.5	189.0	2.9	13.248	106.521	1.894	29.546	15399	2.0	31.731	330	154.5	190.1	22.8	0.048	511	352	pg162_def.cx9a2f_ser7
100	483	6399	50.2	188.8	2.9	13.256	106.561	1.892	29.535	15442	2.0	31.991	331	154.5	189.8	22.7	0.017	496	352	pg162_def.cx9a2g_ser7
qr500.L3
qr500.L3: range queries with 500 insert/s per client. Graphs for performance per 1-second interval are here.
Average throughput:
Query response time histogram: each cell has the percentage of responses that take <= the time in the header and max is the max response time in seconds. For max values in the top 25% of the range have a red background and in the bottom 25% of the range have a green background. The red background is not used when the min value is within 80% of the max value.
| dbms | 256us | 1ms | 4ms | 16ms | 64ms | 256ms | 1s | 4s | 16s | gt | max |
|---|---|---|---|---|---|---|---|---|---|---|---|
| pg162_def.cx9a2_ser7 | 99.987 | 0.013 | nonzero | nonzero | 0.011 | ||||||
| pg162_def.cx9a2a_ser7 | 99.984 | 0.015 | nonzero | nonzero | 0.012 | ||||||
| pg162_def.cx9a2b_ser7 | 99.986 | 0.014 | nonzero | nonzero | 0.011 | ||||||
| pg162_def.cx9a2c_ser7 | 99.984 | 0.016 | nonzero | nonzero | 0.010 | ||||||
| pg162_def.cx9a2e_ser7 | 99.985 | 0.015 | nonzero | nonzero | 0.011 | ||||||
| pg162_def.cx9a2f_ser7 | 99.987 | 0.013 | nonzero | nonzero | 0.010 | ||||||
| pg162_def.cx9a2g_ser7 | 99.987 | 0.013 | nonzero | nonzero | 0.011 |
Insert response time histogram: each cell has the percentage of responses that take <= the time in the header and max is the max response time in seconds. For max values in the top 25% of the range have a red background and in the bottom 25% of the range have a green background. The red background is not used when the min value is within 80% of the max value.
| dbms | 256us | 1ms | 4ms | 16ms | 64ms | 256ms | 1s | 4s | 16s | gt | max |
|---|---|---|---|---|---|---|---|---|---|---|---|
| pg162_def.cx9a2_ser7 | 82.506 | 15.061 | 2.433 | 0.187 | |||||||
| pg162_def.cx9a2a_ser7 | 76.494 | 22.078 | 1.428 | 0.131 | |||||||
| pg162_def.cx9a2b_ser7 | 76.906 | 22.917 | 0.178 | 0.093 | |||||||
| pg162_def.cx9a2c_ser7 | 79.517 | 19.833 | 0.650 | 0.108 | |||||||
| pg162_def.cx9a2e_ser7 | 84.661 | 14.983 | 0.356 | 0.149 | |||||||
| pg162_def.cx9a2f_ser7 | 78.139 | 21.861 | 0.033 | ||||||||
| pg162_def.cx9a2g_ser7 | 86.550 | 13.450 | 0.029 |
Delete response time histogram: each cell has the percentage of responses that take <= the time in the header and max is the max response time in seconds. For max values in the top 25% of the range have a red background and in the bottom 25% of the range have a green background. The red background is not used when the min value is within 80% of the max value.
| dbms | 256us | 1ms | 4ms | 16ms | 64ms | 256ms | 1s | 4s | 16s | gt | max |
|---|---|---|---|---|---|---|---|---|---|---|---|
| pg162_def.cx9a2_ser7 | 0.139 | 11.950 | 52.544 | 35.361 | 0.006 | 0.017 | |||||
| pg162_def.cx9a2a_ser7 | 0.061 | 12.672 | 53.661 | 33.606 | 0.016 | ||||||
| pg162_def.cx9a2b_ser7 | 0.417 | 12.561 | 52.011 | 35.006 | 0.006 | 0.017 | |||||
| pg162_def.cx9a2c_ser7 | 0.372 | 10.111 | 53.850 | 35.661 | 0.006 | 0.018 | |||||
| pg162_def.cx9a2e_ser7 | 0.206 | 12.850 | 54.722 | 32.222 | 0.013 | ||||||
| pg162_def.cx9a2f_ser7 | 0.289 | 10.744 | 58.183 | 30.778 | 0.006 | 0.017 | |||||
| pg162_def.cx9a2g_ser7 | 0.222 | 11.811 | 52.283 | 35.683 | 0.011 |
Performance metrics for the DBMS listed above. Some are normalized by throughput, others are not. Legend for results is here.
ips	qps	rps	rmbps	wps	wmbps	rpq	rkbpq	wpi	wkbpi	csps	cpups	cspq	cpupq	dbgb1	dbgb2	rss	maxop	p50	p99	tag
499	25170	864	7.0	307.8	9.2	0.034	0.284	0.617	18.931	98249	4.9	3.903	16	154.5	185.5	10.6	0.011	25829	18755	pg162_def.cx9a2_ser7
499	24985	865	7.0	296.5	9.1	0.035	0.286	0.594	18.679	97524	5.1	3.903	16	154.5	185.7	11.4	0.012	25553	18765	pg162_def.cx9a2a_ser7
499	25092	864	7.0	280.6	9.0	0.034	0.284	0.562	18.471	97906	4.9	3.902	16	154.5	185.5	10.5	0.011	25997	19335	pg162_def.cx9a2b_ser7
499	24488	864	7.0	300.3	9.1	0.035	0.291	0.602	18.749	95751	5.3	3.910	17	154.5	185.4	10.3	0.010	25236	19018	pg162_def.cx9a2c_ser7
499	24651	864	7.0	290.8	9.0	0.035	0.290	0.583	18.554	96305	4.9	3.907	16	154.5	185.3	11.7	0.011	25221	18819	pg162_def.cx9a2e_ser7
499	25322	865	7.0	278.3	9.0	0.034	0.282	0.558	18.411	98817	4.9	3.902	15	154.5	185.2	11.1	0.010	25877	19453	pg162_def.cx9a2f_ser7
499	25008	864	7.0	280.4	9.0	0.035	0.286	0.562	18.447	97578	4.9	3.902	16	154.5	184.9	10.7	0.011	25507	18938	pg162_def.cx9a2g_ser7
qp500.L4
qp500.L4: point queries with 500 insert/s per client. Graphs for performance per 1-second interval are here.
Average throughput:
Query response time histogram: each cell has the percentage of responses that take <= the time in the header and max is the max response time in seconds. For max values in the top 25% of the range have a red background and in the bottom 25% of the range have a green background. The red background is not used when the min value is within 80% of the max value.
| dbms | 256us | 1ms | 4ms | 16ms | 64ms | 256ms | 1s | 4s | 16s | gt | max |
|---|---|---|---|---|---|---|---|---|---|---|---|
| pg162_def.cx9a2_ser7 | 0.147 | 99.050 | 0.658 | 0.145 | nonzero | 0.079 | |||||
| pg162_def.cx9a2a_ser7 | 0.157 | 98.030 | 1.725 | 0.087 | 0.001 | 0.236 | |||||
| pg162_def.cx9a2b_ser7 | 0.132 | 99.511 | 0.357 | nonzero | 0.017 | ||||||
| pg162_def.cx9a2c_ser7 | 0.125 | 99.599 | 0.276 | nonzero | 0.017 | ||||||
| pg162_def.cx9a2e_ser7 | 0.130 | 98.937 | 0.900 | 0.033 | nonzero | 0.097 | |||||
| pg162_def.cx9a2f_ser7 | 0.129 | 99.549 | 0.322 | nonzero | 0.018 | ||||||
| pg162_def.cx9a2g_ser7 | 0.149 | 99.535 | 0.316 | 0.015 |
Insert response time histogram: each cell has the percentage of responses that take <= the time in the header and max is the max response time in seconds. For max values in the top 25% of the range have a red background and in the bottom 25% of the range have a green background. The red background is not used when the min value is within 80% of the max value.
| dbms | 256us | 1ms | 4ms | 16ms | 64ms | 256ms | 1s | 4s | 16s | gt | max |
|---|---|---|---|---|---|---|---|---|---|---|---|
| pg162_def.cx9a2_ser7 | 95.594 | 2.494 | 1.911 | 0.179 | |||||||
| pg162_def.cx9a2a_ser7 | 87.439 | 12.033 | 0.528 | 0.237 | |||||||
| pg162_def.cx9a2b_ser7 | 92.367 | 7.633 | 0.031 | ||||||||
| pg162_def.cx9a2c_ser7 | 94.156 | 5.844 | 0.036 | ||||||||
| pg162_def.cx9a2e_ser7 | 91.383 | 8.433 | 0.183 | 0.204 | |||||||
| pg162_def.cx9a2f_ser7 | 92.689 | 7.311 | 0.033 | ||||||||
| pg162_def.cx9a2g_ser7 | 93.578 | 6.422 | 0.033 |
Delete response time histogram: each cell has the percentage of responses that take <= the time in the header and max is the max response time in seconds. For max values in the top 25% of the range have a red background and in the bottom 25% of the range have a green background. The red background is not used when the min value is within 80% of the max value.
| dbms | 256us | 1ms | 4ms | 16ms | 64ms | 256ms | 1s | 4s | 16s | gt | max |
|---|---|---|---|---|---|---|---|---|---|---|---|
| pg162_def.cx9a2_ser7 | 0.133 | 14.628 | 52.344 | 32.889 | 0.006 | 0.016 | |||||
| pg162_def.cx9a2a_ser7 | 0.750 | 12.533 | 55.128 | 31.589 | 0.013 | ||||||
| pg162_def.cx9a2b_ser7 | 0.267 | 11.667 | 55.333 | 32.733 | 0.010 | ||||||
| pg162_def.cx9a2c_ser7 | 0.272 | 11.350 | 57.539 | 30.839 | 0.013 | ||||||
| pg162_def.cx9a2e_ser7 | 0.044 | 12.861 | 56.028 | 31.067 | 0.012 | ||||||
| pg162_def.cx9a2f_ser7 | 0.500 | 11.794 | 58.539 | 29.167 | 0.010 | ||||||
| pg162_def.cx9a2g_ser7 | 0.144 | 14.689 | 53.628 | 31.539 | 0.015 |
Performance metrics for the DBMS listed above. Some are normalized by throughput, others are not. Legend for results is here.
ips	qps	rps	rmbps	wps	wmbps	rpq	rkbpq	wpi	wkbpi	csps	cpups	cspq	cpupq	dbgb1	dbgb2	rss	maxop	p50	p99	tag
499	450	6868	53.9	912.2	13.7	15.245	122.517	1.827	28.154	16641	2.6	36.939	462	154.5	183.3	10.1	0.079	479	80	pg162_def.cx9a2_ser7
499	440	6744	52.9	910.7	13.6	15.310	123.060	1.824	27.896	16359	2.6	37.137	472	154.5	183.3	20.1	0.236	463	144	pg162_def.cx9a2a_ser7
499	457	6944	54.5	913.5	13.6	15.194	122.108	1.829	27.948	16900	2.7	36.981	473	154.5	183.3	19.9	0.017	463	320	pg162_def.cx9a2b_ser7
499	456	6938	54.5	913.8	13.6	15.199	122.148	1.830	27.915	16917	2.7	37.058	473	154.5	183.2	20.1	0.017	464	320	pg162_def.cx9a2c_ser7
499	449	6843	53.7	911.4	13.6	15.243	122.503	1.826	27.895	16615	2.6	37.012	463	154.5	183.2	20.1	0.097	463	160	pg162_def.cx9a2e_ser7
499	457	6941	54.5	912.9	13.6	15.202	122.172	1.829	27.961	16890	2.6	36.990	456	154.5	183.1	20.1	0.018	463	320	pg162_def.cx9a2f_ser7
499	458	6957	54.6	915.1	13.6	15.189	122.064	1.832	27.973	16911	2.6	36.923	454	154.5	183.0	19.8	0.015	464	320	pg162_def.cx9a2g_ser7
qr1000.L5
qr1000.L5: range queries with 1000 insert/s per client. Graphs for performance per 1-second interval are here.
Average throughput:
Query response time histogram: each cell has the percentage of responses that take <= the time in the header and max is the max response time in seconds. For max values in the top 25% of the range have a red background and in the bottom 25% of the range have a green background. The red background is not used when the min value is within 80% of the max value.
| dbms | 256us | 1ms | 4ms | 16ms | 64ms | 256ms | 1s | 4s | 16s | gt | max |
|---|---|---|---|---|---|---|---|---|---|---|---|
| pg162_def.cx9a2_ser7 | 99.976 | 0.023 | 0.001 | nonzero | 0.012 | ||||||
| pg162_def.cx9a2a_ser7 | 99.976 | 0.023 | nonzero | nonzero | nonzero | 0.117 | |||||
| pg162_def.cx9a2b_ser7 | 99.977 | 0.023 | nonzero | nonzero | nonzero | 0.090 | |||||
| pg162_def.cx9a2c_ser7 | 99.977 | 0.023 | nonzero | nonzero | nonzero | 0.060 | |||||
| pg162_def.cx9a2e_ser7 | 99.976 | 0.023 | nonzero | nonzero | nonzero | 0.016 | |||||
| pg162_def.cx9a2f_ser7 | 99.978 | 0.022 | nonzero | nonzero | nonzero | 0.036 | |||||
| pg162_def.cx9a2g_ser7 | 99.977 | 0.022 | nonzero | nonzero | 0.011 |
Insert response time histogram: each cell has the percentage of responses that take <= the time in the header and max is the max response time in seconds. For max values in the top 25% of the range have a red background and in the bottom 25% of the range have a green background. The red background is not used when the min value is within 80% of the max value.
| dbms | 256us | 1ms | 4ms | 16ms | 64ms | 256ms | 1s | 4s | 16s | gt | max |
|---|---|---|---|---|---|---|---|---|---|---|---|
| pg162_def.cx9a2_ser7 | 80.169 | 16.611 | 3.219 | 0.184 | |||||||
| pg162_def.cx9a2a_ser7 | 86.708 | 11.983 | 1.308 | 0.187 | |||||||
| pg162_def.cx9a2b_ser7 | 93.303 | 6.694 | 0.003 | 0.207 | |||||||
| pg162_def.cx9a2c_ser7 | 92.361 | 7.636 | 0.003 | 0.182 | |||||||
| pg162_def.cx9a2e_ser7 | 87.558 | 10.528 | 1.914 | 0.175 | |||||||
| pg162_def.cx9a2f_ser7 | 93.503 | 6.494 | 0.003 | 0.154 | |||||||
| pg162_def.cx9a2g_ser7 | 93.281 | 6.717 | 0.003 | 0.078 |
Delete response time histogram: each cell has the percentage of responses that take <= the time in the header and max is the max response time in seconds. For max values in the top 25% of the range have a red background and in the bottom 25% of the range have a green background. The red background is not used when the min value is within 80% of the max value.
| dbms | 256us | 1ms | 4ms | 16ms | 64ms | 256ms | 1s | 4s | 16s | gt | max |
|---|---|---|---|---|---|---|---|---|---|---|---|
| pg162_def.cx9a2_ser7 | 0.158 | 4.975 | 28.733 | 64.894 | 1.239 | 0.028 | |||||
| pg162_def.cx9a2a_ser7 | 0.083 | 4.864 | 25.131 | 69.908 | 0.014 | 0.018 | |||||
| pg162_def.cx9a2b_ser7 | 0.025 | 5.175 | 26.397 | 68.397 | 0.006 | 0.017 | |||||
| pg162_def.cx9a2c_ser7 | 0.125 | 4.581 | 27.706 | 67.581 | 0.008 | 0.019 | |||||
| pg162_def.cx9a2e_ser7 | 0.044 | 6.078 | 25.081 | 68.642 | 0.156 | 0.026 | |||||
| pg162_def.cx9a2f_ser7 | 0.083 | 5.058 | 26.306 | 68.544 | 0.008 | 0.018 | |||||
| pg162_def.cx9a2g_ser7 | 0.086 | 5.139 | 28.372 | 66.400 | 0.003 | 0.018 |
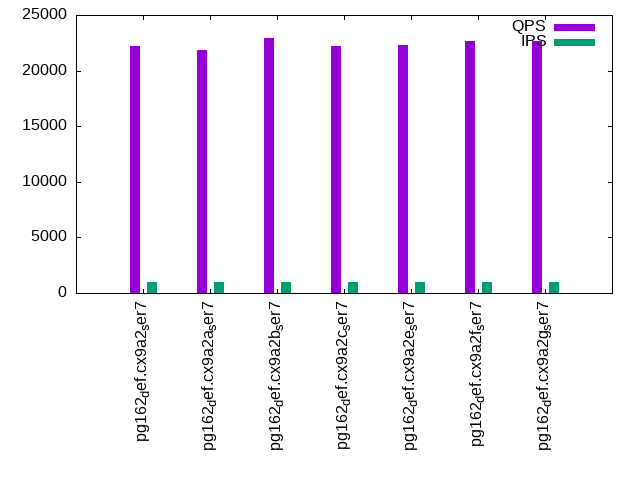
Performance metrics for the DBMS listed above. Some are normalized by throughput, others are not. Legend for results is here.
ips	qps	rps	rmbps	wps	wmbps	rpq	rkbpq	wpi	wkbpi	csps	cpups	cspq	cpupq	dbgb1	dbgb2	rss	maxop	p50	p99	tag
982	22184	1446	11.7	506.3	15.8	0.065	0.540	0.515	16.501	88631	6.2	3.995	22	154.5	182.3	15.8	0.012	23359	14495	pg162_def.cx9a2_ser7
992	21823	1461	11.8	462.6	15.2	0.067	0.553	0.466	15.707	87279	6.1	3.999	22	154.5	182.3	12.4	0.117	22994	14831	pg162_def.cx9a2a_ser7
998	22919	1468	11.9	475.6	15.4	0.064	0.530	0.476	15.813	91451	6.2	3.990	22	154.5	182.3	13.7	0.090	24149	14977	pg162_def.cx9a2b_ser7
998	22170	1468	11.9	456.9	15.1	0.066	0.548	0.458	15.488	88703	6.2	4.001	22	154.5	182.2	12.2	0.060	23365	14656	pg162_def.cx9a2c_ser7
989	22277	1454	11.8	469.0	15.2	0.065	0.541	0.474	15.778	88949	6.5	3.993	23	154.5	182.2	12.2	0.016	23206	14991	pg162_def.cx9a2e_ser7
998	22706	1468	11.9	467.8	15.3	0.065	0.535	0.469	15.680	90609	6.1	3.990	21	154.5	182.1	12.0	0.036	24006	14944	pg162_def.cx9a2f_ser7
998	22703	1469	11.9	472.3	15.4	0.065	0.535	0.473	15.752	90611	6.0	3.991	21	154.5	182.1	13.7	0.011	23877	15023	pg162_def.cx9a2g_ser7
qp1000.L6
qp1000.L6: point queries with 1000 insert/s per client. Graphs for performance per 1-second interval are here.
Average throughput:
Query response time histogram: each cell has the percentage of responses that take <= the time in the header and max is the max response time in seconds. For max values in the top 25% of the range have a red background and in the bottom 25% of the range have a green background. The red background is not used when the min value is within 80% of the max value.
| dbms | 256us | 1ms | 4ms | 16ms | 64ms | 256ms | 1s | 4s | 16s | gt | max |
|---|---|---|---|---|---|---|---|---|---|---|---|
| pg162_def.cx9a2_ser7 | 0.042 | 98.135 | 1.674 | 0.149 | nonzero | 0.074 | |||||
| pg162_def.cx9a2a_ser7 | 0.045 | 98.761 | 1.192 | 0.002 | 0.035 | ||||||
| pg162_def.cx9a2b_ser7 | 0.047 | 98.012 | 1.834 | 0.107 | 0.044 | ||||||
| pg162_def.cx9a2c_ser7 | 0.046 | 98.763 | 1.190 | 0.002 | 0.040 | ||||||
| pg162_def.cx9a2e_ser7 | 0.045 | 98.714 | 1.239 | 0.002 | 0.036 | ||||||
| pg162_def.cx9a2f_ser7 | 0.049 | 98.749 | 1.200 | 0.001 | 0.035 | ||||||
| pg162_def.cx9a2g_ser7 | 0.040 | 98.677 | 1.281 | 0.002 | 0.042 |
Insert response time histogram: each cell has the percentage of responses that take <= the time in the header and max is the max response time in seconds. For max values in the top 25% of the range have a red background and in the bottom 25% of the range have a green background. The red background is not used when the min value is within 80% of the max value.
| dbms | 256us | 1ms | 4ms | 16ms | 64ms | 256ms | 1s | 4s | 16s | gt | max |
|---|---|---|---|---|---|---|---|---|---|---|---|
| pg162_def.cx9a2_ser7 | 92.358 | 6.819 | 0.822 | 0.113 | |||||||
| pg162_def.cx9a2a_ser7 | 94.164 | 5.836 | 0.053 | ||||||||
| pg162_def.cx9a2b_ser7 | 91.686 | 7.633 | 0.681 | 0.189 | |||||||
| pg162_def.cx9a2c_ser7 | 95.083 | 4.914 | 0.003 | 0.309 | |||||||
| pg162_def.cx9a2e_ser7 | 94.186 | 5.814 | 0.053 | ||||||||
| pg162_def.cx9a2f_ser7 | 94.467 | 5.531 | 0.003 | 0.071 | |||||||
| pg162_def.cx9a2g_ser7 | 93.731 | 6.269 | 0.052 |
Delete response time histogram: each cell has the percentage of responses that take <= the time in the header and max is the max response time in seconds. For max values in the top 25% of the range have a red background and in the bottom 25% of the range have a green background. The red background is not used when the min value is within 80% of the max value.
| dbms | 256us | 1ms | 4ms | 16ms | 64ms | 256ms | 1s | 4s | 16s | gt | max |
|---|---|---|---|---|---|---|---|---|---|---|---|
| pg162_def.cx9a2_ser7 | 0.061 | 6.167 | 25.136 | 68.606 | 0.031 | 0.021 | |||||
| pg162_def.cx9a2a_ser7 | 0.061 | 7.211 | 25.250 | 67.475 | 0.003 | 0.019 | |||||
| pg162_def.cx9a2b_ser7 | 0.197 | 4.850 | 26.944 | 67.983 | 0.025 | 0.021 | |||||
| pg162_def.cx9a2c_ser7 | 0.147 | 5.514 | 30.100 | 64.239 | 0.014 | ||||||
| pg162_def.cx9a2e_ser7 | 0.094 | 5.472 | 27.719 | 66.714 | 0.015 | ||||||
| pg162_def.cx9a2f_ser7 | 0.147 | 4.878 | 27.825 | 67.147 | 0.003 | 0.016 | |||||
| pg162_def.cx9a2g_ser7 | 0.319 | 6.236 | 25.294 | 68.150 | 0.014 |
Performance metrics for the DBMS listed above. Some are normalized by throughput, others are not. Legend for results is here.
ips	qps	rps	rmbps	wps	wmbps	rpq	rkbpq	wpi	wkbpi	csps	cpups	cspq	cpupq	dbgb1	dbgb2	rss	maxop	p50	p99	tag
998	404	7435	58.4	1792.7	26.1	18.395	147.927	1.796	26.811	18463	3.4	45.677	673	154.6	191.7	19.8	0.074	432	112	pg162_def.cx9a2_ser7
999	419	7616	59.8	1783.5	25.9	18.193	146.330	1.786	26.510	18964	3.4	45.304	650	154.6	192.4	8.2	0.035	432	320	pg162_def.cx9a2a_ser7
998	407	7466	58.6	1784.7	25.9	18.339	147.518	1.788	26.597	18570	3.4	45.616	668	154.6	192.4	19.6	0.044	432	112	pg162_def.cx9a2b_ser7
998	419	7628	59.9	1784.2	25.8	18.197	146.352	1.787	26.486	18931	3.5	45.160	668	154.6	192.7	8.3	0.040	432	320	pg162_def.cx9a2c_ser7
999	417	7600	59.7	1783.9	25.9	18.209	146.433	1.786	26.594	18886	3.4	45.247	652	154.6	192.4	8.3	0.036	432	320	pg162_def.cx9a2e_ser7
999	418	7613	59.8	1783.1	25.9	18.195	146.337	1.785	26.574	18886	3.4	45.138	650	154.6	192.5	8.3	0.035	432	320	pg162_def.cx9a2f_ser7
999	417	7590	59.6	1785.6	26.0	18.215	146.504	1.788	26.606	18865	3.4	45.272	653	154.6	192.5	8.2	0.042	432	320	pg162_def.cx9a2g_ser7
l.i0
l.i0: load without secondary indexes
Performance metrics for all DBMS, not just the ones listed above. Some are normalized by throughput, others are not. Legend for results is here.
ips	qps	rps	rmbps	wps	wmbps	rpq	rkbpq	wpi	wkbpi	csps	cpups	cspq	cpupq	dbgb1	dbgb2	rss	maxop	p50	p99	tag
202994	0	34	0.3	289.0	83.5	0.000	0.001	0.001	0.421	24432	11.4	0.120	4	76.5	116.6	18.4	0.097	201956	191689	pg162_def.cx9a2_ser7
198758	0	36	0.3	278.4	81.8	0.000	0.001	0.001	0.421	23534	11.4	0.118	5	76.5	116.6	18.6	0.143	197376	188290	pg162_def.cx9a2a_ser7
201765	0	37	0.3	285.6	83.0	0.000	0.001	0.001	0.421	23817	11.4	0.118	5	76.5	116.6	18.9	0.133	200639	188785	pg162_def.cx9a2b_ser7
202737	0	36	0.3	291.9	83.2	0.000	0.001	0.001	0.420	23985	11.7	0.118	5	76.5	116.6	2.0	0.134	201581	191685	pg162_def.cx9a2c_ser7
202122	0	35	0.3	289.2	83.8	0.000	0.001	0.001	0.424	23693	11.5	0.117	5	76.5	116.6	0.9	0.115	200983	191086	pg162_def.cx9a2e_ser7
202891	0	33	0.3	285.2	82.5	0.000	0.001	0.001	0.416	23934	11.5	0.118	5	76.5	116.6	18.6	0.064	201175	191589	pg162_def.cx9a2f_ser7
202686	0	38	0.3	286.5	83.4	0.000	0.002	0.001	0.422	24168	11.4	0.119	4	76.5	116.6	20.0	0.096	201482	191896	pg162_def.cx9a2g_ser7
l.x
l.x: create secondary indexes
Performance metrics for all DBMS, not just the ones listed above. Some are normalized by throughput, others are not. Legend for results is here.
ips	qps	rps	rmbps	wps	wmbps	rpq	rkbpq	wpi	wkbpi	csps	cpups	cspq	cpupq	dbgb1	dbgb2	rss	maxop	p50	p99	tag
419068	0	1491	141.4	411.7	157.4	0.004	0.345	0.001	0.385	1541	6.4	0.004	1	153.6	193.7	22.0	0.003	NA	NA	pg162_def.cx9a2_ser7
409836	0	1450	138.2	404.1	154.7	0.004	0.345	0.001	0.387	1501	6.3	0.004	1	153.6	193.7	22.7	0.005	NA	NA	pg162_def.cx9a2a_ser7
417536	0	1472	140.8	413.7	156.9	0.004	0.345	0.001	0.385	1533	6.4	0.004	1	153.6	193.7	21.9	0.008	NA	NA	pg162_def.cx9a2b_ser7
420389	0	1489	141.7	412.5	157.6	0.004	0.345	0.001	0.384	1610	6.5	0.004	1	153.6	193.7	22.8	0.005	NA	NA	pg162_def.cx9a2c_ser7
415584	0	1468	140.1	404.8	155.2	0.004	0.345	0.001	0.382	1498	6.4	0.004	1	153.6	193.7	21.7	0.006	NA	NA	pg162_def.cx9a2e_ser7
419948	0	1478	141.6	411.1	157.6	0.004	0.345	0.001	0.384	1512	6.4	0.004	1	153.6	193.7	22.3	0.006	NA	NA	pg162_def.cx9a2f_ser7
420610	0	1486	141.9	413.1	158.1	0.004	0.345	0.001	0.385	1543	6.4	0.004	1	153.6	193.7	22.6	0.005	NA	NA	pg162_def.cx9a2g_ser7
l.i1
l.i1: continue load after secondary indexes created with 50 inserts per transaction
Performance metrics for all DBMS, not just the ones listed above. Some are normalized by throughput, others are not. Legend for results is here.
ips	qps	rps	rmbps	wps	wmbps	rpq	rkbpq	wpi	wkbpi	csps	cpups	cspq	cpupq	dbgb1	dbgb2	rss	maxop	p50	p99	tag
3162	0	4543	36.2	3514.4	63.8	1.437	11.729	1.111	20.667	11422	7.6	3.612	192	154.3	194.3	20.0	0.328	2798	649	pg162_def.cx9a2_ser7
3021	0	4352	34.7	3421.5	62.1	1.441	11.761	1.133	21.050	11117	7.4	3.680	196	154.3	194.3	14.3	0.280	2997	649	pg162_def.cx9a2a_ser7
3040	0	4371	34.8	3409.8	61.7	1.438	11.736	1.122	20.792	11115	7.3	3.657	192	154.3	194.3	19.4	0.367	3046	549	pg162_def.cx9a2b_ser7
3051	0	4388	35.0	3436.1	62.3	1.438	11.732	1.126	20.914	11244	7.6	3.685	199	154.3	194.3	19.9	0.258	3047	649	pg162_def.cx9a2c_ser7
3021	0	4349	34.6	3370.0	60.9	1.440	11.744	1.115	20.634	11115	7.3	3.679	193	154.3	194.3	20.6	0.193	3000	649	pg162_def.cx9a2e_ser7
3120	0	4513	36.0	3593.4	65.2	1.447	11.807	1.152	21.395	11455	7.6	3.671	195	154.3	194.3	14.2	0.116	3097	1897	pg162_def.cx9a2f_ser7
3120	0	4488	35.6	3554.0	69.1	1.438	11.683	1.139	22.674	11485	7.8	3.681	200	154.3	194.3	16.6	0.120	3097	1897	pg162_def.cx9a2g_ser7
l.i2
l.i2: continue load after secondary indexes created with 5 inserts per transaction
Performance metrics for all DBMS, not just the ones listed above. Some are normalized by throughput, others are not. Legend for results is here.
ips	qps	rps	rmbps	wps	wmbps	rpq	rkbpq	wpi	wkbpi	csps	cpups	cspq	cpupq	dbgb1	dbgb2	rss	maxop	p50	p99	tag
174	0	186	1.5	487.9	7.0	1.072	8.744	2.810	41.143	1484	5.9	8.550	2719	154.4	194.5	22.0	0.085	175	155	pg162_def.cx9a2_ser7
172	0	185	1.5	481.3	6.9	1.075	8.770	2.795	41.061	1496	5.9	8.688	2741	154.4	194.5	22.0	0.080	170	155	pg162_def.cx9a2a_ser7
172	0	185	1.5	484.6	6.9	1.073	8.750	2.809	41.256	1493	5.9	8.656	2736	154.4	194.5	22.1	0.092	170	155	pg162_def.cx9a2b_ser7
173	0	186	1.5	485.1	7.0	1.073	8.751	2.799	41.070	1603	6.4	9.251	2954	154.4	194.5	21.9	0.127	170	155	pg162_def.cx9a2c_ser7
172	0	185	1.5	486.5	7.0	1.072	8.748	2.822	41.502	1483	5.9	8.605	2738	154.4	194.5	22.1	0.127	170	155	pg162_def.cx9a2e_ser7
173	0	186	1.5	472.6	6.8	1.072	8.743	2.730	40.193	1501	5.9	8.671	2727	154.4	194.4	13.8	0.073	175	155	pg162_def.cx9a2f_ser7
173	0	185	1.5	484.5	7.1	1.073	8.755	2.804	41.909	1427	6.0	8.261	2778	154.4	192.1	20.6	0.110	170	155	pg162_def.cx9a2g_ser7
qr100.L1
qr100.L1: range queries with 100 insert/s per client
Performance metrics for all DBMS, not just the ones listed above. Some are normalized by throughput, others are not. Legend for results is here.
ips	qps	rps	rmbps	wps	wmbps	rpq	rkbpq	wpi	wkbpi	csps	cpups	cspq	cpupq	dbgb1	dbgb2	rss	maxop	p50	p99	tag
100	26367	111	0.9	30.7	1.7	0.004	0.036	0.307	17.011	100928	4.7	3.828	14	154.5	192.7	23.1	0.010	26626	19770	pg162_def.cx9a2_ser7
100	26274	111	0.9	28.1	1.6	0.004	0.035	0.282	16.809	100627	4.1	3.830	12	154.5	193.3	23.0	0.010	26986	19866	pg162_def.cx9a2a_ser7
100	26255	112	0.9	29.8	1.7	0.004	0.035	0.298	16.943	100518	5.3	3.828	16	154.5	192.3	23.1	0.010	26994	19467	pg162_def.cx9a2b_ser7
100	25995	111	0.9	31.5	1.7	0.004	0.035	0.315	17.073	99623	4.5	3.832	14	154.5	191.8	23.1	0.010	26341	19676	pg162_def.cx9a2c_ser7
100	26924	111	0.9	31.4	1.7	0.004	0.034	0.315	17.086	103066	4.5	3.828	13	154.5	191.9	23.0	0.010	27205	19833	pg162_def.cx9a2e_ser7
100	26259	111	0.9	32.3	1.7	0.004	0.036	0.324	17.140	100511	4.1	3.828	12	154.5	191.3	23.0	0.010	26824	20201	pg162_def.cx9a2f_ser7
100	25926	111	0.9	33.6	1.7	0.004	0.035	0.337	17.275	99308	4.1	3.830	13	154.5	189.8	22.9	0.010	26847	20277	pg162_def.cx9a2g_ser7
qp100.L2
qp100.L2: point queries with 100 insert/s per client
Performance metrics for all DBMS, not just the ones listed above. Some are normalized by throughput, others are not. Legend for results is here.
ips	qps	rps	rmbps	wps	wmbps	rpq	rkbpq	wpi	wkbpi	csps	cpups	cspq	cpupq	dbgb1	dbgb2	rss	maxop	p50	p99	tag
100	454	6050	47.5	187.5	2.9	13.340	107.240	1.881	29.440	14539	1.9	32.059	335	154.5	190.5	22.9	0.248	495	64	pg162_def.cx9a2_ser7
100	456	6078	47.7	189.0	2.9	13.341	107.264	1.894	29.546	14564	1.8	31.967	316	154.5	190.6	22.8	0.338	495	112	pg162_def.cx9a2a_ser7
100	482	6385	50.1	188.6	2.9	13.258	106.579	1.890	29.520	15335	2.1	31.843	349	154.5	190.4	22.9	0.033	496	304	pg162_def.cx9a2b_ser7
100	452	6030	47.3	188.7	2.9	13.342	107.263	1.891	29.533	14586	2.0	32.269	354	154.5	190.3	22.9	0.103	495	112	pg162_def.cx9a2c_ser7
100	456	6081	47.8	188.7	2.9	13.331	107.202	1.891	29.521	14575	1.9	31.948	333	154.5	190.3	22.8	0.305	495	48	pg162_def.cx9a2e_ser7
100	485	6429	50.5	189.0	2.9	13.248	106.521	1.894	29.546	15399	2.0	31.731	330	154.5	190.1	22.8	0.048	511	352	pg162_def.cx9a2f_ser7
100	483	6399	50.2	188.8	2.9	13.256	106.561	1.892	29.535	15442	2.0	31.991	331	154.5	189.8	22.7	0.017	496	352	pg162_def.cx9a2g_ser7
qr500.L3
qr500.L3: range queries with 500 insert/s per client
Performance metrics for all DBMS, not just the ones listed above. Some are normalized by throughput, others are not. Legend for results is here.
ips	qps	rps	rmbps	wps	wmbps	rpq	rkbpq	wpi	wkbpi	csps	cpups	cspq	cpupq	dbgb1	dbgb2	rss	maxop	p50	p99	tag
499	25170	864	7.0	307.8	9.2	0.034	0.284	0.617	18.931	98249	4.9	3.903	16	154.5	185.5	10.6	0.011	25829	18755	pg162_def.cx9a2_ser7
499	24985	865	7.0	296.5	9.1	0.035	0.286	0.594	18.679	97524	5.1	3.903	16	154.5	185.7	11.4	0.012	25553	18765	pg162_def.cx9a2a_ser7
499	25092	864	7.0	280.6	9.0	0.034	0.284	0.562	18.471	97906	4.9	3.902	16	154.5	185.5	10.5	0.011	25997	19335	pg162_def.cx9a2b_ser7
499	24488	864	7.0	300.3	9.1	0.035	0.291	0.602	18.749	95751	5.3	3.910	17	154.5	185.4	10.3	0.010	25236	19018	pg162_def.cx9a2c_ser7
499	24651	864	7.0	290.8	9.0	0.035	0.290	0.583	18.554	96305	4.9	3.907	16	154.5	185.3	11.7	0.011	25221	18819	pg162_def.cx9a2e_ser7
499	25322	865	7.0	278.3	9.0	0.034	0.282	0.558	18.411	98817	4.9	3.902	15	154.5	185.2	11.1	0.010	25877	19453	pg162_def.cx9a2f_ser7
499	25008	864	7.0	280.4	9.0	0.035	0.286	0.562	18.447	97578	4.9	3.902	16	154.5	184.9	10.7	0.011	25507	18938	pg162_def.cx9a2g_ser7
qp500.L4
qp500.L4: point queries with 500 insert/s per client
Performance metrics for all DBMS, not just the ones listed above. Some are normalized by throughput, others are not. Legend for results is here.
ips	qps	rps	rmbps	wps	wmbps	rpq	rkbpq	wpi	wkbpi	csps	cpups	cspq	cpupq	dbgb1	dbgb2	rss	maxop	p50	p99	tag
499	450	6868	53.9	912.2	13.7	15.245	122.517	1.827	28.154	16641	2.6	36.939	462	154.5	183.3	10.1	0.079	479	80	pg162_def.cx9a2_ser7
499	440	6744	52.9	910.7	13.6	15.310	123.060	1.824	27.896	16359	2.6	37.137	472	154.5	183.3	20.1	0.236	463	144	pg162_def.cx9a2a_ser7
499	457	6944	54.5	913.5	13.6	15.194	122.108	1.829	27.948	16900	2.7	36.981	473	154.5	183.3	19.9	0.017	463	320	pg162_def.cx9a2b_ser7
499	456	6938	54.5	913.8	13.6	15.199	122.148	1.830	27.915	16917	2.7	37.058	473	154.5	183.2	20.1	0.017	464	320	pg162_def.cx9a2c_ser7
499	449	6843	53.7	911.4	13.6	15.243	122.503	1.826	27.895	16615	2.6	37.012	463	154.5	183.2	20.1	0.097	463	160	pg162_def.cx9a2e_ser7
499	457	6941	54.5	912.9	13.6	15.202	122.172	1.829	27.961	16890	2.6	36.990	456	154.5	183.1	20.1	0.018	463	320	pg162_def.cx9a2f_ser7
499	458	6957	54.6	915.1	13.6	15.189	122.064	1.832	27.973	16911	2.6	36.923	454	154.5	183.0	19.8	0.015	464	320	pg162_def.cx9a2g_ser7
qr1000.L5
qr1000.L5: range queries with 1000 insert/s per client
Performance metrics for all DBMS, not just the ones listed above. Some are normalized by throughput, others are not. Legend for results is here.
ips	qps	rps	rmbps	wps	wmbps	rpq	rkbpq	wpi	wkbpi	csps	cpups	cspq	cpupq	dbgb1	dbgb2	rss	maxop	p50	p99	tag
982	22184	1446	11.7	506.3	15.8	0.065	0.540	0.515	16.501	88631	6.2	3.995	22	154.5	182.3	15.8	0.012	23359	14495	pg162_def.cx9a2_ser7
992	21823	1461	11.8	462.6	15.2	0.067	0.553	0.466	15.707	87279	6.1	3.999	22	154.5	182.3	12.4	0.117	22994	14831	pg162_def.cx9a2a_ser7
998	22919	1468	11.9	475.6	15.4	0.064	0.530	0.476	15.813	91451	6.2	3.990	22	154.5	182.3	13.7	0.090	24149	14977	pg162_def.cx9a2b_ser7
998	22170	1468	11.9	456.9	15.1	0.066	0.548	0.458	15.488	88703	6.2	4.001	22	154.5	182.2	12.2	0.060	23365	14656	pg162_def.cx9a2c_ser7
989	22277	1454	11.8	469.0	15.2	0.065	0.541	0.474	15.778	88949	6.5	3.993	23	154.5	182.2	12.2	0.016	23206	14991	pg162_def.cx9a2e_ser7
998	22706	1468	11.9	467.8	15.3	0.065	0.535	0.469	15.680	90609	6.1	3.990	21	154.5	182.1	12.0	0.036	24006	14944	pg162_def.cx9a2f_ser7
998	22703	1469	11.9	472.3	15.4	0.065	0.535	0.473	15.752	90611	6.0	3.991	21	154.5	182.1	13.7	0.011	23877	15023	pg162_def.cx9a2g_ser7
qp1000.L6
qp1000.L6: point queries with 1000 insert/s per client
Performance metrics for all DBMS, not just the ones listed above. Some are normalized by throughput, others are not. Legend for results is here.
ips	qps	rps	rmbps	wps	wmbps	rpq	rkbpq	wpi	wkbpi	csps	cpups	cspq	cpupq	dbgb1	dbgb2	rss	maxop	p50	p99	tag
998	404	7435	58.4	1792.7	26.1	18.395	147.927	1.796	26.811	18463	3.4	45.677	673	154.6	191.7	19.8	0.074	432	112	pg162_def.cx9a2_ser7
999	419	7616	59.8	1783.5	25.9	18.193	146.330	1.786	26.510	18964	3.4	45.304	650	154.6	192.4	8.2	0.035	432	320	pg162_def.cx9a2a_ser7
998	407	7466	58.6	1784.7	25.9	18.339	147.518	1.788	26.597	18570	3.4	45.616	668	154.6	192.4	19.6	0.044	432	112	pg162_def.cx9a2b_ser7
998	419	7628	59.9	1784.2	25.8	18.197	146.352	1.787	26.486	18931	3.5	45.160	668	154.6	192.7	8.3	0.040	432	320	pg162_def.cx9a2c_ser7
999	417	7600	59.7	1783.9	25.9	18.209	146.433	1.786	26.594	18886	3.4	45.247	652	154.6	192.4	8.3	0.036	432	320	pg162_def.cx9a2e_ser7
999	418	7613	59.8	1783.1	25.9	18.195	146.337	1.785	26.574	18886	3.4	45.138	650	154.6	192.5	8.3	0.035	432	320	pg162_def.cx9a2f_ser7
999	417	7590	59.6	1785.6	26.0	18.215	146.504	1.788	26.606	18865	3.4	45.272	653	154.6	192.5	8.2	0.042	432	320	pg162_def.cx9a2g_ser7
l.i0
- l.i0: load without secondary indexes
- Legend for results is here.
- Each entry lists the percentage of responses that fit in that bucket (slower than max time for previous bucket, faster than min time for next bucket).
Insert response time histogram
256us	1ms	4ms	16ms	64ms	256ms	1s	4s	16s	gt	max	tag
0.000	99.969	0.028	0.002	0.001	nonzero	0.000	0.000	0.000	0.000	0.097	pg162_def.cx9a2_ser7
0.000	99.942	0.052	0.003	0.002	nonzero	0.000	0.000	0.000	0.000	0.143	pg162_def.cx9a2a_ser7
0.000	99.942	0.052	0.003	0.003	nonzero	0.000	0.000	0.000	0.000	0.133	pg162_def.cx9a2b_ser7
0.000	99.947	0.049	0.002	0.002	nonzero	0.000	0.000	0.000	0.000	0.134	pg162_def.cx9a2c_ser7
0.000	99.925	0.069	0.003	0.003	nonzero	0.000	0.000	0.000	0.000	0.115	pg162_def.cx9a2e_ser7
0.000	99.979	0.020	0.001	0.001	0.000	0.000	0.000	0.000	0.000	0.064	pg162_def.cx9a2f_ser7
0.000	99.957	0.037	0.003	0.002	nonzero	0.000	0.000	0.000	0.000	0.096	pg162_def.cx9a2g_ser7
l.x
- l.x: create secondary indexes
- Legend for results is here.
- Each entry lists the percentage of responses that fit in that bucket (slower than max time for previous bucket, faster than min time for next bucket).
TODO - determine whether there is data for create index response time
l.i1
- l.i1: continue load after secondary indexes created with 50 inserts per transaction
- Legend for results is here.
- Each entry lists the percentage of responses that fit in that bucket (slower than max time for previous bucket, faster than min time for next bucket).
Insert response time histogram
256us	1ms	4ms	16ms	64ms	256ms	1s	4s	16s	gt	max	tag
0.000	0.000	0.000	92.570	7.053	0.376	0.001	0.000	0.000	0.000	0.328	pg162_def.cx9a2_ser7
0.000	0.000	0.000	88.314	11.271	0.414	0.001	0.000	0.000	0.000	0.280	pg162_def.cx9a2a_ser7
0.000	0.000	0.000	93.528	6.058	0.409	0.006	0.000	0.000	0.000	0.367	pg162_def.cx9a2b_ser7
0.000	0.000	0.000	92.183	7.462	0.354	0.001	0.000	0.000	0.000	0.258	pg162_def.cx9a2c_ser7
0.000	0.000	0.000	90.991	8.616	0.392	0.000	0.000	0.000	0.000	0.193	pg162_def.cx9a2e_ser7
0.000	0.000	0.000	94.883	5.100	0.017	0.000	0.000	0.000	0.000	0.116	pg162_def.cx9a2f_ser7
0.000	0.000	0.000	95.055	4.936	0.009	0.000	0.000	0.000	0.000	0.120	pg162_def.cx9a2g_ser7
Delete response time histogram
256us	1ms	4ms	16ms	64ms	256ms	1s	4s	16s	gt	max	tag
0.001	1.219	10.904	49.655	38.221	0.000	0.000	0.000	0.000	0.000	0.040	pg162_def.cx9a2_ser7
0.006	1.354	10.203	52.163	36.275	0.000	0.000	0.000	0.000	0.000	0.037	pg162_def.cx9a2a_ser7
0.004	1.278	12.568	49.119	37.032	0.000	0.000	0.000	0.000	0.000	0.038	pg162_def.cx9a2b_ser7
0.004	1.320	10.464	51.614	36.599	0.000	0.000	0.000	0.000	0.000	0.052	pg162_def.cx9a2c_ser7
0.004	1.239	10.505	51.515	36.737	0.000	0.000	0.000	0.000	0.000	0.039	pg162_def.cx9a2e_ser7
0.004	1.862	10.046	52.036	36.051	0.000	0.000	0.000	0.000	0.000	0.030	pg162_def.cx9a2f_ser7
0.004	1.275	10.600	52.431	35.690	0.000	0.000	0.000	0.000	0.000	0.043	pg162_def.cx9a2g_ser7
l.i2
- l.i2: continue load after secondary indexes created with 5 inserts per transaction
- Legend for results is here.
- Each entry lists the percentage of responses that fit in that bucket (slower than max time for previous bucket, faster than min time for next bucket).
Insert response time histogram
256us	1ms	4ms	16ms	64ms	256ms	1s	4s	16s	gt	max	tag
0.000	1.966	93.493	4.449	0.091	0.001	0.000	0.000	0.000	0.000	0.085	pg162_def.cx9a2_ser7
0.000	1.125	94.269	4.535	0.072	0.001	0.000	0.000	0.000	0.000	0.080	pg162_def.cx9a2a_ser7
0.000	0.953	94.582	4.388	0.076	0.001	0.000	0.000	0.000	0.000	0.092	pg162_def.cx9a2b_ser7
0.000	1.004	95.304	3.656	0.034	0.001	0.000	0.000	0.000	0.000	0.127	pg162_def.cx9a2c_ser7
0.000	1.372	95.374	3.226	0.025	0.003	0.000	0.000	0.000	0.000	0.127	pg162_def.cx9a2e_ser7
0.000	1.065	96.141	2.779	0.014	0.002	0.000	0.000	0.000	0.000	0.073	pg162_def.cx9a2f_ser7
0.000	1.295	95.868	2.825	0.011	0.001	0.000	0.000	0.000	0.000	0.110	pg162_def.cx9a2g_ser7
Delete response time histogram
256us	1ms	4ms	16ms	64ms	256ms	1s	4s	16s	gt	max	tag
0.000	0.000	0.000	0.000	99.999	0.001	0.000	0.000	0.000	0.000	0.092	pg162_def.cx9a2_ser7
0.000	0.000	0.000	0.000	99.999	0.001	0.000	0.000	0.000	0.000	0.090	pg162_def.cx9a2a_ser7
0.000	0.000	0.000	0.000	99.999	0.001	0.000	0.000	0.000	0.000	0.091	pg162_def.cx9a2b_ser7
0.000	0.000	0.000	0.000	99.999	0.001	0.000	0.000	0.000	0.000	0.091	pg162_def.cx9a2c_ser7
0.000	0.000	0.000	0.000	99.999	0.001	0.000	0.000	0.000	0.000	0.091	pg162_def.cx9a2e_ser7
0.000	0.000	0.000	0.000	99.999	0.001	0.000	0.000	0.000	0.000	0.091	pg162_def.cx9a2f_ser7
0.000	0.000	0.000	0.000	99.999	0.001	0.000	0.000	0.000	0.000	0.089	pg162_def.cx9a2g_ser7
qr100.L1
- qr100.L1: range queries with 100 insert/s per client
- Legend for results is here.
- Each entry lists the percentage of responses that fit in that bucket (slower than max time for previous bucket, faster than min time for next bucket).
Query response time histogram
256us	1ms	4ms	16ms	64ms	256ms	1s	4s	16s	gt	max	tag
99.993	0.007	nonzero	nonzero	0.000	0.000	0.000	0.000	0.000	0.000	0.010	pg162_def.cx9a2_ser7
99.991	0.008	nonzero	nonzero	0.000	0.000	0.000	0.000	0.000	0.000	0.010	pg162_def.cx9a2a_ser7
99.992	0.008	nonzero	nonzero	0.000	0.000	0.000	0.000	0.000	0.000	0.010	pg162_def.cx9a2b_ser7
99.992	0.007	nonzero	nonzero	0.000	0.000	0.000	0.000	0.000	0.000	0.010	pg162_def.cx9a2c_ser7
99.992	0.008	nonzero	nonzero	0.000	0.000	0.000	0.000	0.000	0.000	0.010	pg162_def.cx9a2e_ser7
99.992	0.008	nonzero	nonzero	0.000	0.000	0.000	0.000	0.000	0.000	0.010	pg162_def.cx9a2f_ser7
99.993	0.007	nonzero	nonzero	0.000	0.000	0.000	0.000	0.000	0.000	0.010	pg162_def.cx9a2g_ser7
Insert response time histogram
256us	1ms	4ms	16ms	64ms	256ms	1s	4s	16s	gt	max	tag
0.000	0.000	0.000	55.250	44.750	0.000	0.000	0.000	0.000	0.000	0.024	pg162_def.cx9a2_ser7
0.000	0.000	0.000	54.722	45.278	0.000	0.000	0.000	0.000	0.000	0.034	pg162_def.cx9a2a_ser7
0.000	0.000	0.000	55.250	44.750	0.000	0.000	0.000	0.000	0.000	0.027	pg162_def.cx9a2b_ser7
0.000	0.000	0.000	55.250	44.750	0.000	0.000	0.000	0.000	0.000	0.028	pg162_def.cx9a2c_ser7
0.000	0.000	0.000	55.417	44.583	0.000	0.000	0.000	0.000	0.000	0.034	pg162_def.cx9a2e_ser7
0.000	0.000	0.000	56.083	43.917	0.000	0.000	0.000	0.000	0.000	0.024	pg162_def.cx9a2f_ser7
0.000	0.000	0.000	55.556	44.444	0.000	0.000	0.000	0.000	0.000	0.023	pg162_def.cx9a2g_ser7
Delete response time histogram
256us	1ms	4ms	16ms	64ms	256ms	1s	4s	16s	gt	max	tag
0.028	43.750	56.139	0.083	0.000	0.000	0.000	0.000	0.000	0.000	0.010	pg162_def.cx9a2_ser7
0.194	45.722	53.944	0.139	0.000	0.000	0.000	0.000	0.000	0.000	0.010	pg162_def.cx9a2a_ser7
0.139	48.750	51.028	0.083	0.000	0.000	0.000	0.000	0.000	0.000	0.010	pg162_def.cx9a2b_ser7
0.056	49.806	50.028	0.111	0.000	0.000	0.000	0.000	0.000	0.000	0.009	pg162_def.cx9a2c_ser7
0.278	55.083	44.528	0.111	0.000	0.000	0.000	0.000	0.000	0.000	0.010	pg162_def.cx9a2e_ser7
0.083	47.222	52.583	0.111	0.000	0.000	0.000	0.000	0.000	0.000	0.010	pg162_def.cx9a2f_ser7
0.194	44.194	55.528	0.083	0.000	0.000	0.000	0.000	0.000	0.000	0.009	pg162_def.cx9a2g_ser7
qp100.L2
- qp100.L2: point queries with 100 insert/s per client
- Legend for results is here.
- Each entry lists the percentage of responses that fit in that bucket (slower than max time for previous bucket, faster than min time for next bucket).
Query response time histogram
256us	1ms	4ms	16ms	64ms	256ms	1s	4s	16s	gt	max	tag
0.000	0.368	97.661	1.739	0.231	0.001	0.000	0.000	0.000	0.000	0.248	pg162_def.cx9a2_ser7
0.000	0.356	97.658	1.840	0.145	0.001	nonzero	0.000	0.000	0.000	0.338	pg162_def.cx9a2a_ser7
0.000	0.356	99.242	0.396	0.006	0.000	0.000	0.000	0.000	0.000	0.033	pg162_def.cx9a2b_ser7
0.000	0.336	97.612	1.891	0.160	0.001	0.000	0.000	0.000	0.000	0.103	pg162_def.cx9a2c_ser7
0.000	0.358	98.155	1.263	0.221	0.004	nonzero	0.000	0.000	0.000	0.305	pg162_def.cx9a2e_ser7
0.000	0.360	99.549	0.090	nonzero	0.000	0.000	0.000	0.000	0.000	0.048	pg162_def.cx9a2f_ser7
0.000	0.327	99.598	0.074	nonzero	0.000	0.000	0.000	0.000	0.000	0.017	pg162_def.cx9a2g_ser7
Insert response time histogram
256us	1ms	4ms	16ms	64ms	256ms	1s	4s	16s	gt	max	tag
0.000	0.000	0.000	82.972	12.667	4.361	0.000	0.000	0.000	0.000	0.241	pg162_def.cx9a2_ser7
0.000	0.000	0.000	83.889	12.083	4.000	0.028	0.000	0.000	0.000	0.291	pg162_def.cx9a2a_ser7
0.000	0.000	0.000	90.361	9.611	0.028	0.000	0.000	0.000	0.000	0.065	pg162_def.cx9a2b_ser7
0.000	0.000	0.000	82.889	12.833	4.278	0.000	0.000	0.000	0.000	0.207	pg162_def.cx9a2c_ser7
0.000	0.000	0.000	85.389	9.722	4.722	0.167	0.000	0.000	0.000	0.323	pg162_def.cx9a2e_ser7
0.000	0.000	0.000	93.139	6.833	0.028	0.000	0.000	0.000	0.000	0.073	pg162_def.cx9a2f_ser7
0.000	0.000	0.000	94.194	5.806	0.000	0.000	0.000	0.000	0.000	0.036	pg162_def.cx9a2g_ser7
Delete response time histogram
256us	1ms	4ms	16ms	64ms	256ms	1s	4s	16s	gt	max	tag
0.111	44.500	54.528	0.861	0.000	0.000	0.000	0.000	0.000	0.000	0.013	pg162_def.cx9a2_ser7
0.222	42.278	56.639	0.861	0.000	0.000	0.000	0.000	0.000	0.000	0.012	pg162_def.cx9a2a_ser7
0.083	43.194	56.667	0.056	0.000	0.000	0.000	0.000	0.000	0.000	0.007	pg162_def.cx9a2b_ser7
0.111	40.861	58.611	0.417	0.000	0.000	0.000	0.000	0.000	0.000	0.012	pg162_def.cx9a2c_ser7
0.111	38.861	60.278	0.750	0.000	0.000	0.000	0.000	0.000	0.000	0.012	pg162_def.cx9a2e_ser7
0.389	41.111	58.500	0.000	0.000	0.000	0.000	0.000	0.000	0.000	0.003	pg162_def.cx9a2f_ser7
0.167	46.083	53.694	0.056	0.000	0.000	0.000	0.000	0.000	0.000	0.010	pg162_def.cx9a2g_ser7
qr500.L3
- qr500.L3: range queries with 500 insert/s per client
- Legend for results is here.
- Each entry lists the percentage of responses that fit in that bucket (slower than max time for previous bucket, faster than min time for next bucket).
Query response time histogram
256us	1ms	4ms	16ms	64ms	256ms	1s	4s	16s	gt	max	tag
99.987	0.013	nonzero	nonzero	0.000	0.000	0.000	0.000	0.000	0.000	0.011	pg162_def.cx9a2_ser7
99.984	0.015	nonzero	nonzero	0.000	0.000	0.000	0.000	0.000	0.000	0.012	pg162_def.cx9a2a_ser7
99.986	0.014	nonzero	nonzero	0.000	0.000	0.000	0.000	0.000	0.000	0.011	pg162_def.cx9a2b_ser7
99.984	0.016	nonzero	nonzero	0.000	0.000	0.000	0.000	0.000	0.000	0.010	pg162_def.cx9a2c_ser7
99.985	0.015	nonzero	nonzero	0.000	0.000	0.000	0.000	0.000	0.000	0.011	pg162_def.cx9a2e_ser7
99.987	0.013	nonzero	nonzero	0.000	0.000	0.000	0.000	0.000	0.000	0.010	pg162_def.cx9a2f_ser7
99.987	0.013	nonzero	nonzero	0.000	0.000	0.000	0.000	0.000	0.000	0.011	pg162_def.cx9a2g_ser7
Insert response time histogram
256us	1ms	4ms	16ms	64ms	256ms	1s	4s	16s	gt	max	tag
0.000	0.000	0.000	82.506	15.061	2.433	0.000	0.000	0.000	0.000	0.187	pg162_def.cx9a2_ser7
0.000	0.000	0.000	76.494	22.078	1.428	0.000	0.000	0.000	0.000	0.131	pg162_def.cx9a2a_ser7
0.000	0.000	0.000	76.906	22.917	0.178	0.000	0.000	0.000	0.000	0.093	pg162_def.cx9a2b_ser7
0.000	0.000	0.000	79.517	19.833	0.650	0.000	0.000	0.000	0.000	0.108	pg162_def.cx9a2c_ser7
0.000	0.000	0.000	84.661	14.983	0.356	0.000	0.000	0.000	0.000	0.149	pg162_def.cx9a2e_ser7
0.000	0.000	0.000	78.139	21.861	0.000	0.000	0.000	0.000	0.000	0.033	pg162_def.cx9a2f_ser7
0.000	0.000	0.000	86.550	13.450	0.000	0.000	0.000	0.000	0.000	0.029	pg162_def.cx9a2g_ser7
Delete response time histogram
256us	1ms	4ms	16ms	64ms	256ms	1s	4s	16s	gt	max	tag
0.139	11.950	52.544	35.361	0.006	0.000	0.000	0.000	0.000	0.000	0.017	pg162_def.cx9a2_ser7
0.061	12.672	53.661	33.606	0.000	0.000	0.000	0.000	0.000	0.000	0.016	pg162_def.cx9a2a_ser7
0.417	12.561	52.011	35.006	0.006	0.000	0.000	0.000	0.000	0.000	0.017	pg162_def.cx9a2b_ser7
0.372	10.111	53.850	35.661	0.006	0.000	0.000	0.000	0.000	0.000	0.018	pg162_def.cx9a2c_ser7
0.206	12.850	54.722	32.222	0.000	0.000	0.000	0.000	0.000	0.000	0.013	pg162_def.cx9a2e_ser7
0.289	10.744	58.183	30.778	0.006	0.000	0.000	0.000	0.000	0.000	0.017	pg162_def.cx9a2f_ser7
0.222	11.811	52.283	35.683	0.000	0.000	0.000	0.000	0.000	0.000	0.011	pg162_def.cx9a2g_ser7
qp500.L4
- qp500.L4: point queries with 500 insert/s per client
- Legend for results is here.
- Each entry lists the percentage of responses that fit in that bucket (slower than max time for previous bucket, faster than min time for next bucket).
Query response time histogram
256us	1ms	4ms	16ms	64ms	256ms	1s	4s	16s	gt	max	tag
0.000	0.147	99.050	0.658	0.145	nonzero	0.000	0.000	0.000	0.000	0.079	pg162_def.cx9a2_ser7
0.000	0.157	98.030	1.725	0.087	0.001	0.000	0.000	0.000	0.000	0.236	pg162_def.cx9a2a_ser7
0.000	0.132	99.511	0.357	nonzero	0.000	0.000	0.000	0.000	0.000	0.017	pg162_def.cx9a2b_ser7
0.000	0.125	99.599	0.276	nonzero	0.000	0.000	0.000	0.000	0.000	0.017	pg162_def.cx9a2c_ser7
0.000	0.130	98.937	0.900	0.033	nonzero	0.000	0.000	0.000	0.000	0.097	pg162_def.cx9a2e_ser7
0.000	0.129	99.549	0.322	nonzero	0.000	0.000	0.000	0.000	0.000	0.018	pg162_def.cx9a2f_ser7
0.000	0.149	99.535	0.316	0.000	0.000	0.000	0.000	0.000	0.000	0.015	pg162_def.cx9a2g_ser7
Insert response time histogram
256us	1ms	4ms	16ms	64ms	256ms	1s	4s	16s	gt	max	tag
0.000	0.000	0.000	95.594	2.494	1.911	0.000	0.000	0.000	0.000	0.179	pg162_def.cx9a2_ser7
0.000	0.000	0.000	87.439	12.033	0.528	0.000	0.000	0.000	0.000	0.237	pg162_def.cx9a2a_ser7
0.000	0.000	0.000	92.367	7.633	0.000	0.000	0.000	0.000	0.000	0.031	pg162_def.cx9a2b_ser7
0.000	0.000	0.000	94.156	5.844	0.000	0.000	0.000	0.000	0.000	0.036	pg162_def.cx9a2c_ser7
0.000	0.000	0.000	91.383	8.433	0.183	0.000	0.000	0.000	0.000	0.204	pg162_def.cx9a2e_ser7
0.000	0.000	0.000	92.689	7.311	0.000	0.000	0.000	0.000	0.000	0.033	pg162_def.cx9a2f_ser7
0.000	0.000	0.000	93.578	6.422	0.000	0.000	0.000	0.000	0.000	0.033	pg162_def.cx9a2g_ser7
Delete response time histogram
256us	1ms	4ms	16ms	64ms	256ms	1s	4s	16s	gt	max	tag
0.133	14.628	52.344	32.889	0.006	0.000	0.000	0.000	0.000	0.000	0.016	pg162_def.cx9a2_ser7
0.750	12.533	55.128	31.589	0.000	0.000	0.000	0.000	0.000	0.000	0.013	pg162_def.cx9a2a_ser7
0.267	11.667	55.333	32.733	0.000	0.000	0.000	0.000	0.000	0.000	0.010	pg162_def.cx9a2b_ser7
0.272	11.350	57.539	30.839	0.000	0.000	0.000	0.000	0.000	0.000	0.013	pg162_def.cx9a2c_ser7
0.044	12.861	56.028	31.067	0.000	0.000	0.000	0.000	0.000	0.000	0.012	pg162_def.cx9a2e_ser7
0.500	11.794	58.539	29.167	0.000	0.000	0.000	0.000	0.000	0.000	0.010	pg162_def.cx9a2f_ser7
0.144	14.689	53.628	31.539	0.000	0.000	0.000	0.000	0.000	0.000	0.015	pg162_def.cx9a2g_ser7
qr1000.L5
- qr1000.L5: range queries with 1000 insert/s per client
- Legend for results is here.
- Each entry lists the percentage of responses that fit in that bucket (slower than max time for previous bucket, faster than min time for next bucket).
Query response time histogram
256us	1ms	4ms	16ms	64ms	256ms	1s	4s	16s	gt	max	tag
99.976	0.023	0.001	nonzero	0.000	0.000	0.000	0.000	0.000	0.000	0.012	pg162_def.cx9a2_ser7
99.976	0.023	nonzero	nonzero	0.000	nonzero	0.000	0.000	0.000	0.000	0.117	pg162_def.cx9a2a_ser7
99.977	0.023	nonzero	nonzero	0.000	nonzero	0.000	0.000	0.000	0.000	0.090	pg162_def.cx9a2b_ser7
99.977	0.023	nonzero	nonzero	nonzero	0.000	0.000	0.000	0.000	0.000	0.060	pg162_def.cx9a2c_ser7
99.976	0.023	nonzero	nonzero	nonzero	0.000	0.000	0.000	0.000	0.000	0.016	pg162_def.cx9a2e_ser7
99.978	0.022	nonzero	nonzero	nonzero	0.000	0.000	0.000	0.000	0.000	0.036	pg162_def.cx9a2f_ser7
99.977	0.022	nonzero	nonzero	0.000	0.000	0.000	0.000	0.000	0.000	0.011	pg162_def.cx9a2g_ser7
Insert response time histogram
256us	1ms	4ms	16ms	64ms	256ms	1s	4s	16s	gt	max	tag
0.000	0.000	0.000	80.169	16.611	3.219	0.000	0.000	0.000	0.000	0.184	pg162_def.cx9a2_ser7
0.000	0.000	0.000	86.708	11.983	1.308	0.000	0.000	0.000	0.000	0.187	pg162_def.cx9a2a_ser7
0.000	0.000	0.000	93.303	6.694	0.003	0.000	0.000	0.000	0.000	0.207	pg162_def.cx9a2b_ser7
0.000	0.000	0.000	92.361	7.636	0.003	0.000	0.000	0.000	0.000	0.182	pg162_def.cx9a2c_ser7
0.000	0.000	0.000	87.558	10.528	1.914	0.000	0.000	0.000	0.000	0.175	pg162_def.cx9a2e_ser7
0.000	0.000	0.000	93.503	6.494	0.003	0.000	0.000	0.000	0.000	0.154	pg162_def.cx9a2f_ser7
0.000	0.000	0.000	93.281	6.717	0.003	0.000	0.000	0.000	0.000	0.078	pg162_def.cx9a2g_ser7
Delete response time histogram
256us	1ms	4ms	16ms	64ms	256ms	1s	4s	16s	gt	max	tag
0.158	4.975	28.733	64.894	1.239	0.000	0.000	0.000	0.000	0.000	0.028	pg162_def.cx9a2_ser7
0.083	4.864	25.131	69.908	0.014	0.000	0.000	0.000	0.000	0.000	0.018	pg162_def.cx9a2a_ser7
0.025	5.175	26.397	68.397	0.006	0.000	0.000	0.000	0.000	0.000	0.017	pg162_def.cx9a2b_ser7
0.125	4.581	27.706	67.581	0.008	0.000	0.000	0.000	0.000	0.000	0.019	pg162_def.cx9a2c_ser7
0.044	6.078	25.081	68.642	0.156	0.000	0.000	0.000	0.000	0.000	0.026	pg162_def.cx9a2e_ser7
0.083	5.058	26.306	68.544	0.008	0.000	0.000	0.000	0.000	0.000	0.018	pg162_def.cx9a2f_ser7
0.086	5.139	28.372	66.400	0.003	0.000	0.000	0.000	0.000	0.000	0.018	pg162_def.cx9a2g_ser7
qp1000.L6
- qp1000.L6: point queries with 1000 insert/s per client
- Legend for results is here.
- Each entry lists the percentage of responses that fit in that bucket (slower than max time for previous bucket, faster than min time for next bucket).
Query response time histogram
256us	1ms	4ms	16ms	64ms	256ms	1s	4s	16s	gt	max	tag
0.000	0.042	98.135	1.674	0.149	nonzero	0.000	0.000	0.000	0.000	0.074	pg162_def.cx9a2_ser7
0.000	0.045	98.761	1.192	0.002	0.000	0.000	0.000	0.000	0.000	0.035	pg162_def.cx9a2a_ser7
0.000	0.047	98.012	1.834	0.107	0.000	0.000	0.000	0.000	0.000	0.044	pg162_def.cx9a2b_ser7
0.000	0.046	98.763	1.190	0.002	0.000	0.000	0.000	0.000	0.000	0.040	pg162_def.cx9a2c_ser7
0.000	0.045	98.714	1.239	0.002	0.000	0.000	0.000	0.000	0.000	0.036	pg162_def.cx9a2e_ser7
0.000	0.049	98.749	1.200	0.001	0.000	0.000	0.000	0.000	0.000	0.035	pg162_def.cx9a2f_ser7
0.000	0.040	98.677	1.281	0.002	0.000	0.000	0.000	0.000	0.000	0.042	pg162_def.cx9a2g_ser7
Insert response time histogram
256us	1ms	4ms	16ms	64ms	256ms	1s	4s	16s	gt	max	tag
0.000	0.000	0.000	92.358	6.819	0.822	0.000	0.000	0.000	0.000	0.113	pg162_def.cx9a2_ser7
0.000	0.000	0.000	94.164	5.836	0.000	0.000	0.000	0.000	0.000	0.053	pg162_def.cx9a2a_ser7
0.000	0.000	0.000	91.686	7.633	0.681	0.000	0.000	0.000	0.000	0.189	pg162_def.cx9a2b_ser7
0.000	0.000	0.000	95.083	4.914	0.000	0.003	0.000	0.000	0.000	0.309	pg162_def.cx9a2c_ser7
0.000	0.000	0.000	94.186	5.814	0.000	0.000	0.000	0.000	0.000	0.053	pg162_def.cx9a2e_ser7
0.000	0.000	0.000	94.467	5.531	0.003	0.000	0.000	0.000	0.000	0.071	pg162_def.cx9a2f_ser7
0.000	0.000	0.000	93.731	6.269	0.000	0.000	0.000	0.000	0.000	0.052	pg162_def.cx9a2g_ser7
Delete response time histogram
256us	1ms	4ms	16ms	64ms	256ms	1s	4s	16s	gt	max	tag
0.061	6.167	25.136	68.606	0.031	0.000	0.000	0.000	0.000	0.000	0.021	pg162_def.cx9a2_ser7
0.061	7.211	25.250	67.475	0.003	0.000	0.000	0.000	0.000	0.000	0.019	pg162_def.cx9a2a_ser7
0.197	4.850	26.944	67.983	0.025	0.000	0.000	0.000	0.000	0.000	0.021	pg162_def.cx9a2b_ser7
0.147	5.514	30.100	64.239	0.000	0.000	0.000	0.000	0.000	0.000	0.014	pg162_def.cx9a2c_ser7
0.094	5.472	27.719	66.714	0.000	0.000	0.000	0.000	0.000	0.000	0.015	pg162_def.cx9a2e_ser7
0.147	4.878	27.825	67.147	0.003	0.000	0.000	0.000	0.000	0.000	0.016	pg162_def.cx9a2f_ser7
0.319	6.236	25.294	68.150	0.000	0.000	0.000	0.000	0.000	0.000	0.014	pg162_def.cx9a2g_ser7