Introduction
This is a report for the insert benchmark with 30M docs and 1 client(s). It is generated by scripts (bash, awk, sed) and Tufte might not be impressed. An overview of the insert benchmark is here and a short update is here. Below, by DBMS, I mean DBMS+version.config. An example is my8020.c10b40 where my means MySQL, 8020 is version 8.0.20 and c10b40 is the name for the configuration file.
The test server has 8 AMD cores, 16G RAM and an NVMe SSD. It is described here as the Beelink. The benchmark was run with 1 client and there were 1 or 3 connections per client (1 for queries or inserts without rate limits, 1+1 for rate limited inserts+deletes). It uses 1 table. It loads 30M rows per table without secondary indexes, creates 3 secondary indexes per table, then inserts 80m+20m rows per table with a delete per insert to avoid growing the table. It then does 6 read+write tests for 3600s each that do queries as fast as possible with 100,100,500,500,1000,1000 inserts/s and the same for deletes/s per client concurrent with the queries. The database is cached in memory. Clients and the DBMS share one server. The per-database configs are in the per-database subdirectories here.
The tested DBMS are:
- pg162_def.cx9a2a_bee - Postgres 16.2, cx9a2a config that adds autovacuum_vacuum_cost_delay= 1ms
- my8036_rel.cz10a_bee - MySQL 8.0.36 with InnoDB, rel build, cz10a_bee config
- fbmy8028_rel_221222.cza1_bee - MyRocks 8.0.28 from code as of 2023-12-22 at git hash 2ad105fc, RocksDB 8.7.0 at git hash 29005f0b, cza1_bee config
Contents
- Summary
- l.i0: load without secondary indexes
- l.x: create secondary indexes
- l.i1: continue load after secondary indexes created with 50 inserts per transaction
- l.i2: continue load after secondary indexes created with 5 inserts per transaction
- qr100.L1: range queries with 100 insert/s per client
- qp100.L2: point queries with 100 insert/s per client
- qr500.L3: range queries with 500 insert/s per client
- qp500.L4: point queries with 500 insert/s per client
- qr1000.L5: range queries with 1000 insert/s per client
- qp1000.L6: point queries with 1000 insert/s per client
Summary
The numbers are inserts/s for l.i0, l.i1 and l.i2, indexed docs (or rows) /s for l.x and queries/s for qr100, qp100 thru qr1000, qp1000" The values are the average rate over the entire test for inserts (IPS) and queries (QPS). The range of values for IPS and QPS is split into 3 parts: bottom 25%, middle 50%, top 25%. Values in the bottom 25% have a red background, values in the top 25% have a green background and values in the middle have no color. A gray background is used for values that can be ignored because the DBMS did not sustain the target insert rate. Red backgrounds are not used when the minimum value is within 80% of the max value.
| dbms | l.i0 | l.x | l.i1 | l.i2 | qr100 | qp100 | qr500 | qp500 | qr1000 | qp1000 |
|---|---|---|---|---|---|---|---|---|---|---|
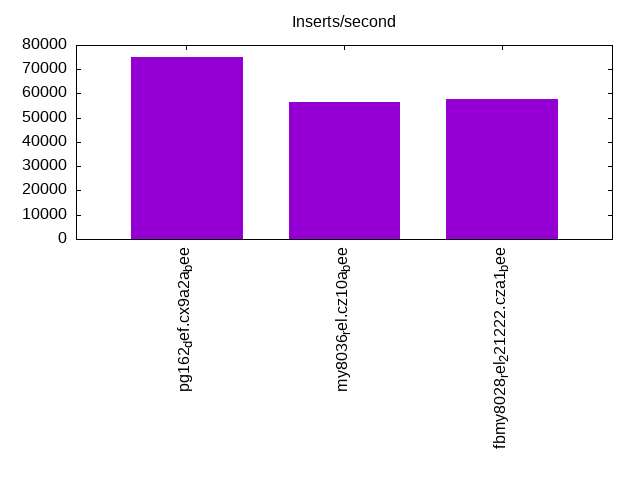
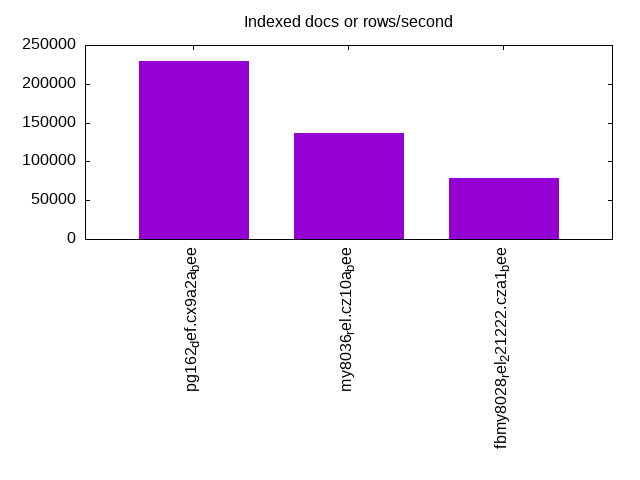
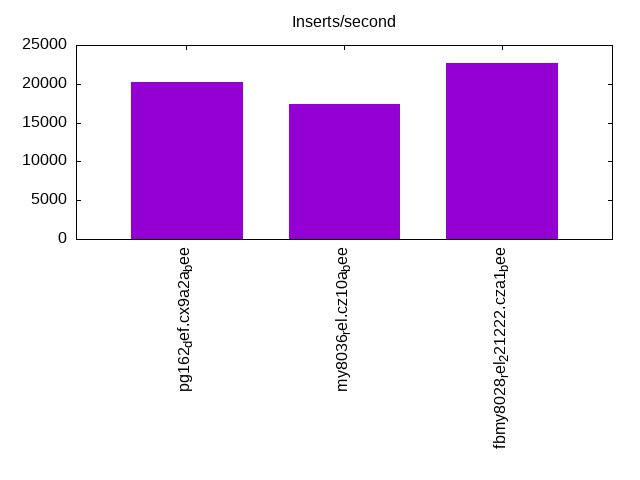
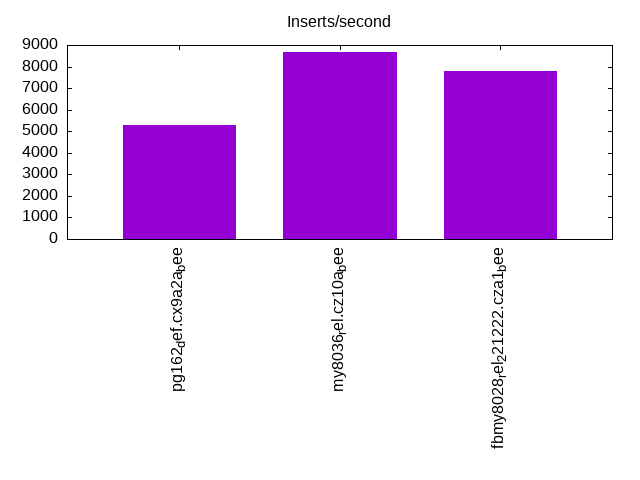
| pg162_def.cx9a2a_bee | 75000 | 229008 | 20222 | 5304 | 8858 | 3448 | 8434 | 3445 | 8520 | 3466 |
| my8036_rel.cz10a_bee | 56391 | 136987 | 17418 | 8669 | 3529 | 2843 | 3507 | 2794 | 3520 | 2827 |
| fbmy8028_rel_221222.cza1_bee | 57692 | 78125 | 22676 | 7800 | 1717 | 2444 | 1360 | 2423 | 1373 | 2392 |
This table has relative throughput, throughput for the DBMS relative to the DBMS in the first line, using the absolute throughput from the previous table. Values less than 0.95 have a yellow background. Values greater than 1.05 have a blue background.
| dbms | l.i0 | l.x | l.i1 | l.i2 | qr100 | qp100 | qr500 | qp500 | qr1000 | qp1000 |
|---|---|---|---|---|---|---|---|---|---|---|
| pg162_def.cx9a2a_bee | 1.00 | 1.00 | 1.00 | 1.00 | 1.00 | 1.00 | 1.00 | 1.00 | 1.00 | 1.00 |
| my8036_rel.cz10a_bee | 0.75 | 0.60 | 0.86 | 1.63 | 0.40 | 0.82 | 0.42 | 0.81 | 0.41 | 0.82 |
| fbmy8028_rel_221222.cza1_bee | 0.77 | 0.34 | 1.12 | 1.47 | 0.19 | 0.71 | 0.16 | 0.70 | 0.16 | 0.69 |
This lists the average rate of inserts/s for the tests that do inserts concurrent with queries. For such tests the query rate is listed in the table above. The read+write tests are setup so that the insert rate should match the target rate every second. Cells that are not at least 95% of the target have a red background to indicate a failure to satisfy the target.
| dbms | qr100.L1 | qp100.L2 | qr500.L3 | qp500.L4 | qr1000.L5 | qp1000.L6 |
|---|---|---|---|---|---|---|
| pg162_def.cx9a2a_bee | 100 | 100 | 499 | 499 | 998 | 999 |
| my8036_rel.cz10a_bee | 100 | 100 | 498 | 499 | 998 | 998 |
| fbmy8028_rel_221222.cza1_bee | 100 | 100 | 499 | 499 | 998 | 998 |
| target | 100 | 100 | 500 | 500 | 1000 | 1000 |
l.i0
l.i0: load without secondary indexes. Graphs for performance per 1-second interval are here.
Average throughput:
Insert response time histogram: each cell has the percentage of responses that take <= the time in the header and max is the max response time in seconds. For the max column values in the top 25% of the range have a red background and in the bottom 25% of the range have a green background. The red background is not used when the min value is within 80% of the max value.
| dbms | 256us | 1ms | 4ms | 16ms | 64ms | 256ms | 1s | 4s | 16s | gt | max |
|---|---|---|---|---|---|---|---|---|---|---|---|
| pg162_def.cx9a2a_bee | 100.000 | 0.003 | |||||||||
| my8036_rel.cz10a_bee | 99.415 | 0.441 | 0.141 | 0.003 | 0.071 | ||||||
| fbmy8028_rel_221222.cza1_bee | 99.724 | 0.196 | 0.078 | 0.002 | 0.080 |
Performance metrics for the DBMS listed above. Some are normalized by throughput, others are not. Legend for results is here.
ips	qps	rps	rmbps	wps	wmbps	rpq	rkbpq	wpi	wkbpi	csps	cpups	cspq	cpupq	dbgb1	dbgb2	rss	maxop	p50	p99	tag
75000	0	0	0.0	87.2	32.0	0.000	0.000	0.001	0.437	9257	23.2	0.123	25	2.9	7.8	2.9	0.003	75147	73217	pg162_def.cx9a2a_bee
56391	0	0	0.0	244.2	18.8	0.000	0.000	0.004	0.342	6587	20.5	0.117	29	2.0	18.6	3.0	0.071	56720	51438	my8036_rel.cz10a_bee
57692	0	0	0.0	36.5	11.8	0.000	0.000	0.001	0.210	6057	22.2	0.105	31	0.9	2.7	0.6	0.080	57837	52141	fbmy8028_rel_221222.cza1_bee
l.x
l.x: create secondary indexes.
Average throughput:
Performance metrics for the DBMS listed above. Some are normalized by throughput, others are not. Legend for results is here.
ips	qps	rps	rmbps	wps	wmbps	rpq	rkbpq	wpi	wkbpi	csps	cpups	cspq	cpupq	dbgb1	dbgb2	rss	maxop	p50	p99	tag
229008	0	0	0.0	171.3	79.7	0.000	0.000	0.001	0.357	589	11.4	0.003	4	5.8	13.3	3.1	0.003	NA	NA	pg162_def.cx9a2a_bee
136987	0	704	44.6	2477.4	150.0	0.005	0.333	0.018	1.121	9758	43.2	0.071	25	4.5	21.1	5.3	0.003	NA	NA	my8036_rel.cz10a_bee
78125	0	0	0.0	31.3	12.1	0.000	0.000	0.000	0.158	363	11.6	0.005	12	2.0	3.8	2.7	0.003	NA	NA	fbmy8028_rel_221222.cza1_bee
l.i1
l.i1: continue load after secondary indexes created with 50 inserts per transaction. Graphs for performance per 1-second interval are here.
Average throughput:
Insert response time histogram: each cell has the percentage of responses that take <= the time in the header and max is the max response time in seconds. For the max column values in the top 25% of the range have a red background and in the bottom 25% of the range have a green background. The red background is not used when the min value is within 80% of the max value.
| dbms | 256us | 1ms | 4ms | 16ms | 64ms | 256ms | 1s | 4s | 16s | gt | max |
|---|---|---|---|---|---|---|---|---|---|---|---|
| pg162_def.cx9a2a_bee | 99.998 | 0.002 | nonzero | 0.036 | |||||||
| my8036_rel.cz10a_bee | 97.207 | 2.704 | 0.088 | 0.001 | 0.105 | ||||||
| fbmy8028_rel_221222.cza1_bee | 99.669 | 0.273 | 0.056 | 0.003 | 0.104 |
Delete response time histogram: each cell has the percentage of responses that take <= the time in the header and max is the max response time in seconds. For the max column values in the top 25% of the range have a red background and in the bottom 25% of the range have a green background. The red background is not used when the min value is within 80% of the max value.
| dbms | 256us | 1ms | 4ms | 16ms | 64ms | 256ms | 1s | 4s | 16s | gt | max |
|---|---|---|---|---|---|---|---|---|---|---|---|
| pg162_def.cx9a2a_bee | 0.103 | 81.961 | 2.923 | 15.013 | nonzero | 0.036 | |||||
| my8036_rel.cz10a_bee | 98.166 | 1.799 | 0.035 | nonzero | 0.103 | ||||||
| fbmy8028_rel_221222.cza1_bee | 99.658 | 0.276 | 0.062 | 0.003 | 0.111 |
Performance metrics for the DBMS listed above. Some are normalized by throughput, others are not. Legend for results is here.
ips	qps	rps	rmbps	wps	wmbps	rpq	rkbpq	wpi	wkbpi	csps	cpups	cspq	cpupq	dbgb1	dbgb2	rss	maxop	p50	p99	tag
20222	0	27	0.1	87.7	25.1	0.001	0.006	0.004	1.271	9841	22.0	0.487	87	8.2	47.2	8.0	0.036	28469	4944	pg162_def.cx9a2a_bee
17418	0	32	0.5	2351.5	87.5	0.002	0.029	0.135	5.144	14764	36.5	0.848	168	6.5	23.3	7.8	0.105	17929	8640	my8036_rel.cz10a_bee
22676	0	104	0.5	107.5	40.4	0.005	0.025	0.005	1.826	10082	45.9	0.445	162	2.7	4.4	8.6	0.104	22635	20120	fbmy8028_rel_221222.cza1_bee
l.i2
l.i2: continue load after secondary indexes created with 5 inserts per transaction. Graphs for performance per 1-second interval are here.
Average throughput:
Insert response time histogram: each cell has the percentage of responses that take <= the time in the header and max is the max response time in seconds. For the max column values in the top 25% of the range have a red background and in the bottom 25% of the range have a green background. The red background is not used when the min value is within 80% of the max value.
| dbms | 256us | 1ms | 4ms | 16ms | 64ms | 256ms | 1s | 4s | 16s | gt | max |
|---|---|---|---|---|---|---|---|---|---|---|---|
| pg162_def.cx9a2a_bee | 17.197 | 82.800 | 0.003 | nonzero | nonzero | 0.022 | |||||
| my8036_rel.cz10a_bee | 99.574 | 0.196 | 0.228 | 0.002 | nonzero | 0.102 | |||||
| fbmy8028_rel_221222.cza1_bee | 99.811 | 0.104 | 0.081 | 0.004 | nonzero | 0.080 |
Delete response time histogram: each cell has the percentage of responses that take <= the time in the header and max is the max response time in seconds. For the max column values in the top 25% of the range have a red background and in the bottom 25% of the range have a green background. The red background is not used when the min value is within 80% of the max value.
| dbms | 256us | 1ms | 4ms | 16ms | 64ms | 256ms | 1s | 4s | 16s | gt | max |
|---|---|---|---|---|---|---|---|---|---|---|---|
| pg162_def.cx9a2a_bee | 54.038 | 26.823 | 14.196 | 4.943 | nonzero | 0.021 | |||||
| my8036_rel.cz10a_bee | 99.710 | 0.064 | 0.224 | 0.002 | nonzero | 0.102 | |||||
| fbmy8028_rel_221222.cza1_bee | 99.770 | 0.143 | 0.082 | 0.005 | 0.001 | 0.103 |
Performance metrics for the DBMS listed above. Some are normalized by throughput, others are not. Legend for results is here.
ips	qps	rps	rmbps	wps	wmbps	rpq	rkbpq	wpi	wkbpi	csps	cpups	cspq	cpupq	dbgb1	dbgb2	rss	maxop	p50	p99	tag
5304	0	0	0.0	35.9	7.8	0.000	0.000	0.007	1.509	25308	19.6	4.772	296	8.2	48.3	5.8	0.022	1618	849	pg162_def.cx9a2a_bee
8669	0	0	0.0	1335.5	46.5	0.000	0.000	0.154	5.497	37982	35.2	4.381	325	6.5	23.3	7.8	0.102	8685	7600	my8036_rel.cz10a_bee
7800	0	40	0.2	95.9	34.9	0.005	0.030	0.012	4.580	32715	43.2	4.194	443	2.2	2.4	8.7	0.080	7783	6867	fbmy8028_rel_221222.cza1_bee
qr100.L1
qr100.L1: range queries with 100 insert/s per client. Graphs for performance per 1-second interval are here.
Average throughput:
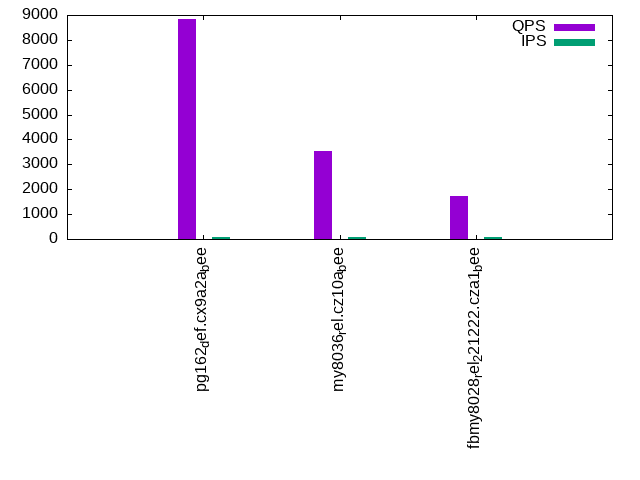
Query response time histogram: each cell has the percentage of responses that take <= the time in the header and max is the max response time in seconds. For max values in the top 25% of the range have a red background and in the bottom 25% of the range have a green background. The red background is not used when the min value is within 80% of the max value.
| dbms | 256us | 1ms | 4ms | 16ms | 64ms | 256ms | 1s | 4s | 16s | gt | max |
|---|---|---|---|---|---|---|---|---|---|---|---|
| pg162_def.cx9a2a_bee | 99.959 | 0.040 | nonzero | 0.003 | |||||||
| my8036_rel.cz10a_bee | 51.557 | 48.442 | nonzero | nonzero | 0.004 | ||||||
| fbmy8028_rel_221222.cza1_bee | 5.829 | 81.660 | 12.511 | nonzero | nonzero | 0.030 |
Insert response time histogram: each cell has the percentage of responses that take <= the time in the header and max is the max response time in seconds. For max values in the top 25% of the range have a red background and in the bottom 25% of the range have a green background. The red background is not used when the min value is within 80% of the max value.
| dbms | 256us | 1ms | 4ms | 16ms | 64ms | 256ms | 1s | 4s | 16s | gt | max |
|---|---|---|---|---|---|---|---|---|---|---|---|
| pg162_def.cx9a2a_bee | 99.806 | 0.194 | 0.008 | ||||||||
| my8036_rel.cz10a_bee | 99.750 | 0.222 | 0.028 | 0.025 | |||||||
| fbmy8028_rel_221222.cza1_bee | 99.403 | 0.542 | 0.056 | 0.018 |
Delete response time histogram: each cell has the percentage of responses that take <= the time in the header and max is the max response time in seconds. For max values in the top 25% of the range have a red background and in the bottom 25% of the range have a green background. The red background is not used when the min value is within 80% of the max value.
| dbms | 256us | 1ms | 4ms | 16ms | 64ms | 256ms | 1s | 4s | 16s | gt | max |
|---|---|---|---|---|---|---|---|---|---|---|---|
| pg162_def.cx9a2a_bee | 0.125 | 32.069 | 66.847 | 0.958 | 0.005 | ||||||
| my8036_rel.cz10a_bee | 99.819 | 0.167 | 0.014 | 0.025 | |||||||
| fbmy8028_rel_221222.cza1_bee | 99.472 | 0.500 | 0.028 | 0.018 |
Performance metrics for the DBMS listed above. Some are normalized by throughput, others are not. Legend for results is here.
ips	qps	rps	rmbps	wps	wmbps	rpq	rkbpq	wpi	wkbpi	csps	cpups	cspq	cpupq	dbgb1	dbgb2	rss	maxop	p50	p99	tag
100	8858	0	0.0	35.8	1.2	0.000	0.000	0.359	12.055	34026	12.8	3.841	116	8.2	45.5	1.1	0.003	8599	8282	pg162_def.cx9a2a_bee
100	3529	0	0.0	79.0	2.0	0.000	0.000	0.792	20.491	14119	12.7	4.001	288	6.5	23.3	7.8	0.004	3500	3310	my8036_rel.cz10a_bee
100	1717	0	0.0	4.3	0.4	0.000	0.000	0.043	4.049	6843	12.5	3.985	582	2.2	2.4	8.7	0.030	1710	1483	fbmy8028_rel_221222.cza1_bee
qp100.L2
qp100.L2: point queries with 100 insert/s per client. Graphs for performance per 1-second interval are here.
Average throughput:
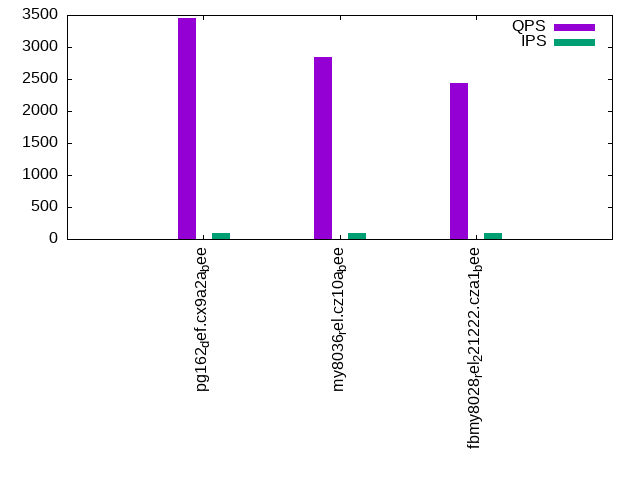
Query response time histogram: each cell has the percentage of responses that take <= the time in the header and max is the max response time in seconds. For max values in the top 25% of the range have a red background and in the bottom 25% of the range have a green background. The red background is not used when the min value is within 80% of the max value.
| dbms | 256us | 1ms | 4ms | 16ms | 64ms | 256ms | 1s | 4s | 16s | gt | max |
|---|---|---|---|---|---|---|---|---|---|---|---|
| pg162_def.cx9a2a_bee | 85.548 | 14.452 | nonzero | 0.003 | |||||||
| my8036_rel.cz10a_bee | 12.182 | 87.816 | 0.002 | nonzero | 0.004 | ||||||
| fbmy8028_rel_221222.cza1_bee | nonzero | 99.992 | 0.007 | 0.001 | 0.010 |
Insert response time histogram: each cell has the percentage of responses that take <= the time in the header and max is the max response time in seconds. For max values in the top 25% of the range have a red background and in the bottom 25% of the range have a green background. The red background is not used when the min value is within 80% of the max value.
| dbms | 256us | 1ms | 4ms | 16ms | 64ms | 256ms | 1s | 4s | 16s | gt | max |
|---|---|---|---|---|---|---|---|---|---|---|---|
| pg162_def.cx9a2a_bee | 99.958 | 0.042 | 0.008 | ||||||||
| my8036_rel.cz10a_bee | 99.694 | 0.292 | 0.014 | 0.023 | |||||||
| fbmy8028_rel_221222.cza1_bee | 99.306 | 0.625 | 0.069 | 0.018 |
Delete response time histogram: each cell has the percentage of responses that take <= the time in the header and max is the max response time in seconds. For max values in the top 25% of the range have a red background and in the bottom 25% of the range have a green background. The red background is not used when the min value is within 80% of the max value.
| dbms | 256us | 1ms | 4ms | 16ms | 64ms | 256ms | 1s | 4s | 16s | gt | max |
|---|---|---|---|---|---|---|---|---|---|---|---|
| pg162_def.cx9a2a_bee | 1.403 | 98.583 | 0.014 | 0.002 | |||||||
| my8036_rel.cz10a_bee | 99.806 | 0.181 | 0.014 | 0.024 | |||||||
| fbmy8028_rel_221222.cza1_bee | 99.542 | 0.403 | 0.056 | 0.018 |
Performance metrics for the DBMS listed above. Some are normalized by throughput, others are not. Legend for results is here.
ips	qps	rps	rmbps	wps	wmbps	rpq	rkbpq	wpi	wkbpi	csps	cpups	cspq	cpupq	dbgb1	dbgb2	rss	maxop	p50	p99	tag
100	3448	0	0.0	62.0	1.5	0.000	0.000	0.621	15.483	14277	13.1	4.141	304	8.2	43.2	1.0	0.003	3421	3308	pg162_def.cx9a2a_bee
100	2843	0	0.0	26.0	0.6	0.000	0.000	0.260	6.384	11926	13.0	4.195	366	6.5	23.3	7.8	0.004	2748	2603	my8036_rel.cz10a_bee
100	2444	14	0.1	4.6	0.5	0.006	0.037	0.046	5.291	10170	13.6	4.162	445	2.2	2.5	9.4	0.010	2413	1998	fbmy8028_rel_221222.cza1_bee
qr500.L3
qr500.L3: range queries with 500 insert/s per client. Graphs for performance per 1-second interval are here.
Average throughput:
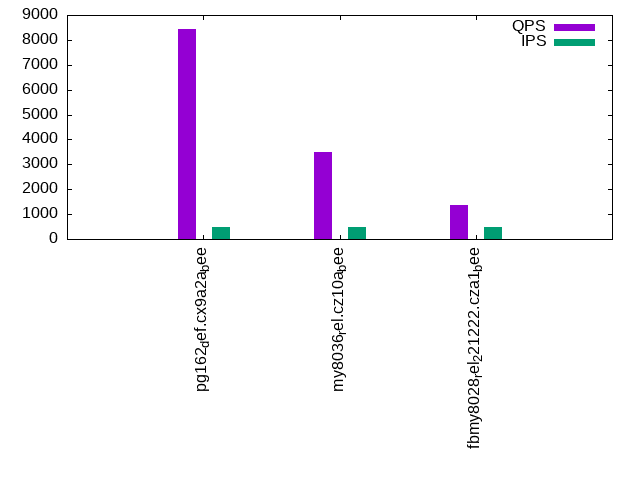
Query response time histogram: each cell has the percentage of responses that take <= the time in the header and max is the max response time in seconds. For max values in the top 25% of the range have a red background and in the bottom 25% of the range have a green background. The red background is not used when the min value is within 80% of the max value.
| dbms | 256us | 1ms | 4ms | 16ms | 64ms | 256ms | 1s | 4s | 16s | gt | max |
|---|---|---|---|---|---|---|---|---|---|---|---|
| pg162_def.cx9a2a_bee | 99.928 | 0.071 | 0.001 | nonzero | 0.012 | ||||||
| my8036_rel.cz10a_bee | 50.717 | 49.282 | 0.001 | nonzero | 0.004 | ||||||
| fbmy8028_rel_221222.cza1_bee | 4.447 | 72.276 | 23.277 | nonzero | nonzero | 0.038 |
Insert response time histogram: each cell has the percentage of responses that take <= the time in the header and max is the max response time in seconds. For max values in the top 25% of the range have a red background and in the bottom 25% of the range have a green background. The red background is not used when the min value is within 80% of the max value.
| dbms | 256us | 1ms | 4ms | 16ms | 64ms | 256ms | 1s | 4s | 16s | gt | max |
|---|---|---|---|---|---|---|---|---|---|---|---|
| pg162_def.cx9a2a_bee | 99.975 | 0.025 | 0.008 | ||||||||
| my8036_rel.cz10a_bee | 98.986 | 0.997 | 0.017 | 0.042 | |||||||
| fbmy8028_rel_221222.cza1_bee | 99.500 | 0.411 | 0.086 | 0.003 | 0.064 |
Delete response time histogram: each cell has the percentage of responses that take <= the time in the header and max is the max response time in seconds. For max values in the top 25% of the range have a red background and in the bottom 25% of the range have a green background. The red background is not used when the min value is within 80% of the max value.
| dbms | 256us | 1ms | 4ms | 16ms | 64ms | 256ms | 1s | 4s | 16s | gt | max |
|---|---|---|---|---|---|---|---|---|---|---|---|
| pg162_def.cx9a2a_bee | 6.506 | 80.289 | 13.197 | 0.008 | 0.005 | ||||||
| my8036_rel.cz10a_bee | 99.619 | 0.367 | 0.014 | 0.049 | |||||||
| fbmy8028_rel_221222.cza1_bee | 99.528 | 0.392 | 0.081 | 0.051 |
Performance metrics for the DBMS listed above. Some are normalized by throughput, others are not. Legend for results is here.
ips	qps	rps	rmbps	wps	wmbps	rpq	rkbpq	wpi	wkbpi	csps	cpups	cspq	cpupq	dbgb1	dbgb2	rss	maxop	p50	p99	tag
499	8434	0	0.0	42.9	2.8	0.000	0.000	0.086	5.756	32566	12.7	3.861	120	8.3	39.8	4.0	0.012	8187	7174	pg162_def.cx9a2a_bee
498	3507	0	0.0	95.6	2.9	0.000	0.000	0.192	6.003	14198	13.7	4.049	313	6.5	23.3	7.8	0.004	3484	3294	my8036_rel.cz10a_bee
499	1360	0	0.0	8.8	2.3	0.000	0.000	0.018	4.678	5624	13.5	4.135	794	2.1	2.9	9.3	0.038	1342	1071	fbmy8028_rel_221222.cza1_bee
qp500.L4
qp500.L4: point queries with 500 insert/s per client. Graphs for performance per 1-second interval are here.
Average throughput:
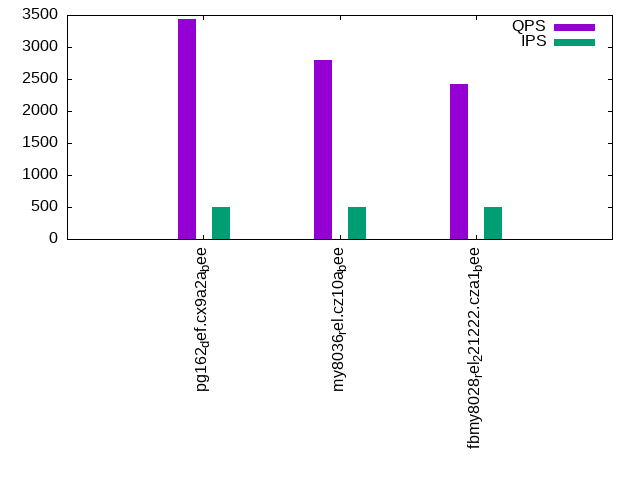
Query response time histogram: each cell has the percentage of responses that take <= the time in the header and max is the max response time in seconds. For max values in the top 25% of the range have a red background and in the bottom 25% of the range have a green background. The red background is not used when the min value is within 80% of the max value.
| dbms | 256us | 1ms | 4ms | 16ms | 64ms | 256ms | 1s | 4s | 16s | gt | max |
|---|---|---|---|---|---|---|---|---|---|---|---|
| pg162_def.cx9a2a_bee | 85.864 | 14.135 | 0.001 | nonzero | 0.022 | ||||||
| my8036_rel.cz10a_bee | 7.642 | 92.354 | 0.004 | nonzero | 0.008 | ||||||
| fbmy8028_rel_221222.cza1_bee | nonzero | 99.994 | 0.006 | nonzero | 0.004 |
Insert response time histogram: each cell has the percentage of responses that take <= the time in the header and max is the max response time in seconds. For max values in the top 25% of the range have a red background and in the bottom 25% of the range have a green background. The red background is not used when the min value is within 80% of the max value.
| dbms | 256us | 1ms | 4ms | 16ms | 64ms | 256ms | 1s | 4s | 16s | gt | max |
|---|---|---|---|---|---|---|---|---|---|---|---|
| pg162_def.cx9a2a_bee | 99.986 | 0.014 | 0.008 | ||||||||
| my8036_rel.cz10a_bee | 98.831 | 1.158 | 0.011 | 0.043 | |||||||
| fbmy8028_rel_221222.cza1_bee | 99.481 | 0.431 | 0.089 | 0.044 |
Delete response time histogram: each cell has the percentage of responses that take <= the time in the header and max is the max response time in seconds. For max values in the top 25% of the range have a red background and in the bottom 25% of the range have a green background. The red background is not used when the min value is within 80% of the max value.
| dbms | 256us | 1ms | 4ms | 16ms | 64ms | 256ms | 1s | 4s | 16s | gt | max |
|---|---|---|---|---|---|---|---|---|---|---|---|
| pg162_def.cx9a2a_bee | 19.314 | 66.133 | 13.914 | 0.639 | 0.005 | ||||||
| my8036_rel.cz10a_bee | 99.650 | 0.344 | 0.006 | 0.049 | |||||||
| fbmy8028_rel_221222.cza1_bee | 99.567 | 0.364 | 0.069 | 0.052 |
Performance metrics for the DBMS listed above. Some are normalized by throughput, others are not. Legend for results is here.
ips	qps	rps	rmbps	wps	wmbps	rpq	rkbpq	wpi	wkbpi	csps	cpups	cspq	cpupq	dbgb1	dbgb2	rss	maxop	p50	p99	tag
499	3445	0	0.0	36.9	3.0	0.000	0.000	0.074	6.125	14400	13.4	4.180	311	8.3	35.4	4.1	0.022	3420	3309	pg162_def.cx9a2a_bee
499	2794	0	0.0	93.3	2.9	0.000	0.000	0.187	5.872	12028	14.0	4.306	401	6.5	23.3	7.8	0.008	2732	2573	my8036_rel.cz10a_bee
499	2423	0	0.0	9.1	2.3	0.000	0.000	0.018	4.716	10173	14.6	4.199	482	2.1	3.3	9.4	0.004	2383	1998	fbmy8028_rel_221222.cza1_bee
qr1000.L5
qr1000.L5: range queries with 1000 insert/s per client. Graphs for performance per 1-second interval are here.
Average throughput:
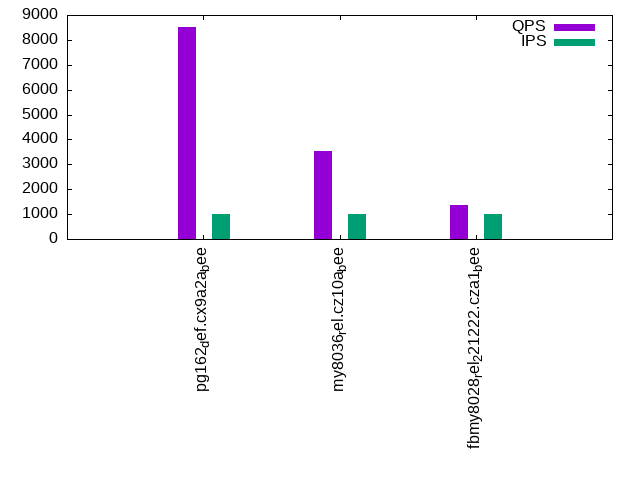
Query response time histogram: each cell has the percentage of responses that take <= the time in the header and max is the max response time in seconds. For max values in the top 25% of the range have a red background and in the bottom 25% of the range have a green background. The red background is not used when the min value is within 80% of the max value.
| dbms | 256us | 1ms | 4ms | 16ms | 64ms | 256ms | 1s | 4s | 16s | gt | max |
|---|---|---|---|---|---|---|---|---|---|---|---|
| pg162_def.cx9a2a_bee | 99.917 | 0.082 | 0.002 | nonzero | nonzero | 0.019 | |||||
| my8036_rel.cz10a_bee | 51.135 | 48.863 | 0.002 | nonzero | 0.005 | ||||||
| fbmy8028_rel_221222.cza1_bee | 4.291 | 71.017 | 24.691 | 0.001 | 0.001 | 0.038 |
Insert response time histogram: each cell has the percentage of responses that take <= the time in the header and max is the max response time in seconds. For max values in the top 25% of the range have a red background and in the bottom 25% of the range have a green background. The red background is not used when the min value is within 80% of the max value.
| dbms | 256us | 1ms | 4ms | 16ms | 64ms | 256ms | 1s | 4s | 16s | gt | max |
|---|---|---|---|---|---|---|---|---|---|---|---|
| pg162_def.cx9a2a_bee | 99.951 | 0.037 | 0.011 | 0.025 | |||||||
| my8036_rel.cz10a_bee | 96.790 | 3.193 | 0.017 | 0.049 | |||||||
| fbmy8028_rel_221222.cza1_bee | 99.583 | 0.331 | 0.086 | 0.064 |
Delete response time histogram: each cell has the percentage of responses that take <= the time in the header and max is the max response time in seconds. For max values in the top 25% of the range have a red background and in the bottom 25% of the range have a green background. The red background is not used when the min value is within 80% of the max value.
| dbms | 256us | 1ms | 4ms | 16ms | 64ms | 256ms | 1s | 4s | 16s | gt | max |
|---|---|---|---|---|---|---|---|---|---|---|---|
| pg162_def.cx9a2a_bee | 2.457 | 74.129 | 20.939 | 2.467 | 0.008 | 0.021 | |||||
| my8036_rel.cz10a_bee | 99.572 | 0.415 | 0.013 | 0.051 | |||||||
| fbmy8028_rel_221222.cza1_bee | 99.614 | 0.303 | 0.082 | 0.001 | 0.079 |
Performance metrics for the DBMS listed above. Some are normalized by throughput, others are not. Legend for results is here.
ips	qps	rps	rmbps	wps	wmbps	rpq	rkbpq	wpi	wkbpi	csps	cpups	cspq	cpupq	dbgb1	dbgb2	rss	maxop	p50	p99	tag
998	8520	0	0.0	37.4	3.6	0.000	0.000	0.038	3.653	33113	13.7	3.887	129	8.3	30.4	7.0	0.019	8436	7127	pg162_def.cx9a2a_bee
998	3520	0	0.0	201.2	6.2	0.000	0.000	0.202	6.388	14726	14.8	4.183	336	6.5	23.3	7.8	0.005	3484	3277	my8036_rel.cz10a_bee
998	1373	0	0.0	14.6	4.8	0.000	0.000	0.015	4.882	5920	15.5	4.313	903	2.1	4.1	9.1	0.038	1327	959	fbmy8028_rel_221222.cza1_bee
qp1000.L6
qp1000.L6: point queries with 1000 insert/s per client. Graphs for performance per 1-second interval are here.
Average throughput:
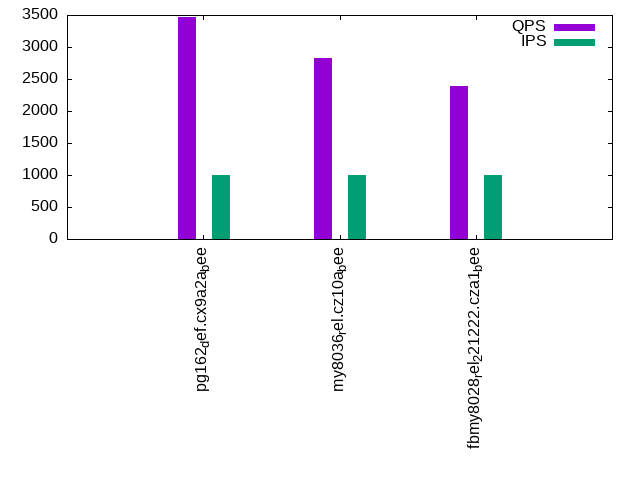
Query response time histogram: each cell has the percentage of responses that take <= the time in the header and max is the max response time in seconds. For max values in the top 25% of the range have a red background and in the bottom 25% of the range have a green background. The red background is not used when the min value is within 80% of the max value.
| dbms | 256us | 1ms | 4ms | 16ms | 64ms | 256ms | 1s | 4s | 16s | gt | max |
|---|---|---|---|---|---|---|---|---|---|---|---|
| pg162_def.cx9a2a_bee | 86.095 | 13.903 | 0.002 | nonzero | 0.005 | ||||||
| my8036_rel.cz10a_bee | 11.794 | 88.197 | 0.009 | nonzero | 0.007 | ||||||
| fbmy8028_rel_221222.cza1_bee | 99.990 | 0.009 | 0.001 | 0.010 |
Insert response time histogram: each cell has the percentage of responses that take <= the time in the header and max is the max response time in seconds. For max values in the top 25% of the range have a red background and in the bottom 25% of the range have a green background. The red background is not used when the min value is within 80% of the max value.
| dbms | 256us | 1ms | 4ms | 16ms | 64ms | 256ms | 1s | 4s | 16s | gt | max |
|---|---|---|---|---|---|---|---|---|---|---|---|
| pg162_def.cx9a2a_bee | 99.989 | 0.011 | 0.014 | ||||||||
| my8036_rel.cz10a_bee | 96.331 | 3.653 | 0.017 | 0.050 | |||||||
| fbmy8028_rel_221222.cza1_bee | 99.593 | 0.318 | 0.089 | 0.055 |
Delete response time histogram: each cell has the percentage of responses that take <= the time in the header and max is the max response time in seconds. For max values in the top 25% of the range have a red background and in the bottom 25% of the range have a green background. The red background is not used when the min value is within 80% of the max value.
| dbms | 256us | 1ms | 4ms | 16ms | 64ms | 256ms | 1s | 4s | 16s | gt | max |
|---|---|---|---|---|---|---|---|---|---|---|---|
| pg162_def.cx9a2a_bee | 9.219 | 74.985 | 13.846 | 1.950 | 0.012 | ||||||
| my8036_rel.cz10a_bee | 99.553 | 0.435 | 0.013 | 0.051 | |||||||
| fbmy8028_rel_221222.cza1_bee | 99.628 | 0.285 | 0.088 | 0.063 |
Performance metrics for the DBMS listed above. Some are normalized by throughput, others are not. Legend for results is here.
ips	qps	rps	rmbps	wps	wmbps	rpq	rkbpq	wpi	wkbpi	csps	cpups	cspq	cpupq	dbgb1	dbgb2	rss	maxop	p50	p99	tag
999	3466	0	0.0	24.2	3.6	0.000	0.000	0.024	3.648	14706	13.9	4.243	321	8.3	28.3	7.6	0.005	3451	3340	pg162_def.cx9a2a_bee
998	2827	0	0.0	198.7	6.1	0.000	0.000	0.199	6.308	12671	15.2	4.482	430	6.5	23.3	7.8	0.007	2749	2573	my8036_rel.cz10a_bee
998	2392	0	0.0	14.0	4.5	0.000	0.001	0.014	4.611	10277	16.4	4.296	548	2.2	2.9	9.1	0.010	2365	1966	fbmy8028_rel_221222.cza1_bee
l.i0
l.i0: load without secondary indexes
Performance metrics for all DBMS, not just the ones listed above. Some are normalized by throughput, others are not. Legend for results is here.
ips	qps	rps	rmbps	wps	wmbps	rpq	rkbpq	wpi	wkbpi	csps	cpups	cspq	cpupq	dbgb1	dbgb2	rss	maxop	p50	p99	tag
75000	0	0	0.0	87.2	32.0	0.000	0.000	0.001	0.437	9257	23.2	0.123	25	2.9	7.8	2.9	0.003	75147	73217	pg162_def.cx9a2a_bee
56391	0	0	0.0	244.2	18.8	0.000	0.000	0.004	0.342	6587	20.5	0.117	29	2.0	18.6	3.0	0.071	56720	51438	my8036_rel.cz10a_bee
57692	0	0	0.0	36.5	11.8	0.000	0.000	0.001	0.210	6057	22.2	0.105	31	0.9	2.7	0.6	0.080	57837	52141	fbmy8028_rel_221222.cza1_bee
l.x
l.x: create secondary indexes
Performance metrics for all DBMS, not just the ones listed above. Some are normalized by throughput, others are not. Legend for results is here.
ips	qps	rps	rmbps	wps	wmbps	rpq	rkbpq	wpi	wkbpi	csps	cpups	cspq	cpupq	dbgb1	dbgb2	rss	maxop	p50	p99	tag
229008	0	0	0.0	171.3	79.7	0.000	0.000	0.001	0.357	589	11.4	0.003	4	5.8	13.3	3.1	0.003	NA	NA	pg162_def.cx9a2a_bee
136987	0	704	44.6	2477.4	150.0	0.005	0.333	0.018	1.121	9758	43.2	0.071	25	4.5	21.1	5.3	0.003	NA	NA	my8036_rel.cz10a_bee
78125	0	0	0.0	31.3	12.1	0.000	0.000	0.000	0.158	363	11.6	0.005	12	2.0	3.8	2.7	0.003	NA	NA	fbmy8028_rel_221222.cza1_bee
l.i1
l.i1: continue load after secondary indexes created with 50 inserts per transaction
Performance metrics for all DBMS, not just the ones listed above. Some are normalized by throughput, others are not. Legend for results is here.
ips	qps	rps	rmbps	wps	wmbps	rpq	rkbpq	wpi	wkbpi	csps	cpups	cspq	cpupq	dbgb1	dbgb2	rss	maxop	p50	p99	tag
20222	0	27	0.1	87.7	25.1	0.001	0.006	0.004	1.271	9841	22.0	0.487	87	8.2	47.2	8.0	0.036	28469	4944	pg162_def.cx9a2a_bee
17418	0	32	0.5	2351.5	87.5	0.002	0.029	0.135	5.144	14764	36.5	0.848	168	6.5	23.3	7.8	0.105	17929	8640	my8036_rel.cz10a_bee
22676	0	104	0.5	107.5	40.4	0.005	0.025	0.005	1.826	10082	45.9	0.445	162	2.7	4.4	8.6	0.104	22635	20120	fbmy8028_rel_221222.cza1_bee
l.i2
l.i2: continue load after secondary indexes created with 5 inserts per transaction
Performance metrics for all DBMS, not just the ones listed above. Some are normalized by throughput, others are not. Legend for results is here.
ips	qps	rps	rmbps	wps	wmbps	rpq	rkbpq	wpi	wkbpi	csps	cpups	cspq	cpupq	dbgb1	dbgb2	rss	maxop	p50	p99	tag
5304	0	0	0.0	35.9	7.8	0.000	0.000	0.007	1.509	25308	19.6	4.772	296	8.2	48.3	5.8	0.022	1618	849	pg162_def.cx9a2a_bee
8669	0	0	0.0	1335.5	46.5	0.000	0.000	0.154	5.497	37982	35.2	4.381	325	6.5	23.3	7.8	0.102	8685	7600	my8036_rel.cz10a_bee
7800	0	40	0.2	95.9	34.9	0.005	0.030	0.012	4.580	32715	43.2	4.194	443	2.2	2.4	8.7	0.080	7783	6867	fbmy8028_rel_221222.cza1_bee
qr100.L1
qr100.L1: range queries with 100 insert/s per client
Performance metrics for all DBMS, not just the ones listed above. Some are normalized by throughput, others are not. Legend for results is here.
ips	qps	rps	rmbps	wps	wmbps	rpq	rkbpq	wpi	wkbpi	csps	cpups	cspq	cpupq	dbgb1	dbgb2	rss	maxop	p50	p99	tag
100	8858	0	0.0	35.8	1.2	0.000	0.000	0.359	12.055	34026	12.8	3.841	116	8.2	45.5	1.1	0.003	8599	8282	pg162_def.cx9a2a_bee
100	3529	0	0.0	79.0	2.0	0.000	0.000	0.792	20.491	14119	12.7	4.001	288	6.5	23.3	7.8	0.004	3500	3310	my8036_rel.cz10a_bee
100	1717	0	0.0	4.3	0.4	0.000	0.000	0.043	4.049	6843	12.5	3.985	582	2.2	2.4	8.7	0.030	1710	1483	fbmy8028_rel_221222.cza1_bee
qp100.L2
qp100.L2: point queries with 100 insert/s per client
Performance metrics for all DBMS, not just the ones listed above. Some are normalized by throughput, others are not. Legend for results is here.
ips	qps	rps	rmbps	wps	wmbps	rpq	rkbpq	wpi	wkbpi	csps	cpups	cspq	cpupq	dbgb1	dbgb2	rss	maxop	p50	p99	tag
100	3448	0	0.0	62.0	1.5	0.000	0.000	0.621	15.483	14277	13.1	4.141	304	8.2	43.2	1.0	0.003	3421	3308	pg162_def.cx9a2a_bee
100	2843	0	0.0	26.0	0.6	0.000	0.000	0.260	6.384	11926	13.0	4.195	366	6.5	23.3	7.8	0.004	2748	2603	my8036_rel.cz10a_bee
100	2444	14	0.1	4.6	0.5	0.006	0.037	0.046	5.291	10170	13.6	4.162	445	2.2	2.5	9.4	0.010	2413	1998	fbmy8028_rel_221222.cza1_bee
qr500.L3
qr500.L3: range queries with 500 insert/s per client
Performance metrics for all DBMS, not just the ones listed above. Some are normalized by throughput, others are not. Legend for results is here.
ips	qps	rps	rmbps	wps	wmbps	rpq	rkbpq	wpi	wkbpi	csps	cpups	cspq	cpupq	dbgb1	dbgb2	rss	maxop	p50	p99	tag
499	8434	0	0.0	42.9	2.8	0.000	0.000	0.086	5.756	32566	12.7	3.861	120	8.3	39.8	4.0	0.012	8187	7174	pg162_def.cx9a2a_bee
498	3507	0	0.0	95.6	2.9	0.000	0.000	0.192	6.003	14198	13.7	4.049	313	6.5	23.3	7.8	0.004	3484	3294	my8036_rel.cz10a_bee
499	1360	0	0.0	8.8	2.3	0.000	0.000	0.018	4.678	5624	13.5	4.135	794	2.1	2.9	9.3	0.038	1342	1071	fbmy8028_rel_221222.cza1_bee
qp500.L4
qp500.L4: point queries with 500 insert/s per client
Performance metrics for all DBMS, not just the ones listed above. Some are normalized by throughput, others are not. Legend for results is here.
ips	qps	rps	rmbps	wps	wmbps	rpq	rkbpq	wpi	wkbpi	csps	cpups	cspq	cpupq	dbgb1	dbgb2	rss	maxop	p50	p99	tag
499	3445	0	0.0	36.9	3.0	0.000	0.000	0.074	6.125	14400	13.4	4.180	311	8.3	35.4	4.1	0.022	3420	3309	pg162_def.cx9a2a_bee
499	2794	0	0.0	93.3	2.9	0.000	0.000	0.187	5.872	12028	14.0	4.306	401	6.5	23.3	7.8	0.008	2732	2573	my8036_rel.cz10a_bee
499	2423	0	0.0	9.1	2.3	0.000	0.000	0.018	4.716	10173	14.6	4.199	482	2.1	3.3	9.4	0.004	2383	1998	fbmy8028_rel_221222.cza1_bee
qr1000.L5
qr1000.L5: range queries with 1000 insert/s per client
Performance metrics for all DBMS, not just the ones listed above. Some are normalized by throughput, others are not. Legend for results is here.
ips	qps	rps	rmbps	wps	wmbps	rpq	rkbpq	wpi	wkbpi	csps	cpups	cspq	cpupq	dbgb1	dbgb2	rss	maxop	p50	p99	tag
998	8520	0	0.0	37.4	3.6	0.000	0.000	0.038	3.653	33113	13.7	3.887	129	8.3	30.4	7.0	0.019	8436	7127	pg162_def.cx9a2a_bee
998	3520	0	0.0	201.2	6.2	0.000	0.000	0.202	6.388	14726	14.8	4.183	336	6.5	23.3	7.8	0.005	3484	3277	my8036_rel.cz10a_bee
998	1373	0	0.0	14.6	4.8	0.000	0.000	0.015	4.882	5920	15.5	4.313	903	2.1	4.1	9.1	0.038	1327	959	fbmy8028_rel_221222.cza1_bee
qp1000.L6
qp1000.L6: point queries with 1000 insert/s per client
Performance metrics for all DBMS, not just the ones listed above. Some are normalized by throughput, others are not. Legend for results is here.
ips	qps	rps	rmbps	wps	wmbps	rpq	rkbpq	wpi	wkbpi	csps	cpups	cspq	cpupq	dbgb1	dbgb2	rss	maxop	p50	p99	tag
999	3466	0	0.0	24.2	3.6	0.000	0.000	0.024	3.648	14706	13.9	4.243	321	8.3	28.3	7.6	0.005	3451	3340	pg162_def.cx9a2a_bee
998	2827	0	0.0	198.7	6.1	0.000	0.000	0.199	6.308	12671	15.2	4.482	430	6.5	23.3	7.8	0.007	2749	2573	my8036_rel.cz10a_bee
998	2392	0	0.0	14.0	4.5	0.000	0.001	0.014	4.611	10277	16.4	4.296	548	2.2	2.9	9.1	0.010	2365	1966	fbmy8028_rel_221222.cza1_bee
l.i0
- l.i0: load without secondary indexes
- Legend for results is here.
- Each entry lists the percentage of responses that fit in that bucket (slower than max time for previous bucket, faster than min time for next bucket).
Insert response time histogram
256us	1ms	4ms	16ms	64ms	256ms	1s	4s	16s	gt	max	tag
0.000	0.000	100.000	0.000	0.000	0.000	0.000	0.000	0.000	0.000	0.003	pg162_def.cx9a2a_bee
0.000	0.000	99.415	0.441	0.141	0.003	0.000	0.000	0.000	0.000	0.071	my8036_rel.cz10a_bee
0.000	0.000	99.724	0.196	0.078	0.002	0.000	0.000	0.000	0.000	0.080	fbmy8028_rel_221222.cza1_bee
l.x
- l.x: create secondary indexes
- Legend for results is here.
- Each entry lists the percentage of responses that fit in that bucket (slower than max time for previous bucket, faster than min time for next bucket).
TODO - determine whether there is data for create index response time
l.i1
- l.i1: continue load after secondary indexes created with 50 inserts per transaction
- Legend for results is here.
- Each entry lists the percentage of responses that fit in that bucket (slower than max time for previous bucket, faster than min time for next bucket).
Insert response time histogram
256us	1ms	4ms	16ms	64ms	256ms	1s	4s	16s	gt	max	tag
0.000	0.000	99.998	0.002	nonzero	0.000	0.000	0.000	0.000	0.000	0.036	pg162_def.cx9a2a_bee
0.000	0.000	97.207	2.704	0.088	0.001	0.000	0.000	0.000	0.000	0.105	my8036_rel.cz10a_bee
0.000	0.000	99.669	0.273	0.056	0.003	0.000	0.000	0.000	0.000	0.104	fbmy8028_rel_221222.cza1_bee
Delete response time histogram
256us	1ms	4ms	16ms	64ms	256ms	1s	4s	16s	gt	max	tag
0.103	81.961	2.923	15.013	nonzero	0.000	0.000	0.000	0.000	0.000	0.036	pg162_def.cx9a2a_bee
0.000	0.000	98.166	1.799	0.035	nonzero	0.000	0.000	0.000	0.000	0.103	my8036_rel.cz10a_bee
0.000	0.000	99.658	0.276	0.062	0.003	0.000	0.000	0.000	0.000	0.111	fbmy8028_rel_221222.cza1_bee
l.i2
- l.i2: continue load after secondary indexes created with 5 inserts per transaction
- Legend for results is here.
- Each entry lists the percentage of responses that fit in that bucket (slower than max time for previous bucket, faster than min time for next bucket).
Insert response time histogram
256us	1ms	4ms	16ms	64ms	256ms	1s	4s	16s	gt	max	tag
17.197	82.800	0.003	nonzero	nonzero	0.000	0.000	0.000	0.000	0.000	0.022	pg162_def.cx9a2a_bee
0.000	99.574	0.196	0.228	0.002	nonzero	0.000	0.000	0.000	0.000	0.102	my8036_rel.cz10a_bee
0.000	99.811	0.104	0.081	0.004	nonzero	0.000	0.000	0.000	0.000	0.080	fbmy8028_rel_221222.cza1_bee
Delete response time histogram
256us	1ms	4ms	16ms	64ms	256ms	1s	4s	16s	gt	max	tag
54.038	26.823	14.196	4.943	nonzero	0.000	0.000	0.000	0.000	0.000	0.021	pg162_def.cx9a2a_bee
0.000	99.710	0.064	0.224	0.002	nonzero	0.000	0.000	0.000	0.000	0.102	my8036_rel.cz10a_bee
0.000	99.770	0.143	0.082	0.005	0.001	0.000	0.000	0.000	0.000	0.103	fbmy8028_rel_221222.cza1_bee
qr100.L1
- qr100.L1: range queries with 100 insert/s per client
- Legend for results is here.
- Each entry lists the percentage of responses that fit in that bucket (slower than max time for previous bucket, faster than min time for next bucket).
Query response time histogram
256us	1ms	4ms	16ms	64ms	256ms	1s	4s	16s	gt	max	tag
99.959	0.040	nonzero	0.000	0.000	0.000	0.000	0.000	0.000	0.000	0.003	pg162_def.cx9a2a_bee
51.557	48.442	nonzero	nonzero	0.000	0.000	0.000	0.000	0.000	0.000	0.004	my8036_rel.cz10a_bee
5.829	81.660	12.511	nonzero	nonzero	0.000	0.000	0.000	0.000	0.000	0.030	fbmy8028_rel_221222.cza1_bee
Insert response time histogram
256us	1ms	4ms	16ms	64ms	256ms	1s	4s	16s	gt	max	tag
0.000	0.000	99.806	0.194	0.000	0.000	0.000	0.000	0.000	0.000	0.008	pg162_def.cx9a2a_bee
0.000	0.000	99.750	0.222	0.028	0.000	0.000	0.000	0.000	0.000	0.025	my8036_rel.cz10a_bee
0.000	0.000	99.403	0.542	0.056	0.000	0.000	0.000	0.000	0.000	0.018	fbmy8028_rel_221222.cza1_bee
Delete response time histogram
256us	1ms	4ms	16ms	64ms	256ms	1s	4s	16s	gt	max	tag
0.125	32.069	66.847	0.958	0.000	0.000	0.000	0.000	0.000	0.000	0.005	pg162_def.cx9a2a_bee
0.000	0.000	99.819	0.167	0.014	0.000	0.000	0.000	0.000	0.000	0.025	my8036_rel.cz10a_bee
0.000	0.000	99.472	0.500	0.028	0.000	0.000	0.000	0.000	0.000	0.018	fbmy8028_rel_221222.cza1_bee
qp100.L2
- qp100.L2: point queries with 100 insert/s per client
- Legend for results is here.
- Each entry lists the percentage of responses that fit in that bucket (slower than max time for previous bucket, faster than min time for next bucket).
Query response time histogram
256us	1ms	4ms	16ms	64ms	256ms	1s	4s	16s	gt	max	tag
85.548	14.452	nonzero	0.000	0.000	0.000	0.000	0.000	0.000	0.000	0.003	pg162_def.cx9a2a_bee
12.182	87.816	0.002	nonzero	0.000	0.000	0.000	0.000	0.000	0.000	0.004	my8036_rel.cz10a_bee
nonzero	99.992	0.007	0.001	0.000	0.000	0.000	0.000	0.000	0.000	0.010	fbmy8028_rel_221222.cza1_bee
Insert response time histogram
256us	1ms	4ms	16ms	64ms	256ms	1s	4s	16s	gt	max	tag
0.000	0.000	99.958	0.042	0.000	0.000	0.000	0.000	0.000	0.000	0.008	pg162_def.cx9a2a_bee
0.000	0.000	99.694	0.292	0.014	0.000	0.000	0.000	0.000	0.000	0.023	my8036_rel.cz10a_bee
0.000	0.000	99.306	0.625	0.069	0.000	0.000	0.000	0.000	0.000	0.018	fbmy8028_rel_221222.cza1_bee
Delete response time histogram
256us	1ms	4ms	16ms	64ms	256ms	1s	4s	16s	gt	max	tag
1.403	98.583	0.014	0.000	0.000	0.000	0.000	0.000	0.000	0.000	0.002	pg162_def.cx9a2a_bee
0.000	0.000	99.806	0.181	0.014	0.000	0.000	0.000	0.000	0.000	0.024	my8036_rel.cz10a_bee
0.000	0.000	99.542	0.403	0.056	0.000	0.000	0.000	0.000	0.000	0.018	fbmy8028_rel_221222.cza1_bee
qr500.L3
- qr500.L3: range queries with 500 insert/s per client
- Legend for results is here.
- Each entry lists the percentage of responses that fit in that bucket (slower than max time for previous bucket, faster than min time for next bucket).
Query response time histogram
256us	1ms	4ms	16ms	64ms	256ms	1s	4s	16s	gt	max	tag
99.928	0.071	0.001	nonzero	0.000	0.000	0.000	0.000	0.000	0.000	0.012	pg162_def.cx9a2a_bee
50.717	49.282	0.001	nonzero	0.000	0.000	0.000	0.000	0.000	0.000	0.004	my8036_rel.cz10a_bee
4.447	72.276	23.277	nonzero	nonzero	0.000	0.000	0.000	0.000	0.000	0.038	fbmy8028_rel_221222.cza1_bee
Insert response time histogram
256us	1ms	4ms	16ms	64ms	256ms	1s	4s	16s	gt	max	tag
0.000	0.000	99.975	0.025	0.000	0.000	0.000	0.000	0.000	0.000	0.008	pg162_def.cx9a2a_bee
0.000	0.000	98.986	0.997	0.017	0.000	0.000	0.000	0.000	0.000	0.042	my8036_rel.cz10a_bee
0.000	0.000	99.500	0.411	0.086	0.003	0.000	0.000	0.000	0.000	0.064	fbmy8028_rel_221222.cza1_bee
Delete response time histogram
256us	1ms	4ms	16ms	64ms	256ms	1s	4s	16s	gt	max	tag
6.506	80.289	13.197	0.008	0.000	0.000	0.000	0.000	0.000	0.000	0.005	pg162_def.cx9a2a_bee
0.000	0.000	99.619	0.367	0.014	0.000	0.000	0.000	0.000	0.000	0.049	my8036_rel.cz10a_bee
0.000	0.000	99.528	0.392	0.081	0.000	0.000	0.000	0.000	0.000	0.051	fbmy8028_rel_221222.cza1_bee
qp500.L4
- qp500.L4: point queries with 500 insert/s per client
- Legend for results is here.
- Each entry lists the percentage of responses that fit in that bucket (slower than max time for previous bucket, faster than min time for next bucket).
Query response time histogram
256us	1ms	4ms	16ms	64ms	256ms	1s	4s	16s	gt	max	tag
85.864	14.135	0.001	0.000	nonzero	0.000	0.000	0.000	0.000	0.000	0.022	pg162_def.cx9a2a_bee
7.642	92.354	0.004	nonzero	0.000	0.000	0.000	0.000	0.000	0.000	0.008	my8036_rel.cz10a_bee
nonzero	99.994	0.006	nonzero	0.000	0.000	0.000	0.000	0.000	0.000	0.004	fbmy8028_rel_221222.cza1_bee
Insert response time histogram
256us	1ms	4ms	16ms	64ms	256ms	1s	4s	16s	gt	max	tag
0.000	0.000	99.986	0.014	0.000	0.000	0.000	0.000	0.000	0.000	0.008	pg162_def.cx9a2a_bee
0.000	0.000	98.831	1.158	0.011	0.000	0.000	0.000	0.000	0.000	0.043	my8036_rel.cz10a_bee
0.000	0.000	99.481	0.431	0.089	0.000	0.000	0.000	0.000	0.000	0.044	fbmy8028_rel_221222.cza1_bee
Delete response time histogram
256us	1ms	4ms	16ms	64ms	256ms	1s	4s	16s	gt	max	tag
19.314	66.133	13.914	0.639	0.000	0.000	0.000	0.000	0.000	0.000	0.005	pg162_def.cx9a2a_bee
0.000	0.000	99.650	0.344	0.006	0.000	0.000	0.000	0.000	0.000	0.049	my8036_rel.cz10a_bee
0.000	0.000	99.567	0.364	0.069	0.000	0.000	0.000	0.000	0.000	0.052	fbmy8028_rel_221222.cza1_bee
qr1000.L5
- qr1000.L5: range queries with 1000 insert/s per client
- Legend for results is here.
- Each entry lists the percentage of responses that fit in that bucket (slower than max time for previous bucket, faster than min time for next bucket).
Query response time histogram
256us	1ms	4ms	16ms	64ms	256ms	1s	4s	16s	gt	max	tag
99.917	0.082	0.002	nonzero	nonzero	0.000	0.000	0.000	0.000	0.000	0.019	pg162_def.cx9a2a_bee
51.135	48.863	0.002	nonzero	0.000	0.000	0.000	0.000	0.000	0.000	0.005	my8036_rel.cz10a_bee
4.291	71.017	24.691	0.001	0.001	0.000	0.000	0.000	0.000	0.000	0.038	fbmy8028_rel_221222.cza1_bee
Insert response time histogram
256us	1ms	4ms	16ms	64ms	256ms	1s	4s	16s	gt	max	tag
0.000	0.000	99.951	0.037	0.011	0.000	0.000	0.000	0.000	0.000	0.025	pg162_def.cx9a2a_bee
0.000	0.000	96.790	3.193	0.017	0.000	0.000	0.000	0.000	0.000	0.049	my8036_rel.cz10a_bee
0.000	0.000	99.583	0.331	0.086	0.000	0.000	0.000	0.000	0.000	0.064	fbmy8028_rel_221222.cza1_bee
Delete response time histogram
256us	1ms	4ms	16ms	64ms	256ms	1s	4s	16s	gt	max	tag
2.457	74.129	20.939	2.467	0.008	0.000	0.000	0.000	0.000	0.000	0.021	pg162_def.cx9a2a_bee
0.000	0.000	99.572	0.415	0.013	0.000	0.000	0.000	0.000	0.000	0.051	my8036_rel.cz10a_bee
0.000	0.000	99.614	0.303	0.082	0.001	0.000	0.000	0.000	0.000	0.079	fbmy8028_rel_221222.cza1_bee
qp1000.L6
- qp1000.L6: point queries with 1000 insert/s per client
- Legend for results is here.
- Each entry lists the percentage of responses that fit in that bucket (slower than max time for previous bucket, faster than min time for next bucket).
Query response time histogram
256us	1ms	4ms	16ms	64ms	256ms	1s	4s	16s	gt	max	tag
86.095	13.903	0.002	nonzero	0.000	0.000	0.000	0.000	0.000	0.000	0.005	pg162_def.cx9a2a_bee
11.794	88.197	0.009	nonzero	0.000	0.000	0.000	0.000	0.000	0.000	0.007	my8036_rel.cz10a_bee
0.000	99.990	0.009	0.001	0.000	0.000	0.000	0.000	0.000	0.000	0.010	fbmy8028_rel_221222.cza1_bee
Insert response time histogram
256us	1ms	4ms	16ms	64ms	256ms	1s	4s	16s	gt	max	tag
0.000	0.000	99.989	0.011	0.000	0.000	0.000	0.000	0.000	0.000	0.014	pg162_def.cx9a2a_bee
0.000	0.000	96.331	3.653	0.017	0.000	0.000	0.000	0.000	0.000	0.050	my8036_rel.cz10a_bee
0.000	0.000	99.593	0.318	0.089	0.000	0.000	0.000	0.000	0.000	0.055	fbmy8028_rel_221222.cza1_bee
Delete response time histogram
256us	1ms	4ms	16ms	64ms	256ms	1s	4s	16s	gt	max	tag
9.219	74.985	13.846	1.950	0.000	0.000	0.000	0.000	0.000	0.000	0.012	pg162_def.cx9a2a_bee
0.000	0.000	99.553	0.435	0.013	0.000	0.000	0.000	0.000	0.000	0.051	my8036_rel.cz10a_bee
0.000	0.000	99.628	0.285	0.088	0.000	0.000	0.000	0.000	0.000	0.063	fbmy8028_rel_221222.cza1_bee