Introduction
This is a report for the insert benchmark with 30M docs and 1 client(s). It is generated by scripts (bash, awk, sed) and Tufte might not be impressed. An overview of the insert benchmark is here and a short update is here. Below, by DBMS, I mean DBMS+version.config. An example is my8020.c10b40 where my means MySQL, 8020 is version 8.0.20 and c10b40 is the name for the configuration file.
The test server has 8 AMD cores, 16G RAM and an NVMe SSD. It is described here as the Beelink. The benchmark was run with 1 client and there were 1 or 3 connections per client (1 for queries or inserts without rate limits, 1+1 for rate limited inserts+deletes). It uses 1 table. It loads 30M rows per table without secondary indexes, creates 3 secondary indexes per table, then inserts 80m+20m rows per table with a delete per insert to avoid growing the table. It then does 6 read+write tests for 3600s each that do queries as fast as possible with 100,100,500,500,1000,1000 inserts/s and the same for deletes/s per client concurrent with the queries. The database is cached in memory. Clients and the DBMS share one server. The per-database configs are in the per-database subdirectories here.
The tested DBMS are:
- pg162_def.cx9a2_bee - Postgres 16.2, cx9a2 config
- pg162_def.cx9a2a_bee - Postgres 16.2, cx9a2a config that adds autovacuum_vacuum_cost_delay= 1ms
- pg162_def.cx9a2b_bee - Postgres 16.2, cx9a2b config that adds autovacuum_vacuum_cost_delay=0
- pg162_def.cx9a2c_bee - Postgres 16.2, cx9a2c config that adds autovacuum_naptime=1s
- pg162_def.cx9a2e_bee - Postgres 16.2, cx9a2e config that adds autovacuum_vacuum_scale_factor=0.01
- pg162_def.cx9a2f_bee - Postgres 16.2, cx9a2f config that adds autovacuum_vacuum_insert_scale_factor=0.01
- pg162_def.cx9a2g_bee - Postgres 16.2, cx9a2g config that adds autovacuum_vacuum_cost_limit=8000
- pg162_def.cx9a2acef_bee - Postgres 16.2, cx9a2acef config that combines cx9a2a, cx9a2c, cz9a2e, cx9a2f configs
- pg162_def.cx9a2bcef_bee - Postgres 16.2, cx9a2bcef config that combines cx9a2b, cx9a2c, cz9a2e, cx9a2f configs
Contents
- Summary
- l.i0: load without secondary indexes
- l.x: create secondary indexes
- l.i1: continue load after secondary indexes created with 50 inserts per transaction
- l.i2: continue load after secondary indexes created with 5 inserts per transaction
- qr100.L1: range queries with 100 insert/s per client
- qp100.L2: point queries with 100 insert/s per client
- qr500.L3: range queries with 500 insert/s per client
- qp500.L4: point queries with 500 insert/s per client
- qr1000.L5: range queries with 1000 insert/s per client
- qp1000.L6: point queries with 1000 insert/s per client
Summary
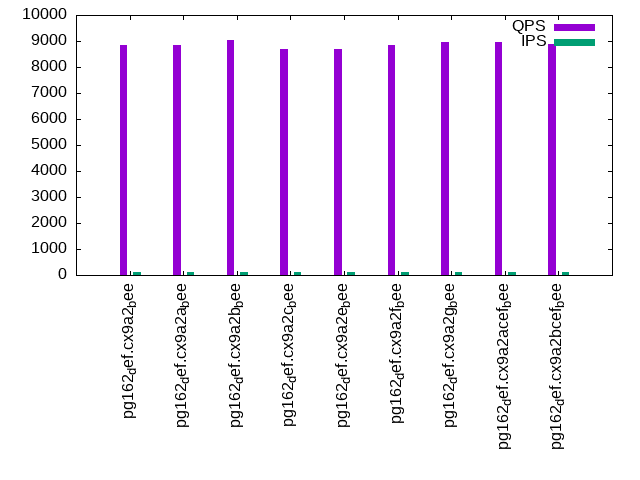
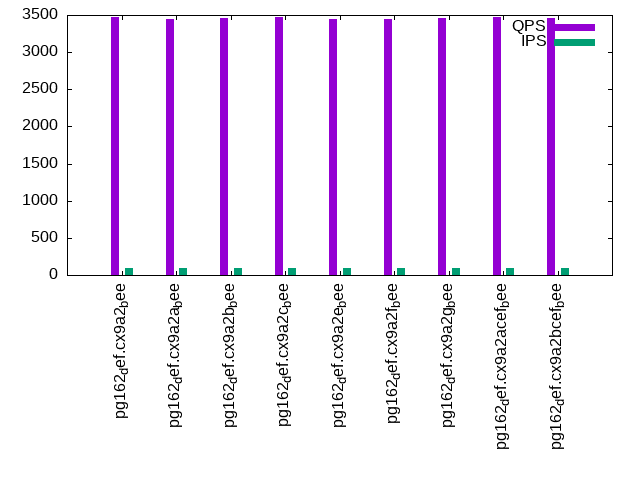
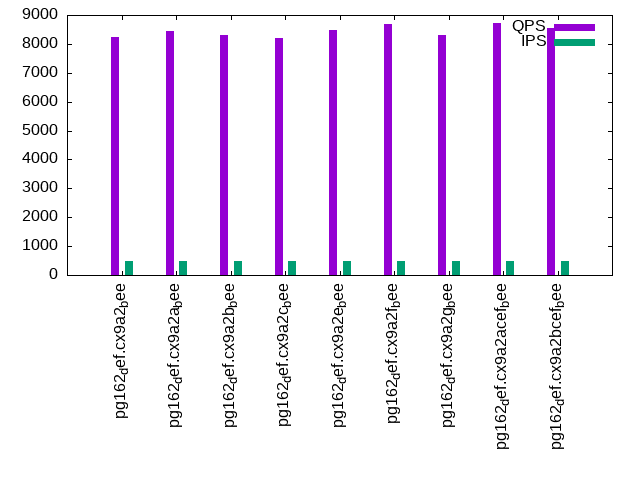
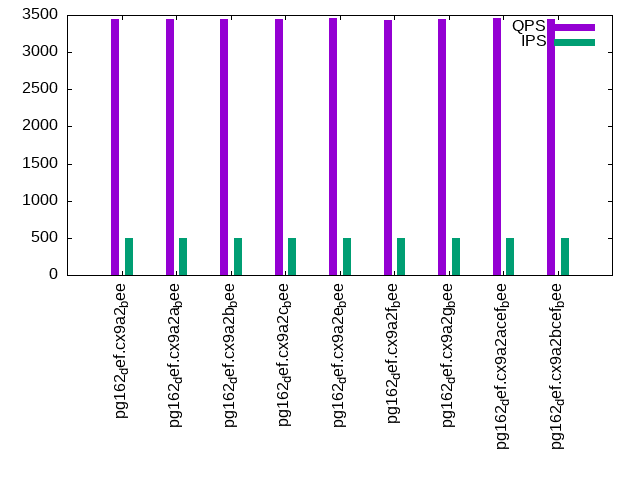
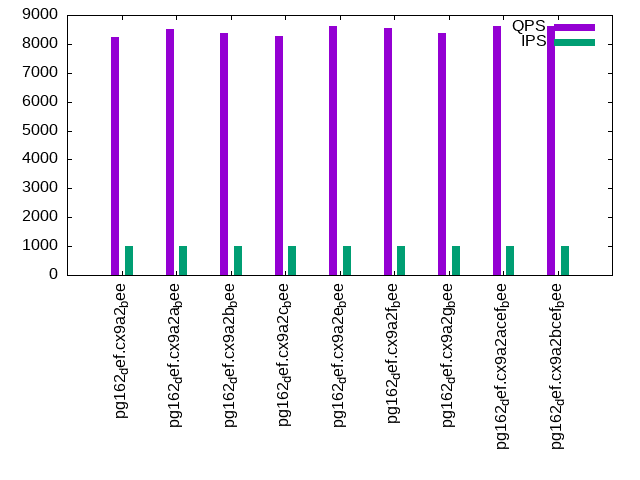
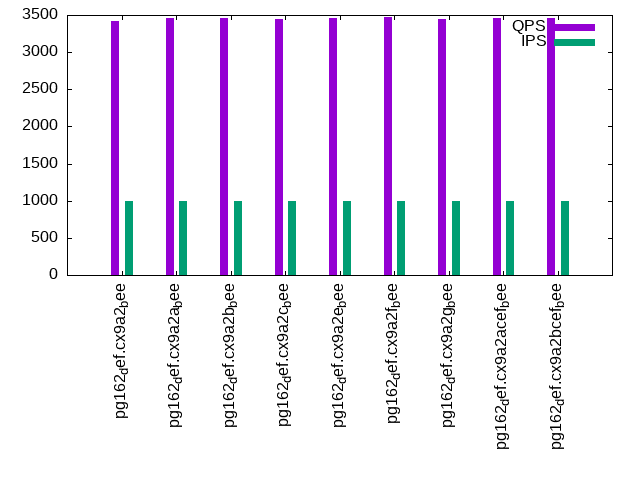
The numbers are inserts/s for l.i0, l.i1 and l.i2, indexed docs (or rows) /s for l.x and queries/s for qr100, qp100 thru qr1000, qp1000" The values are the average rate over the entire test for inserts (IPS) and queries (QPS). The range of values for IPS and QPS is split into 3 parts: bottom 25%, middle 50%, top 25%. Values in the bottom 25% have a red background, values in the top 25% have a green background and values in the middle have no color. A gray background is used for values that can be ignored because the DBMS did not sustain the target insert rate. Red backgrounds are not used when the minimum value is within 80% of the max value.
| dbms | l.i0 | l.x | l.i1 | l.i2 | qr100 | qp100 | qr500 | qp500 | qr1000 | qp1000 |
|---|---|---|---|---|---|---|---|---|---|---|
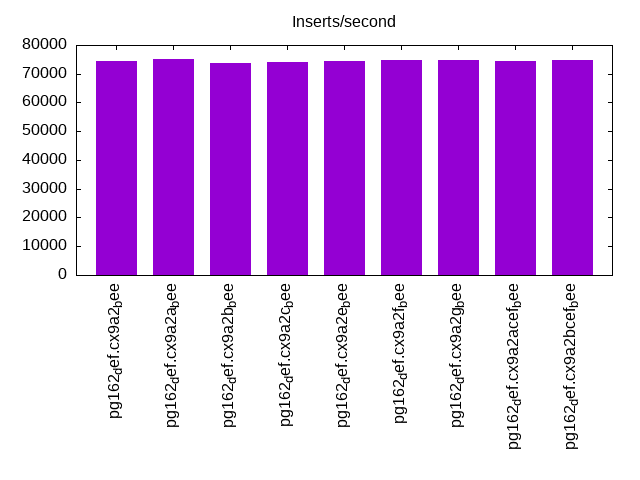
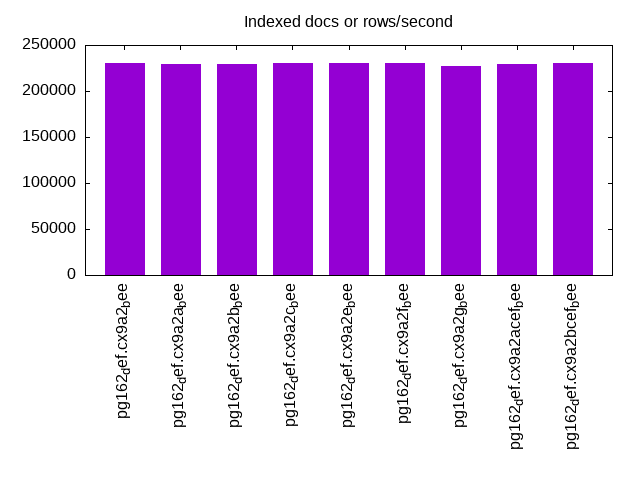
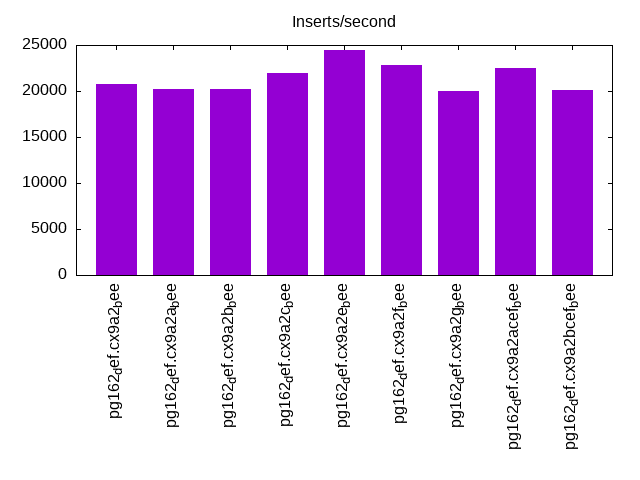
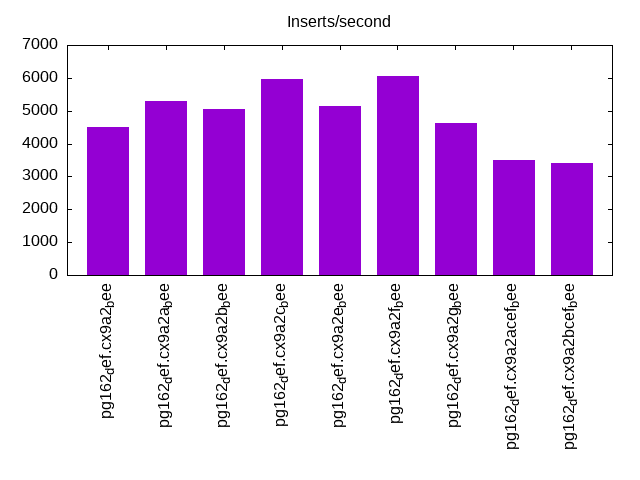
| pg162_def.cx9a2_bee | 74442 | 230770 | 20790 | 4506 | 8841 | 3468 | 8253 | 3448 | 8238 | 3425 |
| pg162_def.cx9a2a_bee | 75000 | 229008 | 20222 | 5304 | 8858 | 3448 | 8434 | 3445 | 8520 | 3466 |
| pg162_def.cx9a2b_bee | 73710 | 229008 | 20248 | 5052 | 9025 | 3460 | 8324 | 3441 | 8373 | 3465 |
| pg162_def.cx9a2c_bee | 74257 | 230770 | 21912 | 5963 | 8706 | 3478 | 8221 | 3448 | 8285 | 3452 |
| pg162_def.cx9a2e_bee | 74442 | 230770 | 24502 | 5135 | 8709 | 3444 | 8470 | 3459 | 8605 | 3453 |
| pg162_def.cx9a2f_bee | 74627 | 230770 | 22772 | 6048 | 8854 | 3441 | 8680 | 3431 | 8557 | 3476 |
| pg162_def.cx9a2g_bee | 74627 | 227273 | 20035 | 4625 | 8958 | 3464 | 8296 | 3443 | 8372 | 3440 |
| pg162_def.cx9a2acef_bee | 74442 | 229008 | 22459 | 3500 | 8979 | 3478 | 8729 | 3464 | 8605 | 3461 |
| pg162_def.cx9a2bcef_bee | 74627 | 230770 | 20121 | 3406 | 8883 | 3457 | 8537 | 3440 | 8625 | 3458 |
This table has relative throughput, throughput for the DBMS relative to the DBMS in the first line, using the absolute throughput from the previous table. Values less than 0.95 have a yellow background. Values greater than 1.05 have a blue background.
| dbms | l.i0 | l.x | l.i1 | l.i2 | qr100 | qp100 | qr500 | qp500 | qr1000 | qp1000 |
|---|---|---|---|---|---|---|---|---|---|---|
| pg162_def.cx9a2_bee | 1.00 | 1.00 | 1.00 | 1.00 | 1.00 | 1.00 | 1.00 | 1.00 | 1.00 | 1.00 |
| pg162_def.cx9a2a_bee | 1.01 | 0.99 | 0.97 | 1.18 | 1.00 | 0.99 | 1.02 | 1.00 | 1.03 | 1.01 |
| pg162_def.cx9a2b_bee | 0.99 | 0.99 | 0.97 | 1.12 | 1.02 | 1.00 | 1.01 | 1.00 | 1.02 | 1.01 |
| pg162_def.cx9a2c_bee | 1.00 | 1.00 | 1.05 | 1.32 | 0.98 | 1.00 | 1.00 | 1.00 | 1.01 | 1.01 |
| pg162_def.cx9a2e_bee | 1.00 | 1.00 | 1.18 | 1.14 | 0.99 | 0.99 | 1.03 | 1.00 | 1.04 | 1.01 |
| pg162_def.cx9a2f_bee | 1.00 | 1.00 | 1.10 | 1.34 | 1.00 | 0.99 | 1.05 | 1.00 | 1.04 | 1.01 |
| pg162_def.cx9a2g_bee | 1.00 | 0.98 | 0.96 | 1.03 | 1.01 | 1.00 | 1.01 | 1.00 | 1.02 | 1.00 |
| pg162_def.cx9a2acef_bee | 1.00 | 0.99 | 1.08 | 0.78 | 1.02 | 1.00 | 1.06 | 1.00 | 1.04 | 1.01 |
| pg162_def.cx9a2bcef_bee | 1.00 | 1.00 | 0.97 | 0.76 | 1.00 | 1.00 | 1.03 | 1.00 | 1.05 | 1.01 |
This lists the average rate of inserts/s for the tests that do inserts concurrent with queries. For such tests the query rate is listed in the table above. The read+write tests are setup so that the insert rate should match the target rate every second. Cells that are not at least 95% of the target have a red background to indicate a failure to satisfy the target.
| dbms | qr100.L1 | qp100.L2 | qr500.L3 | qp500.L4 | qr1000.L5 | qp1000.L6 |
|---|---|---|---|---|---|---|
| pg162_def.cx9a2_bee | 100 | 100 | 499 | 499 | 998 | 998 |
| pg162_def.cx9a2a_bee | 100 | 100 | 499 | 499 | 998 | 999 |
| pg162_def.cx9a2b_bee | 100 | 100 | 499 | 499 | 998 | 998 |
| pg162_def.cx9a2c_bee | 100 | 100 | 499 | 499 | 998 | 998 |
| pg162_def.cx9a2e_bee | 100 | 100 | 499 | 499 | 998 | 998 |
| pg162_def.cx9a2f_bee | 100 | 100 | 499 | 499 | 998 | 998 |
| pg162_def.cx9a2g_bee | 100 | 100 | 499 | 499 | 998 | 998 |
| pg162_def.cx9a2acef_bee | 100 | 100 | 499 | 499 | 999 | 998 |
| pg162_def.cx9a2bcef_bee | 100 | 100 | 499 | 499 | 998 | 998 |
| target | 100 | 100 | 500 | 500 | 1000 | 1000 |
l.i0
l.i0: load without secondary indexes. Graphs for performance per 1-second interval are here.
Average throughput:
Insert response time histogram: each cell has the percentage of responses that take <= the time in the header and max is the max response time in seconds. For the max column values in the top 25% of the range have a red background and in the bottom 25% of the range have a green background. The red background is not used when the min value is within 80% of the max value.
| dbms | 256us | 1ms | 4ms | 16ms | 64ms | 256ms | 1s | 4s | 16s | gt | max |
|---|---|---|---|---|---|---|---|---|---|---|---|
| pg162_def.cx9a2_bee | 100.000 | 0.003 | |||||||||
| pg162_def.cx9a2a_bee | 100.000 | 0.003 | |||||||||
| pg162_def.cx9a2b_bee | 100.000 | 0.003 | |||||||||
| pg162_def.cx9a2c_bee | 100.000 | 0.003 | |||||||||
| pg162_def.cx9a2e_bee | 100.000 | 0.003 | |||||||||
| pg162_def.cx9a2f_bee | 100.000 | 0.003 | |||||||||
| pg162_def.cx9a2g_bee | 100.000 | 0.003 | |||||||||
| pg162_def.cx9a2acef_bee | 100.000 | 0.004 | |||||||||
| pg162_def.cx9a2bcef_bee | 100.000 | 0.003 |
Performance metrics for the DBMS listed above. Some are normalized by throughput, others are not. Legend for results is here.
ips	qps	rps	rmbps	wps	wmbps	rpq	rkbpq	wpi	wkbpi	csps	cpups	cspq	cpupq	dbgb1	dbgb2	rss	maxop	p50	p99	tag
74442	0	0	0.0	86.8	31.9	0.000	0.000	0.001	0.439	9234	23.0	0.124	25	2.9	7.8	0.2	0.003	74855	72994	pg162_def.cx9a2_bee
75000	0	0	0.0	87.2	32.0	0.000	0.000	0.001	0.437	9257	23.2	0.123	25	2.9	7.8	2.9	0.003	75147	73217	pg162_def.cx9a2a_bee
73710	0	0	0.0	86.5	31.7	0.000	0.000	0.001	0.440	9133	22.9	0.124	25	2.9	7.8	0.2	0.003	74120	71617	pg162_def.cx9a2b_bee
74257	0	0	0.0	87.2	31.8	0.000	0.000	0.001	0.439	9261	23.5	0.125	25	2.9	7.8	0.2	0.003	74527	71958	pg162_def.cx9a2c_bee
74442	0	0	0.0	87.1	32.0	0.000	0.000	0.001	0.440	9264	23.2	0.124	25	2.9	7.8	2.8	0.003	75017	71947	pg162_def.cx9a2e_bee
74627	0	0	0.0	87.2	32.0	0.000	0.000	0.001	0.439	9403	23.1	0.126	25	2.9	7.8	2.8	0.003	75015	72251	pg162_def.cx9a2f_bee
74627	0	0	0.0	87.0	32.0	0.000	0.000	0.001	0.440	9244	23.1	0.124	25	2.9	7.8	0.2	0.003	75020	73013	pg162_def.cx9a2g_bee
74442	0	0	0.0	87.4	32.0	0.000	0.000	0.001	0.440	9319	23.5	0.125	25	2.9	7.8	2.8	0.004	75026	70888	pg162_def.cx9a2acef_bee
74627	0	0	0.0	87.6	32.0	0.000	0.000	0.001	0.439	9280	23.5	0.124	25	2.9	7.8	0.1	0.003	74919	72992	pg162_def.cx9a2bcef_bee
l.x
l.x: create secondary indexes.
Average throughput:
Performance metrics for the DBMS listed above. Some are normalized by throughput, others are not. Legend for results is here.
ips	qps	rps	rmbps	wps	wmbps	rpq	rkbpq	wpi	wkbpi	csps	cpups	cspq	cpupq	dbgb1	dbgb2	rss	maxop	p50	p99	tag
230770	0	0	0.0	180.9	84.5	0.000	0.000	0.001	0.375	429	11.3	0.002	4	5.8	13.3	0.0	0.003	NA	NA	pg162_def.cx9a2_bee
229008	0	0	0.0	171.3	79.7	0.000	0.000	0.001	0.357	589	11.4	0.003	4	5.8	13.3	3.1	0.003	NA	NA	pg162_def.cx9a2a_bee
229008	0	0	0.0	168.5	78.3	0.000	0.000	0.001	0.350	439	11.4	0.002	4	5.8	13.3	3.1	0.003	NA	NA	pg162_def.cx9a2b_bee
230770	0	0	0.0	171.8	79.6	0.000	0.000	0.001	0.353	671	11.7	0.003	4	5.8	13.3	3.1	0.003	NA	NA	pg162_def.cx9a2c_bee
230770	0	0	0.0	183.2	85.4	0.000	0.000	0.001	0.379	700	11.4	0.003	4	5.8	13.3	3.1	0.003	NA	NA	pg162_def.cx9a2e_bee
230770	0	0	0.0	183.4	85.2	0.000	0.000	0.001	0.378	722	11.5	0.003	4	5.8	13.3	3.1	0.002	NA	NA	pg162_def.cx9a2f_bee
227273	0	0	0.0	162.5	75.8	0.000	0.000	0.001	0.342	407	11.4	0.002	4	5.8	13.3	3.1	0.003	NA	NA	pg162_def.cx9a2g_bee
229008	0	0	0.0	164.3	76.3	0.000	0.000	0.001	0.341	505	11.7	0.002	4	5.8	13.3	3.1	0.003	NA	NA	pg162_def.cx9a2acef_bee
230770	0	0	0.0	176.6	81.8	0.000	0.000	0.001	0.363	488	11.5	0.002	4	5.8	13.3	3.1	0.003	NA	NA	pg162_def.cx9a2bcef_bee
l.i1
l.i1: continue load after secondary indexes created with 50 inserts per transaction. Graphs for performance per 1-second interval are here.
Average throughput:
Insert response time histogram: each cell has the percentage of responses that take <= the time in the header and max is the max response time in seconds. For the max column values in the top 25% of the range have a red background and in the bottom 25% of the range have a green background. The red background is not used when the min value is within 80% of the max value.
| dbms | 256us | 1ms | 4ms | 16ms | 64ms | 256ms | 1s | 4s | 16s | gt | max |
|---|---|---|---|---|---|---|---|---|---|---|---|
| pg162_def.cx9a2_bee | 99.998 | 0.001 | nonzero | 0.021 | |||||||
| pg162_def.cx9a2a_bee | 99.998 | 0.002 | nonzero | 0.036 | |||||||
| pg162_def.cx9a2b_bee | 99.998 | 0.002 | nonzero | 0.020 | |||||||
| pg162_def.cx9a2c_bee | 99.999 | 0.001 | 0.015 | ||||||||
| pg162_def.cx9a2e_bee | 99.998 | 0.002 | nonzero | 0.019 | |||||||
| pg162_def.cx9a2f_bee | 99.997 | 0.003 | nonzero | 0.038 | |||||||
| pg162_def.cx9a2g_bee | 99.998 | 0.002 | nonzero | 0.032 | |||||||
| pg162_def.cx9a2acef_bee | 99.996 | 0.002 | 0.002 | 0.040 | |||||||
| pg162_def.cx9a2bcef_bee | 99.999 | 0.001 | nonzero | 0.021 |
Delete response time histogram: each cell has the percentage of responses that take <= the time in the header and max is the max response time in seconds. For the max column values in the top 25% of the range have a red background and in the bottom 25% of the range have a green background. The red background is not used when the min value is within 80% of the max value.
| dbms | 256us | 1ms | 4ms | 16ms | 64ms | 256ms | 1s | 4s | 16s | gt | max |
|---|---|---|---|---|---|---|---|---|---|---|---|
| pg162_def.cx9a2_bee | 0.109 | 82.300 | 3.475 | 14.116 | nonzero | 0.019 | |||||
| pg162_def.cx9a2a_bee | 0.103 | 81.961 | 2.923 | 15.013 | nonzero | 0.036 | |||||
| pg162_def.cx9a2b_bee | 0.114 | 81.251 | 3.414 | 15.221 | nonzero | 0.018 | |||||
| pg162_def.cx9a2c_bee | 0.232 | 80.383 | 7.244 | 12.142 | 0.013 | ||||||
| pg162_def.cx9a2e_bee | 0.120 | 82.358 | 11.909 | 5.613 | nonzero | 0.017 | |||||
| pg162_def.cx9a2f_bee | 0.310 | 82.346 | 8.443 | 8.902 | nonzero | 0.018 | |||||
| pg162_def.cx9a2g_bee | 0.131 | 82.176 | 2.496 | 15.197 | nonzero | 0.022 | |||||
| pg162_def.cx9a2acef_bee | 0.231 | 79.429 | 9.044 | 11.295 | 0.001 | 0.037 | |||||
| pg162_def.cx9a2bcef_bee | 0.205 | 79.627 | 1.319 | 18.849 | nonzero | 0.016 |
Performance metrics for the DBMS listed above. Some are normalized by throughput, others are not. Legend for results is here.
ips	qps	rps	rmbps	wps	wmbps	rpq	rkbpq	wpi	wkbpi	csps	cpups	cspq	cpupq	dbgb1	dbgb2	rss	maxop	p50	p99	tag
20790	0	27	0.1	88.6	25.7	0.001	0.006	0.004	1.264	10108	22.3	0.486	86	8.2	48.2	3.0	0.021	28608	5498	pg162_def.cx9a2_bee
20222	0	27	0.1	87.7	25.1	0.001	0.006	0.004	1.271	9841	22.0	0.487	87	8.2	47.2	8.0	0.036	28469	4944	pg162_def.cx9a2a_bee
20248	0	27	0.1	85.7	24.9	0.001	0.006	0.004	1.257	9845	22.1	0.486	87	8.2	47.1	7.3	0.020	28380	4645	pg162_def.cx9a2b_bee
21912	0	30	0.1	93.2	26.8	0.001	0.006	0.004	1.253	10776	23.2	0.492	85	8.1	47.4	8.1	0.015	28617	6047	pg162_def.cx9a2c_bee
24502	0	31	0.1	107.2	30.1	0.001	0.006	0.004	1.257	11901	24.3	0.486	79	7.8	47.8	7.7	0.019	28968	5647	pg162_def.cx9a2e_bee
22772	0	29	0.1	99.7	28.0	0.001	0.006	0.004	1.260	11303	23.6	0.496	83	7.9	47.9	6.4	0.038	29019	5596	pg162_def.cx9a2f_bee
20035	0	26	0.1	85.0	24.7	0.001	0.006	0.004	1.262	9753	21.9	0.487	87	8.2	48.2	6.0	0.032	28569	5594	pg162_def.cx9a2g_bee
22459	0	28	0.1	100.7	27.6	0.001	0.005	0.004	1.258	11064	23.9	0.493	85	7.8	47.8	6.5	0.040	28767	6892	pg162_def.cx9a2acef_bee
20121	0	25	0.1	90.2	24.6	0.001	0.006	0.004	1.252	9929	22.8	0.493	91	7.7	47.1	6.0	0.021	28168	6842	pg162_def.cx9a2bcef_bee
l.i2
l.i2: continue load after secondary indexes created with 5 inserts per transaction. Graphs for performance per 1-second interval are here.
Average throughput:
Insert response time histogram: each cell has the percentage of responses that take <= the time in the header and max is the max response time in seconds. For the max column values in the top 25% of the range have a red background and in the bottom 25% of the range have a green background. The red background is not used when the min value is within 80% of the max value.
| dbms | 256us | 1ms | 4ms | 16ms | 64ms | 256ms | 1s | 4s | 16s | gt | max |
|---|---|---|---|---|---|---|---|---|---|---|---|
| pg162_def.cx9a2_bee | 18.831 | 81.167 | 0.002 | nonzero | 0.008 | ||||||
| pg162_def.cx9a2a_bee | 17.197 | 82.800 | 0.003 | nonzero | nonzero | 0.022 | |||||
| pg162_def.cx9a2b_bee | 19.294 | 80.704 | 0.002 | nonzero | nonzero | 0.021 | |||||
| pg162_def.cx9a2c_bee | 21.536 | 78.461 | 0.002 | nonzero | nonzero | 0.018 | |||||
| pg162_def.cx9a2e_bee | 17.115 | 82.882 | 0.002 | nonzero | nonzero | 0.020 | |||||
| pg162_def.cx9a2f_bee | 23.615 | 76.381 | 0.003 | 0.001 | nonzero | 0.026 | |||||
| pg162_def.cx9a2g_bee | 18.012 | 81.986 | 0.002 | nonzero | nonzero | 0.020 | |||||
| pg162_def.cx9a2acef_bee | 21.124 | 78.872 | 0.003 | nonzero | nonzero | 0.022 | |||||
| pg162_def.cx9a2bcef_bee | 20.771 | 79.227 | 0.002 | nonzero | nonzero | 0.020 |
Delete response time histogram: each cell has the percentage of responses that take <= the time in the header and max is the max response time in seconds. For the max column values in the top 25% of the range have a red background and in the bottom 25% of the range have a green background. The red background is not used when the min value is within 80% of the max value.
| dbms | 256us | 1ms | 4ms | 16ms | 64ms | 256ms | 1s | 4s | 16s | gt | max |
|---|---|---|---|---|---|---|---|---|---|---|---|
| pg162_def.cx9a2_bee | 55.000 | 26.064 | 9.076 | 9.860 | 0.013 | ||||||
| pg162_def.cx9a2a_bee | 54.038 | 26.823 | 14.196 | 4.943 | nonzero | 0.021 | |||||
| pg162_def.cx9a2b_bee | 55.421 | 25.352 | 12.163 | 7.064 | nonzero | 0.021 | |||||
| pg162_def.cx9a2c_bee | 57.425 | 23.500 | 16.890 | 2.185 | nonzero | 0.018 | |||||
| pg162_def.cx9a2e_bee | 53.439 | 26.308 | 15.439 | 4.813 | nonzero | 0.020 | |||||
| pg162_def.cx9a2f_bee | 57.578 | 23.366 | 16.669 | 2.387 | nonzero | 0.026 | |||||
| pg162_def.cx9a2g_bee | 54.485 | 25.786 | 10.239 | 9.490 | nonzero | 0.020 | |||||
| pg162_def.cx9a2acef_bee | 56.603 | 23.322 | 0.229 | 19.847 | nonzero | 0.022 | |||||
| pg162_def.cx9a2bcef_bee | 56.044 | 23.450 | 0.423 | 20.083 | nonzero | 0.020 |
Performance metrics for the DBMS listed above. Some are normalized by throughput, others are not. Legend for results is here.
ips	qps	rps	rmbps	wps	wmbps	rpq	rkbpq	wpi	wkbpi	csps	cpups	cspq	cpupq	dbgb1	dbgb2	rss	maxop	p50	p99	tag
4506	0	0	0.0	35.1	7.1	0.000	0.000	0.008	1.607	21433	18.4	4.757	327	8.2	48.3	3.2	0.008	1249	624	pg162_def.cx9a2_bee
5304	0	0	0.0	35.9	7.8	0.000	0.000	0.007	1.509	25308	19.6	4.772	296	8.2	48.3	5.8	0.022	1618	849	pg162_def.cx9a2a_bee
5052	0	0	0.0	35.3	7.3	0.000	0.000	0.007	1.483	24072	19.2	4.765	304	8.2	47.2	8.3	0.021	1448	759	pg162_def.cx9a2b_bee
5963	0	0	0.0	37.3	8.0	0.000	0.000	0.006	1.382	28483	20.7	4.777	278	8.2	47.4	0.0	0.018	1989	1004	pg162_def.cx9a2c_bee
5135	0	0	0.0	33.7	7.1	0.000	0.000	0.007	1.416	24456	19.5	4.763	304	7.9	47.9	4.3	0.020	1638	634	pg162_def.cx9a2e_bee
6048	0	0	0.0	37.2	8.1	0.000	0.000	0.006	1.364	29066	20.7	4.806	274	7.9	48.0	6.4	0.026	2063	1019	pg162_def.cx9a2f_bee
4625	0	0	0.0	35.3	7.2	0.000	0.000	0.008	1.597	22010	18.6	4.759	322	8.2	48.3	8.4	0.020	1289	744	pg162_def.cx9a2g_bee
3500	0	0	0.0	30.5	5.8	0.000	0.000	0.009	1.698	16789	17.4	4.797	398	7.8	47.9	7.9	0.022	895	660	pg162_def.cx9a2acef_bee
3406	0	0	0.0	30.8	5.7	0.000	0.000	0.009	1.710	16337	17.3	4.796	406	7.8	47.2	4.4	0.020	884	669	pg162_def.cx9a2bcef_bee
qr100.L1
qr100.L1: range queries with 100 insert/s per client. Graphs for performance per 1-second interval are here.
Average throughput:
Query response time histogram: each cell has the percentage of responses that take <= the time in the header and max is the max response time in seconds. For max values in the top 25% of the range have a red background and in the bottom 25% of the range have a green background. The red background is not used when the min value is within 80% of the max value.
| dbms | 256us | 1ms | 4ms | 16ms | 64ms | 256ms | 1s | 4s | 16s | gt | max |
|---|---|---|---|---|---|---|---|---|---|---|---|
| pg162_def.cx9a2_bee | 99.948 | 0.052 | nonzero | nonzero | 0.004 | ||||||
| pg162_def.cx9a2a_bee | 99.959 | 0.040 | nonzero | 0.003 | |||||||
| pg162_def.cx9a2b_bee | 99.961 | 0.039 | nonzero | nonzero | 0.005 | ||||||
| pg162_def.cx9a2c_bee | 99.922 | 0.077 | nonzero | 0.003 | |||||||
| pg162_def.cx9a2e_bee | 99.963 | 0.036 | nonzero | 0.003 | |||||||
| pg162_def.cx9a2f_bee | 99.917 | 0.083 | nonzero | nonzero | 0.004 | ||||||
| pg162_def.cx9a2g_bee | 99.957 | 0.043 | nonzero | 0.004 | |||||||
| pg162_def.cx9a2acef_bee | 99.919 | 0.081 | nonzero | 0.003 | |||||||
| pg162_def.cx9a2bcef_bee | 99.915 | 0.085 | nonzero | nonzero | 0.005 |
Insert response time histogram: each cell has the percentage of responses that take <= the time in the header and max is the max response time in seconds. For max values in the top 25% of the range have a red background and in the bottom 25% of the range have a green background. The red background is not used when the min value is within 80% of the max value.
| dbms | 256us | 1ms | 4ms | 16ms | 64ms | 256ms | 1s | 4s | 16s | gt | max |
|---|---|---|---|---|---|---|---|---|---|---|---|
| pg162_def.cx9a2_bee | 99.833 | 0.167 | 0.006 | ||||||||
| pg162_def.cx9a2a_bee | 99.806 | 0.194 | 0.008 | ||||||||
| pg162_def.cx9a2b_bee | 99.875 | 0.125 | 0.009 | ||||||||
| pg162_def.cx9a2c_bee | 99.833 | 0.167 | 0.008 | ||||||||
| pg162_def.cx9a2e_bee | 99.736 | 0.264 | 0.008 | ||||||||
| pg162_def.cx9a2f_bee | 99.847 | 0.153 | 0.009 | ||||||||
| pg162_def.cx9a2g_bee | 99.833 | 0.167 | 0.006 | ||||||||
| pg162_def.cx9a2acef_bee | 99.833 | 0.167 | 0.008 | ||||||||
| pg162_def.cx9a2bcef_bee | 99.889 | 0.111 | 0.007 |
Delete response time histogram: each cell has the percentage of responses that take <= the time in the header and max is the max response time in seconds. For max values in the top 25% of the range have a red background and in the bottom 25% of the range have a green background. The red background is not used when the min value is within 80% of the max value.
| dbms | 256us | 1ms | 4ms | 16ms | 64ms | 256ms | 1s | 4s | 16s | gt | max |
|---|---|---|---|---|---|---|---|---|---|---|---|
| pg162_def.cx9a2_bee | 13.125 | 71.611 | 15.264 | 0.005 | |||||||
| pg162_def.cx9a2a_bee | 0.125 | 32.069 | 66.847 | 0.958 | 0.005 | ||||||
| pg162_def.cx9a2b_bee | 0.097 | 29.528 | 68.542 | 1.833 | 0.005 | ||||||
| pg162_def.cx9a2c_bee | 0.028 | 22.750 | 71.319 | 5.903 | 0.007 | ||||||
| pg162_def.cx9a2e_bee | 0.153 | 26.528 | 69.681 | 3.639 | 0.006 | ||||||
| pg162_def.cx9a2f_bee | 0.597 | 40.861 | 58.472 | 0.069 | 0.006 | ||||||
| pg162_def.cx9a2g_bee | 0.208 | 26.000 | 69.708 | 4.083 | 0.005 | ||||||
| pg162_def.cx9a2acef_bee | 0.486 | 35.292 | 64.097 | 0.125 | 0.006 | ||||||
| pg162_def.cx9a2bcef_bee | 23.069 | 70.764 | 6.167 | 0.005 |
Performance metrics for the DBMS listed above. Some are normalized by throughput, others are not. Legend for results is here.
ips	qps	rps	rmbps	wps	wmbps	rpq	rkbpq	wpi	wkbpi	csps	cpups	cspq	cpupq	dbgb1	dbgb2	rss	maxop	p50	p99	tag
100	8841	0	0.0	35.8	1.2	0.000	0.000	0.359	12.051	33956	12.9	3.841	117	8.2	42.5	1.1	0.004	8572	8236	pg162_def.cx9a2_bee
100	8858	0	0.0	35.8	1.2	0.000	0.000	0.359	12.055	34026	12.8	3.841	116	8.2	45.5	1.1	0.003	8599	8282	pg162_def.cx9a2a_bee
100	9025	0	0.0	35.8	1.2	0.000	0.000	0.359	12.051	34649	12.8	3.839	113	8.2	45.1	1.0	0.005	8630	8311	pg162_def.cx9a2b_bee
100	8706	0	0.0	35.4	1.2	0.000	0.000	0.355	12.080	33577	13.3	3.857	122	8.2	44.8	1.1	0.003	8358	8023	pg162_def.cx9a2c_bee
100	8709	0	0.0	33.1	1.2	0.000	0.000	0.332	12.201	33456	13.0	3.842	119	7.9	44.5	1.0	0.003	8393	8106	pg162_def.cx9a2e_bee
100	8854	0	0.0	33.5	1.2	0.000	0.000	0.336	12.231	34275	13.3	3.871	120	7.9	44.5	3.8	0.004	8548	8200	pg162_def.cx9a2f_bee
100	8958	0	0.0	35.7	1.2	0.000	0.000	0.357	12.039	34411	12.6	3.842	113	8.2	42.7	1.1	0.004	8488	8124	pg162_def.cx9a2g_bee
100	8979	0	0.0	32.9	1.2	0.000	0.000	0.330	12.237	34590	13.3	3.852	119	7.8	41.2	0.9	0.003	8614	8310	pg162_def.cx9a2acef_bee
100	8883	0	0.0	32.8	1.2	0.000	0.000	0.328	12.252	34220	13.2	3.853	119	7.8	41.3	3.5	0.005	8502	8230	pg162_def.cx9a2bcef_bee
qp100.L2
qp100.L2: point queries with 100 insert/s per client. Graphs for performance per 1-second interval are here.
Average throughput:
Query response time histogram: each cell has the percentage of responses that take <= the time in the header and max is the max response time in seconds. For max values in the top 25% of the range have a red background and in the bottom 25% of the range have a green background. The red background is not used when the min value is within 80% of the max value.
| dbms | 256us | 1ms | 4ms | 16ms | 64ms | 256ms | 1s | 4s | 16s | gt | max |
|---|---|---|---|---|---|---|---|---|---|---|---|
| pg162_def.cx9a2_bee | 86.028 | 13.972 | nonzero | 0.003 | |||||||
| pg162_def.cx9a2a_bee | 85.548 | 14.452 | nonzero | 0.003 | |||||||
| pg162_def.cx9a2b_bee | 85.918 | 14.082 | nonzero | 0.004 | |||||||
| pg162_def.cx9a2c_bee | 86.290 | 13.710 | nonzero | 0.003 | |||||||
| pg162_def.cx9a2e_bee | 85.631 | 14.369 | nonzero | 0.003 | |||||||
| pg162_def.cx9a2f_bee | 85.714 | 14.286 | nonzero | 0.003 | |||||||
| pg162_def.cx9a2g_bee | 85.834 | 14.165 | nonzero | 0.003 | |||||||
| pg162_def.cx9a2acef_bee | 86.365 | 13.635 | nonzero | nonzero | 0.004 | ||||||
| pg162_def.cx9a2bcef_bee | 85.897 | 14.103 | nonzero | 0.003 |
Insert response time histogram: each cell has the percentage of responses that take <= the time in the header and max is the max response time in seconds. For max values in the top 25% of the range have a red background and in the bottom 25% of the range have a green background. The red background is not used when the min value is within 80% of the max value.
| dbms | 256us | 1ms | 4ms | 16ms | 64ms | 256ms | 1s | 4s | 16s | gt | max |
|---|---|---|---|---|---|---|---|---|---|---|---|
| pg162_def.cx9a2_bee | 99.903 | 0.097 | 0.006 | ||||||||
| pg162_def.cx9a2a_bee | 99.958 | 0.042 | 0.008 | ||||||||
| pg162_def.cx9a2b_bee | 99.903 | 0.097 | 0.007 | ||||||||
| pg162_def.cx9a2c_bee | 99.889 | 0.111 | 0.008 | ||||||||
| pg162_def.cx9a2e_bee | 99.889 | 0.111 | 0.008 | ||||||||
| pg162_def.cx9a2f_bee | 99.917 | 0.083 | 0.006 | ||||||||
| pg162_def.cx9a2g_bee | 99.903 | 0.097 | 0.006 | ||||||||
| pg162_def.cx9a2acef_bee | 99.889 | 0.111 | 0.008 | ||||||||
| pg162_def.cx9a2bcef_bee | 99.917 | 0.083 | 0.008 |
Delete response time histogram: each cell has the percentage of responses that take <= the time in the header and max is the max response time in seconds. For max values in the top 25% of the range have a red background and in the bottom 25% of the range have a green background. The red background is not used when the min value is within 80% of the max value.
| dbms | 256us | 1ms | 4ms | 16ms | 64ms | 256ms | 1s | 4s | 16s | gt | max |
|---|---|---|---|---|---|---|---|---|---|---|---|
| pg162_def.cx9a2_bee | 1.806 | 96.889 | 0.056 | 1.250 | 0.009 | ||||||
| pg162_def.cx9a2a_bee | 1.403 | 98.583 | 0.014 | 0.002 | |||||||
| pg162_def.cx9a2b_bee | 1.389 | 98.569 | 0.042 | 0.003 | |||||||
| pg162_def.cx9a2c_bee | 1.583 | 98.361 | 0.056 | 0.003 | |||||||
| pg162_def.cx9a2e_bee | 1.264 | 98.694 | 0.042 | 0.003 | |||||||
| pg162_def.cx9a2f_bee | 1.028 | 98.958 | 0.014 | 0.002 | |||||||
| pg162_def.cx9a2g_bee | 1.542 | 98.431 | 0.028 | 0.003 | |||||||
| pg162_def.cx9a2acef_bee | 0.875 | 99.042 | 0.083 | 0.003 | |||||||
| pg162_def.cx9a2bcef_bee | 1.125 | 98.778 | 0.097 | 0.003 |
Performance metrics for the DBMS listed above. Some are normalized by throughput, others are not. Legend for results is here.
ips	qps	rps	rmbps	wps	wmbps	rpq	rkbpq	wpi	wkbpi	csps	cpups	cspq	cpupq	dbgb1	dbgb2	rss	maxop	p50	p99	tag
100	3468	0	0.0	62.2	1.5	0.000	0.000	0.623	15.520	14356	13.1	4.140	302	8.3	40.3	4.2	0.003	3451	3339	pg162_def.cx9a2_bee
100	3448	0	0.0	62.0	1.5	0.000	0.000	0.621	15.483	14277	13.1	4.141	304	8.2	43.2	1.0	0.003	3421	3308	pg162_def.cx9a2a_bee
100	3460	0	0.0	61.9	1.5	0.000	0.000	0.620	15.470	14315	13.1	4.138	303	8.2	42.9	4.2	0.004	3436	3324	pg162_def.cx9a2b_bee
100	3478	0	0.0	61.4	1.5	0.000	0.000	0.615	15.511	14448	13.3	4.154	306	8.2	42.6	4.1	0.003	3452	3326	pg162_def.cx9a2c_bee
100	3444	0	0.0	58.3	1.5	0.000	0.000	0.584	15.353	14264	13.1	4.141	304	7.9	42.2	3.5	0.003	3420	3292	pg162_def.cx9a2e_bee
100	3441	0	0.0	58.6	1.5	0.000	0.000	0.587	15.327	14269	13.1	4.147	305	7.9	42.2	0.6	0.003	3420	3307	pg162_def.cx9a2f_bee
100	3464	0	0.0	61.9	1.5	0.000	0.000	0.620	15.468	14349	13.1	4.143	303	8.2	40.5	0.9	0.003	3437	3324	pg162_def.cx9a2g_bee
100	3478	0	0.0	57.6	1.5	0.000	0.000	0.577	15.303	14439	13.3	4.151	306	7.8	38.8	3.8	0.004	3453	3324	pg162_def.cx9a2acef_bee
100	3457	0	0.0	57.6	1.5	0.000	0.000	0.577	15.293	14361	13.3	4.154	308	7.8	39.0	3.4	0.003	3436	3308	pg162_def.cx9a2bcef_bee
qr500.L3
qr500.L3: range queries with 500 insert/s per client. Graphs for performance per 1-second interval are here.
Average throughput:
Query response time histogram: each cell has the percentage of responses that take <= the time in the header and max is the max response time in seconds. For max values in the top 25% of the range have a red background and in the bottom 25% of the range have a green background. The red background is not used when the min value is within 80% of the max value.
| dbms | 256us | 1ms | 4ms | 16ms | 64ms | 256ms | 1s | 4s | 16s | gt | max |
|---|---|---|---|---|---|---|---|---|---|---|---|
| pg162_def.cx9a2_bee | 99.922 | 0.077 | nonzero | nonzero | nonzero | 0.019 | |||||
| pg162_def.cx9a2a_bee | 99.928 | 0.071 | 0.001 | nonzero | 0.012 | ||||||
| pg162_def.cx9a2b_bee | 99.924 | 0.076 | nonzero | nonzero | nonzero | 0.018 | |||||
| pg162_def.cx9a2c_bee | 99.855 | 0.145 | nonzero | nonzero | nonzero | 0.018 | |||||
| pg162_def.cx9a2e_bee | 99.941 | 0.059 | nonzero | nonzero | nonzero | 0.027 | |||||
| pg162_def.cx9a2f_bee | 99.943 | 0.057 | nonzero | nonzero | nonzero | 0.023 | |||||
| pg162_def.cx9a2g_bee | 99.922 | 0.077 | nonzero | nonzero | 0.013 | ||||||
| pg162_def.cx9a2acef_bee | 99.907 | 0.093 | nonzero | nonzero | nonzero | 0.017 | |||||
| pg162_def.cx9a2bcef_bee | 99.898 | 0.102 | nonzero | nonzero | nonzero | 0.019 |
Insert response time histogram: each cell has the percentage of responses that take <= the time in the header and max is the max response time in seconds. For max values in the top 25% of the range have a red background and in the bottom 25% of the range have a green background. The red background is not used when the min value is within 80% of the max value.
| dbms | 256us | 1ms | 4ms | 16ms | 64ms | 256ms | 1s | 4s | 16s | gt | max |
|---|---|---|---|---|---|---|---|---|---|---|---|
| pg162_def.cx9a2_bee | 99.969 | 0.031 | 0.008 | ||||||||
| pg162_def.cx9a2a_bee | 99.975 | 0.025 | 0.008 | ||||||||
| pg162_def.cx9a2b_bee | 99.969 | 0.031 | 0.007 | ||||||||
| pg162_def.cx9a2c_bee | 99.961 | 0.033 | 0.006 | 0.021 | |||||||
| pg162_def.cx9a2e_bee | 99.928 | 0.053 | 0.019 | 0.030 | |||||||
| pg162_def.cx9a2f_bee | 99.903 | 0.081 | 0.017 | 0.026 | |||||||
| pg162_def.cx9a2g_bee | 99.967 | 0.033 | 0.015 | ||||||||
| pg162_def.cx9a2acef_bee | 99.953 | 0.042 | 0.006 | 0.020 | |||||||
| pg162_def.cx9a2bcef_bee | 99.947 | 0.042 | 0.011 | 0.023 |
Delete response time histogram: each cell has the percentage of responses that take <= the time in the header and max is the max response time in seconds. For max values in the top 25% of the range have a red background and in the bottom 25% of the range have a green background. The red background is not used when the min value is within 80% of the max value.
| dbms | 256us | 1ms | 4ms | 16ms | 64ms | 256ms | 1s | 4s | 16s | gt | max |
|---|---|---|---|---|---|---|---|---|---|---|---|
| pg162_def.cx9a2_bee | 5.369 | 81.614 | 12.981 | 0.036 | 0.005 | ||||||
| pg162_def.cx9a2a_bee | 6.506 | 80.289 | 13.197 | 0.008 | 0.005 | ||||||
| pg162_def.cx9a2b_bee | 6.239 | 82.158 | 11.597 | 0.006 | 0.004 | ||||||
| pg162_def.cx9a2c_bee | 7.217 | 78.853 | 13.881 | 0.047 | 0.003 | 0.018 | |||||
| pg162_def.cx9a2e_bee | 6.072 | 76.942 | 0.108 | 16.858 | 0.019 | 0.028 | |||||
| pg162_def.cx9a2f_bee | 6.631 | 76.875 | 0.069 | 16.414 | 0.011 | 0.024 | |||||
| pg162_def.cx9a2g_bee | 5.858 | 80.889 | 13.169 | 0.083 | 0.014 | ||||||
| pg162_def.cx9a2acef_bee | 7.153 | 76.219 | 0.172 | 16.453 | 0.003 | 0.017 | |||||
| pg162_def.cx9a2bcef_bee | 7.878 | 75.606 | 0.086 | 16.425 | 0.006 | 0.021 |
Performance metrics for the DBMS listed above. Some are normalized by throughput, others are not. Legend for results is here.
ips	qps	rps	rmbps	wps	wmbps	rpq	rkbpq	wpi	wkbpi	csps	cpups	cspq	cpupq	dbgb1	dbgb2	rss	maxop	p50	p99	tag
499	8253	0	0.0	43.0	2.8	0.000	0.000	0.086	5.757	31863	12.8	3.861	124	8.3	36.9	3.8	0.019	8057	7142	pg162_def.cx9a2_bee
499	8434	0	0.0	42.9	2.8	0.000	0.000	0.086	5.756	32566	12.7	3.861	120	8.3	39.8	4.0	0.012	8187	7174	pg162_def.cx9a2a_bee
499	8324	0	0.0	42.9	2.8	0.000	0.000	0.086	5.739	32132	12.9	3.860	124	8.2	39.4	4.0	0.018	8172	7190	pg162_def.cx9a2b_bee
499	8221	0	0.0	42.7	2.8	0.000	0.000	0.086	5.745	31871	13.2	3.877	128	8.3	39.2	4.0	0.018	8040	7048	pg162_def.cx9a2c_bee
499	8470	0	0.0	46.1	2.6	0.000	0.000	0.092	5.406	32711	13.0	3.862	123	7.9	38.9	4.9	0.027	8197	7608	pg162_def.cx9a2e_bee
499	8680	0	0.0	46.3	2.7	0.000	0.000	0.093	5.448	33532	12.9	3.863	119	7.9	38.8	2.8	0.023	8368	7750	pg162_def.cx9a2f_bee
499	8296	0	0.0	42.8	2.8	0.000	0.000	0.086	5.749	32038	12.9	3.862	124	8.3	37.1	4.0	0.013	8026	7065	pg162_def.cx9a2g_bee
499	8729	0	0.0	45.5	2.6	0.000	0.000	0.091	5.390	33796	13.5	3.872	124	7.9	35.5	2.9	0.017	8467	7841	pg162_def.cx9a2acef_bee
499	8537	0	0.0	45.4	2.6	0.000	0.000	0.091	5.400	33043	13.4	3.871	126	7.9	35.7	3.4	0.019	8284	7718	pg162_def.cx9a2bcef_bee
qp500.L4
qp500.L4: point queries with 500 insert/s per client. Graphs for performance per 1-second interval are here.
Average throughput:
Query response time histogram: each cell has the percentage of responses that take <= the time in the header and max is the max response time in seconds. For max values in the top 25% of the range have a red background and in the bottom 25% of the range have a green background. The red background is not used when the min value is within 80% of the max value.
| dbms | 256us | 1ms | 4ms | 16ms | 64ms | 256ms | 1s | 4s | 16s | gt | max |
|---|---|---|---|---|---|---|---|---|---|---|---|
| pg162_def.cx9a2_bee | 85.551 | 14.448 | 0.001 | nonzero | 0.004 | ||||||
| pg162_def.cx9a2a_bee | 85.864 | 14.135 | 0.001 | nonzero | 0.022 | ||||||
| pg162_def.cx9a2b_bee | 85.622 | 14.377 | 0.001 | 0.003 | |||||||
| pg162_def.cx9a2c_bee | 85.762 | 14.238 | 0.001 | 0.003 | |||||||
| pg162_def.cx9a2e_bee | 85.882 | 14.117 | 0.001 | 0.003 | |||||||
| pg162_def.cx9a2f_bee | 85.625 | 14.374 | 0.001 | 0.003 | |||||||
| pg162_def.cx9a2g_bee | 85.673 | 14.326 | 0.001 | 0.003 | |||||||
| pg162_def.cx9a2acef_bee | 86.056 | 13.943 | 0.001 | 0.003 | |||||||
| pg162_def.cx9a2bcef_bee | 85.781 | 14.218 | 0.001 | nonzero | 0.005 |
Insert response time histogram: each cell has the percentage of responses that take <= the time in the header and max is the max response time in seconds. For max values in the top 25% of the range have a red background and in the bottom 25% of the range have a green background. The red background is not used when the min value is within 80% of the max value.
| dbms | 256us | 1ms | 4ms | 16ms | 64ms | 256ms | 1s | 4s | 16s | gt | max |
|---|---|---|---|---|---|---|---|---|---|---|---|
| pg162_def.cx9a2_bee | 99.981 | 0.019 | 0.008 | ||||||||
| pg162_def.cx9a2a_bee | 99.986 | 0.014 | 0.008 | ||||||||
| pg162_def.cx9a2b_bee | 99.978 | 0.022 | 0.006 | ||||||||
| pg162_def.cx9a2c_bee | 99.986 | 0.014 | 0.008 | ||||||||
| pg162_def.cx9a2e_bee | 99.953 | 0.022 | 0.025 | 0.023 | |||||||
| pg162_def.cx9a2f_bee | 99.964 | 0.022 | 0.014 | 0.030 | |||||||
| pg162_def.cx9a2g_bee | 99.994 | 0.006 | 0.008 | ||||||||
| pg162_def.cx9a2acef_bee | 99.944 | 0.042 | 0.014 | 0.030 | |||||||
| pg162_def.cx9a2bcef_bee | 99.950 | 0.033 | 0.017 | 0.030 |
Delete response time histogram: each cell has the percentage of responses that take <= the time in the header and max is the max response time in seconds. For max values in the top 25% of the range have a red background and in the bottom 25% of the range have a green background. The red background is not used when the min value is within 80% of the max value.
| dbms | 256us | 1ms | 4ms | 16ms | 64ms | 256ms | 1s | 4s | 16s | gt | max |
|---|---|---|---|---|---|---|---|---|---|---|---|
| pg162_def.cx9a2_bee | 17.933 | 66.061 | 13.983 | 2.022 | 0.007 | ||||||
| pg162_def.cx9a2a_bee | 19.314 | 66.133 | 13.914 | 0.639 | 0.005 | ||||||
| pg162_def.cx9a2b_bee | 18.408 | 67.658 | 13.761 | 0.172 | 0.004 | ||||||
| pg162_def.cx9a2c_bee | 19.917 | 65.825 | 13.392 | 0.867 | 0.006 | ||||||
| pg162_def.cx9a2e_bee | 17.942 | 64.386 | 8.142 | 9.517 | 0.014 | 0.020 | |||||
| pg162_def.cx9a2f_bee | 18.656 | 61.636 | 9.894 | 9.800 | 0.014 | 0.028 | |||||
| pg162_def.cx9a2g_bee | 18.606 | 65.350 | 13.503 | 2.542 | 0.005 | ||||||
| pg162_def.cx9a2acef_bee | 17.119 | 61.503 | 8.728 | 12.639 | 0.011 | 0.023 | |||||
| pg162_def.cx9a2bcef_bee | 16.792 | 59.861 | 8.939 | 14.397 | 0.011 | 0.021 |
Performance metrics for the DBMS listed above. Some are normalized by throughput, others are not. Legend for results is here.
ips	qps	rps	rmbps	wps	wmbps	rpq	rkbpq	wpi	wkbpi	csps	cpups	cspq	cpupq	dbgb1	dbgb2	rss	maxop	p50	p99	tag
499	3448	0	0.0	37.0	3.0	0.000	0.000	0.074	6.144	14405	13.4	4.179	311	8.3	32.5	1.7	0.004	3420	3310	pg162_def.cx9a2_bee
499	3445	0	0.0	36.9	3.0	0.000	0.000	0.074	6.125	14400	13.4	4.180	311	8.3	35.4	4.1	0.022	3420	3309	pg162_def.cx9a2a_bee
499	3441	0	0.0	36.9	3.0	0.000	0.000	0.074	6.117	14377	13.4	4.179	312	8.2	35.0	3.8	0.003	3420	3308	pg162_def.cx9a2b_bee
499	3448	0	0.0	36.8	3.0	0.000	0.000	0.074	6.089	14535	13.6	4.215	316	8.3	34.8	5.5	0.003	3420	3294	pg162_def.cx9a2c_bee
499	3459	0	0.0	35.7	2.8	0.000	0.000	0.072	5.751	14438	13.5	4.174	312	7.9	34.5	6.4	0.003	3436	3313	pg162_def.cx9a2e_bee
499	3431	0	0.0	36.0	2.8	0.000	0.000	0.072	5.766	14334	13.5	4.178	315	7.9	34.4	4.9	0.003	3405	3299	pg162_def.cx9a2f_bee
499	3443	0	0.0	36.8	3.0	0.000	0.000	0.074	6.124	14397	13.4	4.181	311	8.3	32.7	3.5	0.003	3420	3294	pg162_def.cx9a2g_bee
499	3464	0	0.0	35.6	2.8	0.000	0.000	0.071	5.734	14500	13.6	4.187	314	7.9	31.1	6.2	0.003	3438	3323	pg162_def.cx9a2acef_bee
499	3440	0	0.0	35.5	2.8	0.000	0.000	0.071	5.757	14414	13.7	4.191	319	7.9	31.3	2.4	0.005	3407	3292	pg162_def.cx9a2bcef_bee
qr1000.L5
qr1000.L5: range queries with 1000 insert/s per client. Graphs for performance per 1-second interval are here.
Average throughput:
Query response time histogram: each cell has the percentage of responses that take <= the time in the header and max is the max response time in seconds. For max values in the top 25% of the range have a red background and in the bottom 25% of the range have a green background. The red background is not used when the min value is within 80% of the max value.
| dbms | 256us | 1ms | 4ms | 16ms | 64ms | 256ms | 1s | 4s | 16s | gt | max |
|---|---|---|---|---|---|---|---|---|---|---|---|
| pg162_def.cx9a2_bee | 99.907 | 0.091 | 0.002 | nonzero | nonzero | 0.018 | |||||
| pg162_def.cx9a2a_bee | 99.917 | 0.082 | 0.002 | nonzero | nonzero | 0.019 | |||||
| pg162_def.cx9a2b_bee | 99.893 | 0.105 | 0.002 | nonzero | nonzero | 0.018 | |||||
| pg162_def.cx9a2c_bee | 99.835 | 0.163 | 0.002 | nonzero | nonzero | 0.023 | |||||
| pg162_def.cx9a2e_bee | 99.943 | 0.056 | nonzero | nonzero | 0.005 | ||||||
| pg162_def.cx9a2f_bee | 99.941 | 0.057 | 0.002 | nonzero | nonzero | 0.019 | |||||
| pg162_def.cx9a2g_bee | 99.901 | 0.098 | 0.002 | nonzero | nonzero | 0.023 | |||||
| pg162_def.cx9a2acef_bee | 99.901 | 0.099 | nonzero | 0.003 | |||||||
| pg162_def.cx9a2bcef_bee | 99.894 | 0.105 | nonzero | 0.003 |
Insert response time histogram: each cell has the percentage of responses that take <= the time in the header and max is the max response time in seconds. For max values in the top 25% of the range have a red background and in the bottom 25% of the range have a green background. The red background is not used when the min value is within 80% of the max value.
| dbms | 256us | 1ms | 4ms | 16ms | 64ms | 256ms | 1s | 4s | 16s | gt | max |
|---|---|---|---|---|---|---|---|---|---|---|---|
| pg162_def.cx9a2_bee | 99.978 | 0.013 | 0.010 | 0.027 | |||||||
| pg162_def.cx9a2a_bee | 99.951 | 0.037 | 0.011 | 0.025 | |||||||
| pg162_def.cx9a2b_bee | 99.967 | 0.028 | 0.006 | 0.028 | |||||||
| pg162_def.cx9a2c_bee | 99.979 | 0.015 | 0.006 | 0.022 | |||||||
| pg162_def.cx9a2e_bee | 99.983 | 0.017 | 0.013 | ||||||||
| pg162_def.cx9a2f_bee | 99.956 | 0.036 | 0.008 | 0.023 | |||||||
| pg162_def.cx9a2g_bee | 99.967 | 0.017 | 0.017 | 0.031 | |||||||
| pg162_def.cx9a2acef_bee | 99.990 | 0.010 | 0.007 | ||||||||
| pg162_def.cx9a2bcef_bee | 99.987 | 0.013 | 0.008 |
Delete response time histogram: each cell has the percentage of responses that take <= the time in the header and max is the max response time in seconds. For max values in the top 25% of the range have a red background and in the bottom 25% of the range have a green background. The red background is not used when the min value is within 80% of the max value.
| dbms | 256us | 1ms | 4ms | 16ms | 64ms | 256ms | 1s | 4s | 16s | gt | max |
|---|---|---|---|---|---|---|---|---|---|---|---|
| pg162_def.cx9a2_bee | 2.297 | 74.886 | 20.929 | 1.882 | 0.006 | 0.021 | |||||
| pg162_def.cx9a2a_bee | 2.457 | 74.129 | 20.939 | 2.467 | 0.008 | 0.021 | |||||
| pg162_def.cx9a2b_bee | 2.947 | 72.971 | 21.850 | 2.228 | 0.004 | 0.020 | |||||
| pg162_def.cx9a2c_bee | 2.849 | 75.679 | 20.825 | 0.642 | 0.006 | 0.020 | |||||
| pg162_def.cx9a2e_bee | 2.503 | 76.006 | 8.271 | 13.221 | 0.012 | ||||||
| pg162_def.cx9a2f_bee | 2.396 | 76.472 | 3.839 | 17.288 | 0.006 | 0.020 | |||||
| pg162_def.cx9a2g_bee | 2.461 | 74.792 | 21.050 | 1.683 | 0.014 | 0.024 | |||||
| pg162_def.cx9a2acef_bee | 2.986 | 74.054 | 7.315 | 15.644 | 0.011 | ||||||
| pg162_def.cx9a2bcef_bee | 3.292 | 75.463 | 7.065 | 14.181 | 0.014 |
Performance metrics for the DBMS listed above. Some are normalized by throughput, others are not. Legend for results is here.
ips	qps	rps	rmbps	wps	wmbps	rpq	rkbpq	wpi	wkbpi	csps	cpups	cspq	cpupq	dbgb1	dbgb2	rss	maxop	p50	p99	tag
998	8238	0	0.0	37.5	3.6	0.000	0.000	0.038	3.667	32051	13.8	3.891	134	8.3	28.4	2.6	0.018	8135	7032	pg162_def.cx9a2_bee
998	8520	0	0.0	37.4	3.6	0.000	0.000	0.038	3.653	33113	13.7	3.887	129	8.3	30.4	7.0	0.019	8436	7127	pg162_def.cx9a2a_bee
998	8373	0	0.0	37.7	3.6	0.000	0.000	0.038	3.660	32719	14.1	3.908	135	8.3	30.0	2.6	0.018	8263	7084	pg162_def.cx9a2b_bee
998	8285	0	0.0	33.7	3.6	0.000	0.000	0.034	3.651	32347	14.1	3.904	136	8.3	29.7	3.9	0.023	8150	6984	pg162_def.cx9a2c_bee
998	8605	0	0.0	22.3	3.5	0.000	0.000	0.022	3.550	33451	13.7	3.887	127	8.0	29.5	3.9	0.005	8236	7642	pg162_def.cx9a2e_bee
998	8557	0	0.0	33.5	3.4	0.000	0.000	0.034	3.476	33266	14.0	3.887	131	8.0	29.5	6.4	0.019	8310	7709	pg162_def.cx9a2f_bee
998	8372	0	0.0	37.7	3.6	0.000	0.000	0.038	3.648	32546	13.7	3.887	131	8.3	28.3	8.4	0.023	8264	7063	pg162_def.cx9a2g_bee
999	8605	0	0.0	22.2	3.4	0.000	0.000	0.022	3.531	33542	14.4	3.898	134	7.9	27.9	4.0	0.003	8327	7735	pg162_def.cx9a2acef_bee
998	8625	0	0.0	22.2	3.5	0.000	0.000	0.022	3.542	33626	14.1	3.899	131	7.9	27.9	6.4	0.003	8331	7671	pg162_def.cx9a2bcef_bee
qp1000.L6
qp1000.L6: point queries with 1000 insert/s per client. Graphs for performance per 1-second interval are here.
Average throughput:
Query response time histogram: each cell has the percentage of responses that take <= the time in the header and max is the max response time in seconds. For max values in the top 25% of the range have a red background and in the bottom 25% of the range have a green background. The red background is not used when the min value is within 80% of the max value.
| dbms | 256us | 1ms | 4ms | 16ms | 64ms | 256ms | 1s | 4s | 16s | gt | max |
|---|---|---|---|---|---|---|---|---|---|---|---|
| pg162_def.cx9a2_bee | 85.294 | 14.704 | 0.002 | nonzero | 0.016 | ||||||
| pg162_def.cx9a2a_bee | 86.095 | 13.903 | 0.002 | nonzero | 0.005 | ||||||
| pg162_def.cx9a2b_bee | 86.037 | 13.962 | 0.002 | nonzero | 0.005 | ||||||
| pg162_def.cx9a2c_bee | 85.873 | 14.126 | 0.002 | 0.004 | |||||||
| pg162_def.cx9a2e_bee | 85.904 | 14.094 | 0.002 | nonzero | 0.005 | ||||||
| pg162_def.cx9a2f_bee | 86.400 | 13.598 | 0.002 | nonzero | 0.006 | ||||||
| pg162_def.cx9a2g_bee | 85.583 | 14.416 | 0.002 | 0.003 | |||||||
| pg162_def.cx9a2acef_bee | 85.992 | 14.006 | 0.002 | 0.004 | |||||||
| pg162_def.cx9a2bcef_bee | 86.011 | 13.987 | 0.002 | 0.003 |
Insert response time histogram: each cell has the percentage of responses that take <= the time in the header and max is the max response time in seconds. For max values in the top 25% of the range have a red background and in the bottom 25% of the range have a green background. The red background is not used when the min value is within 80% of the max value.
| dbms | 256us | 1ms | 4ms | 16ms | 64ms | 256ms | 1s | 4s | 16s | gt | max |
|---|---|---|---|---|---|---|---|---|---|---|---|
| pg162_def.cx9a2_bee | 99.992 | 0.008 | 0.016 | ||||||||
| pg162_def.cx9a2a_bee | 99.989 | 0.011 | 0.014 | ||||||||
| pg162_def.cx9a2b_bee | 99.989 | 0.008 | 0.003 | 0.027 | |||||||
| pg162_def.cx9a2c_bee | 99.989 | 0.010 | 0.001 | 0.020 | |||||||
| pg162_def.cx9a2e_bee | 99.987 | 0.013 | 0.013 | ||||||||
| pg162_def.cx9a2f_bee | 99.979 | 0.017 | 0.004 | 0.018 | |||||||
| pg162_def.cx9a2g_bee | 99.994 | 0.006 | 0.008 | ||||||||
| pg162_def.cx9a2acef_bee | 99.993 | 0.007 | 0.008 | ||||||||
| pg162_def.cx9a2bcef_bee | 99.989 | 0.011 | 0.008 |
Delete response time histogram: each cell has the percentage of responses that take <= the time in the header and max is the max response time in seconds. For max values in the top 25% of the range have a red background and in the bottom 25% of the range have a green background. The red background is not used when the min value is within 80% of the max value.
| dbms | 256us | 1ms | 4ms | 16ms | 64ms | 256ms | 1s | 4s | 16s | gt | max |
|---|---|---|---|---|---|---|---|---|---|---|---|
| pg162_def.cx9a2_bee | 9.106 | 75.932 | 13.876 | 1.086 | 0.014 | ||||||
| pg162_def.cx9a2a_bee | 9.219 | 74.985 | 13.846 | 1.950 | 0.012 | ||||||
| pg162_def.cx9a2b_bee | 9.231 | 74.522 | 14.108 | 2.138 | 0.001 | 0.025 | |||||
| pg162_def.cx9a2c_bee | 9.479 | 75.586 | 13.557 | 1.376 | 0.001 | 0.017 | |||||
| pg162_def.cx9a2e_bee | 8.758 | 65.354 | 10.507 | 15.381 | 0.012 | ||||||
| pg162_def.cx9a2f_bee | 8.581 | 66.126 | 5.735 | 19.558 | 0.016 | ||||||
| pg162_def.cx9a2g_bee | 8.676 | 74.965 | 13.893 | 2.465 | 0.007 | ||||||
| pg162_def.cx9a2acef_bee | 8.396 | 68.875 | 8.561 | 14.168 | 0.011 | ||||||
| pg162_def.cx9a2bcef_bee | 7.987 | 66.040 | 9.851 | 16.121 | 0.011 |
Performance metrics for the DBMS listed above. Some are normalized by throughput, others are not. Legend for results is here.
ips	qps	rps	rmbps	wps	wmbps	rpq	rkbpq	wpi	wkbpi	csps	cpups	cspq	cpupq	dbgb1	dbgb2	rss	maxop	p50	p99	tag
998	3425	0	0.0	24.1	3.5	0.000	0.000	0.024	3.639	14565	14.0	4.253	327	8.3	28.4	0.1	0.016	3404	3292	pg162_def.cx9a2_bee
999	3466	0	0.0	24.2	3.6	0.000	0.000	0.024	3.648	14706	13.9	4.243	321	8.3	28.3	7.6	0.005	3451	3340	pg162_def.cx9a2a_bee
998	3465	0	0.0	24.4	3.6	0.000	0.000	0.024	3.681	14740	13.9	4.254	321	8.3	28.4	4.4	0.005	3438	3324	pg162_def.cx9a2b_bee
998	3452	0	0.0	24.2	3.5	0.000	0.000	0.024	3.640	14709	14.1	4.261	327	8.3	28.3	4.4	0.004	3436	3307	pg162_def.cx9a2c_bee
998	3453	0	0.0	23.2	3.4	0.000	0.000	0.023	3.469	14718	14.2	4.262	329	8.0	28.0	6.4	0.005	3422	3305	pg162_def.cx9a2e_bee
998	3476	0	0.0	25.4	3.4	0.000	0.000	0.025	3.457	14748	14.2	4.242	327	8.0	28.0	3.1	0.006	3452	3340	pg162_def.cx9a2f_bee
998	3440	0	0.0	24.1	3.6	0.000	0.000	0.024	3.656	14615	13.9	4.249	323	8.3	28.4	6.5	0.003	3420	3294	pg162_def.cx9a2g_bee
998	3461	0	0.0	21.6	3.4	0.000	0.000	0.022	3.454	14730	14.2	4.256	328	7.9	27.9	8.0	0.004	3436	3310	pg162_def.cx9a2acef_bee
998	3458	0	0.0	21.6	3.4	0.000	0.000	0.022	3.457	14721	14.3	4.257	331	7.9	28.0	7.2	0.003	3436	3319	pg162_def.cx9a2bcef_bee
l.i0
l.i0: load without secondary indexes
Performance metrics for all DBMS, not just the ones listed above. Some are normalized by throughput, others are not. Legend for results is here.
ips	qps	rps	rmbps	wps	wmbps	rpq	rkbpq	wpi	wkbpi	csps	cpups	cspq	cpupq	dbgb1	dbgb2	rss	maxop	p50	p99	tag
74442	0	0	0.0	86.8	31.9	0.000	0.000	0.001	0.439	9234	23.0	0.124	25	2.9	7.8	0.2	0.003	74855	72994	pg162_def.cx9a2_bee
75000	0	0	0.0	87.2	32.0	0.000	0.000	0.001	0.437	9257	23.2	0.123	25	2.9	7.8	2.9	0.003	75147	73217	pg162_def.cx9a2a_bee
73710	0	0	0.0	86.5	31.7	0.000	0.000	0.001	0.440	9133	22.9	0.124	25	2.9	7.8	0.2	0.003	74120	71617	pg162_def.cx9a2b_bee
74257	0	0	0.0	87.2	31.8	0.000	0.000	0.001	0.439	9261	23.5	0.125	25	2.9	7.8	0.2	0.003	74527	71958	pg162_def.cx9a2c_bee
74442	0	0	0.0	87.1	32.0	0.000	0.000	0.001	0.440	9264	23.2	0.124	25	2.9	7.8	2.8	0.003	75017	71947	pg162_def.cx9a2e_bee
74627	0	0	0.0	87.2	32.0	0.000	0.000	0.001	0.439	9403	23.1	0.126	25	2.9	7.8	2.8	0.003	75015	72251	pg162_def.cx9a2f_bee
74627	0	0	0.0	87.0	32.0	0.000	0.000	0.001	0.440	9244	23.1	0.124	25	2.9	7.8	0.2	0.003	75020	73013	pg162_def.cx9a2g_bee
74442	0	0	0.0	87.4	32.0	0.000	0.000	0.001	0.440	9319	23.5	0.125	25	2.9	7.8	2.8	0.004	75026	70888	pg162_def.cx9a2acef_bee
74627	0	0	0.0	87.6	32.0	0.000	0.000	0.001	0.439	9280	23.5	0.124	25	2.9	7.8	0.1	0.003	74919	72992	pg162_def.cx9a2bcef_bee
l.x
l.x: create secondary indexes
Performance metrics for all DBMS, not just the ones listed above. Some are normalized by throughput, others are not. Legend for results is here.
ips	qps	rps	rmbps	wps	wmbps	rpq	rkbpq	wpi	wkbpi	csps	cpups	cspq	cpupq	dbgb1	dbgb2	rss	maxop	p50	p99	tag
230770	0	0	0.0	180.9	84.5	0.000	0.000	0.001	0.375	429	11.3	0.002	4	5.8	13.3	0.0	0.003	NA	NA	pg162_def.cx9a2_bee
229008	0	0	0.0	171.3	79.7	0.000	0.000	0.001	0.357	589	11.4	0.003	4	5.8	13.3	3.1	0.003	NA	NA	pg162_def.cx9a2a_bee
229008	0	0	0.0	168.5	78.3	0.000	0.000	0.001	0.350	439	11.4	0.002	4	5.8	13.3	3.1	0.003	NA	NA	pg162_def.cx9a2b_bee
230770	0	0	0.0	171.8	79.6	0.000	0.000	0.001	0.353	671	11.7	0.003	4	5.8	13.3	3.1	0.003	NA	NA	pg162_def.cx9a2c_bee
230770	0	0	0.0	183.2	85.4	0.000	0.000	0.001	0.379	700	11.4	0.003	4	5.8	13.3	3.1	0.003	NA	NA	pg162_def.cx9a2e_bee
230770	0	0	0.0	183.4	85.2	0.000	0.000	0.001	0.378	722	11.5	0.003	4	5.8	13.3	3.1	0.002	NA	NA	pg162_def.cx9a2f_bee
227273	0	0	0.0	162.5	75.8	0.000	0.000	0.001	0.342	407	11.4	0.002	4	5.8	13.3	3.1	0.003	NA	NA	pg162_def.cx9a2g_bee
229008	0	0	0.0	164.3	76.3	0.000	0.000	0.001	0.341	505	11.7	0.002	4	5.8	13.3	3.1	0.003	NA	NA	pg162_def.cx9a2acef_bee
230770	0	0	0.0	176.6	81.8	0.000	0.000	0.001	0.363	488	11.5	0.002	4	5.8	13.3	3.1	0.003	NA	NA	pg162_def.cx9a2bcef_bee
l.i1
l.i1: continue load after secondary indexes created with 50 inserts per transaction
Performance metrics for all DBMS, not just the ones listed above. Some are normalized by throughput, others are not. Legend for results is here.
ips	qps	rps	rmbps	wps	wmbps	rpq	rkbpq	wpi	wkbpi	csps	cpups	cspq	cpupq	dbgb1	dbgb2	rss	maxop	p50	p99	tag
20790	0	27	0.1	88.6	25.7	0.001	0.006	0.004	1.264	10108	22.3	0.486	86	8.2	48.2	3.0	0.021	28608	5498	pg162_def.cx9a2_bee
20222	0	27	0.1	87.7	25.1	0.001	0.006	0.004	1.271	9841	22.0	0.487	87	8.2	47.2	8.0	0.036	28469	4944	pg162_def.cx9a2a_bee
20248	0	27	0.1	85.7	24.9	0.001	0.006	0.004	1.257	9845	22.1	0.486	87	8.2	47.1	7.3	0.020	28380	4645	pg162_def.cx9a2b_bee
21912	0	30	0.1	93.2	26.8	0.001	0.006	0.004	1.253	10776	23.2	0.492	85	8.1	47.4	8.1	0.015	28617	6047	pg162_def.cx9a2c_bee
24502	0	31	0.1	107.2	30.1	0.001	0.006	0.004	1.257	11901	24.3	0.486	79	7.8	47.8	7.7	0.019	28968	5647	pg162_def.cx9a2e_bee
22772	0	29	0.1	99.7	28.0	0.001	0.006	0.004	1.260	11303	23.6	0.496	83	7.9	47.9	6.4	0.038	29019	5596	pg162_def.cx9a2f_bee
20035	0	26	0.1	85.0	24.7	0.001	0.006	0.004	1.262	9753	21.9	0.487	87	8.2	48.2	6.0	0.032	28569	5594	pg162_def.cx9a2g_bee
22459	0	28	0.1	100.7	27.6	0.001	0.005	0.004	1.258	11064	23.9	0.493	85	7.8	47.8	6.5	0.040	28767	6892	pg162_def.cx9a2acef_bee
20121	0	25	0.1	90.2	24.6	0.001	0.006	0.004	1.252	9929	22.8	0.493	91	7.7	47.1	6.0	0.021	28168	6842	pg162_def.cx9a2bcef_bee
l.i2
l.i2: continue load after secondary indexes created with 5 inserts per transaction
Performance metrics for all DBMS, not just the ones listed above. Some are normalized by throughput, others are not. Legend for results is here.
ips	qps	rps	rmbps	wps	wmbps	rpq	rkbpq	wpi	wkbpi	csps	cpups	cspq	cpupq	dbgb1	dbgb2	rss	maxop	p50	p99	tag
4506	0	0	0.0	35.1	7.1	0.000	0.000	0.008	1.607	21433	18.4	4.757	327	8.2	48.3	3.2	0.008	1249	624	pg162_def.cx9a2_bee
5304	0	0	0.0	35.9	7.8	0.000	0.000	0.007	1.509	25308	19.6	4.772	296	8.2	48.3	5.8	0.022	1618	849	pg162_def.cx9a2a_bee
5052	0	0	0.0	35.3	7.3	0.000	0.000	0.007	1.483	24072	19.2	4.765	304	8.2	47.2	8.3	0.021	1448	759	pg162_def.cx9a2b_bee
5963	0	0	0.0	37.3	8.0	0.000	0.000	0.006	1.382	28483	20.7	4.777	278	8.2	47.4	0.0	0.018	1989	1004	pg162_def.cx9a2c_bee
5135	0	0	0.0	33.7	7.1	0.000	0.000	0.007	1.416	24456	19.5	4.763	304	7.9	47.9	4.3	0.020	1638	634	pg162_def.cx9a2e_bee
6048	0	0	0.0	37.2	8.1	0.000	0.000	0.006	1.364	29066	20.7	4.806	274	7.9	48.0	6.4	0.026	2063	1019	pg162_def.cx9a2f_bee
4625	0	0	0.0	35.3	7.2	0.000	0.000	0.008	1.597	22010	18.6	4.759	322	8.2	48.3	8.4	0.020	1289	744	pg162_def.cx9a2g_bee
3500	0	0	0.0	30.5	5.8	0.000	0.000	0.009	1.698	16789	17.4	4.797	398	7.8	47.9	7.9	0.022	895	660	pg162_def.cx9a2acef_bee
3406	0	0	0.0	30.8	5.7	0.000	0.000	0.009	1.710	16337	17.3	4.796	406	7.8	47.2	4.4	0.020	884	669	pg162_def.cx9a2bcef_bee
qr100.L1
qr100.L1: range queries with 100 insert/s per client
Performance metrics for all DBMS, not just the ones listed above. Some are normalized by throughput, others are not. Legend for results is here.
ips	qps	rps	rmbps	wps	wmbps	rpq	rkbpq	wpi	wkbpi	csps	cpups	cspq	cpupq	dbgb1	dbgb2	rss	maxop	p50	p99	tag
100	8841	0	0.0	35.8	1.2	0.000	0.000	0.359	12.051	33956	12.9	3.841	117	8.2	42.5	1.1	0.004	8572	8236	pg162_def.cx9a2_bee
100	8858	0	0.0	35.8	1.2	0.000	0.000	0.359	12.055	34026	12.8	3.841	116	8.2	45.5	1.1	0.003	8599	8282	pg162_def.cx9a2a_bee
100	9025	0	0.0	35.8	1.2	0.000	0.000	0.359	12.051	34649	12.8	3.839	113	8.2	45.1	1.0	0.005	8630	8311	pg162_def.cx9a2b_bee
100	8706	0	0.0	35.4	1.2	0.000	0.000	0.355	12.080	33577	13.3	3.857	122	8.2	44.8	1.1	0.003	8358	8023	pg162_def.cx9a2c_bee
100	8709	0	0.0	33.1	1.2	0.000	0.000	0.332	12.201	33456	13.0	3.842	119	7.9	44.5	1.0	0.003	8393	8106	pg162_def.cx9a2e_bee
100	8854	0	0.0	33.5	1.2	0.000	0.000	0.336	12.231	34275	13.3	3.871	120	7.9	44.5	3.8	0.004	8548	8200	pg162_def.cx9a2f_bee
100	8958	0	0.0	35.7	1.2	0.000	0.000	0.357	12.039	34411	12.6	3.842	113	8.2	42.7	1.1	0.004	8488	8124	pg162_def.cx9a2g_bee
100	8979	0	0.0	32.9	1.2	0.000	0.000	0.330	12.237	34590	13.3	3.852	119	7.8	41.2	0.9	0.003	8614	8310	pg162_def.cx9a2acef_bee
100	8883	0	0.0	32.8	1.2	0.000	0.000	0.328	12.252	34220	13.2	3.853	119	7.8	41.3	3.5	0.005	8502	8230	pg162_def.cx9a2bcef_bee
qp100.L2
qp100.L2: point queries with 100 insert/s per client
Performance metrics for all DBMS, not just the ones listed above. Some are normalized by throughput, others are not. Legend for results is here.
ips	qps	rps	rmbps	wps	wmbps	rpq	rkbpq	wpi	wkbpi	csps	cpups	cspq	cpupq	dbgb1	dbgb2	rss	maxop	p50	p99	tag
100	3468	0	0.0	62.2	1.5	0.000	0.000	0.623	15.520	14356	13.1	4.140	302	8.3	40.3	4.2	0.003	3451	3339	pg162_def.cx9a2_bee
100	3448	0	0.0	62.0	1.5	0.000	0.000	0.621	15.483	14277	13.1	4.141	304	8.2	43.2	1.0	0.003	3421	3308	pg162_def.cx9a2a_bee
100	3460	0	0.0	61.9	1.5	0.000	0.000	0.620	15.470	14315	13.1	4.138	303	8.2	42.9	4.2	0.004	3436	3324	pg162_def.cx9a2b_bee
100	3478	0	0.0	61.4	1.5	0.000	0.000	0.615	15.511	14448	13.3	4.154	306	8.2	42.6	4.1	0.003	3452	3326	pg162_def.cx9a2c_bee
100	3444	0	0.0	58.3	1.5	0.000	0.000	0.584	15.353	14264	13.1	4.141	304	7.9	42.2	3.5	0.003	3420	3292	pg162_def.cx9a2e_bee
100	3441	0	0.0	58.6	1.5	0.000	0.000	0.587	15.327	14269	13.1	4.147	305	7.9	42.2	0.6	0.003	3420	3307	pg162_def.cx9a2f_bee
100	3464	0	0.0	61.9	1.5	0.000	0.000	0.620	15.468	14349	13.1	4.143	303	8.2	40.5	0.9	0.003	3437	3324	pg162_def.cx9a2g_bee
100	3478	0	0.0	57.6	1.5	0.000	0.000	0.577	15.303	14439	13.3	4.151	306	7.8	38.8	3.8	0.004	3453	3324	pg162_def.cx9a2acef_bee
100	3457	0	0.0	57.6	1.5	0.000	0.000	0.577	15.293	14361	13.3	4.154	308	7.8	39.0	3.4	0.003	3436	3308	pg162_def.cx9a2bcef_bee
qr500.L3
qr500.L3: range queries with 500 insert/s per client
Performance metrics for all DBMS, not just the ones listed above. Some are normalized by throughput, others are not. Legend for results is here.
ips	qps	rps	rmbps	wps	wmbps	rpq	rkbpq	wpi	wkbpi	csps	cpups	cspq	cpupq	dbgb1	dbgb2	rss	maxop	p50	p99	tag
499	8253	0	0.0	43.0	2.8	0.000	0.000	0.086	5.757	31863	12.8	3.861	124	8.3	36.9	3.8	0.019	8057	7142	pg162_def.cx9a2_bee
499	8434	0	0.0	42.9	2.8	0.000	0.000	0.086	5.756	32566	12.7	3.861	120	8.3	39.8	4.0	0.012	8187	7174	pg162_def.cx9a2a_bee
499	8324	0	0.0	42.9	2.8	0.000	0.000	0.086	5.739	32132	12.9	3.860	124	8.2	39.4	4.0	0.018	8172	7190	pg162_def.cx9a2b_bee
499	8221	0	0.0	42.7	2.8	0.000	0.000	0.086	5.745	31871	13.2	3.877	128	8.3	39.2	4.0	0.018	8040	7048	pg162_def.cx9a2c_bee
499	8470	0	0.0	46.1	2.6	0.000	0.000	0.092	5.406	32711	13.0	3.862	123	7.9	38.9	4.9	0.027	8197	7608	pg162_def.cx9a2e_bee
499	8680	0	0.0	46.3	2.7	0.000	0.000	0.093	5.448	33532	12.9	3.863	119	7.9	38.8	2.8	0.023	8368	7750	pg162_def.cx9a2f_bee
499	8296	0	0.0	42.8	2.8	0.000	0.000	0.086	5.749	32038	12.9	3.862	124	8.3	37.1	4.0	0.013	8026	7065	pg162_def.cx9a2g_bee
499	8729	0	0.0	45.5	2.6	0.000	0.000	0.091	5.390	33796	13.5	3.872	124	7.9	35.5	2.9	0.017	8467	7841	pg162_def.cx9a2acef_bee
499	8537	0	0.0	45.4	2.6	0.000	0.000	0.091	5.400	33043	13.4	3.871	126	7.9	35.7	3.4	0.019	8284	7718	pg162_def.cx9a2bcef_bee
qp500.L4
qp500.L4: point queries with 500 insert/s per client
Performance metrics for all DBMS, not just the ones listed above. Some are normalized by throughput, others are not. Legend for results is here.
ips	qps	rps	rmbps	wps	wmbps	rpq	rkbpq	wpi	wkbpi	csps	cpups	cspq	cpupq	dbgb1	dbgb2	rss	maxop	p50	p99	tag
499	3448	0	0.0	37.0	3.0	0.000	0.000	0.074	6.144	14405	13.4	4.179	311	8.3	32.5	1.7	0.004	3420	3310	pg162_def.cx9a2_bee
499	3445	0	0.0	36.9	3.0	0.000	0.000	0.074	6.125	14400	13.4	4.180	311	8.3	35.4	4.1	0.022	3420	3309	pg162_def.cx9a2a_bee
499	3441	0	0.0	36.9	3.0	0.000	0.000	0.074	6.117	14377	13.4	4.179	312	8.2	35.0	3.8	0.003	3420	3308	pg162_def.cx9a2b_bee
499	3448	0	0.0	36.8	3.0	0.000	0.000	0.074	6.089	14535	13.6	4.215	316	8.3	34.8	5.5	0.003	3420	3294	pg162_def.cx9a2c_bee
499	3459	0	0.0	35.7	2.8	0.000	0.000	0.072	5.751	14438	13.5	4.174	312	7.9	34.5	6.4	0.003	3436	3313	pg162_def.cx9a2e_bee
499	3431	0	0.0	36.0	2.8	0.000	0.000	0.072	5.766	14334	13.5	4.178	315	7.9	34.4	4.9	0.003	3405	3299	pg162_def.cx9a2f_bee
499	3443	0	0.0	36.8	3.0	0.000	0.000	0.074	6.124	14397	13.4	4.181	311	8.3	32.7	3.5	0.003	3420	3294	pg162_def.cx9a2g_bee
499	3464	0	0.0	35.6	2.8	0.000	0.000	0.071	5.734	14500	13.6	4.187	314	7.9	31.1	6.2	0.003	3438	3323	pg162_def.cx9a2acef_bee
499	3440	0	0.0	35.5	2.8	0.000	0.000	0.071	5.757	14414	13.7	4.191	319	7.9	31.3	2.4	0.005	3407	3292	pg162_def.cx9a2bcef_bee
qr1000.L5
qr1000.L5: range queries with 1000 insert/s per client
Performance metrics for all DBMS, not just the ones listed above. Some are normalized by throughput, others are not. Legend for results is here.
ips	qps	rps	rmbps	wps	wmbps	rpq	rkbpq	wpi	wkbpi	csps	cpups	cspq	cpupq	dbgb1	dbgb2	rss	maxop	p50	p99	tag
998	8238	0	0.0	37.5	3.6	0.000	0.000	0.038	3.667	32051	13.8	3.891	134	8.3	28.4	2.6	0.018	8135	7032	pg162_def.cx9a2_bee
998	8520	0	0.0	37.4	3.6	0.000	0.000	0.038	3.653	33113	13.7	3.887	129	8.3	30.4	7.0	0.019	8436	7127	pg162_def.cx9a2a_bee
998	8373	0	0.0	37.7	3.6	0.000	0.000	0.038	3.660	32719	14.1	3.908	135	8.3	30.0	2.6	0.018	8263	7084	pg162_def.cx9a2b_bee
998	8285	0	0.0	33.7	3.6	0.000	0.000	0.034	3.651	32347	14.1	3.904	136	8.3	29.7	3.9	0.023	8150	6984	pg162_def.cx9a2c_bee
998	8605	0	0.0	22.3	3.5	0.000	0.000	0.022	3.550	33451	13.7	3.887	127	8.0	29.5	3.9	0.005	8236	7642	pg162_def.cx9a2e_bee
998	8557	0	0.0	33.5	3.4	0.000	0.000	0.034	3.476	33266	14.0	3.887	131	8.0	29.5	6.4	0.019	8310	7709	pg162_def.cx9a2f_bee
998	8372	0	0.0	37.7	3.6	0.000	0.000	0.038	3.648	32546	13.7	3.887	131	8.3	28.3	8.4	0.023	8264	7063	pg162_def.cx9a2g_bee
999	8605	0	0.0	22.2	3.4	0.000	0.000	0.022	3.531	33542	14.4	3.898	134	7.9	27.9	4.0	0.003	8327	7735	pg162_def.cx9a2acef_bee
998	8625	0	0.0	22.2	3.5	0.000	0.000	0.022	3.542	33626	14.1	3.899	131	7.9	27.9	6.4	0.003	8331	7671	pg162_def.cx9a2bcef_bee
qp1000.L6
qp1000.L6: point queries with 1000 insert/s per client
Performance metrics for all DBMS, not just the ones listed above. Some are normalized by throughput, others are not. Legend for results is here.
ips	qps	rps	rmbps	wps	wmbps	rpq	rkbpq	wpi	wkbpi	csps	cpups	cspq	cpupq	dbgb1	dbgb2	rss	maxop	p50	p99	tag
998	3425	0	0.0	24.1	3.5	0.000	0.000	0.024	3.639	14565	14.0	4.253	327	8.3	28.4	0.1	0.016	3404	3292	pg162_def.cx9a2_bee
999	3466	0	0.0	24.2	3.6	0.000	0.000	0.024	3.648	14706	13.9	4.243	321	8.3	28.3	7.6	0.005	3451	3340	pg162_def.cx9a2a_bee
998	3465	0	0.0	24.4	3.6	0.000	0.000	0.024	3.681	14740	13.9	4.254	321	8.3	28.4	4.4	0.005	3438	3324	pg162_def.cx9a2b_bee
998	3452	0	0.0	24.2	3.5	0.000	0.000	0.024	3.640	14709	14.1	4.261	327	8.3	28.3	4.4	0.004	3436	3307	pg162_def.cx9a2c_bee
998	3453	0	0.0	23.2	3.4	0.000	0.000	0.023	3.469	14718	14.2	4.262	329	8.0	28.0	6.4	0.005	3422	3305	pg162_def.cx9a2e_bee
998	3476	0	0.0	25.4	3.4	0.000	0.000	0.025	3.457	14748	14.2	4.242	327	8.0	28.0	3.1	0.006	3452	3340	pg162_def.cx9a2f_bee
998	3440	0	0.0	24.1	3.6	0.000	0.000	0.024	3.656	14615	13.9	4.249	323	8.3	28.4	6.5	0.003	3420	3294	pg162_def.cx9a2g_bee
998	3461	0	0.0	21.6	3.4	0.000	0.000	0.022	3.454	14730	14.2	4.256	328	7.9	27.9	8.0	0.004	3436	3310	pg162_def.cx9a2acef_bee
998	3458	0	0.0	21.6	3.4	0.000	0.000	0.022	3.457	14721	14.3	4.257	331	7.9	28.0	7.2	0.003	3436	3319	pg162_def.cx9a2bcef_bee
l.i0
- l.i0: load without secondary indexes
- Legend for results is here.
- Each entry lists the percentage of responses that fit in that bucket (slower than max time for previous bucket, faster than min time for next bucket).
Insert response time histogram
256us	1ms	4ms	16ms	64ms	256ms	1s	4s	16s	gt	max	tag
0.000	0.000	100.000	0.000	0.000	0.000	0.000	0.000	0.000	0.000	0.003	pg162_def.cx9a2_bee
0.000	0.000	100.000	0.000	0.000	0.000	0.000	0.000	0.000	0.000	0.003	pg162_def.cx9a2a_bee
0.000	0.000	100.000	0.000	0.000	0.000	0.000	0.000	0.000	0.000	0.003	pg162_def.cx9a2b_bee
0.000	0.000	100.000	0.000	0.000	0.000	0.000	0.000	0.000	0.000	0.003	pg162_def.cx9a2c_bee
0.000	0.000	100.000	0.000	0.000	0.000	0.000	0.000	0.000	0.000	0.003	pg162_def.cx9a2e_bee
0.000	0.000	100.000	0.000	0.000	0.000	0.000	0.000	0.000	0.000	0.003	pg162_def.cx9a2f_bee
0.000	0.000	100.000	0.000	0.000	0.000	0.000	0.000	0.000	0.000	0.003	pg162_def.cx9a2g_bee
0.000	0.000	100.000	0.000	0.000	0.000	0.000	0.000	0.000	0.000	0.004	pg162_def.cx9a2acef_bee
0.000	0.000	100.000	0.000	0.000	0.000	0.000	0.000	0.000	0.000	0.003	pg162_def.cx9a2bcef_bee
l.x
- l.x: create secondary indexes
- Legend for results is here.
- Each entry lists the percentage of responses that fit in that bucket (slower than max time for previous bucket, faster than min time for next bucket).
TODO - determine whether there is data for create index response time
l.i1
- l.i1: continue load after secondary indexes created with 50 inserts per transaction
- Legend for results is here.
- Each entry lists the percentage of responses that fit in that bucket (slower than max time for previous bucket, faster than min time for next bucket).
Insert response time histogram
256us	1ms	4ms	16ms	64ms	256ms	1s	4s	16s	gt	max	tag
0.000	0.000	99.998	0.001	nonzero	0.000	0.000	0.000	0.000	0.000	0.021	pg162_def.cx9a2_bee
0.000	0.000	99.998	0.002	nonzero	0.000	0.000	0.000	0.000	0.000	0.036	pg162_def.cx9a2a_bee
0.000	0.000	99.998	0.002	nonzero	0.000	0.000	0.000	0.000	0.000	0.020	pg162_def.cx9a2b_bee
0.000	0.000	99.999	0.001	0.000	0.000	0.000	0.000	0.000	0.000	0.015	pg162_def.cx9a2c_bee
0.000	0.000	99.998	0.002	nonzero	0.000	0.000	0.000	0.000	0.000	0.019	pg162_def.cx9a2e_bee
0.000	0.000	99.997	0.003	nonzero	0.000	0.000	0.000	0.000	0.000	0.038	pg162_def.cx9a2f_bee
0.000	0.000	99.998	0.002	nonzero	0.000	0.000	0.000	0.000	0.000	0.032	pg162_def.cx9a2g_bee
0.000	0.000	99.996	0.002	0.002	0.000	0.000	0.000	0.000	0.000	0.040	pg162_def.cx9a2acef_bee
0.000	0.000	99.999	0.001	nonzero	0.000	0.000	0.000	0.000	0.000	0.021	pg162_def.cx9a2bcef_bee
Delete response time histogram
256us	1ms	4ms	16ms	64ms	256ms	1s	4s	16s	gt	max	tag
0.109	82.300	3.475	14.116	nonzero	0.000	0.000	0.000	0.000	0.000	0.019	pg162_def.cx9a2_bee
0.103	81.961	2.923	15.013	nonzero	0.000	0.000	0.000	0.000	0.000	0.036	pg162_def.cx9a2a_bee
0.114	81.251	3.414	15.221	nonzero	0.000	0.000	0.000	0.000	0.000	0.018	pg162_def.cx9a2b_bee
0.232	80.383	7.244	12.142	0.000	0.000	0.000	0.000	0.000	0.000	0.013	pg162_def.cx9a2c_bee
0.120	82.358	11.909	5.613	nonzero	0.000	0.000	0.000	0.000	0.000	0.017	pg162_def.cx9a2e_bee
0.310	82.346	8.443	8.902	nonzero	0.000	0.000	0.000	0.000	0.000	0.018	pg162_def.cx9a2f_bee
0.131	82.176	2.496	15.197	nonzero	0.000	0.000	0.000	0.000	0.000	0.022	pg162_def.cx9a2g_bee
0.231	79.429	9.044	11.295	0.001	0.000	0.000	0.000	0.000	0.000	0.037	pg162_def.cx9a2acef_bee
0.205	79.627	1.319	18.849	nonzero	0.000	0.000	0.000	0.000	0.000	0.016	pg162_def.cx9a2bcef_bee
l.i2
- l.i2: continue load after secondary indexes created with 5 inserts per transaction
- Legend for results is here.
- Each entry lists the percentage of responses that fit in that bucket (slower than max time for previous bucket, faster than min time for next bucket).
Insert response time histogram
256us	1ms	4ms	16ms	64ms	256ms	1s	4s	16s	gt	max	tag
18.831	81.167	0.002	nonzero	0.000	0.000	0.000	0.000	0.000	0.000	0.008	pg162_def.cx9a2_bee
17.197	82.800	0.003	nonzero	nonzero	0.000	0.000	0.000	0.000	0.000	0.022	pg162_def.cx9a2a_bee
19.294	80.704	0.002	nonzero	nonzero	0.000	0.000	0.000	0.000	0.000	0.021	pg162_def.cx9a2b_bee
21.536	78.461	0.002	nonzero	nonzero	0.000	0.000	0.000	0.000	0.000	0.018	pg162_def.cx9a2c_bee
17.115	82.882	0.002	nonzero	nonzero	0.000	0.000	0.000	0.000	0.000	0.020	pg162_def.cx9a2e_bee
23.615	76.381	0.003	0.001	nonzero	0.000	0.000	0.000	0.000	0.000	0.026	pg162_def.cx9a2f_bee
18.012	81.986	0.002	nonzero	nonzero	0.000	0.000	0.000	0.000	0.000	0.020	pg162_def.cx9a2g_bee
21.124	78.872	0.003	nonzero	nonzero	0.000	0.000	0.000	0.000	0.000	0.022	pg162_def.cx9a2acef_bee
20.771	79.227	0.002	nonzero	nonzero	0.000	0.000	0.000	0.000	0.000	0.020	pg162_def.cx9a2bcef_bee
Delete response time histogram
256us	1ms	4ms	16ms	64ms	256ms	1s	4s	16s	gt	max	tag
55.000	26.064	9.076	9.860	0.000	0.000	0.000	0.000	0.000	0.000	0.013	pg162_def.cx9a2_bee
54.038	26.823	14.196	4.943	nonzero	0.000	0.000	0.000	0.000	0.000	0.021	pg162_def.cx9a2a_bee
55.421	25.352	12.163	7.064	nonzero	0.000	0.000	0.000	0.000	0.000	0.021	pg162_def.cx9a2b_bee
57.425	23.500	16.890	2.185	nonzero	0.000	0.000	0.000	0.000	0.000	0.018	pg162_def.cx9a2c_bee
53.439	26.308	15.439	4.813	nonzero	0.000	0.000	0.000	0.000	0.000	0.020	pg162_def.cx9a2e_bee
57.578	23.366	16.669	2.387	nonzero	0.000	0.000	0.000	0.000	0.000	0.026	pg162_def.cx9a2f_bee
54.485	25.786	10.239	9.490	nonzero	0.000	0.000	0.000	0.000	0.000	0.020	pg162_def.cx9a2g_bee
56.603	23.322	0.229	19.847	nonzero	0.000	0.000	0.000	0.000	0.000	0.022	pg162_def.cx9a2acef_bee
56.044	23.450	0.423	20.083	nonzero	0.000	0.000	0.000	0.000	0.000	0.020	pg162_def.cx9a2bcef_bee
qr100.L1
- qr100.L1: range queries with 100 insert/s per client
- Legend for results is here.
- Each entry lists the percentage of responses that fit in that bucket (slower than max time for previous bucket, faster than min time for next bucket).
Query response time histogram
256us	1ms	4ms	16ms	64ms	256ms	1s	4s	16s	gt	max	tag
99.948	0.052	nonzero	nonzero	0.000	0.000	0.000	0.000	0.000	0.000	0.004	pg162_def.cx9a2_bee
99.959	0.040	nonzero	0.000	0.000	0.000	0.000	0.000	0.000	0.000	0.003	pg162_def.cx9a2a_bee
99.961	0.039	nonzero	nonzero	0.000	0.000	0.000	0.000	0.000	0.000	0.005	pg162_def.cx9a2b_bee
99.922	0.077	nonzero	0.000	0.000	0.000	0.000	0.000	0.000	0.000	0.003	pg162_def.cx9a2c_bee
99.963	0.036	nonzero	0.000	0.000	0.000	0.000	0.000	0.000	0.000	0.003	pg162_def.cx9a2e_bee
99.917	0.083	nonzero	nonzero	0.000	0.000	0.000	0.000	0.000	0.000	0.004	pg162_def.cx9a2f_bee
99.957	0.043	nonzero	0.000	0.000	0.000	0.000	0.000	0.000	0.000	0.004	pg162_def.cx9a2g_bee
99.919	0.081	nonzero	0.000	0.000	0.000	0.000	0.000	0.000	0.000	0.003	pg162_def.cx9a2acef_bee
99.915	0.085	nonzero	nonzero	0.000	0.000	0.000	0.000	0.000	0.000	0.005	pg162_def.cx9a2bcef_bee
Insert response time histogram
256us	1ms	4ms	16ms	64ms	256ms	1s	4s	16s	gt	max	tag
0.000	0.000	99.833	0.167	0.000	0.000	0.000	0.000	0.000	0.000	0.006	pg162_def.cx9a2_bee
0.000	0.000	99.806	0.194	0.000	0.000	0.000	0.000	0.000	0.000	0.008	pg162_def.cx9a2a_bee
0.000	0.000	99.875	0.125	0.000	0.000	0.000	0.000	0.000	0.000	0.009	pg162_def.cx9a2b_bee
0.000	0.000	99.833	0.167	0.000	0.000	0.000	0.000	0.000	0.000	0.008	pg162_def.cx9a2c_bee
0.000	0.000	99.736	0.264	0.000	0.000	0.000	0.000	0.000	0.000	0.008	pg162_def.cx9a2e_bee
0.000	0.000	99.847	0.153	0.000	0.000	0.000	0.000	0.000	0.000	0.009	pg162_def.cx9a2f_bee
0.000	0.000	99.833	0.167	0.000	0.000	0.000	0.000	0.000	0.000	0.006	pg162_def.cx9a2g_bee
0.000	0.000	99.833	0.167	0.000	0.000	0.000	0.000	0.000	0.000	0.008	pg162_def.cx9a2acef_bee
0.000	0.000	99.889	0.111	0.000	0.000	0.000	0.000	0.000	0.000	0.007	pg162_def.cx9a2bcef_bee
Delete response time histogram
256us	1ms	4ms	16ms	64ms	256ms	1s	4s	16s	gt	max	tag
0.000	13.125	71.611	15.264	0.000	0.000	0.000	0.000	0.000	0.000	0.005	pg162_def.cx9a2_bee
0.125	32.069	66.847	0.958	0.000	0.000	0.000	0.000	0.000	0.000	0.005	pg162_def.cx9a2a_bee
0.097	29.528	68.542	1.833	0.000	0.000	0.000	0.000	0.000	0.000	0.005	pg162_def.cx9a2b_bee
0.028	22.750	71.319	5.903	0.000	0.000	0.000	0.000	0.000	0.000	0.007	pg162_def.cx9a2c_bee
0.153	26.528	69.681	3.639	0.000	0.000	0.000	0.000	0.000	0.000	0.006	pg162_def.cx9a2e_bee
0.597	40.861	58.472	0.069	0.000	0.000	0.000	0.000	0.000	0.000	0.006	pg162_def.cx9a2f_bee
0.208	26.000	69.708	4.083	0.000	0.000	0.000	0.000	0.000	0.000	0.005	pg162_def.cx9a2g_bee
0.486	35.292	64.097	0.125	0.000	0.000	0.000	0.000	0.000	0.000	0.006	pg162_def.cx9a2acef_bee
0.000	23.069	70.764	6.167	0.000	0.000	0.000	0.000	0.000	0.000	0.005	pg162_def.cx9a2bcef_bee
qp100.L2
- qp100.L2: point queries with 100 insert/s per client
- Legend for results is here.
- Each entry lists the percentage of responses that fit in that bucket (slower than max time for previous bucket, faster than min time for next bucket).
Query response time histogram
256us	1ms	4ms	16ms	64ms	256ms	1s	4s	16s	gt	max	tag
86.028	13.972	nonzero	0.000	0.000	0.000	0.000	0.000	0.000	0.000	0.003	pg162_def.cx9a2_bee
85.548	14.452	nonzero	0.000	0.000	0.000	0.000	0.000	0.000	0.000	0.003	pg162_def.cx9a2a_bee
85.918	14.082	nonzero	0.000	0.000	0.000	0.000	0.000	0.000	0.000	0.004	pg162_def.cx9a2b_bee
86.290	13.710	nonzero	0.000	0.000	0.000	0.000	0.000	0.000	0.000	0.003	pg162_def.cx9a2c_bee
85.631	14.369	nonzero	0.000	0.000	0.000	0.000	0.000	0.000	0.000	0.003	pg162_def.cx9a2e_bee
85.714	14.286	nonzero	0.000	0.000	0.000	0.000	0.000	0.000	0.000	0.003	pg162_def.cx9a2f_bee
85.834	14.165	nonzero	0.000	0.000	0.000	0.000	0.000	0.000	0.000	0.003	pg162_def.cx9a2g_bee
86.365	13.635	nonzero	nonzero	0.000	0.000	0.000	0.000	0.000	0.000	0.004	pg162_def.cx9a2acef_bee
85.897	14.103	nonzero	0.000	0.000	0.000	0.000	0.000	0.000	0.000	0.003	pg162_def.cx9a2bcef_bee
Insert response time histogram
256us	1ms	4ms	16ms	64ms	256ms	1s	4s	16s	gt	max	tag
0.000	0.000	99.903	0.097	0.000	0.000	0.000	0.000	0.000	0.000	0.006	pg162_def.cx9a2_bee
0.000	0.000	99.958	0.042	0.000	0.000	0.000	0.000	0.000	0.000	0.008	pg162_def.cx9a2a_bee
0.000	0.000	99.903	0.097	0.000	0.000	0.000	0.000	0.000	0.000	0.007	pg162_def.cx9a2b_bee
0.000	0.000	99.889	0.111	0.000	0.000	0.000	0.000	0.000	0.000	0.008	pg162_def.cx9a2c_bee
0.000	0.000	99.889	0.111	0.000	0.000	0.000	0.000	0.000	0.000	0.008	pg162_def.cx9a2e_bee
0.000	0.000	99.917	0.083	0.000	0.000	0.000	0.000	0.000	0.000	0.006	pg162_def.cx9a2f_bee
0.000	0.000	99.903	0.097	0.000	0.000	0.000	0.000	0.000	0.000	0.006	pg162_def.cx9a2g_bee
0.000	0.000	99.889	0.111	0.000	0.000	0.000	0.000	0.000	0.000	0.008	pg162_def.cx9a2acef_bee
0.000	0.000	99.917	0.083	0.000	0.000	0.000	0.000	0.000	0.000	0.008	pg162_def.cx9a2bcef_bee
Delete response time histogram
256us	1ms	4ms	16ms	64ms	256ms	1s	4s	16s	gt	max	tag
1.806	96.889	0.056	1.250	0.000	0.000	0.000	0.000	0.000	0.000	0.009	pg162_def.cx9a2_bee
1.403	98.583	0.014	0.000	0.000	0.000	0.000	0.000	0.000	0.000	0.002	pg162_def.cx9a2a_bee
1.389	98.569	0.042	0.000	0.000	0.000	0.000	0.000	0.000	0.000	0.003	pg162_def.cx9a2b_bee
1.583	98.361	0.056	0.000	0.000	0.000	0.000	0.000	0.000	0.000	0.003	pg162_def.cx9a2c_bee
1.264	98.694	0.042	0.000	0.000	0.000	0.000	0.000	0.000	0.000	0.003	pg162_def.cx9a2e_bee
1.028	98.958	0.014	0.000	0.000	0.000	0.000	0.000	0.000	0.000	0.002	pg162_def.cx9a2f_bee
1.542	98.431	0.028	0.000	0.000	0.000	0.000	0.000	0.000	0.000	0.003	pg162_def.cx9a2g_bee
0.875	99.042	0.083	0.000	0.000	0.000	0.000	0.000	0.000	0.000	0.003	pg162_def.cx9a2acef_bee
1.125	98.778	0.097	0.000	0.000	0.000	0.000	0.000	0.000	0.000	0.003	pg162_def.cx9a2bcef_bee
qr500.L3
- qr500.L3: range queries with 500 insert/s per client
- Legend for results is here.
- Each entry lists the percentage of responses that fit in that bucket (slower than max time for previous bucket, faster than min time for next bucket).
Query response time histogram
256us	1ms	4ms	16ms	64ms	256ms	1s	4s	16s	gt	max	tag
99.922	0.077	nonzero	nonzero	nonzero	0.000	0.000	0.000	0.000	0.000	0.019	pg162_def.cx9a2_bee
99.928	0.071	0.001	nonzero	0.000	0.000	0.000	0.000	0.000	0.000	0.012	pg162_def.cx9a2a_bee
99.924	0.076	nonzero	nonzero	nonzero	0.000	0.000	0.000	0.000	0.000	0.018	pg162_def.cx9a2b_bee
99.855	0.145	nonzero	nonzero	nonzero	0.000	0.000	0.000	0.000	0.000	0.018	pg162_def.cx9a2c_bee
99.941	0.059	nonzero	nonzero	nonzero	0.000	0.000	0.000	0.000	0.000	0.027	pg162_def.cx9a2e_bee
99.943	0.057	nonzero	nonzero	nonzero	0.000	0.000	0.000	0.000	0.000	0.023	pg162_def.cx9a2f_bee
99.922	0.077	nonzero	nonzero	0.000	0.000	0.000	0.000	0.000	0.000	0.013	pg162_def.cx9a2g_bee
99.907	0.093	nonzero	nonzero	nonzero	0.000	0.000	0.000	0.000	0.000	0.017	pg162_def.cx9a2acef_bee
99.898	0.102	nonzero	nonzero	nonzero	0.000	0.000	0.000	0.000	0.000	0.019	pg162_def.cx9a2bcef_bee
Insert response time histogram
256us	1ms	4ms	16ms	64ms	256ms	1s	4s	16s	gt	max	tag
0.000	0.000	99.969	0.031	0.000	0.000	0.000	0.000	0.000	0.000	0.008	pg162_def.cx9a2_bee
0.000	0.000	99.975	0.025	0.000	0.000	0.000	0.000	0.000	0.000	0.008	pg162_def.cx9a2a_bee
0.000	0.000	99.969	0.031	0.000	0.000	0.000	0.000	0.000	0.000	0.007	pg162_def.cx9a2b_bee
0.000	0.000	99.961	0.033	0.006	0.000	0.000	0.000	0.000	0.000	0.021	pg162_def.cx9a2c_bee
0.000	0.000	99.928	0.053	0.019	0.000	0.000	0.000	0.000	0.000	0.030	pg162_def.cx9a2e_bee
0.000	0.000	99.903	0.081	0.017	0.000	0.000	0.000	0.000	0.000	0.026	pg162_def.cx9a2f_bee
0.000	0.000	99.967	0.033	0.000	0.000	0.000	0.000	0.000	0.000	0.015	pg162_def.cx9a2g_bee
0.000	0.000	99.953	0.042	0.006	0.000	0.000	0.000	0.000	0.000	0.020	pg162_def.cx9a2acef_bee
0.000	0.000	99.947	0.042	0.011	0.000	0.000	0.000	0.000	0.000	0.023	pg162_def.cx9a2bcef_bee
Delete response time histogram
256us	1ms	4ms	16ms	64ms	256ms	1s	4s	16s	gt	max	tag
5.369	81.614	12.981	0.036	0.000	0.000	0.000	0.000	0.000	0.000	0.005	pg162_def.cx9a2_bee
6.506	80.289	13.197	0.008	0.000	0.000	0.000	0.000	0.000	0.000	0.005	pg162_def.cx9a2a_bee
6.239	82.158	11.597	0.006	0.000	0.000	0.000	0.000	0.000	0.000	0.004	pg162_def.cx9a2b_bee
7.217	78.853	13.881	0.047	0.003	0.000	0.000	0.000	0.000	0.000	0.018	pg162_def.cx9a2c_bee
6.072	76.942	0.108	16.858	0.019	0.000	0.000	0.000	0.000	0.000	0.028	pg162_def.cx9a2e_bee
6.631	76.875	0.069	16.414	0.011	0.000	0.000	0.000	0.000	0.000	0.024	pg162_def.cx9a2f_bee
5.858	80.889	13.169	0.083	0.000	0.000	0.000	0.000	0.000	0.000	0.014	pg162_def.cx9a2g_bee
7.153	76.219	0.172	16.453	0.003	0.000	0.000	0.000	0.000	0.000	0.017	pg162_def.cx9a2acef_bee
7.878	75.606	0.086	16.425	0.006	0.000	0.000	0.000	0.000	0.000	0.021	pg162_def.cx9a2bcef_bee
qp500.L4
- qp500.L4: point queries with 500 insert/s per client
- Legend for results is here.
- Each entry lists the percentage of responses that fit in that bucket (slower than max time for previous bucket, faster than min time for next bucket).
Query response time histogram
256us	1ms	4ms	16ms	64ms	256ms	1s	4s	16s	gt	max	tag
85.551	14.448	0.001	nonzero	0.000	0.000	0.000	0.000	0.000	0.000	0.004	pg162_def.cx9a2_bee
85.864	14.135	0.001	0.000	nonzero	0.000	0.000	0.000	0.000	0.000	0.022	pg162_def.cx9a2a_bee
85.622	14.377	0.001	0.000	0.000	0.000	0.000	0.000	0.000	0.000	0.003	pg162_def.cx9a2b_bee
85.762	14.238	0.001	0.000	0.000	0.000	0.000	0.000	0.000	0.000	0.003	pg162_def.cx9a2c_bee
85.882	14.117	0.001	0.000	0.000	0.000	0.000	0.000	0.000	0.000	0.003	pg162_def.cx9a2e_bee
85.625	14.374	0.001	0.000	0.000	0.000	0.000	0.000	0.000	0.000	0.003	pg162_def.cx9a2f_bee
85.673	14.326	0.001	0.000	0.000	0.000	0.000	0.000	0.000	0.000	0.003	pg162_def.cx9a2g_bee
86.056	13.943	0.001	0.000	0.000	0.000	0.000	0.000	0.000	0.000	0.003	pg162_def.cx9a2acef_bee
85.781	14.218	0.001	nonzero	0.000	0.000	0.000	0.000	0.000	0.000	0.005	pg162_def.cx9a2bcef_bee
Insert response time histogram
256us	1ms	4ms	16ms	64ms	256ms	1s	4s	16s	gt	max	tag
0.000	0.000	99.981	0.019	0.000	0.000	0.000	0.000	0.000	0.000	0.008	pg162_def.cx9a2_bee
0.000	0.000	99.986	0.014	0.000	0.000	0.000	0.000	0.000	0.000	0.008	pg162_def.cx9a2a_bee
0.000	0.000	99.978	0.022	0.000	0.000	0.000	0.000	0.000	0.000	0.006	pg162_def.cx9a2b_bee
0.000	0.000	99.986	0.014	0.000	0.000	0.000	0.000	0.000	0.000	0.008	pg162_def.cx9a2c_bee
0.000	0.000	99.953	0.022	0.025	0.000	0.000	0.000	0.000	0.000	0.023	pg162_def.cx9a2e_bee
0.000	0.000	99.964	0.022	0.014	0.000	0.000	0.000	0.000	0.000	0.030	pg162_def.cx9a2f_bee
0.000	0.000	99.994	0.006	0.000	0.000	0.000	0.000	0.000	0.000	0.008	pg162_def.cx9a2g_bee
0.000	0.000	99.944	0.042	0.014	0.000	0.000	0.000	0.000	0.000	0.030	pg162_def.cx9a2acef_bee
0.000	0.000	99.950	0.033	0.017	0.000	0.000	0.000	0.000	0.000	0.030	pg162_def.cx9a2bcef_bee
Delete response time histogram
256us	1ms	4ms	16ms	64ms	256ms	1s	4s	16s	gt	max	tag
17.933	66.061	13.983	2.022	0.000	0.000	0.000	0.000	0.000	0.000	0.007	pg162_def.cx9a2_bee
19.314	66.133	13.914	0.639	0.000	0.000	0.000	0.000	0.000	0.000	0.005	pg162_def.cx9a2a_bee
18.408	67.658	13.761	0.172	0.000	0.000	0.000	0.000	0.000	0.000	0.004	pg162_def.cx9a2b_bee
19.917	65.825	13.392	0.867	0.000	0.000	0.000	0.000	0.000	0.000	0.006	pg162_def.cx9a2c_bee
17.942	64.386	8.142	9.517	0.014	0.000	0.000	0.000	0.000	0.000	0.020	pg162_def.cx9a2e_bee
18.656	61.636	9.894	9.800	0.014	0.000	0.000	0.000	0.000	0.000	0.028	pg162_def.cx9a2f_bee
18.606	65.350	13.503	2.542	0.000	0.000	0.000	0.000	0.000	0.000	0.005	pg162_def.cx9a2g_bee
17.119	61.503	8.728	12.639	0.011	0.000	0.000	0.000	0.000	0.000	0.023	pg162_def.cx9a2acef_bee
16.792	59.861	8.939	14.397	0.011	0.000	0.000	0.000	0.000	0.000	0.021	pg162_def.cx9a2bcef_bee
qr1000.L5
- qr1000.L5: range queries with 1000 insert/s per client
- Legend for results is here.
- Each entry lists the percentage of responses that fit in that bucket (slower than max time for previous bucket, faster than min time for next bucket).
Query response time histogram
256us	1ms	4ms	16ms	64ms	256ms	1s	4s	16s	gt	max	tag
99.907	0.091	0.002	nonzero	nonzero	0.000	0.000	0.000	0.000	0.000	0.018	pg162_def.cx9a2_bee
99.917	0.082	0.002	nonzero	nonzero	0.000	0.000	0.000	0.000	0.000	0.019	pg162_def.cx9a2a_bee
99.893	0.105	0.002	nonzero	nonzero	0.000	0.000	0.000	0.000	0.000	0.018	pg162_def.cx9a2b_bee
99.835	0.163	0.002	nonzero	nonzero	0.000	0.000	0.000	0.000	0.000	0.023	pg162_def.cx9a2c_bee
99.943	0.056	nonzero	nonzero	0.000	0.000	0.000	0.000	0.000	0.000	0.005	pg162_def.cx9a2e_bee
99.941	0.057	0.002	nonzero	nonzero	0.000	0.000	0.000	0.000	0.000	0.019	pg162_def.cx9a2f_bee
99.901	0.098	0.002	nonzero	nonzero	0.000	0.000	0.000	0.000	0.000	0.023	pg162_def.cx9a2g_bee
99.901	0.099	nonzero	0.000	0.000	0.000	0.000	0.000	0.000	0.000	0.003	pg162_def.cx9a2acef_bee
99.894	0.105	nonzero	0.000	0.000	0.000	0.000	0.000	0.000	0.000	0.003	pg162_def.cx9a2bcef_bee
Insert response time histogram
256us	1ms	4ms	16ms	64ms	256ms	1s	4s	16s	gt	max	tag
0.000	0.000	99.978	0.013	0.010	0.000	0.000	0.000	0.000	0.000	0.027	pg162_def.cx9a2_bee
0.000	0.000	99.951	0.037	0.011	0.000	0.000	0.000	0.000	0.000	0.025	pg162_def.cx9a2a_bee
0.000	0.000	99.967	0.028	0.006	0.000	0.000	0.000	0.000	0.000	0.028	pg162_def.cx9a2b_bee
0.000	0.000	99.979	0.015	0.006	0.000	0.000	0.000	0.000	0.000	0.022	pg162_def.cx9a2c_bee
0.000	0.000	99.983	0.017	0.000	0.000	0.000	0.000	0.000	0.000	0.013	pg162_def.cx9a2e_bee
0.000	0.000	99.956	0.036	0.008	0.000	0.000	0.000	0.000	0.000	0.023	pg162_def.cx9a2f_bee
0.000	0.000	99.967	0.017	0.017	0.000	0.000	0.000	0.000	0.000	0.031	pg162_def.cx9a2g_bee
0.000	0.000	99.990	0.010	0.000	0.000	0.000	0.000	0.000	0.000	0.007	pg162_def.cx9a2acef_bee
0.000	0.000	99.987	0.013	0.000	0.000	0.000	0.000	0.000	0.000	0.008	pg162_def.cx9a2bcef_bee
Delete response time histogram
256us	1ms	4ms	16ms	64ms	256ms	1s	4s	16s	gt	max	tag
2.297	74.886	20.929	1.882	0.006	0.000	0.000	0.000	0.000	0.000	0.021	pg162_def.cx9a2_bee
2.457	74.129	20.939	2.467	0.008	0.000	0.000	0.000	0.000	0.000	0.021	pg162_def.cx9a2a_bee
2.947	72.971	21.850	2.228	0.004	0.000	0.000	0.000	0.000	0.000	0.020	pg162_def.cx9a2b_bee
2.849	75.679	20.825	0.642	0.006	0.000	0.000	0.000	0.000	0.000	0.020	pg162_def.cx9a2c_bee
2.503	76.006	8.271	13.221	0.000	0.000	0.000	0.000	0.000	0.000	0.012	pg162_def.cx9a2e_bee
2.396	76.472	3.839	17.288	0.006	0.000	0.000	0.000	0.000	0.000	0.020	pg162_def.cx9a2f_bee
2.461	74.792	21.050	1.683	0.014	0.000	0.000	0.000	0.000	0.000	0.024	pg162_def.cx9a2g_bee
2.986	74.054	7.315	15.644	0.000	0.000	0.000	0.000	0.000	0.000	0.011	pg162_def.cx9a2acef_bee
3.292	75.463	7.065	14.181	0.000	0.000	0.000	0.000	0.000	0.000	0.014	pg162_def.cx9a2bcef_bee
qp1000.L6
- qp1000.L6: point queries with 1000 insert/s per client
- Legend for results is here.
- Each entry lists the percentage of responses that fit in that bucket (slower than max time for previous bucket, faster than min time for next bucket).
Query response time histogram
256us	1ms	4ms	16ms	64ms	256ms	1s	4s	16s	gt	max	tag
85.294	14.704	0.002	nonzero	0.000	0.000	0.000	0.000	0.000	0.000	0.016	pg162_def.cx9a2_bee
86.095	13.903	0.002	nonzero	0.000	0.000	0.000	0.000	0.000	0.000	0.005	pg162_def.cx9a2a_bee
86.037	13.962	0.002	nonzero	0.000	0.000	0.000	0.000	0.000	0.000	0.005	pg162_def.cx9a2b_bee
85.873	14.126	0.002	0.000	0.000	0.000	0.000	0.000	0.000	0.000	0.004	pg162_def.cx9a2c_bee
85.904	14.094	0.002	nonzero	0.000	0.000	0.000	0.000	0.000	0.000	0.005	pg162_def.cx9a2e_bee
86.400	13.598	0.002	nonzero	0.000	0.000	0.000	0.000	0.000	0.000	0.006	pg162_def.cx9a2f_bee
85.583	14.416	0.002	0.000	0.000	0.000	0.000	0.000	0.000	0.000	0.003	pg162_def.cx9a2g_bee
85.992	14.006	0.002	0.000	0.000	0.000	0.000	0.000	0.000	0.000	0.004	pg162_def.cx9a2acef_bee
86.011	13.987	0.002	0.000	0.000	0.000	0.000	0.000	0.000	0.000	0.003	pg162_def.cx9a2bcef_bee
Insert response time histogram
256us	1ms	4ms	16ms	64ms	256ms	1s	4s	16s	gt	max	tag
0.000	0.000	99.992	0.008	0.000	0.000	0.000	0.000	0.000	0.000	0.016	pg162_def.cx9a2_bee
0.000	0.000	99.989	0.011	0.000	0.000	0.000	0.000	0.000	0.000	0.014	pg162_def.cx9a2a_bee
0.000	0.000	99.989	0.008	0.003	0.000	0.000	0.000	0.000	0.000	0.027	pg162_def.cx9a2b_bee
0.000	0.000	99.989	0.010	0.001	0.000	0.000	0.000	0.000	0.000	0.020	pg162_def.cx9a2c_bee
0.000	0.000	99.987	0.013	0.000	0.000	0.000	0.000	0.000	0.000	0.013	pg162_def.cx9a2e_bee
0.000	0.000	99.979	0.017	0.004	0.000	0.000	0.000	0.000	0.000	0.018	pg162_def.cx9a2f_bee
0.000	0.000	99.994	0.006	0.000	0.000	0.000	0.000	0.000	0.000	0.008	pg162_def.cx9a2g_bee
0.000	0.000	99.993	0.007	0.000	0.000	0.000	0.000	0.000	0.000	0.008	pg162_def.cx9a2acef_bee
0.000	0.000	99.989	0.011	0.000	0.000	0.000	0.000	0.000	0.000	0.008	pg162_def.cx9a2bcef_bee
Delete response time histogram
256us	1ms	4ms	16ms	64ms	256ms	1s	4s	16s	gt	max	tag
9.106	75.932	13.876	1.086	0.000	0.000	0.000	0.000	0.000	0.000	0.014	pg162_def.cx9a2_bee
9.219	74.985	13.846	1.950	0.000	0.000	0.000	0.000	0.000	0.000	0.012	pg162_def.cx9a2a_bee
9.231	74.522	14.108	2.138	0.001	0.000	0.000	0.000	0.000	0.000	0.025	pg162_def.cx9a2b_bee
9.479	75.586	13.557	1.376	0.001	0.000	0.000	0.000	0.000	0.000	0.017	pg162_def.cx9a2c_bee
8.758	65.354	10.507	15.381	0.000	0.000	0.000	0.000	0.000	0.000	0.012	pg162_def.cx9a2e_bee
8.581	66.126	5.735	19.558	0.000	0.000	0.000	0.000	0.000	0.000	0.016	pg162_def.cx9a2f_bee
8.676	74.965	13.893	2.465	0.000	0.000	0.000	0.000	0.000	0.000	0.007	pg162_def.cx9a2g_bee
8.396	68.875	8.561	14.168	0.000	0.000	0.000	0.000	0.000	0.000	0.011	pg162_def.cx9a2acef_bee
7.987	66.040	9.851	16.121	0.000	0.000	0.000	0.000	0.000	0.000	0.011	pg162_def.cx9a2bcef_bee