Introduction
This is a report for the insert benchmark with 30M docs and 1 client(s). It is generated by scripts (bash, awk, sed) and Tufte might not be impressed. An overview of the insert benchmark is here and a short update is here. Below, by DBMS, I mean DBMS+version.config. An example is my8020.c10b40 where my means MySQL, 8020 is version 8.0.20 and c10b40 is the name for the configuration file.
The test server has 8 AMD cores, 16G RAM and an NVMe SSD. It is described here as the Beelink. The benchmark was run with 1 client and there were 1 or 3 connections per client (1 for queries or inserts without rate limits, 1+1 for rate limited inserts+deletes). It uses 1 table. It loads 30M rows per table without secondary indexes, creates 3 secondary indexes per table, then inserts 80m+20m rows per table with a delete per insert to avoid growing the table. It then does 6 read+write tests for 3600s each that do queries as fast as possible with 100,100,500,500,1000,1000 inserts/s and the same for deletes/s per client concurrent with the queries. The database is cached in memory. Clients and the DBMS share one server. The per-database configs are in the per-database subdirectories here.
The tested DBMS are:
- my5651_rel.cz10a_bee - MySQL 5.6.51 with InnoDB, rel build, cz10a_bee config
- my5744_rel.cz10a_bee - MySQL 5.7.44 with InnoDB, rel build, cz10a_bee config
- my8036_rel.cz10a_bee - MySQL 8.0.36 with InnoDB, rel build, cz10a_bee config
Contents
- Summary
- l.i0: load without secondary indexes
- l.x: create secondary indexes
- l.i1: continue load after secondary indexes created with 50 inserts per transaction
- l.i2: continue load after secondary indexes created with 5 inserts per transaction
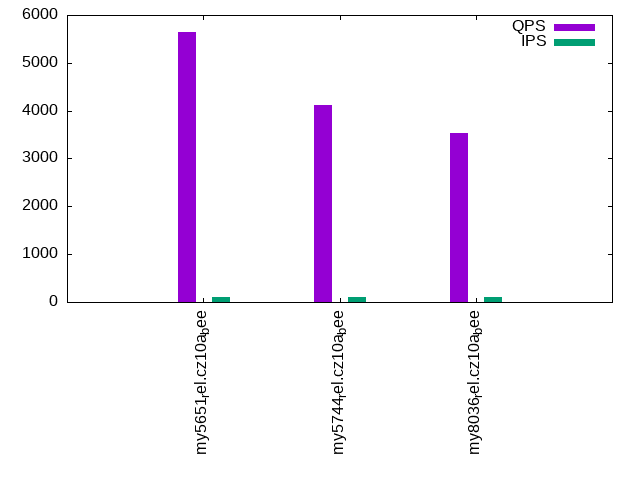
- qr100.L1: range queries with 100 insert/s per client
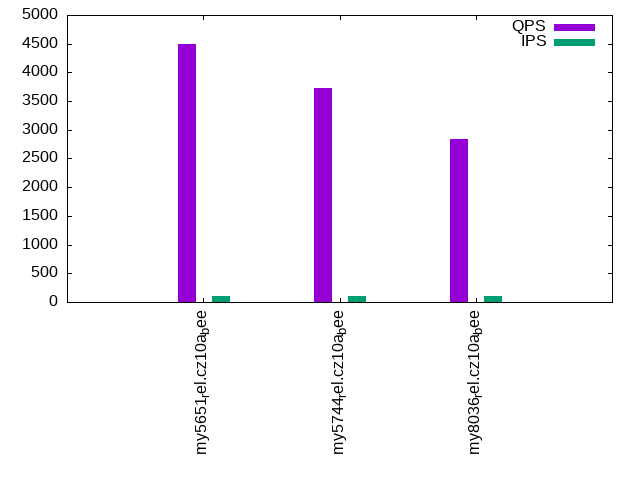
- qp100.L2: point queries with 100 insert/s per client
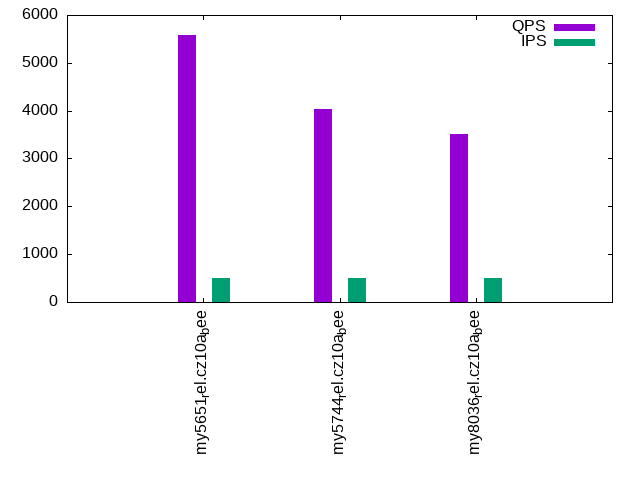
- qr500.L3: range queries with 500 insert/s per client
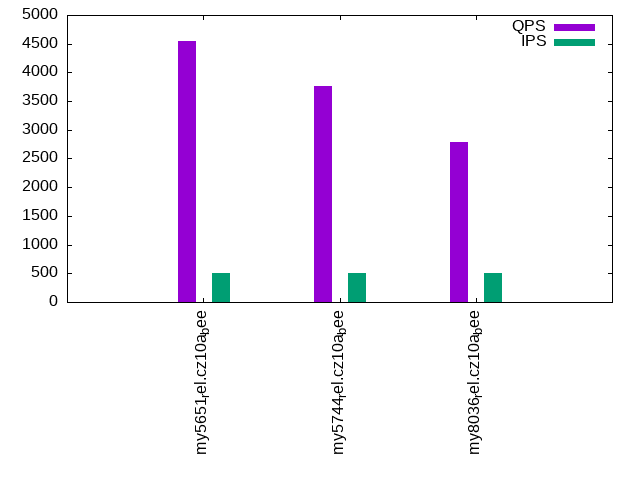
- qp500.L4: point queries with 500 insert/s per client
- qr1000.L5: range queries with 1000 insert/s per client
- qp1000.L6: point queries with 1000 insert/s per client
Summary
The numbers are inserts/s for l.i0, l.i1 and l.i2, indexed docs (or rows) /s for l.x and queries/s for qr100, qp100 thru qr1000, qp1000" The values are the average rate over the entire test for inserts (IPS) and queries (QPS). The range of values for IPS and QPS is split into 3 parts: bottom 25%, middle 50%, top 25%. Values in the bottom 25% have a red background, values in the top 25% have a green background and values in the middle have no color. A gray background is used for values that can be ignored because the DBMS did not sustain the target insert rate. Red backgrounds are not used when the minimum value is within 80% of the max value.
| dbms | l.i0 | l.x | l.i1 | l.i2 | qr100 | qp100 | qr500 | qp500 | qr1000 | qp1000 |
|---|---|---|---|---|---|---|---|---|---|---|
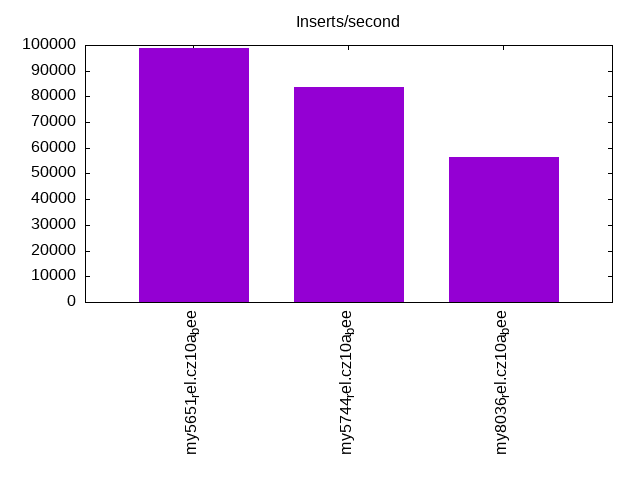
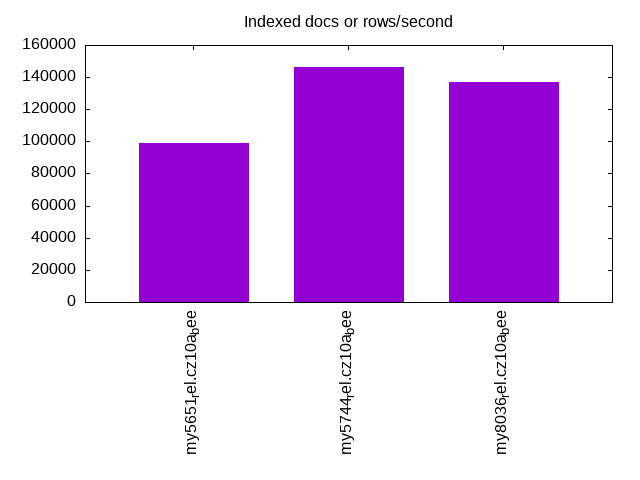
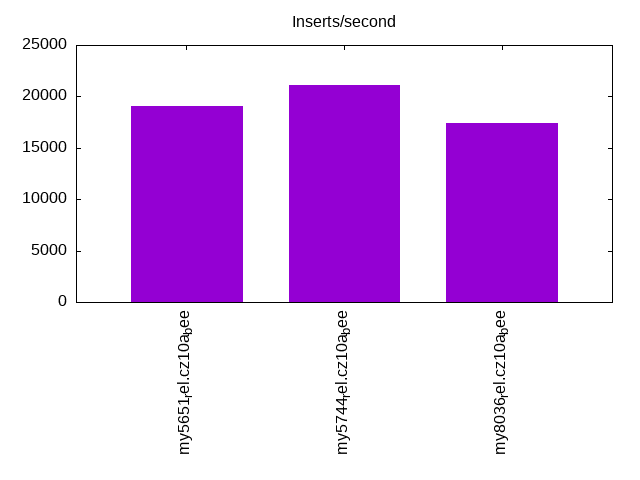
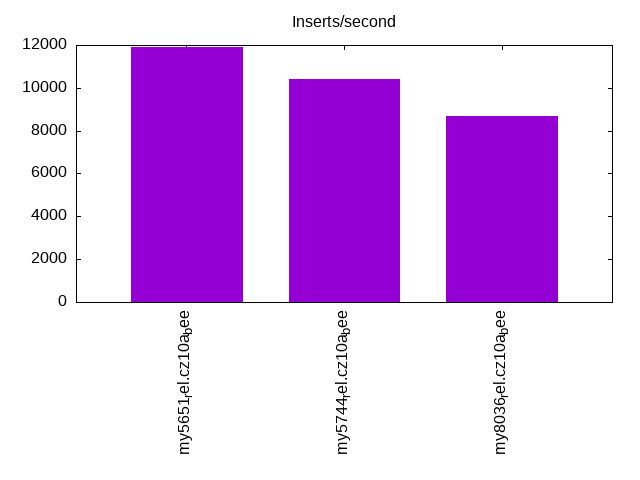
| my5651_rel.cz10a_bee | 99010 | 98684 | 19070 | 11891 | 5638 | 4502 | 5579 | 4553 | 5572 | 4536 |
| my5744_rel.cz10a_bee | 83565 | 146342 | 21147 | 10406 | 4127 | 3725 | 4042 | 3757 | 4124 | 3705 |
| my8036_rel.cz10a_bee | 56391 | 136987 | 17418 | 8669 | 3529 | 2843 | 3507 | 2794 | 3520 | 2827 |
This table has relative throughput, throughput for the DBMS relative to the DBMS in the first line, using the absolute throughput from the previous table. Values less than 0.95 have a yellow background. Values greater than 1.05 have a blue background.
| dbms | l.i0 | l.x | l.i1 | l.i2 | qr100 | qp100 | qr500 | qp500 | qr1000 | qp1000 |
|---|---|---|---|---|---|---|---|---|---|---|
| my5651_rel.cz10a_bee | 1.00 | 1.00 | 1.00 | 1.00 | 1.00 | 1.00 | 1.00 | 1.00 | 1.00 | 1.00 |
| my5744_rel.cz10a_bee | 0.84 | 1.48 | 1.11 | 0.88 | 0.73 | 0.83 | 0.72 | 0.83 | 0.74 | 0.82 |
| my8036_rel.cz10a_bee | 0.57 | 1.39 | 0.91 | 0.73 | 0.63 | 0.63 | 0.63 | 0.61 | 0.63 | 0.62 |
This lists the average rate of inserts/s for the tests that do inserts concurrent with queries. For such tests the query rate is listed in the table above. The read+write tests are setup so that the insert rate should match the target rate every second. Cells that are not at least 95% of the target have a red background to indicate a failure to satisfy the target.
| dbms | qr100.L1 | qp100.L2 | qr500.L3 | qp500.L4 | qr1000.L5 | qp1000.L6 |
|---|---|---|---|---|---|---|
| my5651_rel.cz10a_bee | 100 | 100 | 499 | 499 | 998 | 998 |
| my5744_rel.cz10a_bee | 100 | 100 | 499 | 499 | 998 | 998 |
| my8036_rel.cz10a_bee | 100 | 100 | 498 | 499 | 998 | 998 |
| target | 100 | 100 | 500 | 500 | 1000 | 1000 |
l.i0
l.i0: load without secondary indexes. Graphs for performance per 1-second interval are here.
Average throughput:
Insert response time histogram: each cell has the percentage of responses that take <= the time in the header and max is the max response time in seconds. For the max column values in the top 25% of the range have a red background and in the bottom 25% of the range have a green background. The red background is not used when the min value is within 80% of the max value.
| dbms | 256us | 1ms | 4ms | 16ms | 64ms | 256ms | 1s | 4s | 16s | gt | max |
|---|---|---|---|---|---|---|---|---|---|---|---|
| my5651_rel.cz10a_bee | 88.678 | 11.202 | 0.116 | 0.001 | 0.003 | 0.098 | |||||
| my5744_rel.cz10a_bee | 2.869 | 96.787 | 0.198 | 0.142 | 0.003 | 0.114 | |||||
| my8036_rel.cz10a_bee | 99.415 | 0.441 | 0.141 | 0.003 | 0.071 |
Performance metrics for the DBMS listed above. Some are normalized by throughput, others are not. Legend for results is here.
ips	qps	rps	rmbps	wps	wmbps	rpq	rkbpq	wpi	wkbpi	csps	cpups	cspq	cpupq	dbgb1	dbgb2	rss	maxop	p50	p99	tag
99010	0	867	3.4	304.7	30.0	0.009	0.035	0.003	0.310	12063	22.3	0.122	18	2.0	18.5	2.7	0.098	99976	86578	my5651_rel.cz10a_bee
83565	0	0	0.0	274.1	25.4	0.000	0.000	0.003	0.311	8776	21.5	0.105	21	2.0	18.5	2.9	0.114	84487	72931	my5744_rel.cz10a_bee
56391	0	0	0.0	244.2	18.8	0.000	0.000	0.004	0.342	6587	20.5	0.117	29	2.0	18.6	3.0	0.071	56720	51438	my8036_rel.cz10a_bee
l.x
l.x: create secondary indexes.
Average throughput:
Performance metrics for the DBMS listed above. Some are normalized by throughput, others are not. Legend for results is here.
ips	qps	rps	rmbps	wps	wmbps	rpq	rkbpq	wpi	wkbpi	csps	cpups	cspq	cpupq	dbgb1	dbgb2	rss	maxop	p50	p99	tag
98684	0	18	0.1	866.4	103.4	0.000	0.001	0.009	1.073	2521	10.7	0.026	9	4.2	20.7	4.9	0.002	NA	NA	my5651_rel.cz10a_bee
146342	0	0	0.0	1453.6	140.3	0.000	0.000	0.010	0.982	9253	12.3	0.063	7	4.6	21.1	4.4	0.003	NA	NA	my5744_rel.cz10a_bee
136987	0	704	44.6	2477.4	150.0	0.005	0.333	0.018	1.121	9758	43.2	0.071	25	4.5	21.1	5.3	0.003	NA	NA	my8036_rel.cz10a_bee
l.i1
l.i1: continue load after secondary indexes created with 50 inserts per transaction. Graphs for performance per 1-second interval are here.
Average throughput:
Insert response time histogram: each cell has the percentage of responses that take <= the time in the header and max is the max response time in seconds. For the max column values in the top 25% of the range have a red background and in the bottom 25% of the range have a green background. The red background is not used when the min value is within 80% of the max value.
| dbms | 256us | 1ms | 4ms | 16ms | 64ms | 256ms | 1s | 4s | 16s | gt | max |
|---|---|---|---|---|---|---|---|---|---|---|---|
| my5651_rel.cz10a_bee | 96.233 | 3.603 | 0.164 | 0.001 | 0.106 | ||||||
| my5744_rel.cz10a_bee | 97.530 | 2.422 | 0.044 | 0.003 | 0.097 | ||||||
| my8036_rel.cz10a_bee | 97.207 | 2.704 | 0.088 | 0.001 | 0.105 |
Delete response time histogram: each cell has the percentage of responses that take <= the time in the header and max is the max response time in seconds. For the max column values in the top 25% of the range have a red background and in the bottom 25% of the range have a green background. The red background is not used when the min value is within 80% of the max value.
| dbms | 256us | 1ms | 4ms | 16ms | 64ms | 256ms | 1s | 4s | 16s | gt | max |
|---|---|---|---|---|---|---|---|---|---|---|---|
| my5651_rel.cz10a_bee | 97.092 | 2.767 | 0.140 | nonzero | 0.082 | ||||||
| my5744_rel.cz10a_bee | 97.948 | 2.034 | 0.014 | 0.003 | 0.098 | ||||||
| my8036_rel.cz10a_bee | 98.166 | 1.799 | 0.035 | nonzero | 0.103 |
Performance metrics for the DBMS listed above. Some are normalized by throughput, others are not. Legend for results is here.
ips	qps	rps	rmbps	wps	wmbps	rpq	rkbpq	wpi	wkbpi	csps	cpups	cspq	cpupq	dbgb1	dbgb2	rss	maxop	p50	p99	tag
19070	0	644	2.5	1721.7	75.1	0.034	0.135	0.090	4.035	15667	34.4	0.822	144	6.2	22.7	6.9	0.106	19828	7842	my5651_rel.cz10a_bee
21147	0	0	0.0	1879.8	82.5	0.000	0.000	0.089	3.993	14621	37.8	0.691	143	6.5	23.0	7.6	0.097	21633	12037	my5744_rel.cz10a_bee
17418	0	32	0.5	2351.5	87.5	0.002	0.029	0.135	5.144	14764	36.5	0.848	168	6.5	23.3	7.8	0.105	17929	8640	my8036_rel.cz10a_bee
l.i2
l.i2: continue load after secondary indexes created with 5 inserts per transaction. Graphs for performance per 1-second interval are here.
Average throughput:
Insert response time histogram: each cell has the percentage of responses that take <= the time in the header and max is the max response time in seconds. For the max column values in the top 25% of the range have a red background and in the bottom 25% of the range have a green background. The red background is not used when the min value is within 80% of the max value.
| dbms | 256us | 1ms | 4ms | 16ms | 64ms | 256ms | 1s | 4s | 16s | gt | max |
|---|---|---|---|---|---|---|---|---|---|---|---|
| my5651_rel.cz10a_bee | 11.155 | 88.595 | 0.050 | 0.191 | 0.009 | nonzero | 0.081 | ||||
| my5744_rel.cz10a_bee | 0.053 | 99.655 | 0.059 | 0.231 | 0.002 | nonzero | 0.084 | ||||
| my8036_rel.cz10a_bee | 99.574 | 0.196 | 0.228 | 0.002 | nonzero | 0.102 |
Delete response time histogram: each cell has the percentage of responses that take <= the time in the header and max is the max response time in seconds. For the max column values in the top 25% of the range have a red background and in the bottom 25% of the range have a green background. The red background is not used when the min value is within 80% of the max value.
| dbms | 256us | 1ms | 4ms | 16ms | 64ms | 256ms | 1s | 4s | 16s | gt | max |
|---|---|---|---|---|---|---|---|---|---|---|---|
| my5651_rel.cz10a_bee | 12.855 | 86.908 | 0.036 | 0.191 | 0.009 | nonzero | 0.081 | ||||
| my5744_rel.cz10a_bee | 0.092 | 99.640 | 0.037 | 0.230 | 0.002 | nonzero | 0.084 | ||||
| my8036_rel.cz10a_bee | 99.710 | 0.064 | 0.224 | 0.002 | nonzero | 0.102 |
Performance metrics for the DBMS listed above. Some are normalized by throughput, others are not. Legend for results is here.
ips	qps	rps	rmbps	wps	wmbps	rpq	rkbpq	wpi	wkbpi	csps	cpups	cspq	cpupq	dbgb1	dbgb2	rss	maxop	p50	p99	tag
11891	0	2131	8.3	1205.4	50.1	0.179	0.717	0.101	4.313	56930	35.7	4.788	240	6.2	22.7	6.9	0.081	11902	10792	my5651_rel.cz10a_bee
10406	0	0	0.0	1102.2	45.3	0.000	0.000	0.106	4.461	44050	36.1	4.233	278	6.5	23.0	7.6	0.084	10387	9040	my5744_rel.cz10a_bee
8669	0	0	0.0	1335.5	46.5	0.000	0.000	0.154	5.497	37982	35.2	4.381	325	6.5	23.3	7.8	0.102	8685	7600	my8036_rel.cz10a_bee
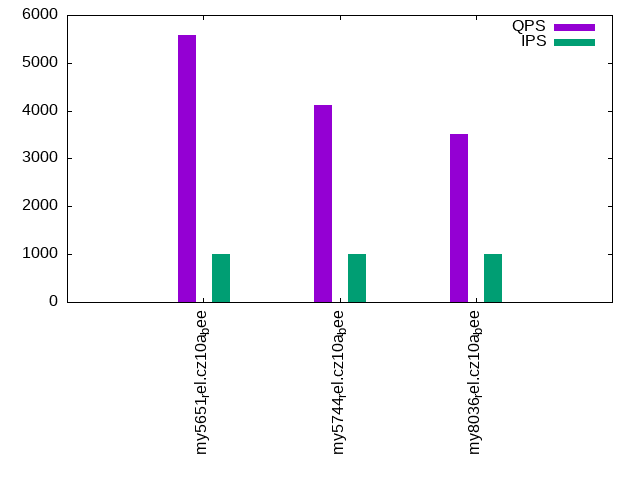
qr100.L1
qr100.L1: range queries with 100 insert/s per client. Graphs for performance per 1-second interval are here.
Average throughput:
Query response time histogram: each cell has the percentage of responses that take <= the time in the header and max is the max response time in seconds. For max values in the top 25% of the range have a red background and in the bottom 25% of the range have a green background. The red background is not used when the min value is within 80% of the max value.
| dbms | 256us | 1ms | 4ms | 16ms | 64ms | 256ms | 1s | 4s | 16s | gt | max |
|---|---|---|---|---|---|---|---|---|---|---|---|
| my5651_rel.cz10a_bee | 96.446 | 3.548 | 0.002 | 0.004 | nonzero | 0.019 | |||||
| my5744_rel.cz10a_bee | 71.477 | 28.523 | nonzero | 0.004 | |||||||
| my8036_rel.cz10a_bee | 51.557 | 48.442 | nonzero | nonzero | 0.004 |
Insert response time histogram: each cell has the percentage of responses that take <= the time in the header and max is the max response time in seconds. For max values in the top 25% of the range have a red background and in the bottom 25% of the range have a green background. The red background is not used when the min value is within 80% of the max value.
| dbms | 256us | 1ms | 4ms | 16ms | 64ms | 256ms | 1s | 4s | 16s | gt | max |
|---|---|---|---|---|---|---|---|---|---|---|---|
| my5651_rel.cz10a_bee | 45.778 | 49.583 | 4.639 | 0.046 | |||||||
| my5744_rel.cz10a_bee | 99.375 | 0.611 | 0.014 | 0.016 | |||||||
| my8036_rel.cz10a_bee | 99.750 | 0.222 | 0.028 | 0.025 |
Delete response time histogram: each cell has the percentage of responses that take <= the time in the header and max is the max response time in seconds. For max values in the top 25% of the range have a red background and in the bottom 25% of the range have a green background. The red background is not used when the min value is within 80% of the max value.
| dbms | 256us | 1ms | 4ms | 16ms | 64ms | 256ms | 1s | 4s | 16s | gt | max |
|---|---|---|---|---|---|---|---|---|---|---|---|
| my5651_rel.cz10a_bee | 45.097 | 53.056 | 1.847 | 0.040 | |||||||
| my5744_rel.cz10a_bee | 99.431 | 0.556 | 0.014 | 0.016 | |||||||
| my8036_rel.cz10a_bee | 99.819 | 0.167 | 0.014 | 0.025 |
Performance metrics for the DBMS listed above. Some are normalized by throughput, others are not. Legend for results is here.
ips	qps	rps	rmbps	wps	wmbps	rpq	rkbpq	wpi	wkbpi	csps	cpups	cspq	cpupq	dbgb1	dbgb2	rss	maxop	p50	p99	tag
100	5638	4	0.0	538.9	16.1	0.001	0.003	5.400	165.220	23452	13.1	4.160	186	6.2	22.7	6.9	0.019	5593	5400	my5651_rel.cz10a_bee
100	4127	0	0.0	66.3	1.8	0.000	0.000	0.665	18.263	16193	12.7	3.924	246	6.5	23.0	7.6	0.004	4074	3852	my5744_rel.cz10a_bee
100	3529	0	0.0	79.0	2.0	0.000	0.000	0.792	20.491	14119	12.7	4.001	288	6.5	23.3	7.8	0.004	3500	3310	my8036_rel.cz10a_bee
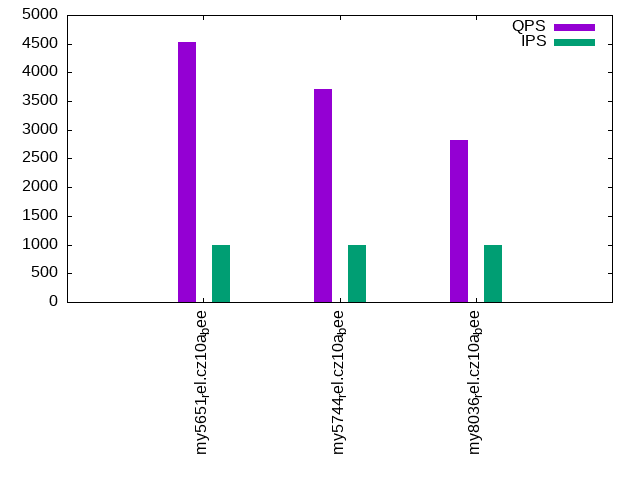
qp100.L2
qp100.L2: point queries with 100 insert/s per client. Graphs for performance per 1-second interval are here.
Average throughput:
Query response time histogram: each cell has the percentage of responses that take <= the time in the header and max is the max response time in seconds. For max values in the top 25% of the range have a red background and in the bottom 25% of the range have a green background. The red background is not used when the min value is within 80% of the max value.
| dbms | 256us | 1ms | 4ms | 16ms | 64ms | 256ms | 1s | 4s | 16s | gt | max |
|---|---|---|---|---|---|---|---|---|---|---|---|
| my5651_rel.cz10a_bee | 93.726 | 6.268 | 0.003 | 0.003 | nonzero | 0.026 | |||||
| my5744_rel.cz10a_bee | 83.395 | 16.603 | 0.001 | nonzero | 0.005 | ||||||
| my8036_rel.cz10a_bee | 12.182 | 87.816 | 0.002 | nonzero | 0.004 |
Insert response time histogram: each cell has the percentage of responses that take <= the time in the header and max is the max response time in seconds. For max values in the top 25% of the range have a red background and in the bottom 25% of the range have a green background. The red background is not used when the min value is within 80% of the max value.
| dbms | 256us | 1ms | 4ms | 16ms | 64ms | 256ms | 1s | 4s | 16s | gt | max |
|---|---|---|---|---|---|---|---|---|---|---|---|
| my5651_rel.cz10a_bee | 52.097 | 46.611 | 1.292 | 0.038 | |||||||
| my5744_rel.cz10a_bee | 99.361 | 0.639 | 0.014 | ||||||||
| my8036_rel.cz10a_bee | 99.694 | 0.292 | 0.014 | 0.023 |
Delete response time histogram: each cell has the percentage of responses that take <= the time in the header and max is the max response time in seconds. For max values in the top 25% of the range have a red background and in the bottom 25% of the range have a green background. The red background is not used when the min value is within 80% of the max value.
| dbms | 256us | 1ms | 4ms | 16ms | 64ms | 256ms | 1s | 4s | 16s | gt | max |
|---|---|---|---|---|---|---|---|---|---|---|---|
| my5651_rel.cz10a_bee | 51.208 | 48.208 | 0.583 | 0.039 | |||||||
| my5744_rel.cz10a_bee | 99.417 | 0.583 | 0.014 | ||||||||
| my8036_rel.cz10a_bee | 99.806 | 0.181 | 0.014 | 0.024 |
Performance metrics for the DBMS listed above. Some are normalized by throughput, others are not. Legend for results is here.
ips	qps	rps	rmbps	wps	wmbps	rpq	rkbpq	wpi	wkbpi	csps	cpups	cspq	cpupq	dbgb1	dbgb2	rss	maxop	p50	p99	tag
100	4502	4	0.0	177.6	5.3	0.001	0.004	1.780	54.808	18872	13.7	4.192	243	6.2	22.7	6.9	0.026	4491	4204	my5651_rel.cz10a_bee
100	3725	0	0.0	16.5	0.3	0.000	0.000	0.166	3.496	15258	13.6	4.097	292	6.5	23.0	7.6	0.005	3662	3420	my5744_rel.cz10a_bee
100	2843	0	0.0	26.0	0.6	0.000	0.000	0.260	6.384	11926	13.0	4.195	366	6.5	23.3	7.8	0.004	2748	2603	my8036_rel.cz10a_bee
qr500.L3
qr500.L3: range queries with 500 insert/s per client. Graphs for performance per 1-second interval are here.
Average throughput:
Query response time histogram: each cell has the percentage of responses that take <= the time in the header and max is the max response time in seconds. For max values in the top 25% of the range have a red background and in the bottom 25% of the range have a green background. The red background is not used when the min value is within 80% of the max value.
| dbms | 256us | 1ms | 4ms | 16ms | 64ms | 256ms | 1s | 4s | 16s | gt | max |
|---|---|---|---|---|---|---|---|---|---|---|---|
| my5651_rel.cz10a_bee | 96.238 | 3.757 | 0.002 | 0.003 | nonzero | 0.026 | |||||
| my5744_rel.cz10a_bee | 68.882 | 31.117 | nonzero | nonzero | 0.005 | ||||||
| my8036_rel.cz10a_bee | 50.717 | 49.282 | 0.001 | nonzero | 0.004 |
Insert response time histogram: each cell has the percentage of responses that take <= the time in the header and max is the max response time in seconds. For max values in the top 25% of the range have a red background and in the bottom 25% of the range have a green background. The red background is not used when the min value is within 80% of the max value.
| dbms | 256us | 1ms | 4ms | 16ms | 64ms | 256ms | 1s | 4s | 16s | gt | max |
|---|---|---|---|---|---|---|---|---|---|---|---|
| my5651_rel.cz10a_bee | 89.650 | 10.161 | 0.189 | 0.041 | |||||||
| my5744_rel.cz10a_bee | 99.453 | 0.544 | 0.003 | 0.064 | |||||||
| my8036_rel.cz10a_bee | 98.986 | 0.997 | 0.017 | 0.042 |
Delete response time histogram: each cell has the percentage of responses that take <= the time in the header and max is the max response time in seconds. For max values in the top 25% of the range have a red background and in the bottom 25% of the range have a green background. The red background is not used when the min value is within 80% of the max value.
| dbms | 256us | 1ms | 4ms | 16ms | 64ms | 256ms | 1s | 4s | 16s | gt | max |
|---|---|---|---|---|---|---|---|---|---|---|---|
| my5651_rel.cz10a_bee | 90.172 | 9.722 | 0.106 | 0.035 | |||||||
| my5744_rel.cz10a_bee | 99.569 | 0.428 | 0.003 | 0.064 | |||||||
| my8036_rel.cz10a_bee | 99.619 | 0.367 | 0.014 | 0.049 |
Performance metrics for the DBMS listed above. Some are normalized by throughput, others are not. Legend for results is here.
ips	qps	rps	rmbps	wps	wmbps	rpq	rkbpq	wpi	wkbpi	csps	cpups	cspq	cpupq	dbgb1	dbgb2	rss	maxop	p50	p99	tag
499	5579	17	0.1	143.9	4.8	0.003	0.012	0.288	9.859	22146	13.5	3.969	194	6.2	22.7	6.9	0.026	5529	5342	my5651_rel.cz10a_bee
499	4042	0	0.0	64.9	2.2	0.000	0.000	0.130	4.433	15957	13.5	3.948	267	6.5	23.0	7.6	0.005	4021	3822	my5744_rel.cz10a_bee
498	3507	0	0.0	95.6	2.9	0.000	0.000	0.192	6.003	14198	13.7	4.049	313	6.5	23.3	7.8	0.004	3484	3294	my8036_rel.cz10a_bee
qp500.L4
qp500.L4: point queries with 500 insert/s per client. Graphs for performance per 1-second interval are here.
Average throughput:
Query response time histogram: each cell has the percentage of responses that take <= the time in the header and max is the max response time in seconds. For max values in the top 25% of the range have a red background and in the bottom 25% of the range have a green background. The red background is not used when the min value is within 80% of the max value.
| dbms | 256us | 1ms | 4ms | 16ms | 64ms | 256ms | 1s | 4s | 16s | gt | max |
|---|---|---|---|---|---|---|---|---|---|---|---|
| my5651_rel.cz10a_bee | 93.433 | 6.560 | 0.006 | 0.002 | 0.011 | ||||||
| my5744_rel.cz10a_bee | 83.111 | 16.886 | 0.003 | nonzero | 0.005 | ||||||
| my8036_rel.cz10a_bee | 7.642 | 92.354 | 0.004 | nonzero | 0.008 |
Insert response time histogram: each cell has the percentage of responses that take <= the time in the header and max is the max response time in seconds. For max values in the top 25% of the range have a red background and in the bottom 25% of the range have a green background. The red background is not used when the min value is within 80% of the max value.
| dbms | 256us | 1ms | 4ms | 16ms | 64ms | 256ms | 1s | 4s | 16s | gt | max |
|---|---|---|---|---|---|---|---|---|---|---|---|
| my5651_rel.cz10a_bee | 89.639 | 10.228 | 0.133 | 0.043 | |||||||
| my5744_rel.cz10a_bee | 99.464 | 0.531 | 0.006 | 0.049 | |||||||
| my8036_rel.cz10a_bee | 98.831 | 1.158 | 0.011 | 0.043 |
Delete response time histogram: each cell has the percentage of responses that take <= the time in the header and max is the max response time in seconds. For max values in the top 25% of the range have a red background and in the bottom 25% of the range have a green background. The red background is not used when the min value is within 80% of the max value.
| dbms | 256us | 1ms | 4ms | 16ms | 64ms | 256ms | 1s | 4s | 16s | gt | max |
|---|---|---|---|---|---|---|---|---|---|---|---|
| my5651_rel.cz10a_bee | 90.222 | 9.722 | 0.056 | 0.038 | |||||||
| my5744_rel.cz10a_bee | 99.567 | 0.428 | 0.006 | 0.047 | |||||||
| my8036_rel.cz10a_bee | 99.650 | 0.344 | 0.006 | 0.049 |
Performance metrics for the DBMS listed above. Some are normalized by throughput, others are not. Legend for results is here.
ips	qps	rps	rmbps	wps	wmbps	rpq	rkbpq	wpi	wkbpi	csps	cpups	cspq	cpupq	dbgb1	dbgb2	rss	maxop	p50	p99	tag
499	4553	16	0.1	167.4	5.5	0.004	0.015	0.336	11.305	19199	13.7	4.217	241	6.2	22.7	6.9	0.011	4508	4228	my5651_rel.cz10a_bee
499	3757	0	0.0	64.5	2.2	0.000	0.000	0.129	4.461	15772	14.4	4.198	307	6.5	23.0	7.6	0.005	3692	3436	my5744_rel.cz10a_bee
499	2794	0	0.0	93.3	2.9	0.000	0.000	0.187	5.872	12028	14.0	4.306	401	6.5	23.3	7.8	0.008	2732	2573	my8036_rel.cz10a_bee
qr1000.L5
qr1000.L5: range queries with 1000 insert/s per client. Graphs for performance per 1-second interval are here.
Average throughput:
Query response time histogram: each cell has the percentage of responses that take <= the time in the header and max is the max response time in seconds. For max values in the top 25% of the range have a red background and in the bottom 25% of the range have a green background. The red background is not used when the min value is within 80% of the max value.
| dbms | 256us | 1ms | 4ms | 16ms | 64ms | 256ms | 1s | 4s | 16s | gt | max |
|---|---|---|---|---|---|---|---|---|---|---|---|
| my5651_rel.cz10a_bee | 96.059 | 3.935 | 0.003 | 0.003 | nonzero | 0.016 | |||||
| my5744_rel.cz10a_bee | 71.376 | 28.623 | 0.001 | nonzero | 0.006 | ||||||
| my8036_rel.cz10a_bee | 51.135 | 48.863 | 0.002 | nonzero | 0.005 |
Insert response time histogram: each cell has the percentage of responses that take <= the time in the header and max is the max response time in seconds. For max values in the top 25% of the range have a red background and in the bottom 25% of the range have a green background. The red background is not used when the min value is within 80% of the max value.
| dbms | 256us | 1ms | 4ms | 16ms | 64ms | 256ms | 1s | 4s | 16s | gt | max |
|---|---|---|---|---|---|---|---|---|---|---|---|
| my5651_rel.cz10a_bee | 93.017 | 6.913 | 0.071 | 0.041 | |||||||
| my5744_rel.cz10a_bee | 99.462 | 0.531 | 0.006 | 0.001 | 0.067 | ||||||
| my8036_rel.cz10a_bee | 96.790 | 3.193 | 0.017 | 0.049 |
Delete response time histogram: each cell has the percentage of responses that take <= the time in the header and max is the max response time in seconds. For max values in the top 25% of the range have a red background and in the bottom 25% of the range have a green background. The red background is not used when the min value is within 80% of the max value.
| dbms | 256us | 1ms | 4ms | 16ms | 64ms | 256ms | 1s | 4s | 16s | gt | max |
|---|---|---|---|---|---|---|---|---|---|---|---|
| my5651_rel.cz10a_bee | 93.963 | 5.999 | 0.039 | 0.039 | |||||||
| my5744_rel.cz10a_bee | 99.606 | 0.390 | 0.003 | 0.001 | 0.066 | ||||||
| my8036_rel.cz10a_bee | 99.572 | 0.415 | 0.013 | 0.051 |
Performance metrics for the DBMS listed above. Some are normalized by throughput, others are not. Legend for results is here.
ips	qps	rps	rmbps	wps	wmbps	rpq	rkbpq	wpi	wkbpi	csps	cpups	cspq	cpupq	dbgb1	dbgb2	rss	maxop	p50	p99	tag
998	5572	33	0.1	392.1	12.8	0.006	0.023	0.393	13.108	23131	14.8	4.151	212	6.2	22.7	6.9	0.016	5530	5324	my5651_rel.cz10a_bee
998	4124	0	0.0	136.0	4.8	0.000	0.000	0.136	4.939	16645	14.7	4.036	285	6.5	23.0	7.5	0.006	4074	3852	my5744_rel.cz10a_bee
998	3520	0	0.0	201.2	6.2	0.000	0.000	0.202	6.388	14726	14.8	4.183	336	6.5	23.3	7.8	0.005	3484	3277	my8036_rel.cz10a_bee
qp1000.L6
qp1000.L6: point queries with 1000 insert/s per client. Graphs for performance per 1-second interval are here.
Average throughput:
Query response time histogram: each cell has the percentage of responses that take <= the time in the header and max is the max response time in seconds. For max values in the top 25% of the range have a red background and in the bottom 25% of the range have a green background. The red background is not used when the min value is within 80% of the max value.
| dbms | 256us | 1ms | 4ms | 16ms | 64ms | 256ms | 1s | 4s | 16s | gt | max |
|---|---|---|---|---|---|---|---|---|---|---|---|
| my5651_rel.cz10a_bee | 92.728 | 7.262 | 0.008 | 0.002 | 0.010 | ||||||
| my5744_rel.cz10a_bee | 81.158 | 18.834 | 0.007 | nonzero | 0.007 | ||||||
| my8036_rel.cz10a_bee | 11.794 | 88.197 | 0.009 | nonzero | 0.007 |
Insert response time histogram: each cell has the percentage of responses that take <= the time in the header and max is the max response time in seconds. For max values in the top 25% of the range have a red background and in the bottom 25% of the range have a green background. The red background is not used when the min value is within 80% of the max value.
| dbms | 256us | 1ms | 4ms | 16ms | 64ms | 256ms | 1s | 4s | 16s | gt | max |
|---|---|---|---|---|---|---|---|---|---|---|---|
| my5651_rel.cz10a_bee | 93.326 | 6.596 | 0.078 | 0.039 | |||||||
| my5744_rel.cz10a_bee | 99.413 | 0.583 | 0.003 | 0.001 | 0.064 | ||||||
| my8036_rel.cz10a_bee | 96.331 | 3.653 | 0.017 | 0.050 |
Delete response time histogram: each cell has the percentage of responses that take <= the time in the header and max is the max response time in seconds. For max values in the top 25% of the range have a red background and in the bottom 25% of the range have a green background. The red background is not used when the min value is within 80% of the max value.
| dbms | 256us | 1ms | 4ms | 16ms | 64ms | 256ms | 1s | 4s | 16s | gt | max |
|---|---|---|---|---|---|---|---|---|---|---|---|
| my5651_rel.cz10a_bee | 94.332 | 5.624 | 0.044 | 0.041 | |||||||
| my5744_rel.cz10a_bee | 99.589 | 0.408 | 0.003 | 0.062 | |||||||
| my8036_rel.cz10a_bee | 99.553 | 0.435 | 0.013 | 0.051 |
Performance metrics for the DBMS listed above. Some are normalized by throughput, others are not. Legend for results is here.
ips	qps	rps	rmbps	wps	wmbps	rpq	rkbpq	wpi	wkbpi	csps	cpups	cspq	cpupq	dbgb1	dbgb2	rss	maxop	p50	p99	tag
998	4536	33	0.1	284.5	9.5	0.007	0.029	0.285	9.779	19750	14.8	4.353	261	6.2	22.7	6.9	0.010	4477	4204	my5651_rel.cz10a_bee
998	3705	0	0.0	123.7	4.4	0.000	0.000	0.124	4.551	15780	15.2	4.259	328	6.5	23.0	7.5	0.007	3644	3420	my5744_rel.cz10a_bee
998	2827	0	0.0	198.7	6.1	0.000	0.000	0.199	6.308	12671	15.2	4.482	430	6.5	23.3	7.8	0.007	2749	2573	my8036_rel.cz10a_bee
l.i0
l.i0: load without secondary indexes
Performance metrics for all DBMS, not just the ones listed above. Some are normalized by throughput, others are not. Legend for results is here.
ips	qps	rps	rmbps	wps	wmbps	rpq	rkbpq	wpi	wkbpi	csps	cpups	cspq	cpupq	dbgb1	dbgb2	rss	maxop	p50	p99	tag
99010	0	867	3.4	304.7	30.0	0.009	0.035	0.003	0.310	12063	22.3	0.122	18	2.0	18.5	2.7	0.098	99976	86578	my5651_rel.cz10a_bee
83565	0	0	0.0	274.1	25.4	0.000	0.000	0.003	0.311	8776	21.5	0.105	21	2.0	18.5	2.9	0.114	84487	72931	my5744_rel.cz10a_bee
56391	0	0	0.0	244.2	18.8	0.000	0.000	0.004	0.342	6587	20.5	0.117	29	2.0	18.6	3.0	0.071	56720	51438	my8036_rel.cz10a_bee
l.x
l.x: create secondary indexes
Performance metrics for all DBMS, not just the ones listed above. Some are normalized by throughput, others are not. Legend for results is here.
ips	qps	rps	rmbps	wps	wmbps	rpq	rkbpq	wpi	wkbpi	csps	cpups	cspq	cpupq	dbgb1	dbgb2	rss	maxop	p50	p99	tag
98684	0	18	0.1	866.4	103.4	0.000	0.001	0.009	1.073	2521	10.7	0.026	9	4.2	20.7	4.9	0.002	NA	NA	my5651_rel.cz10a_bee
146342	0	0	0.0	1453.6	140.3	0.000	0.000	0.010	0.982	9253	12.3	0.063	7	4.6	21.1	4.4	0.003	NA	NA	my5744_rel.cz10a_bee
136987	0	704	44.6	2477.4	150.0	0.005	0.333	0.018	1.121	9758	43.2	0.071	25	4.5	21.1	5.3	0.003	NA	NA	my8036_rel.cz10a_bee
l.i1
l.i1: continue load after secondary indexes created with 50 inserts per transaction
Performance metrics for all DBMS, not just the ones listed above. Some are normalized by throughput, others are not. Legend for results is here.
ips	qps	rps	rmbps	wps	wmbps	rpq	rkbpq	wpi	wkbpi	csps	cpups	cspq	cpupq	dbgb1	dbgb2	rss	maxop	p50	p99	tag
19070	0	644	2.5	1721.7	75.1	0.034	0.135	0.090	4.035	15667	34.4	0.822	144	6.2	22.7	6.9	0.106	19828	7842	my5651_rel.cz10a_bee
21147	0	0	0.0	1879.8	82.5	0.000	0.000	0.089	3.993	14621	37.8	0.691	143	6.5	23.0	7.6	0.097	21633	12037	my5744_rel.cz10a_bee
17418	0	32	0.5	2351.5	87.5	0.002	0.029	0.135	5.144	14764	36.5	0.848	168	6.5	23.3	7.8	0.105	17929	8640	my8036_rel.cz10a_bee
l.i2
l.i2: continue load after secondary indexes created with 5 inserts per transaction
Performance metrics for all DBMS, not just the ones listed above. Some are normalized by throughput, others are not. Legend for results is here.
ips	qps	rps	rmbps	wps	wmbps	rpq	rkbpq	wpi	wkbpi	csps	cpups	cspq	cpupq	dbgb1	dbgb2	rss	maxop	p50	p99	tag
11891	0	2131	8.3	1205.4	50.1	0.179	0.717	0.101	4.313	56930	35.7	4.788	240	6.2	22.7	6.9	0.081	11902	10792	my5651_rel.cz10a_bee
10406	0	0	0.0	1102.2	45.3	0.000	0.000	0.106	4.461	44050	36.1	4.233	278	6.5	23.0	7.6	0.084	10387	9040	my5744_rel.cz10a_bee
8669	0	0	0.0	1335.5	46.5	0.000	0.000	0.154	5.497	37982	35.2	4.381	325	6.5	23.3	7.8	0.102	8685	7600	my8036_rel.cz10a_bee
qr100.L1
qr100.L1: range queries with 100 insert/s per client
Performance metrics for all DBMS, not just the ones listed above. Some are normalized by throughput, others are not. Legend for results is here.
ips	qps	rps	rmbps	wps	wmbps	rpq	rkbpq	wpi	wkbpi	csps	cpups	cspq	cpupq	dbgb1	dbgb2	rss	maxop	p50	p99	tag
100	5638	4	0.0	538.9	16.1	0.001	0.003	5.400	165.220	23452	13.1	4.160	186	6.2	22.7	6.9	0.019	5593	5400	my5651_rel.cz10a_bee
100	4127	0	0.0	66.3	1.8	0.000	0.000	0.665	18.263	16193	12.7	3.924	246	6.5	23.0	7.6	0.004	4074	3852	my5744_rel.cz10a_bee
100	3529	0	0.0	79.0	2.0	0.000	0.000	0.792	20.491	14119	12.7	4.001	288	6.5	23.3	7.8	0.004	3500	3310	my8036_rel.cz10a_bee
qp100.L2
qp100.L2: point queries with 100 insert/s per client
Performance metrics for all DBMS, not just the ones listed above. Some are normalized by throughput, others are not. Legend for results is here.
ips	qps	rps	rmbps	wps	wmbps	rpq	rkbpq	wpi	wkbpi	csps	cpups	cspq	cpupq	dbgb1	dbgb2	rss	maxop	p50	p99	tag
100	4502	4	0.0	177.6	5.3	0.001	0.004	1.780	54.808	18872	13.7	4.192	243	6.2	22.7	6.9	0.026	4491	4204	my5651_rel.cz10a_bee
100	3725	0	0.0	16.5	0.3	0.000	0.000	0.166	3.496	15258	13.6	4.097	292	6.5	23.0	7.6	0.005	3662	3420	my5744_rel.cz10a_bee
100	2843	0	0.0	26.0	0.6	0.000	0.000	0.260	6.384	11926	13.0	4.195	366	6.5	23.3	7.8	0.004	2748	2603	my8036_rel.cz10a_bee
qr500.L3
qr500.L3: range queries with 500 insert/s per client
Performance metrics for all DBMS, not just the ones listed above. Some are normalized by throughput, others are not. Legend for results is here.
ips	qps	rps	rmbps	wps	wmbps	rpq	rkbpq	wpi	wkbpi	csps	cpups	cspq	cpupq	dbgb1	dbgb2	rss	maxop	p50	p99	tag
499	5579	17	0.1	143.9	4.8	0.003	0.012	0.288	9.859	22146	13.5	3.969	194	6.2	22.7	6.9	0.026	5529	5342	my5651_rel.cz10a_bee
499	4042	0	0.0	64.9	2.2	0.000	0.000	0.130	4.433	15957	13.5	3.948	267	6.5	23.0	7.6	0.005	4021	3822	my5744_rel.cz10a_bee
498	3507	0	0.0	95.6	2.9	0.000	0.000	0.192	6.003	14198	13.7	4.049	313	6.5	23.3	7.8	0.004	3484	3294	my8036_rel.cz10a_bee
qp500.L4
qp500.L4: point queries with 500 insert/s per client
Performance metrics for all DBMS, not just the ones listed above. Some are normalized by throughput, others are not. Legend for results is here.
ips	qps	rps	rmbps	wps	wmbps	rpq	rkbpq	wpi	wkbpi	csps	cpups	cspq	cpupq	dbgb1	dbgb2	rss	maxop	p50	p99	tag
499	4553	16	0.1	167.4	5.5	0.004	0.015	0.336	11.305	19199	13.7	4.217	241	6.2	22.7	6.9	0.011	4508	4228	my5651_rel.cz10a_bee
499	3757	0	0.0	64.5	2.2	0.000	0.000	0.129	4.461	15772	14.4	4.198	307	6.5	23.0	7.6	0.005	3692	3436	my5744_rel.cz10a_bee
499	2794	0	0.0	93.3	2.9	0.000	0.000	0.187	5.872	12028	14.0	4.306	401	6.5	23.3	7.8	0.008	2732	2573	my8036_rel.cz10a_bee
qr1000.L5
qr1000.L5: range queries with 1000 insert/s per client
Performance metrics for all DBMS, not just the ones listed above. Some are normalized by throughput, others are not. Legend for results is here.
ips	qps	rps	rmbps	wps	wmbps	rpq	rkbpq	wpi	wkbpi	csps	cpups	cspq	cpupq	dbgb1	dbgb2	rss	maxop	p50	p99	tag
998	5572	33	0.1	392.1	12.8	0.006	0.023	0.393	13.108	23131	14.8	4.151	212	6.2	22.7	6.9	0.016	5530	5324	my5651_rel.cz10a_bee
998	4124	0	0.0	136.0	4.8	0.000	0.000	0.136	4.939	16645	14.7	4.036	285	6.5	23.0	7.5	0.006	4074	3852	my5744_rel.cz10a_bee
998	3520	0	0.0	201.2	6.2	0.000	0.000	0.202	6.388	14726	14.8	4.183	336	6.5	23.3	7.8	0.005	3484	3277	my8036_rel.cz10a_bee
qp1000.L6
qp1000.L6: point queries with 1000 insert/s per client
Performance metrics for all DBMS, not just the ones listed above. Some are normalized by throughput, others are not. Legend for results is here.
ips	qps	rps	rmbps	wps	wmbps	rpq	rkbpq	wpi	wkbpi	csps	cpups	cspq	cpupq	dbgb1	dbgb2	rss	maxop	p50	p99	tag
998	4536	33	0.1	284.5	9.5	0.007	0.029	0.285	9.779	19750	14.8	4.353	261	6.2	22.7	6.9	0.010	4477	4204	my5651_rel.cz10a_bee
998	3705	0	0.0	123.7	4.4	0.000	0.000	0.124	4.551	15780	15.2	4.259	328	6.5	23.0	7.5	0.007	3644	3420	my5744_rel.cz10a_bee
998	2827	0	0.0	198.7	6.1	0.000	0.000	0.199	6.308	12671	15.2	4.482	430	6.5	23.3	7.8	0.007	2749	2573	my8036_rel.cz10a_bee
l.i0
- l.i0: load without secondary indexes
- Legend for results is here.
- Each entry lists the percentage of responses that fit in that bucket (slower than max time for previous bucket, faster than min time for next bucket).
Insert response time histogram
256us	1ms	4ms	16ms	64ms	256ms	1s	4s	16s	gt	max	tag
0.000	88.678	11.202	0.116	0.001	0.003	0.000	0.000	0.000	0.000	0.098	my5651_rel.cz10a_bee
0.000	2.869	96.787	0.198	0.142	0.003	0.000	0.000	0.000	0.000	0.114	my5744_rel.cz10a_bee
0.000	0.000	99.415	0.441	0.141	0.003	0.000	0.000	0.000	0.000	0.071	my8036_rel.cz10a_bee
l.x
- l.x: create secondary indexes
- Legend for results is here.
- Each entry lists the percentage of responses that fit in that bucket (slower than max time for previous bucket, faster than min time for next bucket).
TODO - determine whether there is data for create index response time
l.i1
- l.i1: continue load after secondary indexes created with 50 inserts per transaction
- Legend for results is here.
- Each entry lists the percentage of responses that fit in that bucket (slower than max time for previous bucket, faster than min time for next bucket).
Insert response time histogram
256us	1ms	4ms	16ms	64ms	256ms	1s	4s	16s	gt	max	tag
0.000	0.000	96.233	3.603	0.164	0.001	0.000	0.000	0.000	0.000	0.106	my5651_rel.cz10a_bee
0.000	0.000	97.530	2.422	0.044	0.003	0.000	0.000	0.000	0.000	0.097	my5744_rel.cz10a_bee
0.000	0.000	97.207	2.704	0.088	0.001	0.000	0.000	0.000	0.000	0.105	my8036_rel.cz10a_bee
Delete response time histogram
256us	1ms	4ms	16ms	64ms	256ms	1s	4s	16s	gt	max	tag
0.000	0.000	97.092	2.767	0.140	nonzero	0.000	0.000	0.000	0.000	0.082	my5651_rel.cz10a_bee
0.000	0.000	97.948	2.034	0.014	0.003	0.000	0.000	0.000	0.000	0.098	my5744_rel.cz10a_bee
0.000	0.000	98.166	1.799	0.035	nonzero	0.000	0.000	0.000	0.000	0.103	my8036_rel.cz10a_bee
l.i2
- l.i2: continue load after secondary indexes created with 5 inserts per transaction
- Legend for results is here.
- Each entry lists the percentage of responses that fit in that bucket (slower than max time for previous bucket, faster than min time for next bucket).
Insert response time histogram
256us	1ms	4ms	16ms	64ms	256ms	1s	4s	16s	gt	max	tag
11.155	88.595	0.050	0.191	0.009	nonzero	0.000	0.000	0.000	0.000	0.081	my5651_rel.cz10a_bee
0.053	99.655	0.059	0.231	0.002	nonzero	0.000	0.000	0.000	0.000	0.084	my5744_rel.cz10a_bee
0.000	99.574	0.196	0.228	0.002	nonzero	0.000	0.000	0.000	0.000	0.102	my8036_rel.cz10a_bee
Delete response time histogram
256us	1ms	4ms	16ms	64ms	256ms	1s	4s	16s	gt	max	tag
12.855	86.908	0.036	0.191	0.009	nonzero	0.000	0.000	0.000	0.000	0.081	my5651_rel.cz10a_bee
0.092	99.640	0.037	0.230	0.002	nonzero	0.000	0.000	0.000	0.000	0.084	my5744_rel.cz10a_bee
0.000	99.710	0.064	0.224	0.002	nonzero	0.000	0.000	0.000	0.000	0.102	my8036_rel.cz10a_bee
qr100.L1
- qr100.L1: range queries with 100 insert/s per client
- Legend for results is here.
- Each entry lists the percentage of responses that fit in that bucket (slower than max time for previous bucket, faster than min time for next bucket).
Query response time histogram
256us	1ms	4ms	16ms	64ms	256ms	1s	4s	16s	gt	max	tag
96.446	3.548	0.002	0.004	nonzero	0.000	0.000	0.000	0.000	0.000	0.019	my5651_rel.cz10a_bee
71.477	28.523	nonzero	0.000	0.000	0.000	0.000	0.000	0.000	0.000	0.004	my5744_rel.cz10a_bee
51.557	48.442	nonzero	nonzero	0.000	0.000	0.000	0.000	0.000	0.000	0.004	my8036_rel.cz10a_bee
Insert response time histogram
256us	1ms	4ms	16ms	64ms	256ms	1s	4s	16s	gt	max	tag
0.000	0.000	45.778	49.583	4.639	0.000	0.000	0.000	0.000	0.000	0.046	my5651_rel.cz10a_bee
0.000	0.000	99.375	0.611	0.014	0.000	0.000	0.000	0.000	0.000	0.016	my5744_rel.cz10a_bee
0.000	0.000	99.750	0.222	0.028	0.000	0.000	0.000	0.000	0.000	0.025	my8036_rel.cz10a_bee
Delete response time histogram
256us	1ms	4ms	16ms	64ms	256ms	1s	4s	16s	gt	max	tag
0.000	0.000	45.097	53.056	1.847	0.000	0.000	0.000	0.000	0.000	0.040	my5651_rel.cz10a_bee
0.000	0.000	99.431	0.556	0.014	0.000	0.000	0.000	0.000	0.000	0.016	my5744_rel.cz10a_bee
0.000	0.000	99.819	0.167	0.014	0.000	0.000	0.000	0.000	0.000	0.025	my8036_rel.cz10a_bee
qp100.L2
- qp100.L2: point queries with 100 insert/s per client
- Legend for results is here.
- Each entry lists the percentage of responses that fit in that bucket (slower than max time for previous bucket, faster than min time for next bucket).
Query response time histogram
256us	1ms	4ms	16ms	64ms	256ms	1s	4s	16s	gt	max	tag
93.726	6.268	0.003	0.003	nonzero	0.000	0.000	0.000	0.000	0.000	0.026	my5651_rel.cz10a_bee
83.395	16.603	0.001	nonzero	0.000	0.000	0.000	0.000	0.000	0.000	0.005	my5744_rel.cz10a_bee
12.182	87.816	0.002	nonzero	0.000	0.000	0.000	0.000	0.000	0.000	0.004	my8036_rel.cz10a_bee
Insert response time histogram
256us	1ms	4ms	16ms	64ms	256ms	1s	4s	16s	gt	max	tag
0.000	0.000	52.097	46.611	1.292	0.000	0.000	0.000	0.000	0.000	0.038	my5651_rel.cz10a_bee
0.000	0.000	99.361	0.639	0.000	0.000	0.000	0.000	0.000	0.000	0.014	my5744_rel.cz10a_bee
0.000	0.000	99.694	0.292	0.014	0.000	0.000	0.000	0.000	0.000	0.023	my8036_rel.cz10a_bee
Delete response time histogram
256us	1ms	4ms	16ms	64ms	256ms	1s	4s	16s	gt	max	tag
0.000	0.000	51.208	48.208	0.583	0.000	0.000	0.000	0.000	0.000	0.039	my5651_rel.cz10a_bee
0.000	0.000	99.417	0.583	0.000	0.000	0.000	0.000	0.000	0.000	0.014	my5744_rel.cz10a_bee
0.000	0.000	99.806	0.181	0.014	0.000	0.000	0.000	0.000	0.000	0.024	my8036_rel.cz10a_bee
qr500.L3
- qr500.L3: range queries with 500 insert/s per client
- Legend for results is here.
- Each entry lists the percentage of responses that fit in that bucket (slower than max time for previous bucket, faster than min time for next bucket).
Query response time histogram
256us	1ms	4ms	16ms	64ms	256ms	1s	4s	16s	gt	max	tag
96.238	3.757	0.002	0.003	nonzero	0.000	0.000	0.000	0.000	0.000	0.026	my5651_rel.cz10a_bee
68.882	31.117	nonzero	nonzero	0.000	0.000	0.000	0.000	0.000	0.000	0.005	my5744_rel.cz10a_bee
50.717	49.282	0.001	nonzero	0.000	0.000	0.000	0.000	0.000	0.000	0.004	my8036_rel.cz10a_bee
Insert response time histogram
256us	1ms	4ms	16ms	64ms	256ms	1s	4s	16s	gt	max	tag
0.000	0.000	89.650	10.161	0.189	0.000	0.000	0.000	0.000	0.000	0.041	my5651_rel.cz10a_bee
0.000	0.000	99.453	0.544	0.003	0.000	0.000	0.000	0.000	0.000	0.064	my5744_rel.cz10a_bee
0.000	0.000	98.986	0.997	0.017	0.000	0.000	0.000	0.000	0.000	0.042	my8036_rel.cz10a_bee
Delete response time histogram
256us	1ms	4ms	16ms	64ms	256ms	1s	4s	16s	gt	max	tag
0.000	0.000	90.172	9.722	0.106	0.000	0.000	0.000	0.000	0.000	0.035	my5651_rel.cz10a_bee
0.000	0.000	99.569	0.428	0.003	0.000	0.000	0.000	0.000	0.000	0.064	my5744_rel.cz10a_bee
0.000	0.000	99.619	0.367	0.014	0.000	0.000	0.000	0.000	0.000	0.049	my8036_rel.cz10a_bee
qp500.L4
- qp500.L4: point queries with 500 insert/s per client
- Legend for results is here.
- Each entry lists the percentage of responses that fit in that bucket (slower than max time for previous bucket, faster than min time for next bucket).
Query response time histogram
256us	1ms	4ms	16ms	64ms	256ms	1s	4s	16s	gt	max	tag
93.433	6.560	0.006	0.002	0.000	0.000	0.000	0.000	0.000	0.000	0.011	my5651_rel.cz10a_bee
83.111	16.886	0.003	nonzero	0.000	0.000	0.000	0.000	0.000	0.000	0.005	my5744_rel.cz10a_bee
7.642	92.354	0.004	nonzero	0.000	0.000	0.000	0.000	0.000	0.000	0.008	my8036_rel.cz10a_bee
Insert response time histogram
256us	1ms	4ms	16ms	64ms	256ms	1s	4s	16s	gt	max	tag
0.000	0.000	89.639	10.228	0.133	0.000	0.000	0.000	0.000	0.000	0.043	my5651_rel.cz10a_bee
0.000	0.000	99.464	0.531	0.006	0.000	0.000	0.000	0.000	0.000	0.049	my5744_rel.cz10a_bee
0.000	0.000	98.831	1.158	0.011	0.000	0.000	0.000	0.000	0.000	0.043	my8036_rel.cz10a_bee
Delete response time histogram
256us	1ms	4ms	16ms	64ms	256ms	1s	4s	16s	gt	max	tag
0.000	0.000	90.222	9.722	0.056	0.000	0.000	0.000	0.000	0.000	0.038	my5651_rel.cz10a_bee
0.000	0.000	99.567	0.428	0.006	0.000	0.000	0.000	0.000	0.000	0.047	my5744_rel.cz10a_bee
0.000	0.000	99.650	0.344	0.006	0.000	0.000	0.000	0.000	0.000	0.049	my8036_rel.cz10a_bee
qr1000.L5
- qr1000.L5: range queries with 1000 insert/s per client
- Legend for results is here.
- Each entry lists the percentage of responses that fit in that bucket (slower than max time for previous bucket, faster than min time for next bucket).
Query response time histogram
256us	1ms	4ms	16ms	64ms	256ms	1s	4s	16s	gt	max	tag
96.059	3.935	0.003	0.003	nonzero	0.000	0.000	0.000	0.000	0.000	0.016	my5651_rel.cz10a_bee
71.376	28.623	0.001	nonzero	0.000	0.000	0.000	0.000	0.000	0.000	0.006	my5744_rel.cz10a_bee
51.135	48.863	0.002	nonzero	0.000	0.000	0.000	0.000	0.000	0.000	0.005	my8036_rel.cz10a_bee
Insert response time histogram
256us	1ms	4ms	16ms	64ms	256ms	1s	4s	16s	gt	max	tag
0.000	0.000	93.017	6.913	0.071	0.000	0.000	0.000	0.000	0.000	0.041	my5651_rel.cz10a_bee
0.000	0.000	99.462	0.531	0.006	0.001	0.000	0.000	0.000	0.000	0.067	my5744_rel.cz10a_bee
0.000	0.000	96.790	3.193	0.017	0.000	0.000	0.000	0.000	0.000	0.049	my8036_rel.cz10a_bee
Delete response time histogram
256us	1ms	4ms	16ms	64ms	256ms	1s	4s	16s	gt	max	tag
0.000	0.000	93.963	5.999	0.039	0.000	0.000	0.000	0.000	0.000	0.039	my5651_rel.cz10a_bee
0.000	0.000	99.606	0.390	0.003	0.001	0.000	0.000	0.000	0.000	0.066	my5744_rel.cz10a_bee
0.000	0.000	99.572	0.415	0.013	0.000	0.000	0.000	0.000	0.000	0.051	my8036_rel.cz10a_bee
qp1000.L6
- qp1000.L6: point queries with 1000 insert/s per client
- Legend for results is here.
- Each entry lists the percentage of responses that fit in that bucket (slower than max time for previous bucket, faster than min time for next bucket).
Query response time histogram
256us	1ms	4ms	16ms	64ms	256ms	1s	4s	16s	gt	max	tag
92.728	7.262	0.008	0.002	0.000	0.000	0.000	0.000	0.000	0.000	0.010	my5651_rel.cz10a_bee
81.158	18.834	0.007	nonzero	0.000	0.000	0.000	0.000	0.000	0.000	0.007	my5744_rel.cz10a_bee
11.794	88.197	0.009	nonzero	0.000	0.000	0.000	0.000	0.000	0.000	0.007	my8036_rel.cz10a_bee
Insert response time histogram
256us	1ms	4ms	16ms	64ms	256ms	1s	4s	16s	gt	max	tag
0.000	0.000	93.326	6.596	0.078	0.000	0.000	0.000	0.000	0.000	0.039	my5651_rel.cz10a_bee
0.000	0.000	99.413	0.583	0.003	0.001	0.000	0.000	0.000	0.000	0.064	my5744_rel.cz10a_bee
0.000	0.000	96.331	3.653	0.017	0.000	0.000	0.000	0.000	0.000	0.050	my8036_rel.cz10a_bee
Delete response time histogram
256us	1ms	4ms	16ms	64ms	256ms	1s	4s	16s	gt	max	tag
0.000	0.000	94.332	5.624	0.044	0.000	0.000	0.000	0.000	0.000	0.041	my5651_rel.cz10a_bee
0.000	0.000	99.589	0.408	0.003	0.000	0.000	0.000	0.000	0.000	0.062	my5744_rel.cz10a_bee
0.000	0.000	99.553	0.435	0.013	0.000	0.000	0.000	0.000	0.000	0.051	my8036_rel.cz10a_bee