Introduction
This is a report for the insert benchmark with 30M docs and 1 client(s). It is generated by scripts (bash, awk, sed) and Tufte might not be impressed. An overview of the insert benchmark is here and a short update is here. Below, by DBMS, I mean DBMS+version.config. An example is my8020.c10b40 where my means MySQL, 8020 is version 8.0.20 and c10b40 is the name for the configuration file.
The test server has 8 AMD cores, 16G RAM and an NVMe SSD. It is described here as the Beelink. The benchmark was run with 1 client and there were 1 or 3 connections per client (1 for queries or inserts without rate limits, 1+1 for rate limited inserts+deletes). It uses 1 table. It loads 30M rows per table without secondary indexes, creates 3 secondary indexes per table, then inserts 80m+20m rows per table with a delete per insert to avoid growing the table. It then does 6 read+write tests for 3600s each that do queries as fast as possible with 100,100,500,500,1000,1000 inserts/s and the same for deletes/s per client concurrent with the queries. The database is cached in memory. Clients and the DBMS share one server. The per-database configs are in the per-database subdirectories here.
The tested DBMS are:
- fbmy5635_rel_202203072101.cza1_bee - MyRocks 5.6.35 from code as of 2022-03-07 at git hash e7d976ee with RocksDB 6.28.2, cza1_bee config
- fbmy5635_rel_20230529_850.cza1_bee - MyRocks 5.6.35 from code as of 2023-05-29 at git hash b739eac1 with RocksDB 8.5.0, cza1_bee config
- fbmy8028_rel_20220829_752.cza1_bee - MyRocks 8.0.28 from code as of 2022-08-29 at git hash a35c8dfeab, RocksDB 7.5.2, cza1_bee config
- fbmy8028_rel_20230619_831.cza1_bee - MyRocks 8.0.28 from code as of 2023-06-19 at git hash 6164cf0274, RocksDB 8.3.1, cza1_bee config
- fbmy8028_rel_221222.cza1_bee - MyRocks 8.0.28 from code as of 2023-12-22 at git hash 2ad105fc, RocksDB 8.7.0 at git hash 29005f0b, cza1_bee config
- fbmy8028_rel_231222_870.cza1_bee_cfx - MyRocks 8.0.28 from code as of 2023-12-22 at git hash 2ad105fc, RocksDB 8.7.0 at git hash 29005f0b, cza1_bee config, indexes use a separate column family
Contents
- Summary
- l.i0: load without secondary indexes
- l.x: create secondary indexes
- l.i1: continue load after secondary indexes created with 50 inserts per transaction
- l.i2: continue load after secondary indexes created with 5 inserts per transaction
- qr100.L1: range queries with 100 insert/s per client
- qp100.L2: point queries with 100 insert/s per client
- qr500.L3: range queries with 500 insert/s per client
- qp500.L4: point queries with 500 insert/s per client
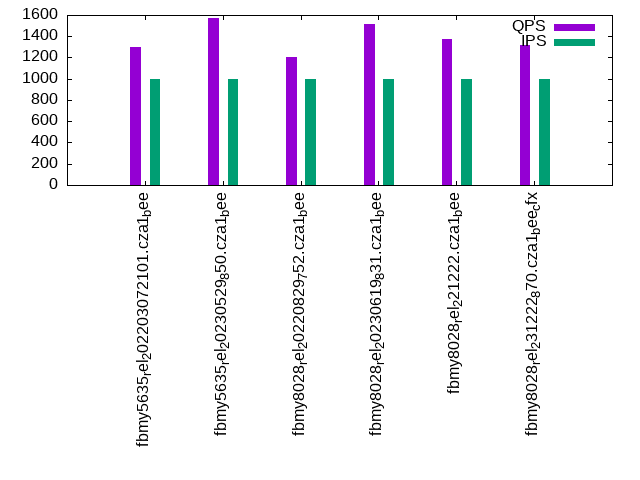
- qr1000.L5: range queries with 1000 insert/s per client
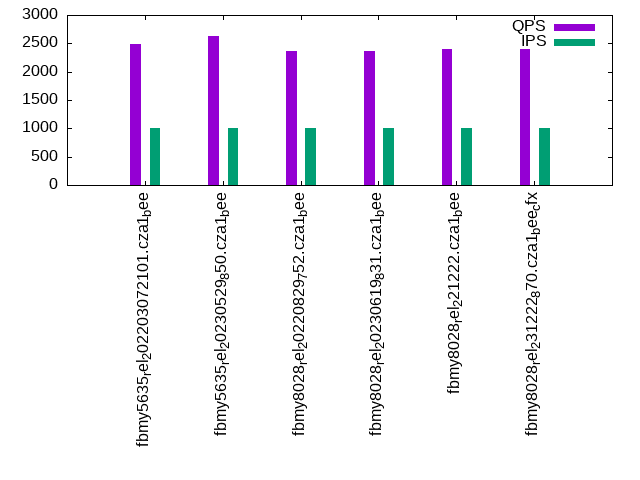
- qp1000.L6: point queries with 1000 insert/s per client
Summary
The numbers are inserts/s for l.i0, l.i1 and l.i2, indexed docs (or rows) /s for l.x and queries/s for qr100, qp100 thru qr1000, qp1000" The values are the average rate over the entire test for inserts (IPS) and queries (QPS). The range of values for IPS and QPS is split into 3 parts: bottom 25%, middle 50%, top 25%. Values in the bottom 25% have a red background, values in the top 25% have a green background and values in the middle have no color. A gray background is used for values that can be ignored because the DBMS did not sustain the target insert rate. Red backgrounds are not used when the minimum value is within 80% of the max value.
| dbms | l.i0 | l.x | l.i1 | l.i2 | qr100 | qp100 | qr500 | qp500 | qr1000 | qp1000 |
|---|---|---|---|---|---|---|---|---|---|---|
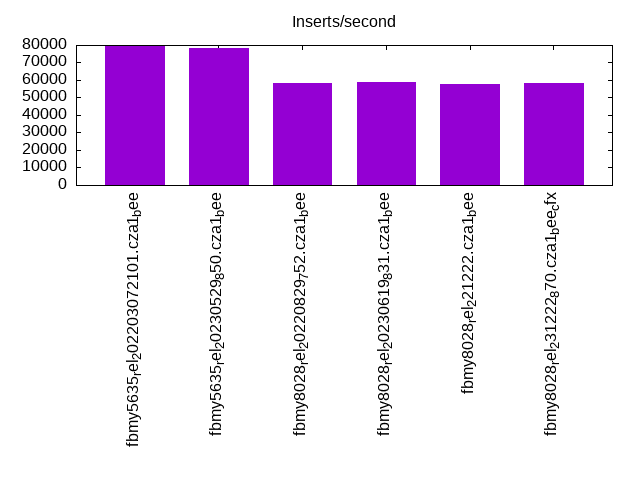
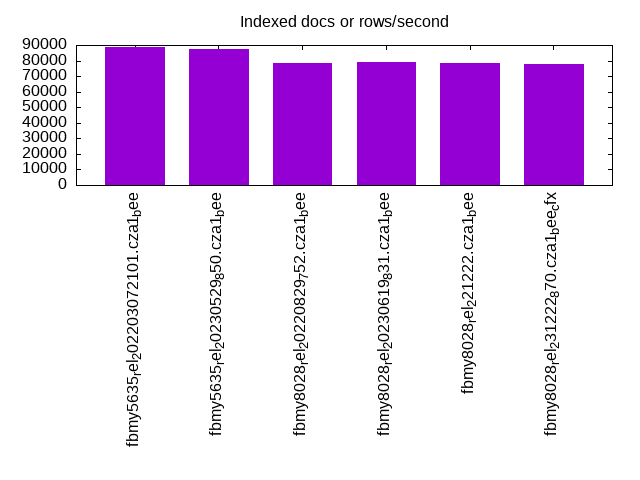
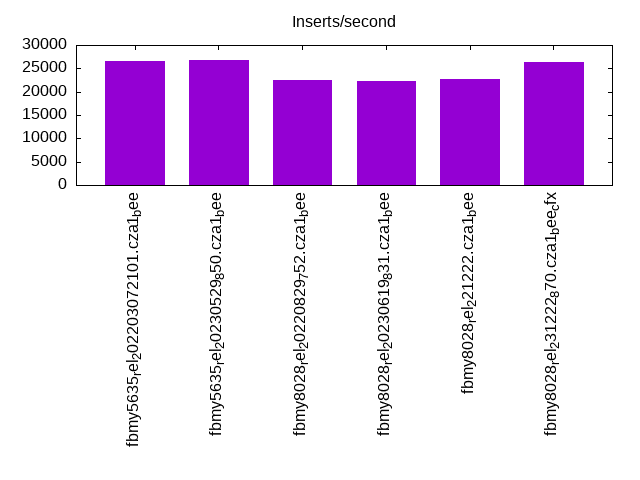
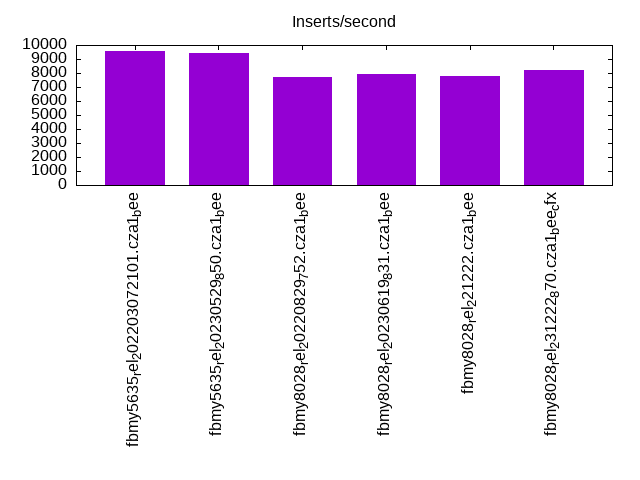
| fbmy5635_rel_202203072101.cza1_bee | 79787 | 89021 | 26604 | 9569 | 1621 | 2558 | 1095 | 2557 | 1296 | 2494 |
| fbmy5635_rel_20230529_850.cza1_bee | 78125 | 87720 | 26765 | 9403 | 1430 | 2592 | 1448 | 2588 | 1572 | 2635 |
| fbmy8028_rel_20220829_752.cza1_bee | 58366 | 78534 | 22466 | 7701 | 1185 | 2454 | 1083 | 2425 | 1204 | 2368 |
| fbmy8028_rel_20230619_831.cza1_bee | 58594 | 78948 | 22253 | 7930 | 1523 | 2467 | 1379 | 2385 | 1514 | 2358 |
| fbmy8028_rel_221222.cza1_bee | 57692 | 78125 | 22676 | 7800 | 1717 | 2444 | 1360 | 2423 | 1373 | 2392 |
| fbmy8028_rel_231222_870.cza1_bee_cfx | 58480 | 77720 | 26429 | 8180 | 1114 | 2448 | 1452 | 2414 | 1322 | 2408 |
This table has relative throughput, throughput for the DBMS relative to the DBMS in the first line, using the absolute throughput from the previous table. Values less than 0.95 have a yellow background. Values greater than 1.05 have a blue background.
| dbms | l.i0 | l.x | l.i1 | l.i2 | qr100 | qp100 | qr500 | qp500 | qr1000 | qp1000 |
|---|---|---|---|---|---|---|---|---|---|---|
| fbmy5635_rel_202203072101.cza1_bee | 1.00 | 1.00 | 1.00 | 1.00 | 1.00 | 1.00 | 1.00 | 1.00 | 1.00 | 1.00 |
| fbmy5635_rel_20230529_850.cza1_bee | 0.98 | 0.99 | 1.01 | 0.98 | 0.88 | 1.01 | 1.32 | 1.01 | 1.21 | 1.06 |
| fbmy8028_rel_20220829_752.cza1_bee | 0.73 | 0.88 | 0.84 | 0.80 | 0.73 | 0.96 | 0.99 | 0.95 | 0.93 | 0.95 |
| fbmy8028_rel_20230619_831.cza1_bee | 0.73 | 0.89 | 0.84 | 0.83 | 0.94 | 0.96 | 1.26 | 0.93 | 1.17 | 0.95 |
| fbmy8028_rel_221222.cza1_bee | 0.72 | 0.88 | 0.85 | 0.82 | 1.06 | 0.96 | 1.24 | 0.95 | 1.06 | 0.96 |
| fbmy8028_rel_231222_870.cza1_bee_cfx | 0.73 | 0.87 | 0.99 | 0.85 | 0.69 | 0.96 | 1.33 | 0.94 | 1.02 | 0.97 |
This lists the average rate of inserts/s for the tests that do inserts concurrent with queries. For such tests the query rate is listed in the table above. The read+write tests are setup so that the insert rate should match the target rate every second. Cells that are not at least 95% of the target have a red background to indicate a failure to satisfy the target.
| dbms | qr100.L1 | qp100.L2 | qr500.L3 | qp500.L4 | qr1000.L5 | qp1000.L6 |
|---|---|---|---|---|---|---|
| fbmy5635_rel_202203072101.cza1_bee | 100 | 100 | 499 | 499 | 998 | 998 |
| fbmy5635_rel_20230529_850.cza1_bee | 100 | 100 | 499 | 499 | 998 | 998 |
| fbmy8028_rel_20220829_752.cza1_bee | 100 | 100 | 499 | 499 | 998 | 998 |
| fbmy8028_rel_20230619_831.cza1_bee | 100 | 100 | 499 | 499 | 998 | 998 |
| fbmy8028_rel_221222.cza1_bee | 100 | 100 | 499 | 499 | 998 | 998 |
| fbmy8028_rel_231222_870.cza1_bee_cfx | 100 | 100 | 499 | 499 | 998 | 998 |
| target | 100 | 100 | 500 | 500 | 1000 | 1000 |
l.i0
l.i0: load without secondary indexes. Graphs for performance per 1-second interval are here.
Average throughput:
Insert response time histogram: each cell has the percentage of responses that take <= the time in the header and max is the max response time in seconds. For the max column values in the top 25% of the range have a red background and in the bottom 25% of the range have a green background. The red background is not used when the min value is within 80% of the max value.
| dbms | 256us | 1ms | 4ms | 16ms | 64ms | 256ms | 1s | 4s | 16s | gt | max |
|---|---|---|---|---|---|---|---|---|---|---|---|
| fbmy5635_rel_202203072101.cza1_bee | 99.872 | 0.124 | 0.001 | 0.003 | 0.119 | ||||||
| fbmy5635_rel_20230529_850.cza1_bee | 99.868 | 0.127 | 0.003 | 0.001 | 0.084 | ||||||
| fbmy8028_rel_20220829_752.cza1_bee | 99.725 | 0.201 | 0.071 | 0.003 | 0.099 | ||||||
| fbmy8028_rel_20230619_831.cza1_bee | 99.725 | 0.198 | 0.074 | 0.003 | 0.076 | ||||||
| fbmy8028_rel_221222.cza1_bee | 99.724 | 0.196 | 0.078 | 0.002 | 0.080 | ||||||
| fbmy8028_rel_231222_870.cza1_bee_cfx | 99.725 | 0.199 | 0.072 | 0.003 | 0.080 |
Performance metrics for the DBMS listed above. Some are normalized by throughput, others are not. Legend for results is here.
ips	qps	rps	rmbps	wps	wmbps	rpq	rkbpq	wpi	wkbpi	csps	cpups	cspq	cpupq	dbgb1	dbgb2	rss	maxop	p50	p99	tag
79787	0	0	0.0	38.0	13.8	0.000	0.000	0.000	0.177	7814	22.4	0.098	22	1.0	2.5	0.3	0.119	80411	71252	fbmy5635_rel_202203072101.cza1_bee
78125	0	0	0.0	36.0	13.1	0.000	0.000	0.000	0.172	7660	23.0	0.098	24	1.0	2.5	0.3	0.084	78715	71659	fbmy5635_rel_20230529_850.cza1_bee
58366	0	0	0.0	36.9	11.9	0.000	0.000	0.001	0.209	6102	22.4	0.105	31	0.9	2.7	0.6	0.099	58586	51243	fbmy8028_rel_20220829_752.cza1_bee
58594	0	0	0.0	37.3	12.0	0.000	0.000	0.001	0.211	6122	22.5	0.104	31	0.9	2.7	0.6	0.076	58714	53133	fbmy8028_rel_20230619_831.cza1_bee
57692	0	0	0.0	36.5	11.8	0.000	0.000	0.001	0.210	6057	22.2	0.105	31	0.9	2.7	0.6	0.080	57837	52141	fbmy8028_rel_221222.cza1_bee
58480	0	0	0.0	36.7	12.0	0.000	0.000	0.001	0.211	6137	22.5	0.105	31	0.9	2.7	0.6	0.080	58735	52341	fbmy8028_rel_231222_870.cza1_bee_cfx
l.x
l.x: create secondary indexes.
Average throughput:
Performance metrics for the DBMS listed above. Some are normalized by throughput, others are not. Legend for results is here.
ips	qps	rps	rmbps	wps	wmbps	rpq	rkbpq	wpi	wkbpi	csps	cpups	cspq	cpupq	dbgb1	dbgb2	rss	maxop	p50	p99	tag
89021	0	0	0.0	36.8	14.6	0.000	0.000	0.000	0.167	213	11.6	0.002	10	2.0	3.6	2.3	0.002	NA	NA	fbmy5635_rel_202203072101.cza1_bee
87720	0	0	0.0	36.1	14.3	0.000	0.000	0.000	0.167	203	11.7	0.002	11	2.0	3.6	2.4	0.002	NA	NA	fbmy5635_rel_20230529_850.cza1_bee
78534	0	0	0.0	31.4	12.1	0.000	0.000	0.000	0.158	392	11.6	0.005	12	2.0	3.8	2.7	0.003	NA	NA	fbmy8028_rel_20220829_752.cza1_bee
78948	0	0	0.0	31.5	12.2	0.000	0.000	0.000	0.158	380	11.6	0.005	12	2.0	3.8	2.7	0.003	NA	NA	fbmy8028_rel_20230619_831.cza1_bee
78125	0	0	0.0	31.3	12.1	0.000	0.000	0.000	0.158	363	11.6	0.005	12	2.0	3.8	2.7	0.003	NA	NA	fbmy8028_rel_221222.cza1_bee
77720	0	0	0.0	31.2	12.0	0.000	0.000	0.000	0.158	368	11.6	0.005	12	2.0	3.8	2.7	0.003	NA	NA	fbmy8028_rel_231222_870.cza1_bee_cfx
l.i1
l.i1: continue load after secondary indexes created with 50 inserts per transaction. Graphs for performance per 1-second interval are here.
Average throughput:
Insert response time histogram: each cell has the percentage of responses that take <= the time in the header and max is the max response time in seconds. For the max column values in the top 25% of the range have a red background and in the bottom 25% of the range have a green background. The red background is not used when the min value is within 80% of the max value.
| dbms | 256us | 1ms | 4ms | 16ms | 64ms | 256ms | 1s | 4s | 16s | gt | max |
|---|---|---|---|---|---|---|---|---|---|---|---|
| fbmy5635_rel_202203072101.cza1_bee | 99.806 | 0.189 | 0.003 | 0.003 | 0.087 | ||||||
| fbmy5635_rel_20230529_850.cza1_bee | 99.804 | 0.190 | 0.003 | 0.002 | 0.103 | ||||||
| fbmy8028_rel_20220829_752.cza1_bee | 99.667 | 0.260 | 0.069 | 0.004 | 0.102 | ||||||
| fbmy8028_rel_20230619_831.cza1_bee | 99.664 | 0.276 | 0.057 | 0.003 | 0.107 | ||||||
| fbmy8028_rel_221222.cza1_bee | 99.669 | 0.273 | 0.056 | 0.003 | 0.104 | ||||||
| fbmy8028_rel_231222_870.cza1_bee_cfx | 99.698 | 0.243 | 0.057 | 0.003 | 0.083 |
Delete response time histogram: each cell has the percentage of responses that take <= the time in the header and max is the max response time in seconds. For the max column values in the top 25% of the range have a red background and in the bottom 25% of the range have a green background. The red background is not used when the min value is within 80% of the max value.
| dbms | 256us | 1ms | 4ms | 16ms | 64ms | 256ms | 1s | 4s | 16s | gt | max |
|---|---|---|---|---|---|---|---|---|---|---|---|
| fbmy5635_rel_202203072101.cza1_bee | 99.800 | 0.190 | 0.007 | 0.003 | 0.116 | ||||||
| fbmy5635_rel_20230529_850.cza1_bee | 99.795 | 0.194 | 0.009 | 0.002 | 0.103 | ||||||
| fbmy8028_rel_20220829_752.cza1_bee | 99.659 | 0.261 | 0.076 | 0.004 | 0.113 | ||||||
| fbmy8028_rel_20230619_831.cza1_bee | 99.659 | 0.277 | 0.060 | 0.004 | 0.104 | ||||||
| fbmy8028_rel_221222.cza1_bee | 99.658 | 0.276 | 0.062 | 0.003 | 0.111 | ||||||
| fbmy8028_rel_231222_870.cza1_bee_cfx | 99.686 | 0.251 | 0.060 | 0.003 | 0.111 |
Performance metrics for the DBMS listed above. Some are normalized by throughput, others are not. Legend for results is here.
ips	qps	rps	rmbps	wps	wmbps	rpq	rkbpq	wpi	wkbpi	csps	cpups	cspq	cpupq	dbgb1	dbgb2	rss	maxop	p50	p99	tag
26604	0	18	0.4	124.4	48.7	0.001	0.017	0.005	1.873	11355	48.3	0.427	145	2.9	4.4	8.4	0.087	26621	23424	fbmy5635_rel_202203072101.cza1_bee
26765	0	46	0.6	120.8	47.4	0.002	0.025	0.005	1.814	11379	48.3	0.425	144	2.4	3.9	8.3	0.103	26732	23923	fbmy5635_rel_20230529_850.cza1_bee
22466	0	10	0.6	117.3	44.7	0.000	0.026	0.005	2.036	9911	46.4	0.441	165	2.6	4.3	8.8	0.102	22474	19846	fbmy8028_rel_20220829_752.cza1_bee
22253	0	34	0.6	101.8	38.2	0.002	0.028	0.005	1.757	9761	43.2	0.439	155	3.2	4.9	8.6	0.107	22178	19779	fbmy8028_rel_20230619_831.cza1_bee
22676	0	104	0.5	107.5	40.4	0.005	0.025	0.005	1.826	10082	45.9	0.445	162	2.7	4.4	8.6	0.104	22635	20120	fbmy8028_rel_221222.cza1_bee
26429	0	151	0.8	143.5	54.7	0.006	0.032	0.005	2.119	12039	49.2	0.456	149	2.7	3.6	8.6	0.083	26371	23425	fbmy8028_rel_231222_870.cza1_bee_cfx
l.i2
l.i2: continue load after secondary indexes created with 5 inserts per transaction. Graphs for performance per 1-second interval are here.
Average throughput:
Insert response time histogram: each cell has the percentage of responses that take <= the time in the header and max is the max response time in seconds. For the max column values in the top 25% of the range have a red background and in the bottom 25% of the range have a green background. The red background is not used when the min value is within 80% of the max value.
| dbms | 256us | 1ms | 4ms | 16ms | 64ms | 256ms | 1s | 4s | 16s | gt | max |
|---|---|---|---|---|---|---|---|---|---|---|---|
| fbmy5635_rel_202203072101.cza1_bee | 0.024 | 99.910 | 0.013 | 0.052 | 0.001 | nonzero | 0.078 | ||||
| fbmy5635_rel_20230529_850.cza1_bee | 0.011 | 99.919 | 0.016 | 0.053 | 0.001 | nonzero | 0.078 | ||||
| fbmy8028_rel_20220829_752.cza1_bee | 99.834 | 0.080 | 0.080 | 0.005 | nonzero | 0.076 | |||||
| fbmy8028_rel_20230619_831.cza1_bee | 99.847 | 0.070 | 0.079 | 0.004 | nonzero | 0.083 | |||||
| fbmy8028_rel_221222.cza1_bee | 99.811 | 0.104 | 0.081 | 0.004 | nonzero | 0.080 | |||||
| fbmy8028_rel_231222_870.cza1_bee_cfx | 99.893 | 0.024 | 0.078 | 0.004 | nonzero | 0.079 |
Delete response time histogram: each cell has the percentage of responses that take <= the time in the header and max is the max response time in seconds. For the max column values in the top 25% of the range have a red background and in the bottom 25% of the range have a green background. The red background is not used when the min value is within 80% of the max value.
| dbms | 256us | 1ms | 4ms | 16ms | 64ms | 256ms | 1s | 4s | 16s | gt | max |
|---|---|---|---|---|---|---|---|---|---|---|---|
| fbmy5635_rel_202203072101.cza1_bee | 99.926 | 0.020 | 0.052 | 0.001 | nonzero | 0.078 | |||||
| fbmy5635_rel_20230529_850.cza1_bee | 99.926 | 0.018 | 0.054 | 0.001 | nonzero | 0.078 | |||||
| fbmy8028_rel_20220829_752.cza1_bee | 99.744 | 0.169 | 0.081 | 0.005 | nonzero | 0.081 | |||||
| fbmy8028_rel_20230619_831.cza1_bee | 99.803 | 0.112 | 0.081 | 0.004 | nonzero | 0.091 | |||||
| fbmy8028_rel_221222.cza1_bee | 99.770 | 0.143 | 0.082 | 0.005 | 0.001 | 0.103 | |||||
| fbmy8028_rel_231222_870.cza1_bee_cfx | 99.872 | 0.044 | 0.079 | 0.005 | nonzero | 0.077 |
Performance metrics for the DBMS listed above. Some are normalized by throughput, others are not. Legend for results is here.
ips	qps	rps	rmbps	wps	wmbps	rpq	rkbpq	wpi	wkbpi	csps	cpups	cspq	cpupq	dbgb1	dbgb2	rss	maxop	p50	p99	tag
9569	0	4	0.2	95.8	35.8	0.000	0.020	0.010	3.831	39463	42.8	4.124	358	2.3	2.3	8.4	0.078	9460	7801	fbmy5635_rel_202203072101.cza1_bee
9403	0	6	0.2	107.7	39.1	0.001	0.023	0.011	4.263	38774	44.8	4.124	381	2.2	2.2	8.4	0.078	9329	7861	fbmy5635_rel_20230529_850.cza1_bee
7701	0	2	0.2	86.3	31.9	0.000	0.024	0.011	4.241	32504	41.8	4.221	434	2.5	2.7	8.8	0.076	7647	6498	fbmy8028_rel_20220829_752.cza1_bee
7930	0	11	0.3	85.5	29.5	0.001	0.034	0.011	3.812	33280	40.9	4.197	413	2.2	2.5	8.8	0.083	7849	6867	fbmy8028_rel_20230619_831.cza1_bee
7800	0	40	0.2	95.9	34.9	0.005	0.030	0.012	4.580	32715	43.2	4.194	443	2.2	2.4	8.7	0.080	7783	6867	fbmy8028_rel_221222.cza1_bee
8180	0	41	0.2	67.6	23.6	0.005	0.029	0.008	2.951	34193	36.9	4.180	361	2.3	2.8	8.6	0.079	8081	7132	fbmy8028_rel_231222_870.cza1_bee_cfx
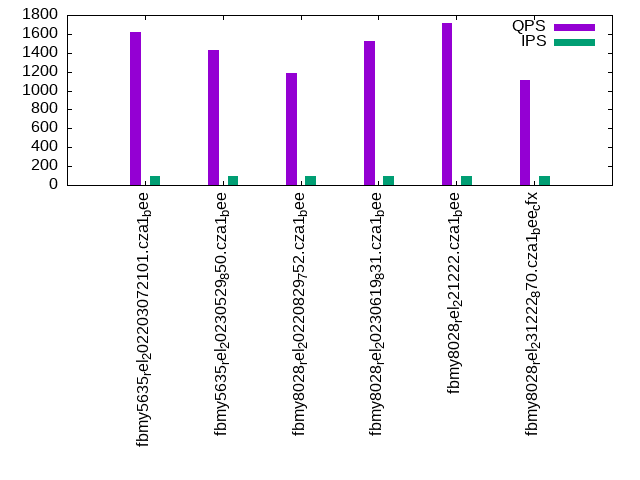
qr100.L1
qr100.L1: range queries with 100 insert/s per client. Graphs for performance per 1-second interval are here.
Average throughput:
Query response time histogram: each cell has the percentage of responses that take <= the time in the header and max is the max response time in seconds. For max values in the top 25% of the range have a red background and in the bottom 25% of the range have a green background. The red background is not used when the min value is within 80% of the max value.
| dbms | 256us | 1ms | 4ms | 16ms | 64ms | 256ms | 1s | 4s | 16s | gt | max |
|---|---|---|---|---|---|---|---|---|---|---|---|
| fbmy5635_rel_202203072101.cza1_bee | 15.639 | 64.892 | 19.469 | 0.001 | nonzero | 0.176 | |||||
| fbmy5635_rel_20230529_850.cza1_bee | 12.657 | 54.385 | 32.957 | nonzero | nonzero | 0.027 | |||||
| fbmy8028_rel_20220829_752.cza1_bee | 6.275 | 60.515 | 30.477 | 2.733 | nonzero | nonzero | 0.186 | ||||
| fbmy8028_rel_20230619_831.cza1_bee | 7.556 | 71.246 | 21.197 | 0.001 | nonzero | 0.032 | |||||
| fbmy8028_rel_221222.cza1_bee | 5.829 | 81.660 | 12.511 | nonzero | nonzero | 0.030 | |||||
| fbmy8028_rel_231222_870.cza1_bee_cfx | 2.991 | 65.656 | 31.222 | 0.132 | 0.008 |
Insert response time histogram: each cell has the percentage of responses that take <= the time in the header and max is the max response time in seconds. For max values in the top 25% of the range have a red background and in the bottom 25% of the range have a green background. The red background is not used when the min value is within 80% of the max value.
| dbms | 256us | 1ms | 4ms | 16ms | 64ms | 256ms | 1s | 4s | 16s | gt | max |
|---|---|---|---|---|---|---|---|---|---|---|---|
| fbmy5635_rel_202203072101.cza1_bee | 99.194 | 0.778 | 0.028 | 0.017 | |||||||
| fbmy5635_rel_20230529_850.cza1_bee | 99.597 | 0.403 | 0.014 | ||||||||
| fbmy8028_rel_20220829_752.cza1_bee | 99.250 | 0.694 | 0.056 | 0.019 | |||||||
| fbmy8028_rel_20230619_831.cza1_bee | 99.083 | 0.861 | 0.056 | 0.023 | |||||||
| fbmy8028_rel_221222.cza1_bee | 99.403 | 0.542 | 0.056 | 0.018 | |||||||
| fbmy8028_rel_231222_870.cza1_bee_cfx | 99.542 | 0.417 | 0.042 | 0.018 |
Delete response time histogram: each cell has the percentage of responses that take <= the time in the header and max is the max response time in seconds. For max values in the top 25% of the range have a red background and in the bottom 25% of the range have a green background. The red background is not used when the min value is within 80% of the max value.
| dbms | 256us | 1ms | 4ms | 16ms | 64ms | 256ms | 1s | 4s | 16s | gt | max |
|---|---|---|---|---|---|---|---|---|---|---|---|
| fbmy5635_rel_202203072101.cza1_bee | 99.236 | 0.750 | 0.014 | 0.018 | |||||||
| fbmy5635_rel_20230529_850.cza1_bee | 99.653 | 0.347 | 0.015 | ||||||||
| fbmy8028_rel_20220829_752.cza1_bee | 99.375 | 0.583 | 0.042 | 0.018 | |||||||
| fbmy8028_rel_20230619_831.cza1_bee | 99.236 | 0.722 | 0.042 | 0.023 | |||||||
| fbmy8028_rel_221222.cza1_bee | 99.472 | 0.500 | 0.028 | 0.018 | |||||||
| fbmy8028_rel_231222_870.cza1_bee_cfx | 99.458 | 0.500 | 0.042 | 0.018 |
Performance metrics for the DBMS listed above. Some are normalized by throughput, others are not. Legend for results is here.
ips	qps	rps	rmbps	wps	wmbps	rpq	rkbpq	wpi	wkbpi	csps	cpups	cspq	cpupq	dbgb1	dbgb2	rss	maxop	p50	p99	tag
100	1621	0	0.0	7.8	1.9	0.000	0.000	0.078	19.873	6362	12.6	3.925	622	2.0	2.1	8.5	0.176	1615	1455	fbmy5635_rel_202203072101.cza1_bee
100	1430	0	0.0	4.1	0.4	0.000	0.000	0.041	3.637	5620	11.9	3.930	666	2.2	2.2	8.4	0.027	1423	1294	fbmy5635_rel_20230529_850.cza1_bee
100	1185	0	0.0	8.6	2.1	0.000	0.000	0.086	21.935	4850	13.4	4.091	904	2.0	2.3	8.9	0.186	1183	1071	fbmy8028_rel_20220829_752.cza1_bee
100	1523	0	0.0	4.4	0.4	0.000	0.000	0.044	4.422	6105	12.5	4.010	657	2.1	2.4	8.8	0.032	1726	1039	fbmy8028_rel_20230619_831.cza1_bee
100	1717	0	0.0	4.3	0.4	0.000	0.000	0.043	4.049	6843	12.5	3.985	582	2.2	2.4	8.7	0.030	1710	1483	fbmy8028_rel_221222.cza1_bee
100	1114	0	0.0	3.6	0.2	0.000	0.000	0.036	1.835	4550	12.4	4.083	890	2.2	2.5	8.7	0.008	1103	959	fbmy8028_rel_231222_870.cza1_bee_cfx
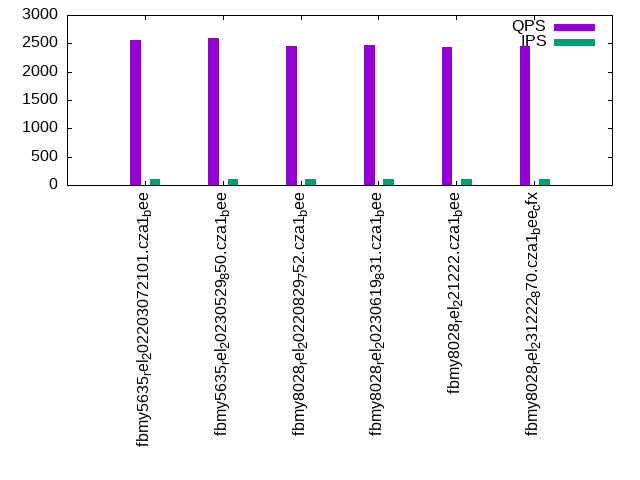
qp100.L2
qp100.L2: point queries with 100 insert/s per client. Graphs for performance per 1-second interval are here.
Average throughput:
Query response time histogram: each cell has the percentage of responses that take <= the time in the header and max is the max response time in seconds. For max values in the top 25% of the range have a red background and in the bottom 25% of the range have a green background. The red background is not used when the min value is within 80% of the max value.
| dbms | 256us | 1ms | 4ms | 16ms | 64ms | 256ms | 1s | 4s | 16s | gt | max |
|---|---|---|---|---|---|---|---|---|---|---|---|
| fbmy5635_rel_202203072101.cza1_bee | 2.915 | 97.082 | 0.003 | nonzero | nonzero | 0.024 | |||||
| fbmy5635_rel_20230529_850.cza1_bee | 2.468 | 97.530 | 0.002 | 0.001 | 0.010 | ||||||
| fbmy8028_rel_20220829_752.cza1_bee | nonzero | 99.993 | 0.006 | nonzero | 0.005 | ||||||
| fbmy8028_rel_20230619_831.cza1_bee | nonzero | 99.994 | 0.005 | 0.001 | 0.010 | ||||||
| fbmy8028_rel_221222.cza1_bee | nonzero | 99.992 | 0.007 | 0.001 | 0.010 | ||||||
| fbmy8028_rel_231222_870.cza1_bee_cfx | nonzero | 99.990 | 0.009 | 0.001 | 0.010 |
Insert response time histogram: each cell has the percentage of responses that take <= the time in the header and max is the max response time in seconds. For max values in the top 25% of the range have a red background and in the bottom 25% of the range have a green background. The red background is not used when the min value is within 80% of the max value.
| dbms | 256us | 1ms | 4ms | 16ms | 64ms | 256ms | 1s | 4s | 16s | gt | max |
|---|---|---|---|---|---|---|---|---|---|---|---|
| fbmy5635_rel_202203072101.cza1_bee | 99.431 | 0.556 | 0.014 | 0.016 | |||||||
| fbmy5635_rel_20230529_850.cza1_bee | 99.375 | 0.597 | 0.028 | 0.019 | |||||||
| fbmy8028_rel_20220829_752.cza1_bee | 99.278 | 0.653 | 0.069 | 0.018 | |||||||
| fbmy8028_rel_20230619_831.cza1_bee | 99.250 | 0.681 | 0.069 | 0.018 | |||||||
| fbmy8028_rel_221222.cza1_bee | 99.306 | 0.625 | 0.069 | 0.018 | |||||||
| fbmy8028_rel_231222_870.cza1_bee_cfx | 99.667 | 0.264 | 0.069 | 0.023 |
Delete response time histogram: each cell has the percentage of responses that take <= the time in the header and max is the max response time in seconds. For max values in the top 25% of the range have a red background and in the bottom 25% of the range have a green background. The red background is not used when the min value is within 80% of the max value.
| dbms | 256us | 1ms | 4ms | 16ms | 64ms | 256ms | 1s | 4s | 16s | gt | max |
|---|---|---|---|---|---|---|---|---|---|---|---|
| fbmy5635_rel_202203072101.cza1_bee | 99.361 | 0.625 | 0.014 | 0.199 | |||||||
| fbmy5635_rel_20230529_850.cza1_bee | 99.444 | 0.556 | 0.014 | ||||||||
| fbmy8028_rel_20220829_752.cza1_bee | 99.458 | 0.514 | 0.028 | 0.018 | |||||||
| fbmy8028_rel_20230619_831.cza1_bee | 99.403 | 0.542 | 0.056 | 0.018 | |||||||
| fbmy8028_rel_221222.cza1_bee | 99.542 | 0.403 | 0.056 | 0.018 | |||||||
| fbmy8028_rel_231222_870.cza1_bee_cfx | 99.625 | 0.306 | 0.069 | 0.023 |
Performance metrics for the DBMS listed above. Some are normalized by throughput, others are not. Legend for results is here.
ips	qps	rps	rmbps	wps	wmbps	rpq	rkbpq	wpi	wkbpi	csps	cpups	cspq	cpupq	dbgb1	dbgb2	rss	maxop	p50	p99	tag
100	2558	0	0.0	8.9	2.4	0.000	0.000	0.090	24.898	10477	14.3	4.097	447	2.0	2.2	9.2	0.024	2541	2142	fbmy5635_rel_202203072101.cza1_bee
100	2592	12	0.1	4.6	0.6	0.004	0.028	0.046	5.951	10628	13.6	4.100	420	2.1	2.3	8.9	0.010	2573	2381	fbmy5635_rel_20230529_850.cza1_bee
100	2454	0	0.0	9.2	2.5	0.000	0.000	0.093	25.640	10223	14.5	4.165	473	2.1	2.4	10.0	0.005	2414	1950	fbmy8028_rel_20220829_752.cza1_bee
100	2467	14	0.1	4.4	0.5	0.006	0.037	0.044	5.208	10257	13.5	4.158	438	2.1	2.5	9.4	0.010	2429	2046	fbmy8028_rel_20230619_831.cza1_bee
100	2444	14	0.1	4.6	0.5	0.006	0.037	0.046	5.291	10170	13.6	4.162	445	2.2	2.5	9.4	0.010	2413	1998	fbmy8028_rel_221222.cza1_bee
100	2448	16	0.1	3.7	0.2	0.007	0.042	0.038	2.420	10194	13.4	4.165	438	2.3	2.6	9.3	0.010	2413	1996	fbmy8028_rel_231222_870.cza1_bee_cfx
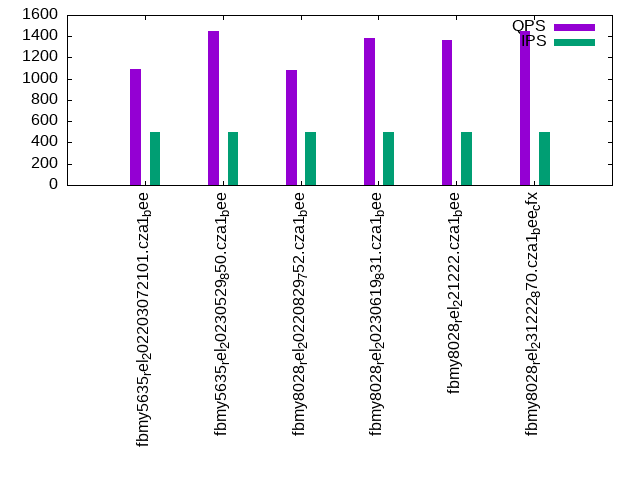
qr500.L3
qr500.L3: range queries with 500 insert/s per client. Graphs for performance per 1-second interval are here.
Average throughput:
Query response time histogram: each cell has the percentage of responses that take <= the time in the header and max is the max response time in seconds. For max values in the top 25% of the range have a red background and in the bottom 25% of the range have a green background. The red background is not used when the min value is within 80% of the max value.
| dbms | 256us | 1ms | 4ms | 16ms | 64ms | 256ms | 1s | 4s | 16s | gt | max |
|---|---|---|---|---|---|---|---|---|---|---|---|
| fbmy5635_rel_202203072101.cza1_bee | 11.225 | 57.609 | 31.077 | 0.088 | nonzero | nonzero | 0.176 | ||||
| fbmy5635_rel_20230529_850.cza1_bee | 13.359 | 67.455 | 19.185 | 0.001 | nonzero | 0.035 | |||||
| fbmy8028_rel_20220829_752.cza1_bee | 5.394 | 69.776 | 23.022 | 1.808 | nonzero | nonzero | 0.175 | ||||
| fbmy8028_rel_20230619_831.cza1_bee | 5.813 | 74.062 | 20.079 | 0.046 | nonzero | 0.031 | |||||
| fbmy8028_rel_221222.cza1_bee | 4.447 | 72.276 | 23.277 | nonzero | nonzero | 0.038 | |||||
| fbmy8028_rel_231222_870.cza1_bee_cfx | 2.897 | 76.590 | 20.169 | 0.344 | nonzero | 0.036 |
Insert response time histogram: each cell has the percentage of responses that take <= the time in the header and max is the max response time in seconds. For max values in the top 25% of the range have a red background and in the bottom 25% of the range have a green background. The red background is not used when the min value is within 80% of the max value.
| dbms | 256us | 1ms | 4ms | 16ms | 64ms | 256ms | 1s | 4s | 16s | gt | max |
|---|---|---|---|---|---|---|---|---|---|---|---|
| fbmy5635_rel_202203072101.cza1_bee | 99.739 | 0.258 | 0.003 | 0.049 | |||||||
| fbmy5635_rel_20230529_850.cza1_bee | 99.733 | 0.261 | 0.006 | 0.061 | |||||||
| fbmy8028_rel_20220829_752.cza1_bee | 99.525 | 0.386 | 0.089 | 0.047 | |||||||
| fbmy8028_rel_20230619_831.cza1_bee | 99.567 | 0.347 | 0.086 | 0.063 | |||||||
| fbmy8028_rel_221222.cza1_bee | 99.500 | 0.411 | 0.086 | 0.003 | 0.064 | ||||||
| fbmy8028_rel_231222_870.cza1_bee_cfx | 99.611 | 0.311 | 0.078 | 0.047 |
Delete response time histogram: each cell has the percentage of responses that take <= the time in the header and max is the max response time in seconds. For max values in the top 25% of the range have a red background and in the bottom 25% of the range have a green background. The red background is not used when the min value is within 80% of the max value.
| dbms | 256us | 1ms | 4ms | 16ms | 64ms | 256ms | 1s | 4s | 16s | gt | max |
|---|---|---|---|---|---|---|---|---|---|---|---|
| fbmy5635_rel_202203072101.cza1_bee | 99.772 | 0.222 | 0.006 | 0.048 | |||||||
| fbmy5635_rel_20230529_850.cza1_bee | 99.694 | 0.300 | 0.006 | 0.062 | |||||||
| fbmy8028_rel_20220829_752.cza1_bee | 99.544 | 0.369 | 0.086 | 0.061 | |||||||
| fbmy8028_rel_20230619_831.cza1_bee | 99.592 | 0.331 | 0.078 | 0.049 | |||||||
| fbmy8028_rel_221222.cza1_bee | 99.528 | 0.392 | 0.081 | 0.051 | |||||||
| fbmy8028_rel_231222_870.cza1_bee_cfx | 99.597 | 0.319 | 0.083 | 0.062 |
Performance metrics for the DBMS listed above. Some are normalized by throughput, others are not. Legend for results is here.
ips	qps	rps	rmbps	wps	wmbps	rpq	rkbpq	wpi	wkbpi	csps	cpups	cspq	cpupq	dbgb1	dbgb2	rss	maxop	p50	p99	tag
499	1095	0	0.0	30.5	11.5	0.000	0.000	0.061	23.603	4620	17.8	4.221	1301	2.1	2.7	8.9	0.176	1086	862	fbmy5635_rel_202203072101.cza1_bee
499	1448	0	0.0	8.5	2.3	0.000	0.000	0.017	4.691	5828	13.5	4.024	746	2.1	2.7	8.5	0.035	1408	1039	fbmy5635_rel_20230529_850.cza1_bee
499	1083	0	0.0	30.7	11.6	0.000	0.000	0.062	23.693	4732	18.2	4.368	1344	2.1	2.8	9.9	0.175	1055	879	fbmy8028_rel_20220829_752.cza1_bee
499	1379	0	0.0	8.6	2.3	0.000	0.000	0.017	4.723	5692	13.5	4.127	783	2.1	2.8	9.1	0.031	1375	1007	fbmy8028_rel_20230619_831.cza1_bee
499	1360	0	0.0	8.8	2.3	0.000	0.000	0.018	4.678	5624	13.5	4.135	794	2.1	2.9	9.3	0.038	1342	1071	fbmy8028_rel_221222.cza1_bee
499	1452	0	0.0	6.5	1.3	0.000	0.000	0.013	2.715	5976	13.1	4.115	722	2.3	3.0	9.2	0.036	1392	911	fbmy8028_rel_231222_870.cza1_bee_cfx
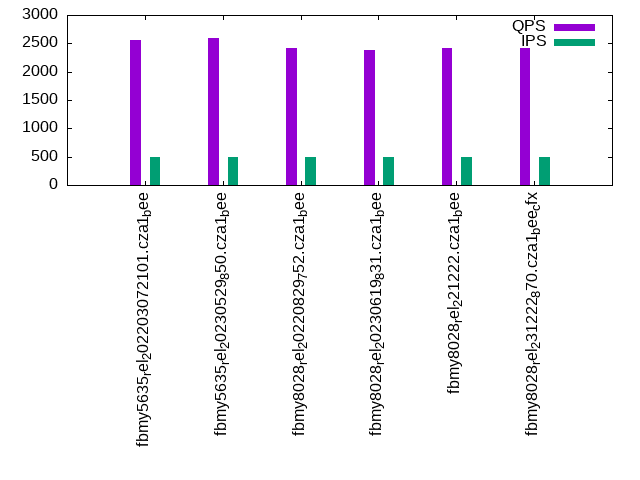
qp500.L4
qp500.L4: point queries with 500 insert/s per client. Graphs for performance per 1-second interval are here.
Average throughput:
Query response time histogram: each cell has the percentage of responses that take <= the time in the header and max is the max response time in seconds. For max values in the top 25% of the range have a red background and in the bottom 25% of the range have a green background. The red background is not used when the min value is within 80% of the max value.
| dbms | 256us | 1ms | 4ms | 16ms | 64ms | 256ms | 1s | 4s | 16s | gt | max |
|---|---|---|---|---|---|---|---|---|---|---|---|
| fbmy5635_rel_202203072101.cza1_bee | 2.534 | 97.458 | 0.008 | nonzero | 0.005 | ||||||
| fbmy5635_rel_20230529_850.cza1_bee | 3.502 | 96.495 | 0.004 | nonzero | 0.004 | ||||||
| fbmy8028_rel_20220829_752.cza1_bee | 99.992 | 0.008 | nonzero | 0.005 | |||||||
| fbmy8028_rel_20230619_831.cza1_bee | nonzero | 99.993 | 0.007 | nonzero | 0.008 | ||||||
| fbmy8028_rel_221222.cza1_bee | nonzero | 99.994 | 0.006 | nonzero | 0.004 | ||||||
| fbmy8028_rel_231222_870.cza1_bee_cfx | 0.001 | 99.993 | 0.006 | nonzero | 0.006 |
Insert response time histogram: each cell has the percentage of responses that take <= the time in the header and max is the max response time in seconds. For max values in the top 25% of the range have a red background and in the bottom 25% of the range have a green background. The red background is not used when the min value is within 80% of the max value.
| dbms | 256us | 1ms | 4ms | 16ms | 64ms | 256ms | 1s | 4s | 16s | gt | max |
|---|---|---|---|---|---|---|---|---|---|---|---|
| fbmy5635_rel_202203072101.cza1_bee | 99.667 | 0.325 | 0.008 | 0.054 | |||||||
| fbmy5635_rel_20230529_850.cza1_bee | 99.744 | 0.253 | 0.003 | 0.066 | |||||||
| fbmy8028_rel_20220829_752.cza1_bee | 99.397 | 0.525 | 0.078 | 0.038 | |||||||
| fbmy8028_rel_20230619_831.cza1_bee | 99.367 | 0.558 | 0.075 | 0.041 | |||||||
| fbmy8028_rel_221222.cza1_bee | 99.481 | 0.431 | 0.089 | 0.044 | |||||||
| fbmy8028_rel_231222_870.cza1_bee_cfx | 99.558 | 0.367 | 0.072 | 0.003 | 0.064 |
Delete response time histogram: each cell has the percentage of responses that take <= the time in the header and max is the max response time in seconds. For max values in the top 25% of the range have a red background and in the bottom 25% of the range have a green background. The red background is not used when the min value is within 80% of the max value.
| dbms | 256us | 1ms | 4ms | 16ms | 64ms | 256ms | 1s | 4s | 16s | gt | max |
|---|---|---|---|---|---|---|---|---|---|---|---|
| fbmy5635_rel_202203072101.cza1_bee | 99.689 | 0.300 | 0.008 | 0.003 | 0.192 | ||||||
| fbmy5635_rel_20230529_850.cza1_bee | 99.764 | 0.233 | 0.003 | 0.065 | |||||||
| fbmy8028_rel_20220829_752.cza1_bee | 99.372 | 0.550 | 0.075 | 0.003 | 0.190 | ||||||
| fbmy8028_rel_20230619_831.cza1_bee | 99.428 | 0.508 | 0.064 | 0.055 | |||||||
| fbmy8028_rel_221222.cza1_bee | 99.567 | 0.364 | 0.069 | 0.052 | |||||||
| fbmy8028_rel_231222_870.cza1_bee_cfx | 99.533 | 0.389 | 0.078 | 0.050 |
Performance metrics for the DBMS listed above. Some are normalized by throughput, others are not. Legend for results is here.
ips	qps	rps	rmbps	wps	wmbps	rpq	rkbpq	wpi	wkbpi	csps	cpups	cspq	cpupq	dbgb1	dbgb2	rss	maxop	p50	p99	tag
499	2557	0	0.0	31.1	12.0	0.000	0.000	0.062	24.599	10699	18.7	4.185	585	2.1	3.1	9.1	0.005	2508	2061	fbmy5635_rel_202203072101.cza1_bee
499	2588	0	0.0	8.6	2.2	0.000	0.000	0.017	4.557	10709	14.4	4.138	445	2.1	3.1	9.1	0.004	2556	2365	fbmy5635_rel_20230529_850.cza1_bee
499	2425	0	0.0	30.8	11.8	0.000	0.013	0.062	24.220	10327	19.2	4.258	633	2.0	3.1	9.6	0.005	2429	1836	fbmy8028_rel_20220829_752.cza1_bee
499	2385	0	0.0	8.8	2.2	0.000	0.000	0.018	4.528	10035	14.7	4.207	493	2.1	3.3	9.2	0.008	2364	2013	fbmy8028_rel_20230619_831.cza1_bee
499	2423	0	0.0	9.1	2.3	0.000	0.000	0.018	4.716	10173	14.6	4.199	482	2.1	3.3	9.4	0.004	2383	1998	fbmy8028_rel_221222.cza1_bee
499	2414	0	0.0	6.9	1.5	0.000	0.000	0.014	3.096	10154	14.4	4.206	477	2.2	3.4	9.4	0.006	2397	2013	fbmy8028_rel_231222_870.cza1_bee_cfx
qr1000.L5
qr1000.L5: range queries with 1000 insert/s per client. Graphs for performance per 1-second interval are here.
Average throughput:
Query response time histogram: each cell has the percentage of responses that take <= the time in the header and max is the max response time in seconds. For max values in the top 25% of the range have a red background and in the bottom 25% of the range have a green background. The red background is not used when the min value is within 80% of the max value.
| dbms | 256us | 1ms | 4ms | 16ms | 64ms | 256ms | 1s | 4s | 16s | gt | max |
|---|---|---|---|---|---|---|---|---|---|---|---|
| fbmy5635_rel_202203072101.cza1_bee | 12.756 | 69.621 | 13.492 | 4.129 | nonzero | 0.001 | 0.184 | ||||
| fbmy5635_rel_20230529_850.cza1_bee | 12.301 | 67.597 | 20.101 | 0.001 | nonzero | 0.042 | |||||
| fbmy8028_rel_20220829_752.cza1_bee | 5.033 | 70.748 | 21.967 | 2.251 | nonzero | nonzero | 0.181 | ||||
| fbmy8028_rel_20230619_831.cza1_bee | 5.181 | 72.906 | 21.912 | nonzero | nonzero | 0.031 | |||||
| fbmy8028_rel_221222.cza1_bee | 4.291 | 71.017 | 24.691 | 0.001 | 0.001 | 0.038 | |||||
| fbmy8028_rel_231222_870.cza1_bee_cfx | 1.901 | 72.869 | 25.230 | nonzero | nonzero | 0.034 |
Insert response time histogram: each cell has the percentage of responses that take <= the time in the header and max is the max response time in seconds. For max values in the top 25% of the range have a red background and in the bottom 25% of the range have a green background. The red background is not used when the min value is within 80% of the max value.
| dbms | 256us | 1ms | 4ms | 16ms | 64ms | 256ms | 1s | 4s | 16s | gt | max |
|---|---|---|---|---|---|---|---|---|---|---|---|
| fbmy5635_rel_202203072101.cza1_bee | 99.554 | 0.440 | 0.006 | 0.063 | |||||||
| fbmy5635_rel_20230529_850.cza1_bee | 99.711 | 0.285 | 0.001 | 0.003 | 0.066 | ||||||
| fbmy8028_rel_20220829_752.cza1_bee | 99.571 | 0.346 | 0.083 | 0.049 | |||||||
| fbmy8028_rel_20230619_831.cza1_bee | 99.542 | 0.376 | 0.082 | 0.064 | |||||||
| fbmy8028_rel_221222.cza1_bee | 99.583 | 0.331 | 0.086 | 0.064 | |||||||
| fbmy8028_rel_231222_870.cza1_bee_cfx | 99.708 | 0.204 | 0.086 | 0.001 | 0.064 |
Delete response time histogram: each cell has the percentage of responses that take <= the time in the header and max is the max response time in seconds. For max values in the top 25% of the range have a red background and in the bottom 25% of the range have a green background. The red background is not used when the min value is within 80% of the max value.
| dbms | 256us | 1ms | 4ms | 16ms | 64ms | 256ms | 1s | 4s | 16s | gt | max |
|---|---|---|---|---|---|---|---|---|---|---|---|
| fbmy5635_rel_202203072101.cza1_bee | 99.493 | 0.499 | 0.008 | 0.063 | |||||||
| fbmy5635_rel_20230529_850.cza1_bee | 99.683 | 0.311 | 0.003 | 0.003 | 0.065 | ||||||
| fbmy8028_rel_20220829_752.cza1_bee | 99.606 | 0.310 | 0.082 | 0.003 | 0.188 | ||||||
| fbmy8028_rel_20230619_831.cza1_bee | 99.574 | 0.350 | 0.075 | 0.001 | 0.064 | ||||||
| fbmy8028_rel_221222.cza1_bee | 99.614 | 0.303 | 0.082 | 0.001 | 0.079 | ||||||
| fbmy8028_rel_231222_870.cza1_bee_cfx | 99.699 | 0.214 | 0.088 | 0.063 |
Performance metrics for the DBMS listed above. Some are normalized by throughput, others are not. Legend for results is here.
ips	qps	rps	rmbps	wps	wmbps	rpq	rkbpq	wpi	wkbpi	csps	cpups	cspq	cpupq	dbgb1	dbgb2	rss	maxop	p50	p99	tag
998	1296	1	0.0	56.8	23.4	0.001	0.039	0.057	24.004	5757	24.4	4.441	1506	2.9	4.6	8.8	0.184	1263	719	fbmy5635_rel_202203072101.cza1_bee
998	1572	0	0.0	14.4	4.8	0.000	0.000	0.014	4.924	6526	15.2	4.152	774	2.1	3.9	9.1	0.042	1503	1151	fbmy5635_rel_20230529_850.cza1_bee
998	1204	1	0.1	56.2	22.9	0.001	0.043	0.056	23.453	5585	24.8	4.638	1648	2.8	4.8	9.6	0.181	1183	911	fbmy8028_rel_20220829_752.cza1_bee
998	1514	0	0.0	14.1	4.7	0.000	0.000	0.014	4.793	6454	15.5	4.262	819	2.2	4.1	9.1	0.031	1470	1039	fbmy8028_rel_20230619_831.cza1_bee
998	1373	0	0.0	14.6	4.8	0.000	0.000	0.015	4.882	5920	15.5	4.313	903	2.1	4.1	9.1	0.038	1327	959	fbmy8028_rel_221222.cza1_bee
998	1322	0	0.0	9.5	2.6	0.000	0.000	0.010	2.682	5683	14.3	4.297	865	2.3	4.3	9.5	0.034	1274	943	fbmy8028_rel_231222_870.cza1_bee_cfx
qp1000.L6
qp1000.L6: point queries with 1000 insert/s per client. Graphs for performance per 1-second interval are here.
Average throughput:
Query response time histogram: each cell has the percentage of responses that take <= the time in the header and max is the max response time in seconds. For max values in the top 25% of the range have a red background and in the bottom 25% of the range have a green background. The red background is not used when the min value is within 80% of the max value.
| dbms | 256us | 1ms | 4ms | 16ms | 64ms | 256ms | 1s | 4s | 16s | gt | max |
|---|---|---|---|---|---|---|---|---|---|---|---|
| fbmy5635_rel_202203072101.cza1_bee | 0.559 | 99.431 | 0.010 | nonzero | 0.005 | ||||||
| fbmy5635_rel_20230529_850.cza1_bee | 6.215 | 93.778 | 0.007 | nonzero | 0.008 | ||||||
| fbmy8028_rel_20220829_752.cza1_bee | nonzero | 99.992 | 0.008 | nonzero | nonzero | 0.029 | |||||
| fbmy8028_rel_20230619_831.cza1_bee | 99.992 | 0.008 | nonzero | 0.011 | |||||||
| fbmy8028_rel_221222.cza1_bee | 99.990 | 0.009 | 0.001 | 0.010 | |||||||
| fbmy8028_rel_231222_870.cza1_bee_cfx | 99.993 | 0.007 | nonzero | 0.006 |
Insert response time histogram: each cell has the percentage of responses that take <= the time in the header and max is the max response time in seconds. For max values in the top 25% of the range have a red background and in the bottom 25% of the range have a green background. The red background is not used when the min value is within 80% of the max value.
| dbms | 256us | 1ms | 4ms | 16ms | 64ms | 256ms | 1s | 4s | 16s | gt | max |
|---|---|---|---|---|---|---|---|---|---|---|---|
| fbmy5635_rel_202203072101.cza1_bee | 99.756 | 0.237 | 0.006 | 0.001 | 0.076 | ||||||
| fbmy5635_rel_20230529_850.cza1_bee | 99.779 | 0.215 | 0.006 | 0.048 | |||||||
| fbmy8028_rel_20220829_752.cza1_bee | 99.635 | 0.278 | 0.088 | 0.049 | |||||||
| fbmy8028_rel_20230619_831.cza1_bee | 99.519 | 0.396 | 0.085 | 0.064 | |||||||
| fbmy8028_rel_221222.cza1_bee | 99.593 | 0.318 | 0.089 | 0.055 | |||||||
| fbmy8028_rel_231222_870.cza1_bee_cfx | 99.685 | 0.231 | 0.085 | 0.049 |
Delete response time histogram: each cell has the percentage of responses that take <= the time in the header and max is the max response time in seconds. For max values in the top 25% of the range have a red background and in the bottom 25% of the range have a green background. The red background is not used when the min value is within 80% of the max value.
| dbms | 256us | 1ms | 4ms | 16ms | 64ms | 256ms | 1s | 4s | 16s | gt | max |
|---|---|---|---|---|---|---|---|---|---|---|---|
| fbmy5635_rel_202203072101.cza1_bee | 99.674 | 0.321 | 0.006 | 0.055 | |||||||
| fbmy5635_rel_20230529_850.cza1_bee | 99.792 | 0.203 | 0.006 | 0.049 | |||||||
| fbmy8028_rel_20220829_752.cza1_bee | 99.722 | 0.193 | 0.085 | 0.062 | |||||||
| fbmy8028_rel_20230619_831.cza1_bee | 99.572 | 0.346 | 0.082 | 0.064 | |||||||
| fbmy8028_rel_221222.cza1_bee | 99.628 | 0.285 | 0.088 | 0.063 | |||||||
| fbmy8028_rel_231222_870.cza1_bee_cfx | 99.682 | 0.233 | 0.085 | 0.064 |
Performance metrics for the DBMS listed above. Some are normalized by throughput, others are not. Legend for results is here.
ips	qps	rps	rmbps	wps	wmbps	rpq	rkbpq	wpi	wkbpi	csps	cpups	cspq	cpupq	dbgb1	dbgb2	rss	maxop	p50	p99	tag
998	2494	0	0.0	59.7	23.3	0.000	0.000	0.060	23.947	10798	25.0	4.330	802	3.8	4.3	9.1	0.005	2430	1949	fbmy5635_rel_202203072101.cza1_bee
998	2635	0	0.0	14.8	4.6	0.000	0.000	0.015	4.749	11116	16.0	4.219	486	2.1	2.7	8.7	0.008	2573	2379	fbmy5635_rel_20230529_850.cza1_bee
998	2368	1	0.1	62.0	24.0	0.000	0.039	0.062	24.655	10458	25.9	4.416	875	2.9	3.7	9.6	0.029	2382	1774	fbmy8028_rel_20220829_752.cza1_bee
998	2358	0	0.0	14.3	4.6	0.000	0.000	0.014	4.669	10144	16.5	4.301	560	2.2	2.9	9.1	0.011	2348	1999	fbmy8028_rel_20230619_831.cza1_bee
998	2392	0	0.0	14.0	4.5	0.000	0.001	0.014	4.611	10277	16.4	4.296	548	2.2	2.9	9.1	0.010	2365	1966	fbmy8028_rel_221222.cza1_bee
998	2408	0	0.0	10.2	2.9	0.000	0.000	0.010	2.938	10317	15.5	4.285	515	2.3	2.6	9.2	0.006	2381	1982	fbmy8028_rel_231222_870.cza1_bee_cfx
l.i0
l.i0: load without secondary indexes
Performance metrics for all DBMS, not just the ones listed above. Some are normalized by throughput, others are not. Legend for results is here.
ips	qps	rps	rmbps	wps	wmbps	rpq	rkbpq	wpi	wkbpi	csps	cpups	cspq	cpupq	dbgb1	dbgb2	rss	maxop	p50	p99	tag
79787	0	0	0.0	38.0	13.8	0.000	0.000	0.000	0.177	7814	22.4	0.098	22	1.0	2.5	0.3	0.119	80411	71252	fbmy5635_rel_202203072101.cza1_bee
78125	0	0	0.0	36.0	13.1	0.000	0.000	0.000	0.172	7660	23.0	0.098	24	1.0	2.5	0.3	0.084	78715	71659	fbmy5635_rel_20230529_850.cza1_bee
58366	0	0	0.0	36.9	11.9	0.000	0.000	0.001	0.209	6102	22.4	0.105	31	0.9	2.7	0.6	0.099	58586	51243	fbmy8028_rel_20220829_752.cza1_bee
58594	0	0	0.0	37.3	12.0	0.000	0.000	0.001	0.211	6122	22.5	0.104	31	0.9	2.7	0.6	0.076	58714	53133	fbmy8028_rel_20230619_831.cza1_bee
57692	0	0	0.0	36.5	11.8	0.000	0.000	0.001	0.210	6057	22.2	0.105	31	0.9	2.7	0.6	0.080	57837	52141	fbmy8028_rel_221222.cza1_bee
58480	0	0	0.0	36.7	12.0	0.000	0.000	0.001	0.211	6137	22.5	0.105	31	0.9	2.7	0.6	0.080	58735	52341	fbmy8028_rel_231222_870.cza1_bee_cfx
l.x
l.x: create secondary indexes
Performance metrics for all DBMS, not just the ones listed above. Some are normalized by throughput, others are not. Legend for results is here.
ips	qps	rps	rmbps	wps	wmbps	rpq	rkbpq	wpi	wkbpi	csps	cpups	cspq	cpupq	dbgb1	dbgb2	rss	maxop	p50	p99	tag
89021	0	0	0.0	36.8	14.6	0.000	0.000	0.000	0.167	213	11.6	0.002	10	2.0	3.6	2.3	0.002	NA	NA	fbmy5635_rel_202203072101.cza1_bee
87720	0	0	0.0	36.1	14.3	0.000	0.000	0.000	0.167	203	11.7	0.002	11	2.0	3.6	2.4	0.002	NA	NA	fbmy5635_rel_20230529_850.cza1_bee
78534	0	0	0.0	31.4	12.1	0.000	0.000	0.000	0.158	392	11.6	0.005	12	2.0	3.8	2.7	0.003	NA	NA	fbmy8028_rel_20220829_752.cza1_bee
78948	0	0	0.0	31.5	12.2	0.000	0.000	0.000	0.158	380	11.6	0.005	12	2.0	3.8	2.7	0.003	NA	NA	fbmy8028_rel_20230619_831.cza1_bee
78125	0	0	0.0	31.3	12.1	0.000	0.000	0.000	0.158	363	11.6	0.005	12	2.0	3.8	2.7	0.003	NA	NA	fbmy8028_rel_221222.cza1_bee
77720	0	0	0.0	31.2	12.0	0.000	0.000	0.000	0.158	368	11.6	0.005	12	2.0	3.8	2.7	0.003	NA	NA	fbmy8028_rel_231222_870.cza1_bee_cfx
l.i1
l.i1: continue load after secondary indexes created with 50 inserts per transaction
Performance metrics for all DBMS, not just the ones listed above. Some are normalized by throughput, others are not. Legend for results is here.
ips	qps	rps	rmbps	wps	wmbps	rpq	rkbpq	wpi	wkbpi	csps	cpups	cspq	cpupq	dbgb1	dbgb2	rss	maxop	p50	p99	tag
26604	0	18	0.4	124.4	48.7	0.001	0.017	0.005	1.873	11355	48.3	0.427	145	2.9	4.4	8.4	0.087	26621	23424	fbmy5635_rel_202203072101.cza1_bee
26765	0	46	0.6	120.8	47.4	0.002	0.025	0.005	1.814	11379	48.3	0.425	144	2.4	3.9	8.3	0.103	26732	23923	fbmy5635_rel_20230529_850.cza1_bee
22466	0	10	0.6	117.3	44.7	0.000	0.026	0.005	2.036	9911	46.4	0.441	165	2.6	4.3	8.8	0.102	22474	19846	fbmy8028_rel_20220829_752.cza1_bee
22253	0	34	0.6	101.8	38.2	0.002	0.028	0.005	1.757	9761	43.2	0.439	155	3.2	4.9	8.6	0.107	22178	19779	fbmy8028_rel_20230619_831.cza1_bee
22676	0	104	0.5	107.5	40.4	0.005	0.025	0.005	1.826	10082	45.9	0.445	162	2.7	4.4	8.6	0.104	22635	20120	fbmy8028_rel_221222.cza1_bee
26429	0	151	0.8	143.5	54.7	0.006	0.032	0.005	2.119	12039	49.2	0.456	149	2.7	3.6	8.6	0.083	26371	23425	fbmy8028_rel_231222_870.cza1_bee_cfx
l.i2
l.i2: continue load after secondary indexes created with 5 inserts per transaction
Performance metrics for all DBMS, not just the ones listed above. Some are normalized by throughput, others are not. Legend for results is here.
ips	qps	rps	rmbps	wps	wmbps	rpq	rkbpq	wpi	wkbpi	csps	cpups	cspq	cpupq	dbgb1	dbgb2	rss	maxop	p50	p99	tag
9569	0	4	0.2	95.8	35.8	0.000	0.020	0.010	3.831	39463	42.8	4.124	358	2.3	2.3	8.4	0.078	9460	7801	fbmy5635_rel_202203072101.cza1_bee
9403	0	6	0.2	107.7	39.1	0.001	0.023	0.011	4.263	38774	44.8	4.124	381	2.2	2.2	8.4	0.078	9329	7861	fbmy5635_rel_20230529_850.cza1_bee
7701	0	2	0.2	86.3	31.9	0.000	0.024	0.011	4.241	32504	41.8	4.221	434	2.5	2.7	8.8	0.076	7647	6498	fbmy8028_rel_20220829_752.cza1_bee
7930	0	11	0.3	85.5	29.5	0.001	0.034	0.011	3.812	33280	40.9	4.197	413	2.2	2.5	8.8	0.083	7849	6867	fbmy8028_rel_20230619_831.cza1_bee
7800	0	40	0.2	95.9	34.9	0.005	0.030	0.012	4.580	32715	43.2	4.194	443	2.2	2.4	8.7	0.080	7783	6867	fbmy8028_rel_221222.cza1_bee
8180	0	41	0.2	67.6	23.6	0.005	0.029	0.008	2.951	34193	36.9	4.180	361	2.3	2.8	8.6	0.079	8081	7132	fbmy8028_rel_231222_870.cza1_bee_cfx
qr100.L1
qr100.L1: range queries with 100 insert/s per client
Performance metrics for all DBMS, not just the ones listed above. Some are normalized by throughput, others are not. Legend for results is here.
ips	qps	rps	rmbps	wps	wmbps	rpq	rkbpq	wpi	wkbpi	csps	cpups	cspq	cpupq	dbgb1	dbgb2	rss	maxop	p50	p99	tag
100	1621	0	0.0	7.8	1.9	0.000	0.000	0.078	19.873	6362	12.6	3.925	622	2.0	2.1	8.5	0.176	1615	1455	fbmy5635_rel_202203072101.cza1_bee
100	1430	0	0.0	4.1	0.4	0.000	0.000	0.041	3.637	5620	11.9	3.930	666	2.2	2.2	8.4	0.027	1423	1294	fbmy5635_rel_20230529_850.cza1_bee
100	1185	0	0.0	8.6	2.1	0.000	0.000	0.086	21.935	4850	13.4	4.091	904	2.0	2.3	8.9	0.186	1183	1071	fbmy8028_rel_20220829_752.cza1_bee
100	1523	0	0.0	4.4	0.4	0.000	0.000	0.044	4.422	6105	12.5	4.010	657	2.1	2.4	8.8	0.032	1726	1039	fbmy8028_rel_20230619_831.cza1_bee
100	1717	0	0.0	4.3	0.4	0.000	0.000	0.043	4.049	6843	12.5	3.985	582	2.2	2.4	8.7	0.030	1710	1483	fbmy8028_rel_221222.cza1_bee
100	1114	0	0.0	3.6	0.2	0.000	0.000	0.036	1.835	4550	12.4	4.083	890	2.2	2.5	8.7	0.008	1103	959	fbmy8028_rel_231222_870.cza1_bee_cfx
qp100.L2
qp100.L2: point queries with 100 insert/s per client
Performance metrics for all DBMS, not just the ones listed above. Some are normalized by throughput, others are not. Legend for results is here.
ips	qps	rps	rmbps	wps	wmbps	rpq	rkbpq	wpi	wkbpi	csps	cpups	cspq	cpupq	dbgb1	dbgb2	rss	maxop	p50	p99	tag
100	2558	0	0.0	8.9	2.4	0.000	0.000	0.090	24.898	10477	14.3	4.097	447	2.0	2.2	9.2	0.024	2541	2142	fbmy5635_rel_202203072101.cza1_bee
100	2592	12	0.1	4.6	0.6	0.004	0.028	0.046	5.951	10628	13.6	4.100	420	2.1	2.3	8.9	0.010	2573	2381	fbmy5635_rel_20230529_850.cza1_bee
100	2454	0	0.0	9.2	2.5	0.000	0.000	0.093	25.640	10223	14.5	4.165	473	2.1	2.4	10.0	0.005	2414	1950	fbmy8028_rel_20220829_752.cza1_bee
100	2467	14	0.1	4.4	0.5	0.006	0.037	0.044	5.208	10257	13.5	4.158	438	2.1	2.5	9.4	0.010	2429	2046	fbmy8028_rel_20230619_831.cza1_bee
100	2444	14	0.1	4.6	0.5	0.006	0.037	0.046	5.291	10170	13.6	4.162	445	2.2	2.5	9.4	0.010	2413	1998	fbmy8028_rel_221222.cza1_bee
100	2448	16	0.1	3.7	0.2	0.007	0.042	0.038	2.420	10194	13.4	4.165	438	2.3	2.6	9.3	0.010	2413	1996	fbmy8028_rel_231222_870.cza1_bee_cfx
qr500.L3
qr500.L3: range queries with 500 insert/s per client
Performance metrics for all DBMS, not just the ones listed above. Some are normalized by throughput, others are not. Legend for results is here.
ips	qps	rps	rmbps	wps	wmbps	rpq	rkbpq	wpi	wkbpi	csps	cpups	cspq	cpupq	dbgb1	dbgb2	rss	maxop	p50	p99	tag
499	1095	0	0.0	30.5	11.5	0.000	0.000	0.061	23.603	4620	17.8	4.221	1301	2.1	2.7	8.9	0.176	1086	862	fbmy5635_rel_202203072101.cza1_bee
499	1448	0	0.0	8.5	2.3	0.000	0.000	0.017	4.691	5828	13.5	4.024	746	2.1	2.7	8.5	0.035	1408	1039	fbmy5635_rel_20230529_850.cza1_bee
499	1083	0	0.0	30.7	11.6	0.000	0.000	0.062	23.693	4732	18.2	4.368	1344	2.1	2.8	9.9	0.175	1055	879	fbmy8028_rel_20220829_752.cza1_bee
499	1379	0	0.0	8.6	2.3	0.000	0.000	0.017	4.723	5692	13.5	4.127	783	2.1	2.8	9.1	0.031	1375	1007	fbmy8028_rel_20230619_831.cza1_bee
499	1360	0	0.0	8.8	2.3	0.000	0.000	0.018	4.678	5624	13.5	4.135	794	2.1	2.9	9.3	0.038	1342	1071	fbmy8028_rel_221222.cza1_bee
499	1452	0	0.0	6.5	1.3	0.000	0.000	0.013	2.715	5976	13.1	4.115	722	2.3	3.0	9.2	0.036	1392	911	fbmy8028_rel_231222_870.cza1_bee_cfx
qp500.L4
qp500.L4: point queries with 500 insert/s per client
Performance metrics for all DBMS, not just the ones listed above. Some are normalized by throughput, others are not. Legend for results is here.
ips	qps	rps	rmbps	wps	wmbps	rpq	rkbpq	wpi	wkbpi	csps	cpups	cspq	cpupq	dbgb1	dbgb2	rss	maxop	p50	p99	tag
499	2557	0	0.0	31.1	12.0	0.000	0.000	0.062	24.599	10699	18.7	4.185	585	2.1	3.1	9.1	0.005	2508	2061	fbmy5635_rel_202203072101.cza1_bee
499	2588	0	0.0	8.6	2.2	0.000	0.000	0.017	4.557	10709	14.4	4.138	445	2.1	3.1	9.1	0.004	2556	2365	fbmy5635_rel_20230529_850.cza1_bee
499	2425	0	0.0	30.8	11.8	0.000	0.013	0.062	24.220	10327	19.2	4.258	633	2.0	3.1	9.6	0.005	2429	1836	fbmy8028_rel_20220829_752.cza1_bee
499	2385	0	0.0	8.8	2.2	0.000	0.000	0.018	4.528	10035	14.7	4.207	493	2.1	3.3	9.2	0.008	2364	2013	fbmy8028_rel_20230619_831.cza1_bee
499	2423	0	0.0	9.1	2.3	0.000	0.000	0.018	4.716	10173	14.6	4.199	482	2.1	3.3	9.4	0.004	2383	1998	fbmy8028_rel_221222.cza1_bee
499	2414	0	0.0	6.9	1.5	0.000	0.000	0.014	3.096	10154	14.4	4.206	477	2.2	3.4	9.4	0.006	2397	2013	fbmy8028_rel_231222_870.cza1_bee_cfx
qr1000.L5
qr1000.L5: range queries with 1000 insert/s per client
Performance metrics for all DBMS, not just the ones listed above. Some are normalized by throughput, others are not. Legend for results is here.
ips	qps	rps	rmbps	wps	wmbps	rpq	rkbpq	wpi	wkbpi	csps	cpups	cspq	cpupq	dbgb1	dbgb2	rss	maxop	p50	p99	tag
998	1296	1	0.0	56.8	23.4	0.001	0.039	0.057	24.004	5757	24.4	4.441	1506	2.9	4.6	8.8	0.184	1263	719	fbmy5635_rel_202203072101.cza1_bee
998	1572	0	0.0	14.4	4.8	0.000	0.000	0.014	4.924	6526	15.2	4.152	774	2.1	3.9	9.1	0.042	1503	1151	fbmy5635_rel_20230529_850.cza1_bee
998	1204	1	0.1	56.2	22.9	0.001	0.043	0.056	23.453	5585	24.8	4.638	1648	2.8	4.8	9.6	0.181	1183	911	fbmy8028_rel_20220829_752.cza1_bee
998	1514	0	0.0	14.1	4.7	0.000	0.000	0.014	4.793	6454	15.5	4.262	819	2.2	4.1	9.1	0.031	1470	1039	fbmy8028_rel_20230619_831.cza1_bee
998	1373	0	0.0	14.6	4.8	0.000	0.000	0.015	4.882	5920	15.5	4.313	903	2.1	4.1	9.1	0.038	1327	959	fbmy8028_rel_221222.cza1_bee
998	1322	0	0.0	9.5	2.6	0.000	0.000	0.010	2.682	5683	14.3	4.297	865	2.3	4.3	9.5	0.034	1274	943	fbmy8028_rel_231222_870.cza1_bee_cfx
qp1000.L6
qp1000.L6: point queries with 1000 insert/s per client
Performance metrics for all DBMS, not just the ones listed above. Some are normalized by throughput, others are not. Legend for results is here.
ips	qps	rps	rmbps	wps	wmbps	rpq	rkbpq	wpi	wkbpi	csps	cpups	cspq	cpupq	dbgb1	dbgb2	rss	maxop	p50	p99	tag
998	2494	0	0.0	59.7	23.3	0.000	0.000	0.060	23.947	10798	25.0	4.330	802	3.8	4.3	9.1	0.005	2430	1949	fbmy5635_rel_202203072101.cza1_bee
998	2635	0	0.0	14.8	4.6	0.000	0.000	0.015	4.749	11116	16.0	4.219	486	2.1	2.7	8.7	0.008	2573	2379	fbmy5635_rel_20230529_850.cza1_bee
998	2368	1	0.1	62.0	24.0	0.000	0.039	0.062	24.655	10458	25.9	4.416	875	2.9	3.7	9.6	0.029	2382	1774	fbmy8028_rel_20220829_752.cza1_bee
998	2358	0	0.0	14.3	4.6	0.000	0.000	0.014	4.669	10144	16.5	4.301	560	2.2	2.9	9.1	0.011	2348	1999	fbmy8028_rel_20230619_831.cza1_bee
998	2392	0	0.0	14.0	4.5	0.000	0.001	0.014	4.611	10277	16.4	4.296	548	2.2	2.9	9.1	0.010	2365	1966	fbmy8028_rel_221222.cza1_bee
998	2408	0	0.0	10.2	2.9	0.000	0.000	0.010	2.938	10317	15.5	4.285	515	2.3	2.6	9.2	0.006	2381	1982	fbmy8028_rel_231222_870.cza1_bee_cfx
l.i0
- l.i0: load without secondary indexes
- Legend for results is here.
- Each entry lists the percentage of responses that fit in that bucket (slower than max time for previous bucket, faster than min time for next bucket).
Insert response time histogram
256us	1ms	4ms	16ms	64ms	256ms	1s	4s	16s	gt	max	tag
0.000	0.000	99.872	0.124	0.001	0.003	0.000	0.000	0.000	0.000	0.119	fbmy5635_rel_202203072101.cza1_bee
0.000	0.000	99.868	0.127	0.003	0.001	0.000	0.000	0.000	0.000	0.084	fbmy5635_rel_20230529_850.cza1_bee
0.000	0.000	99.725	0.201	0.071	0.003	0.000	0.000	0.000	0.000	0.099	fbmy8028_rel_20220829_752.cza1_bee
0.000	0.000	99.725	0.198	0.074	0.003	0.000	0.000	0.000	0.000	0.076	fbmy8028_rel_20230619_831.cza1_bee
0.000	0.000	99.724	0.196	0.078	0.002	0.000	0.000	0.000	0.000	0.080	fbmy8028_rel_221222.cza1_bee
0.000	0.000	99.725	0.199	0.072	0.003	0.000	0.000	0.000	0.000	0.080	fbmy8028_rel_231222_870.cza1_bee_cfx
l.x
- l.x: create secondary indexes
- Legend for results is here.
- Each entry lists the percentage of responses that fit in that bucket (slower than max time for previous bucket, faster than min time for next bucket).
TODO - determine whether there is data for create index response time
l.i1
- l.i1: continue load after secondary indexes created with 50 inserts per transaction
- Legend for results is here.
- Each entry lists the percentage of responses that fit in that bucket (slower than max time for previous bucket, faster than min time for next bucket).
Insert response time histogram
256us	1ms	4ms	16ms	64ms	256ms	1s	4s	16s	gt	max	tag
0.000	0.000	99.806	0.189	0.003	0.003	0.000	0.000	0.000	0.000	0.087	fbmy5635_rel_202203072101.cza1_bee
0.000	0.000	99.804	0.190	0.003	0.002	0.000	0.000	0.000	0.000	0.103	fbmy5635_rel_20230529_850.cza1_bee
0.000	0.000	99.667	0.260	0.069	0.004	0.000	0.000	0.000	0.000	0.102	fbmy8028_rel_20220829_752.cza1_bee
0.000	0.000	99.664	0.276	0.057	0.003	0.000	0.000	0.000	0.000	0.107	fbmy8028_rel_20230619_831.cza1_bee
0.000	0.000	99.669	0.273	0.056	0.003	0.000	0.000	0.000	0.000	0.104	fbmy8028_rel_221222.cza1_bee
0.000	0.000	99.698	0.243	0.057	0.003	0.000	0.000	0.000	0.000	0.083	fbmy8028_rel_231222_870.cza1_bee_cfx
Delete response time histogram
256us	1ms	4ms	16ms	64ms	256ms	1s	4s	16s	gt	max	tag
0.000	0.000	99.800	0.190	0.007	0.003	0.000	0.000	0.000	0.000	0.116	fbmy5635_rel_202203072101.cza1_bee
0.000	0.000	99.795	0.194	0.009	0.002	0.000	0.000	0.000	0.000	0.103	fbmy5635_rel_20230529_850.cza1_bee
0.000	0.000	99.659	0.261	0.076	0.004	0.000	0.000	0.000	0.000	0.113	fbmy8028_rel_20220829_752.cza1_bee
0.000	0.000	99.659	0.277	0.060	0.004	0.000	0.000	0.000	0.000	0.104	fbmy8028_rel_20230619_831.cza1_bee
0.000	0.000	99.658	0.276	0.062	0.003	0.000	0.000	0.000	0.000	0.111	fbmy8028_rel_221222.cza1_bee
0.000	0.000	99.686	0.251	0.060	0.003	0.000	0.000	0.000	0.000	0.111	fbmy8028_rel_231222_870.cza1_bee_cfx
l.i2
- l.i2: continue load after secondary indexes created with 5 inserts per transaction
- Legend for results is here.
- Each entry lists the percentage of responses that fit in that bucket (slower than max time for previous bucket, faster than min time for next bucket).
Insert response time histogram
256us	1ms	4ms	16ms	64ms	256ms	1s	4s	16s	gt	max	tag
0.024	99.910	0.013	0.052	0.001	nonzero	0.000	0.000	0.000	0.000	0.078	fbmy5635_rel_202203072101.cza1_bee
0.011	99.919	0.016	0.053	0.001	nonzero	0.000	0.000	0.000	0.000	0.078	fbmy5635_rel_20230529_850.cza1_bee
0.000	99.834	0.080	0.080	0.005	nonzero	0.000	0.000	0.000	0.000	0.076	fbmy8028_rel_20220829_752.cza1_bee
0.000	99.847	0.070	0.079	0.004	nonzero	0.000	0.000	0.000	0.000	0.083	fbmy8028_rel_20230619_831.cza1_bee
0.000	99.811	0.104	0.081	0.004	nonzero	0.000	0.000	0.000	0.000	0.080	fbmy8028_rel_221222.cza1_bee
0.000	99.893	0.024	0.078	0.004	nonzero	0.000	0.000	0.000	0.000	0.079	fbmy8028_rel_231222_870.cza1_bee_cfx
Delete response time histogram
256us	1ms	4ms	16ms	64ms	256ms	1s	4s	16s	gt	max	tag
0.000	99.926	0.020	0.052	0.001	nonzero	0.000	0.000	0.000	0.000	0.078	fbmy5635_rel_202203072101.cza1_bee
0.000	99.926	0.018	0.054	0.001	nonzero	0.000	0.000	0.000	0.000	0.078	fbmy5635_rel_20230529_850.cza1_bee
0.000	99.744	0.169	0.081	0.005	nonzero	0.000	0.000	0.000	0.000	0.081	fbmy8028_rel_20220829_752.cza1_bee
0.000	99.803	0.112	0.081	0.004	nonzero	0.000	0.000	0.000	0.000	0.091	fbmy8028_rel_20230619_831.cza1_bee
0.000	99.770	0.143	0.082	0.005	0.001	0.000	0.000	0.000	0.000	0.103	fbmy8028_rel_221222.cza1_bee
0.000	99.872	0.044	0.079	0.005	nonzero	0.000	0.000	0.000	0.000	0.077	fbmy8028_rel_231222_870.cza1_bee_cfx
qr100.L1
- qr100.L1: range queries with 100 insert/s per client
- Legend for results is here.
- Each entry lists the percentage of responses that fit in that bucket (slower than max time for previous bucket, faster than min time for next bucket).
Query response time histogram
256us	1ms	4ms	16ms	64ms	256ms	1s	4s	16s	gt	max	tag
15.639	64.892	19.469	0.001	0.000	nonzero	0.000	0.000	0.000	0.000	0.176	fbmy5635_rel_202203072101.cza1_bee
12.657	54.385	32.957	nonzero	nonzero	0.000	0.000	0.000	0.000	0.000	0.027	fbmy5635_rel_20230529_850.cza1_bee
6.275	60.515	30.477	2.733	nonzero	nonzero	0.000	0.000	0.000	0.000	0.186	fbmy8028_rel_20220829_752.cza1_bee
7.556	71.246	21.197	0.001	nonzero	0.000	0.000	0.000	0.000	0.000	0.032	fbmy8028_rel_20230619_831.cza1_bee
5.829	81.660	12.511	nonzero	nonzero	0.000	0.000	0.000	0.000	0.000	0.030	fbmy8028_rel_221222.cza1_bee
2.991	65.656	31.222	0.132	0.000	0.000	0.000	0.000	0.000	0.000	0.008	fbmy8028_rel_231222_870.cza1_bee_cfx
Insert response time histogram
256us	1ms	4ms	16ms	64ms	256ms	1s	4s	16s	gt	max	tag
0.000	0.000	99.194	0.778	0.028	0.000	0.000	0.000	0.000	0.000	0.017	fbmy5635_rel_202203072101.cza1_bee
0.000	0.000	99.597	0.403	0.000	0.000	0.000	0.000	0.000	0.000	0.014	fbmy5635_rel_20230529_850.cza1_bee
0.000	0.000	99.250	0.694	0.056	0.000	0.000	0.000	0.000	0.000	0.019	fbmy8028_rel_20220829_752.cza1_bee
0.000	0.000	99.083	0.861	0.056	0.000	0.000	0.000	0.000	0.000	0.023	fbmy8028_rel_20230619_831.cza1_bee
0.000	0.000	99.403	0.542	0.056	0.000	0.000	0.000	0.000	0.000	0.018	fbmy8028_rel_221222.cza1_bee
0.000	0.000	99.542	0.417	0.042	0.000	0.000	0.000	0.000	0.000	0.018	fbmy8028_rel_231222_870.cza1_bee_cfx
Delete response time histogram
256us	1ms	4ms	16ms	64ms	256ms	1s	4s	16s	gt	max	tag
0.000	0.000	99.236	0.750	0.014	0.000	0.000	0.000	0.000	0.000	0.018	fbmy5635_rel_202203072101.cza1_bee
0.000	0.000	99.653	0.347	0.000	0.000	0.000	0.000	0.000	0.000	0.015	fbmy5635_rel_20230529_850.cza1_bee
0.000	0.000	99.375	0.583	0.042	0.000	0.000	0.000	0.000	0.000	0.018	fbmy8028_rel_20220829_752.cza1_bee
0.000	0.000	99.236	0.722	0.042	0.000	0.000	0.000	0.000	0.000	0.023	fbmy8028_rel_20230619_831.cza1_bee
0.000	0.000	99.472	0.500	0.028	0.000	0.000	0.000	0.000	0.000	0.018	fbmy8028_rel_221222.cza1_bee
0.000	0.000	99.458	0.500	0.042	0.000	0.000	0.000	0.000	0.000	0.018	fbmy8028_rel_231222_870.cza1_bee_cfx
qp100.L2
- qp100.L2: point queries with 100 insert/s per client
- Legend for results is here.
- Each entry lists the percentage of responses that fit in that bucket (slower than max time for previous bucket, faster than min time for next bucket).
Query response time histogram
256us	1ms	4ms	16ms	64ms	256ms	1s	4s	16s	gt	max	tag
2.915	97.082	0.003	nonzero	nonzero	0.000	0.000	0.000	0.000	0.000	0.024	fbmy5635_rel_202203072101.cza1_bee
2.468	97.530	0.002	0.001	0.000	0.000	0.000	0.000	0.000	0.000	0.010	fbmy5635_rel_20230529_850.cza1_bee
nonzero	99.993	0.006	nonzero	0.000	0.000	0.000	0.000	0.000	0.000	0.005	fbmy8028_rel_20220829_752.cza1_bee
nonzero	99.994	0.005	0.001	0.000	0.000	0.000	0.000	0.000	0.000	0.010	fbmy8028_rel_20230619_831.cza1_bee
nonzero	99.992	0.007	0.001	0.000	0.000	0.000	0.000	0.000	0.000	0.010	fbmy8028_rel_221222.cza1_bee
nonzero	99.990	0.009	0.001	0.000	0.000	0.000	0.000	0.000	0.000	0.010	fbmy8028_rel_231222_870.cza1_bee_cfx
Insert response time histogram
256us	1ms	4ms	16ms	64ms	256ms	1s	4s	16s	gt	max	tag
0.000	0.000	99.431	0.556	0.014	0.000	0.000	0.000	0.000	0.000	0.016	fbmy5635_rel_202203072101.cza1_bee
0.000	0.000	99.375	0.597	0.028	0.000	0.000	0.000	0.000	0.000	0.019	fbmy5635_rel_20230529_850.cza1_bee
0.000	0.000	99.278	0.653	0.069	0.000	0.000	0.000	0.000	0.000	0.018	fbmy8028_rel_20220829_752.cza1_bee
0.000	0.000	99.250	0.681	0.069	0.000	0.000	0.000	0.000	0.000	0.018	fbmy8028_rel_20230619_831.cza1_bee
0.000	0.000	99.306	0.625	0.069	0.000	0.000	0.000	0.000	0.000	0.018	fbmy8028_rel_221222.cza1_bee
0.000	0.000	99.667	0.264	0.069	0.000	0.000	0.000	0.000	0.000	0.023	fbmy8028_rel_231222_870.cza1_bee_cfx
Delete response time histogram
256us	1ms	4ms	16ms	64ms	256ms	1s	4s	16s	gt	max	tag
0.000	0.000	99.361	0.625	0.000	0.014	0.000	0.000	0.000	0.000	0.199	fbmy5635_rel_202203072101.cza1_bee
0.000	0.000	99.444	0.556	0.000	0.000	0.000	0.000	0.000	0.000	0.014	fbmy5635_rel_20230529_850.cza1_bee
0.000	0.000	99.458	0.514	0.028	0.000	0.000	0.000	0.000	0.000	0.018	fbmy8028_rel_20220829_752.cza1_bee
0.000	0.000	99.403	0.542	0.056	0.000	0.000	0.000	0.000	0.000	0.018	fbmy8028_rel_20230619_831.cza1_bee
0.000	0.000	99.542	0.403	0.056	0.000	0.000	0.000	0.000	0.000	0.018	fbmy8028_rel_221222.cza1_bee
0.000	0.000	99.625	0.306	0.069	0.000	0.000	0.000	0.000	0.000	0.023	fbmy8028_rel_231222_870.cza1_bee_cfx
qr500.L3
- qr500.L3: range queries with 500 insert/s per client
- Legend for results is here.
- Each entry lists the percentage of responses that fit in that bucket (slower than max time for previous bucket, faster than min time for next bucket).
Query response time histogram
256us	1ms	4ms	16ms	64ms	256ms	1s	4s	16s	gt	max	tag
11.225	57.609	31.077	0.088	nonzero	nonzero	0.000	0.000	0.000	0.000	0.176	fbmy5635_rel_202203072101.cza1_bee
13.359	67.455	19.185	0.001	nonzero	0.000	0.000	0.000	0.000	0.000	0.035	fbmy5635_rel_20230529_850.cza1_bee
5.394	69.776	23.022	1.808	nonzero	nonzero	0.000	0.000	0.000	0.000	0.175	fbmy8028_rel_20220829_752.cza1_bee
5.813	74.062	20.079	0.046	nonzero	0.000	0.000	0.000	0.000	0.000	0.031	fbmy8028_rel_20230619_831.cza1_bee
4.447	72.276	23.277	nonzero	nonzero	0.000	0.000	0.000	0.000	0.000	0.038	fbmy8028_rel_221222.cza1_bee
2.897	76.590	20.169	0.344	nonzero	0.000	0.000	0.000	0.000	0.000	0.036	fbmy8028_rel_231222_870.cza1_bee_cfx
Insert response time histogram
256us	1ms	4ms	16ms	64ms	256ms	1s	4s	16s	gt	max	tag
0.000	0.000	99.739	0.258	0.003	0.000	0.000	0.000	0.000	0.000	0.049	fbmy5635_rel_202203072101.cza1_bee
0.000	0.000	99.733	0.261	0.006	0.000	0.000	0.000	0.000	0.000	0.061	fbmy5635_rel_20230529_850.cza1_bee
0.000	0.000	99.525	0.386	0.089	0.000	0.000	0.000	0.000	0.000	0.047	fbmy8028_rel_20220829_752.cza1_bee
0.000	0.000	99.567	0.347	0.086	0.000	0.000	0.000	0.000	0.000	0.063	fbmy8028_rel_20230619_831.cza1_bee
0.000	0.000	99.500	0.411	0.086	0.003	0.000	0.000	0.000	0.000	0.064	fbmy8028_rel_221222.cza1_bee
0.000	0.000	99.611	0.311	0.078	0.000	0.000	0.000	0.000	0.000	0.047	fbmy8028_rel_231222_870.cza1_bee_cfx
Delete response time histogram
256us	1ms	4ms	16ms	64ms	256ms	1s	4s	16s	gt	max	tag
0.000	0.000	99.772	0.222	0.006	0.000	0.000	0.000	0.000	0.000	0.048	fbmy5635_rel_202203072101.cza1_bee
0.000	0.000	99.694	0.300	0.006	0.000	0.000	0.000	0.000	0.000	0.062	fbmy5635_rel_20230529_850.cza1_bee
0.000	0.000	99.544	0.369	0.086	0.000	0.000	0.000	0.000	0.000	0.061	fbmy8028_rel_20220829_752.cza1_bee
0.000	0.000	99.592	0.331	0.078	0.000	0.000	0.000	0.000	0.000	0.049	fbmy8028_rel_20230619_831.cza1_bee
0.000	0.000	99.528	0.392	0.081	0.000	0.000	0.000	0.000	0.000	0.051	fbmy8028_rel_221222.cza1_bee
0.000	0.000	99.597	0.319	0.083	0.000	0.000	0.000	0.000	0.000	0.062	fbmy8028_rel_231222_870.cza1_bee_cfx
qp500.L4
- qp500.L4: point queries with 500 insert/s per client
- Legend for results is here.
- Each entry lists the percentage of responses that fit in that bucket (slower than max time for previous bucket, faster than min time for next bucket).
Query response time histogram
256us	1ms	4ms	16ms	64ms	256ms	1s	4s	16s	gt	max	tag
2.534	97.458	0.008	nonzero	0.000	0.000	0.000	0.000	0.000	0.000	0.005	fbmy5635_rel_202203072101.cza1_bee
3.502	96.495	0.004	nonzero	0.000	0.000	0.000	0.000	0.000	0.000	0.004	fbmy5635_rel_20230529_850.cza1_bee
0.000	99.992	0.008	nonzero	0.000	0.000	0.000	0.000	0.000	0.000	0.005	fbmy8028_rel_20220829_752.cza1_bee
nonzero	99.993	0.007	nonzero	0.000	0.000	0.000	0.000	0.000	0.000	0.008	fbmy8028_rel_20230619_831.cza1_bee
nonzero	99.994	0.006	nonzero	0.000	0.000	0.000	0.000	0.000	0.000	0.004	fbmy8028_rel_221222.cza1_bee
0.001	99.993	0.006	nonzero	0.000	0.000	0.000	0.000	0.000	0.000	0.006	fbmy8028_rel_231222_870.cza1_bee_cfx
Insert response time histogram
256us	1ms	4ms	16ms	64ms	256ms	1s	4s	16s	gt	max	tag
0.000	0.000	99.667	0.325	0.008	0.000	0.000	0.000	0.000	0.000	0.054	fbmy5635_rel_202203072101.cza1_bee
0.000	0.000	99.744	0.253	0.000	0.003	0.000	0.000	0.000	0.000	0.066	fbmy5635_rel_20230529_850.cza1_bee
0.000	0.000	99.397	0.525	0.078	0.000	0.000	0.000	0.000	0.000	0.038	fbmy8028_rel_20220829_752.cza1_bee
0.000	0.000	99.367	0.558	0.075	0.000	0.000	0.000	0.000	0.000	0.041	fbmy8028_rel_20230619_831.cza1_bee
0.000	0.000	99.481	0.431	0.089	0.000	0.000	0.000	0.000	0.000	0.044	fbmy8028_rel_221222.cza1_bee
0.000	0.000	99.558	0.367	0.072	0.003	0.000	0.000	0.000	0.000	0.064	fbmy8028_rel_231222_870.cza1_bee_cfx
Delete response time histogram
256us	1ms	4ms	16ms	64ms	256ms	1s	4s	16s	gt	max	tag
0.000	0.000	99.689	0.300	0.008	0.003	0.000	0.000	0.000	0.000	0.192	fbmy5635_rel_202203072101.cza1_bee
0.000	0.000	99.764	0.233	0.000	0.003	0.000	0.000	0.000	0.000	0.065	fbmy5635_rel_20230529_850.cza1_bee
0.000	0.000	99.372	0.550	0.075	0.003	0.000	0.000	0.000	0.000	0.190	fbmy8028_rel_20220829_752.cza1_bee
0.000	0.000	99.428	0.508	0.064	0.000	0.000	0.000	0.000	0.000	0.055	fbmy8028_rel_20230619_831.cza1_bee
0.000	0.000	99.567	0.364	0.069	0.000	0.000	0.000	0.000	0.000	0.052	fbmy8028_rel_221222.cza1_bee
0.000	0.000	99.533	0.389	0.078	0.000	0.000	0.000	0.000	0.000	0.050	fbmy8028_rel_231222_870.cza1_bee_cfx
qr1000.L5
- qr1000.L5: range queries with 1000 insert/s per client
- Legend for results is here.
- Each entry lists the percentage of responses that fit in that bucket (slower than max time for previous bucket, faster than min time for next bucket).
Query response time histogram
256us	1ms	4ms	16ms	64ms	256ms	1s	4s	16s	gt	max	tag
12.756	69.621	13.492	4.129	nonzero	0.001	0.000	0.000	0.000	0.000	0.184	fbmy5635_rel_202203072101.cza1_bee
12.301	67.597	20.101	0.001	nonzero	0.000	0.000	0.000	0.000	0.000	0.042	fbmy5635_rel_20230529_850.cza1_bee
5.033	70.748	21.967	2.251	nonzero	nonzero	0.000	0.000	0.000	0.000	0.181	fbmy8028_rel_20220829_752.cza1_bee
5.181	72.906	21.912	nonzero	nonzero	0.000	0.000	0.000	0.000	0.000	0.031	fbmy8028_rel_20230619_831.cza1_bee
4.291	71.017	24.691	0.001	0.001	0.000	0.000	0.000	0.000	0.000	0.038	fbmy8028_rel_221222.cza1_bee
1.901	72.869	25.230	nonzero	nonzero	0.000	0.000	0.000	0.000	0.000	0.034	fbmy8028_rel_231222_870.cza1_bee_cfx
Insert response time histogram
256us	1ms	4ms	16ms	64ms	256ms	1s	4s	16s	gt	max	tag
0.000	0.000	99.554	0.440	0.006	0.000	0.000	0.000	0.000	0.000	0.063	fbmy5635_rel_202203072101.cza1_bee
0.000	0.000	99.711	0.285	0.001	0.003	0.000	0.000	0.000	0.000	0.066	fbmy5635_rel_20230529_850.cza1_bee
0.000	0.000	99.571	0.346	0.083	0.000	0.000	0.000	0.000	0.000	0.049	fbmy8028_rel_20220829_752.cza1_bee
0.000	0.000	99.542	0.376	0.082	0.000	0.000	0.000	0.000	0.000	0.064	fbmy8028_rel_20230619_831.cza1_bee
0.000	0.000	99.583	0.331	0.086	0.000	0.000	0.000	0.000	0.000	0.064	fbmy8028_rel_221222.cza1_bee
0.000	0.000	99.708	0.204	0.086	0.001	0.000	0.000	0.000	0.000	0.064	fbmy8028_rel_231222_870.cza1_bee_cfx
Delete response time histogram
256us	1ms	4ms	16ms	64ms	256ms	1s	4s	16s	gt	max	tag
0.000	0.000	99.493	0.499	0.008	0.000	0.000	0.000	0.000	0.000	0.063	fbmy5635_rel_202203072101.cza1_bee
0.000	0.000	99.683	0.311	0.003	0.003	0.000	0.000	0.000	0.000	0.065	fbmy5635_rel_20230529_850.cza1_bee
0.000	0.000	99.606	0.310	0.082	0.003	0.000	0.000	0.000	0.000	0.188	fbmy8028_rel_20220829_752.cza1_bee
0.000	0.000	99.574	0.350	0.075	0.001	0.000	0.000	0.000	0.000	0.064	fbmy8028_rel_20230619_831.cza1_bee
0.000	0.000	99.614	0.303	0.082	0.001	0.000	0.000	0.000	0.000	0.079	fbmy8028_rel_221222.cza1_bee
0.000	0.000	99.699	0.214	0.088	0.000	0.000	0.000	0.000	0.000	0.063	fbmy8028_rel_231222_870.cza1_bee_cfx
qp1000.L6
- qp1000.L6: point queries with 1000 insert/s per client
- Legend for results is here.
- Each entry lists the percentage of responses that fit in that bucket (slower than max time for previous bucket, faster than min time for next bucket).
Query response time histogram
256us	1ms	4ms	16ms	64ms	256ms	1s	4s	16s	gt	max	tag
0.559	99.431	0.010	nonzero	0.000	0.000	0.000	0.000	0.000	0.000	0.005	fbmy5635_rel_202203072101.cza1_bee
6.215	93.778	0.007	nonzero	0.000	0.000	0.000	0.000	0.000	0.000	0.008	fbmy5635_rel_20230529_850.cza1_bee
nonzero	99.992	0.008	nonzero	nonzero	0.000	0.000	0.000	0.000	0.000	0.029	fbmy8028_rel_20220829_752.cza1_bee
0.000	99.992	0.008	nonzero	0.000	0.000	0.000	0.000	0.000	0.000	0.011	fbmy8028_rel_20230619_831.cza1_bee
0.000	99.990	0.009	0.001	0.000	0.000	0.000	0.000	0.000	0.000	0.010	fbmy8028_rel_221222.cza1_bee
0.000	99.993	0.007	nonzero	0.000	0.000	0.000	0.000	0.000	0.000	0.006	fbmy8028_rel_231222_870.cza1_bee_cfx
Insert response time histogram
256us	1ms	4ms	16ms	64ms	256ms	1s	4s	16s	gt	max	tag
0.000	0.000	99.756	0.237	0.006	0.001	0.000	0.000	0.000	0.000	0.076	fbmy5635_rel_202203072101.cza1_bee
0.000	0.000	99.779	0.215	0.006	0.000	0.000	0.000	0.000	0.000	0.048	fbmy5635_rel_20230529_850.cza1_bee
0.000	0.000	99.635	0.278	0.088	0.000	0.000	0.000	0.000	0.000	0.049	fbmy8028_rel_20220829_752.cza1_bee
0.000	0.000	99.519	0.396	0.085	0.000	0.000	0.000	0.000	0.000	0.064	fbmy8028_rel_20230619_831.cza1_bee
0.000	0.000	99.593	0.318	0.089	0.000	0.000	0.000	0.000	0.000	0.055	fbmy8028_rel_221222.cza1_bee
0.000	0.000	99.685	0.231	0.085	0.000	0.000	0.000	0.000	0.000	0.049	fbmy8028_rel_231222_870.cza1_bee_cfx
Delete response time histogram
256us	1ms	4ms	16ms	64ms	256ms	1s	4s	16s	gt	max	tag
0.000	0.000	99.674	0.321	0.006	0.000	0.000	0.000	0.000	0.000	0.055	fbmy5635_rel_202203072101.cza1_bee
0.000	0.000	99.792	0.203	0.006	0.000	0.000	0.000	0.000	0.000	0.049	fbmy5635_rel_20230529_850.cza1_bee
0.000	0.000	99.722	0.193	0.085	0.000	0.000	0.000	0.000	0.000	0.062	fbmy8028_rel_20220829_752.cza1_bee
0.000	0.000	99.572	0.346	0.082	0.000	0.000	0.000	0.000	0.000	0.064	fbmy8028_rel_20230619_831.cza1_bee
0.000	0.000	99.628	0.285	0.088	0.000	0.000	0.000	0.000	0.000	0.063	fbmy8028_rel_221222.cza1_bee
0.000	0.000	99.682	0.233	0.085	0.000	0.000	0.000	0.000	0.000	0.064	fbmy8028_rel_231222_870.cza1_bee_cfx