Introduction
This is a report for the insert benchmark with 800M docs and 1 client(s). It is generated by scripts (bash, awk, sed) and Tufte might not be impressed. An overview of the insert benchmark is here and a short update is here. Below, by DBMS, I mean DBMS+version.config. An example is my8020.c10b40 where my means MySQL, 8020 is version 8.0.20 and c10b40 is the name for the configuration file.
The test server has 8 AMD cores, 16G RAM and an NVMe SSD. It is described here as the Beelink. The benchmark was run with 1 client and there were 1 or 3 connections per client (1 for queries or inserts without rate limits, 1+1 for rate limited inserts+deletes). It uses 1 table. It loads 800M rows per table without secondary indexes, creates 3 secondary indexes per table, then inserts 4m+1m rows per table with a delete per insert to avoid growing the table. It then does 6 read+write tests for 1800s each that do queries as fast as possible with 100,100,500,500,1000,1000 inserts/s and the same for deletes/s per client concurrent with the queries. The database is cached in memory. Clients and the DBMS share one server. The per-database configs are in the per-database subdirectories here.
The tested DBMS are:
- pg162_def.cx9a2a_bee - Postgres 16.2, cx9a2a config that adds autovacuum_vacuum_cost_delay= 1ms
- my8036_rel.cz10a_bee - MySQL 8.0.36 with InnoDB, rel build, cz10a_bee config
- fbmy8028_rel_221222.cza1_bee - MyRocks 8.0.28 from code as of 2023-12-22 at git hash 2ad105fc, RocksDB 8.7.0 at git hash 29005f0b, cza1_bee config
Contents
- Summary
- l.i0: load without secondary indexes
- l.x: create secondary indexes
- l.i1: continue load after secondary indexes created with 50 inserts per transaction
- l.i2: continue load after secondary indexes created with 5 inserts per transaction
- qr100.L1: range queries with 100 insert/s per client
- qp100.L2: point queries with 100 insert/s per client
- qr500.L3: range queries with 500 insert/s per client
- qp500.L4: point queries with 500 insert/s per client
- qr1000.L5: range queries with 1000 insert/s per client
- qp1000.L6: point queries with 1000 insert/s per client
Summary
The numbers are inserts/s for l.i0, l.i1 and l.i2, indexed docs (or rows) /s for l.x and queries/s for qr100, qp100 thru qr1000, qp1000" The values are the average rate over the entire test for inserts (IPS) and queries (QPS). The range of values for IPS and QPS is split into 3 parts: bottom 25%, middle 50%, top 25%. Values in the bottom 25% have a red background, values in the top 25% have a green background and values in the middle have no color. A gray background is used for values that can be ignored because the DBMS did not sustain the target insert rate. Red backgrounds are not used when the minimum value is within 80% of the max value.
| dbms | l.i0 | l.x | l.i1 | l.i2 | qr100 | qp100 | qr500 | qp500 | qr1000 | qp1000 |
|---|---|---|---|---|---|---|---|---|---|---|
| pg162_def.cx9a2a_bee | 74864 | 194789 | 2068 | 103 | 8484 | 393 | 7964 | 380 | 6980 | 357 |
| my8036_rel.cz10a_bee | 55517 | 105291 | 1720 | 1890 | 3530 | 615 | 3748 | 554 | 3870 | 513 |
| fbmy8028_rel_221222.cza1_bee | 57958 | 73455 | 23669 | 7576 | 565 | 844 | 488 | 808 | 412 | 790 |
This table has relative throughput, throughput for the DBMS relative to the DBMS in the first line, using the absolute throughput from the previous table. Values less than 0.95 have a yellow background. Values greater than 1.05 have a blue background.
| dbms | l.i0 | l.x | l.i1 | l.i2 | qr100 | qp100 | qr500 | qp500 | qr1000 | qp1000 |
|---|---|---|---|---|---|---|---|---|---|---|
| pg162_def.cx9a2a_bee | 1.00 | 1.00 | 1.00 | 1.00 | 1.00 | 1.00 | 1.00 | 1.00 | 1.00 | 1.00 |
| my8036_rel.cz10a_bee | 0.74 | 0.54 | 0.83 | 18.35 | 0.42 | 1.56 | 0.47 | 1.46 | 0.55 | 1.44 |
| fbmy8028_rel_221222.cza1_bee | 0.77 | 0.38 | 11.45 | 73.55 | 0.07 | 2.15 | 0.06 | 2.13 | 0.06 | 2.21 |
This lists the average rate of inserts/s for the tests that do inserts concurrent with queries. For such tests the query rate is listed in the table above. The read+write tests are setup so that the insert rate should match the target rate every second. Cells that are not at least 95% of the target have a red background to indicate a failure to satisfy the target.
| dbms | qr100.L1 | qp100.L2 | qr500.L3 | qp500.L4 | qr1000.L5 | qp1000.L6 |
|---|---|---|---|---|---|---|
| pg162_def.cx9a2a_bee | 100 | 100 | 499 | 499 | 997 | 924 |
| my8036_rel.cz10a_bee | 100 | 100 | 499 | 499 | 997 | 997 |
| fbmy8028_rel_221222.cza1_bee | 100 | 100 | 499 | 499 | 998 | 998 |
| target | 100 | 100 | 500 | 500 | 1000 | 1000 |
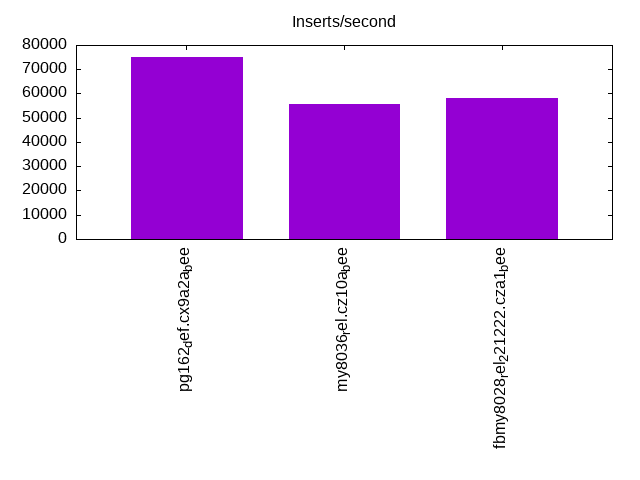
l.i0
l.i0: load without secondary indexes. Graphs for performance per 1-second interval are here.
Average throughput:
Insert response time histogram: each cell has the percentage of responses that take <= the time in the header and max is the max response time in seconds. For the max column values in the top 25% of the range have a red background and in the bottom 25% of the range have a green background. The red background is not used when the min value is within 80% of the max value.
| dbms | 256us | 1ms | 4ms | 16ms | 64ms | 256ms | 1s | 4s | 16s | gt | max |
|---|---|---|---|---|---|---|---|---|---|---|---|
| pg162_def.cx9a2a_bee | 99.998 | 0.001 | nonzero | nonzero | 0.080 | ||||||
| my8036_rel.cz10a_bee | 99.409 | 0.440 | 0.148 | 0.003 | 0.097 | ||||||
| fbmy8028_rel_221222.cza1_bee | 99.725 | 0.194 | 0.077 | 0.004 | 0.135 |
Performance metrics for the DBMS listed above. Some are normalized by throughput, others are not. Legend for results is here.
ips	qps	rps	rmbps	wps	wmbps	rpq	rkbpq	wpi	wkbpi	csps	cpups	cspq	cpupq	dbgb1	dbgb2	rss	maxop	p50	p99	tag
74864	0	32	0.3	107.6	30.7	0.000	0.003	0.001	0.420	9095	23.0	0.121	25	76.5	116.6	1.5	0.080	75020	73014	pg162_def.cx9a2a_bee
55517	0	0	0.0	341.1	21.1	0.000	0.000	0.006	0.389	6636	20.2	0.120	29	52.4	69.0	11.1	0.097	55691	49844	my8036_rel.cz10a_bee
57958	0	0	0.0	44.5	13.2	0.000	0.000	0.001	0.234	6230	22.7	0.107	31	23.0	23.8	2.0	0.135	58144	50044	fbmy8028_rel_221222.cza1_bee
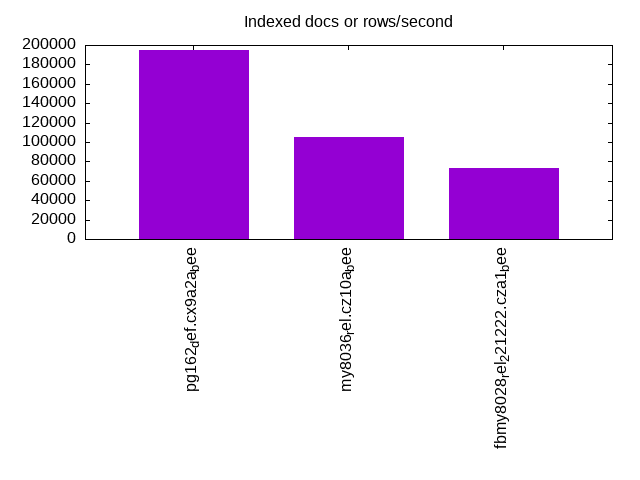
l.x
l.x: create secondary indexes.
Average throughput:
Performance metrics for the DBMS listed above. Some are normalized by throughput, others are not. Legend for results is here.
ips	qps	rps	rmbps	wps	wmbps	rpq	rkbpq	wpi	wkbpi	csps	cpups	cspq	cpupq	dbgb1	dbgb2	rss	maxop	p50	p99	tag
194789	0	590	73.2	200.2	72.6	0.003	0.385	0.001	0.382	387	12.4	0.002	5	153.6	193.7	10.2	0.005	NA	NA	pg162_def.cx9a2a_bee
105291	0	1764	167.1	2145.2	150.6	0.017	1.625	0.020	1.465	8696	43.7	0.083	33	120.7	137.3	11.3	0.004	NA	NA	my8036_rel.cz10a_bee
73455	0	97	15.0	30.6	11.2	0.001	0.209	0.000	0.156	407	11.6	0.006	13	50.9	51.7	10.3	0.003	NA	NA	fbmy8028_rel_221222.cza1_bee
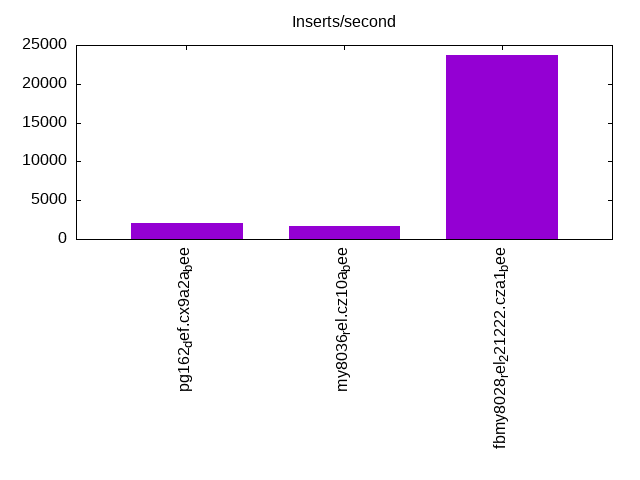
l.i1
l.i1: continue load after secondary indexes created with 50 inserts per transaction. Graphs for performance per 1-second interval are here.
Average throughput:
Insert response time histogram: each cell has the percentage of responses that take <= the time in the header and max is the max response time in seconds. For the max column values in the top 25% of the range have a red background and in the bottom 25% of the range have a green background. The red background is not used when the min value is within 80% of the max value.
| dbms | 256us | 1ms | 4ms | 16ms | 64ms | 256ms | 1s | 4s | 16s | gt | max |
|---|---|---|---|---|---|---|---|---|---|---|---|
| pg162_def.cx9a2a_bee | 97.575 | 2.425 | 0.061 | ||||||||
| my8036_rel.cz10a_bee | 17.212 | 77.422 | 5.365 | 0.247 | |||||||
| fbmy8028_rel_221222.cza1_bee | 99.625 | 0.351 | 0.020 | 0.004 | 0.103 |
Delete response time histogram: each cell has the percentage of responses that take <= the time in the header and max is the max response time in seconds. For the max column values in the top 25% of the range have a red background and in the bottom 25% of the range have a green background. The red background is not used when the min value is within 80% of the max value.
| dbms | 256us | 1ms | 4ms | 16ms | 64ms | 256ms | 1s | 4s | 16s | gt | max |
|---|---|---|---|---|---|---|---|---|---|---|---|
| pg162_def.cx9a2a_bee | 0.305 | 5.550 | 30.056 | 64.089 | 0.045 | ||||||
| my8036_rel.cz10a_bee | 46.030 | 53.601 | 0.364 | 0.005 | 0.115 | ||||||
| fbmy8028_rel_221222.cza1_bee | 99.585 | 0.374 | 0.037 | 0.004 | 0.098 |
Performance metrics for the DBMS listed above. Some are normalized by throughput, others are not. Legend for results is here.
ips	qps	rps	rmbps	wps	wmbps	rpq	rkbpq	wpi	wkbpi	csps	cpups	cspq	cpupq	dbgb1	dbgb2	rss	maxop	p50	p99	tag
2068	0	3443	27.3	3497.6	50.5	1.665	13.493	1.691	25.004	8065	15.3	3.900	592	154.3	194.3	9.4	0.061	1698	1148	pg162_def.cx9a2a_bee
1720	0	8866	138.5	13290.3	368.8	5.156	82.496	7.729	219.617	55995	23.0	32.563	1070	149.5	166.3	10.7	0.247	1648	899	my8036_rel.cz10a_bee
23669	0	140	0.8	187.1	62.3	0.006	0.033	0.008	2.694	11220	48.7	0.474	165	51.7	53.4	8.5	0.103	23931	20877	fbmy8028_rel_221222.cza1_bee
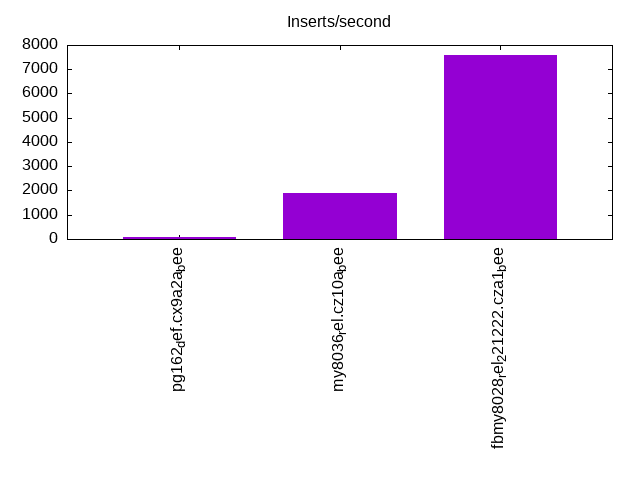
l.i2
l.i2: continue load after secondary indexes created with 5 inserts per transaction. Graphs for performance per 1-second interval are here.
Average throughput:
Insert response time histogram: each cell has the percentage of responses that take <= the time in the header and max is the max response time in seconds. For the max column values in the top 25% of the range have a red background and in the bottom 25% of the range have a green background. The red background is not used when the min value is within 80% of the max value.
| dbms | 256us | 1ms | 4ms | 16ms | 64ms | 256ms | 1s | 4s | 16s | gt | max |
|---|---|---|---|---|---|---|---|---|---|---|---|
| pg162_def.cx9a2a_bee | 0.005 | 98.879 | 1.099 | 0.017 | 0.034 | ||||||
| my8036_rel.cz10a_bee | 2.492 | 91.249 | 5.647 | 0.609 | 0.003 | 0.103 | |||||
| fbmy8028_rel_221222.cza1_bee | 99.803 | 0.106 | 0.081 | 0.010 | 0.001 | 0.064 |
Delete response time histogram: each cell has the percentage of responses that take <= the time in the header and max is the max response time in seconds. For the max column values in the top 25% of the range have a red background and in the bottom 25% of the range have a green background. The red background is not used when the min value is within 80% of the max value.
| dbms | 256us | 1ms | 4ms | 16ms | 64ms | 256ms | 1s | 4s | 16s | gt | max |
|---|---|---|---|---|---|---|---|---|---|---|---|
| pg162_def.cx9a2a_bee | 99.999 | 0.001 | 0.089 | ||||||||
| my8036_rel.cz10a_bee | 13.338 | 86.032 | 0.580 | 0.049 | 0.001 | 0.103 | |||||
| fbmy8028_rel_221222.cza1_bee | 99.701 | 0.204 | 0.084 | 0.010 | 0.001 | 0.086 |
Performance metrics for the DBMS listed above. Some are normalized by throughput, others are not. Legend for results is here.
ips	qps	rps	rmbps	wps	wmbps	rpq	rkbpq	wpi	wkbpi	csps	cpups	cspq	cpupq	dbgb1	dbgb2	rss	maxop	p50	p99	tag
103	0	165	1.3	219.9	3.3	1.606	13.033	2.137	32.447	989	12.4	9.616	9640	154.5	186.7	10.1	0.034	100	90	pg162_def.cx9a2a_bee
1890	0	8087	126.4	11888.6	317.6	4.278	68.450	6.289	172.058	56350	31.8	29.810	1346	149.5	166.4	10.7	0.103	1854	1633	my8036_rel.cz10a_bee
7576	0	42	0.2	112.2	36.2	0.006	0.029	0.015	4.890	31649	40.4	4.178	427	52.1	52.5	7.4	0.064	7582	6368	fbmy8028_rel_221222.cza1_bee
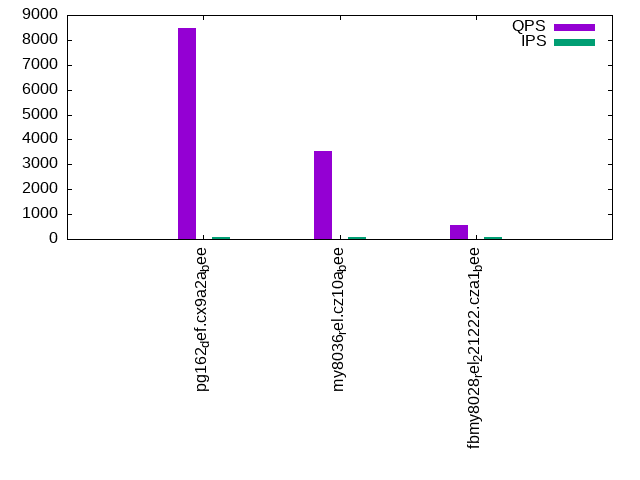
qr100.L1
qr100.L1: range queries with 100 insert/s per client. Graphs for performance per 1-second interval are here.
Average throughput:
Query response time histogram: each cell has the percentage of responses that take <= the time in the header and max is the max response time in seconds. For max values in the top 25% of the range have a red background and in the bottom 25% of the range have a green background. The red background is not used when the min value is within 80% of the max value.
| dbms | 256us | 1ms | 4ms | 16ms | 64ms | 256ms | 1s | 4s | 16s | gt | max |
|---|---|---|---|---|---|---|---|---|---|---|---|
| pg162_def.cx9a2a_bee | 99.919 | 0.080 | nonzero | 0.001 | 0.010 | ||||||
| my8036_rel.cz10a_bee | 49.920 | 50.076 | 0.004 | 0.001 | 0.010 | ||||||
| fbmy8028_rel_221222.cza1_bee | 0.867 | 65.791 | 0.019 | 33.323 | nonzero | 0.049 |
Insert response time histogram: each cell has the percentage of responses that take <= the time in the header and max is the max response time in seconds. For max values in the top 25% of the range have a red background and in the bottom 25% of the range have a green background. The red background is not used when the min value is within 80% of the max value.
| dbms | 256us | 1ms | 4ms | 16ms | 64ms | 256ms | 1s | 4s | 16s | gt | max |
|---|---|---|---|---|---|---|---|---|---|---|---|
| pg162_def.cx9a2a_bee | 51.083 | 48.917 | 0.031 | ||||||||
| my8036_rel.cz10a_bee | 8.750 | 91.250 | 0.045 | ||||||||
| fbmy8028_rel_221222.cza1_bee | 99.472 | 0.472 | 0.056 | 0.023 |
Delete response time histogram: each cell has the percentage of responses that take <= the time in the header and max is the max response time in seconds. For max values in the top 25% of the range have a red background and in the bottom 25% of the range have a green background. The red background is not used when the min value is within 80% of the max value.
| dbms | 256us | 1ms | 4ms | 16ms | 64ms | 256ms | 1s | 4s | 16s | gt | max |
|---|---|---|---|---|---|---|---|---|---|---|---|
| pg162_def.cx9a2a_bee | 23.472 | 76.472 | 0.056 | 0.009 | |||||||
| my8036_rel.cz10a_bee | 99.167 | 0.833 | 0.013 | ||||||||
| fbmy8028_rel_221222.cza1_bee | 99.444 | 0.500 | 0.056 | 0.023 |
Performance metrics for the DBMS listed above. Some are normalized by throughput, others are not. Legend for results is here.
ips	qps	rps	rmbps	wps	wmbps	rpq	rkbpq	wpi	wkbpi	csps	cpups	cspq	cpupq	dbgb1	dbgb2	rss	maxop	p50	p99	tag
100	8484	166	1.4	15.2	1.5	0.020	0.164	0.152	15.426	32880	12.7	3.875	120	154.5	190.4	10.1	0.010	8087	7861	pg162_def.cx9a2a_bee
100	3530	579	9.0	626.3	16.5	0.164	2.624	6.282	169.301	16751	14.0	4.745	317	149.5	166.4	10.7	0.010	3500	3262	my8036_rel.cz10a_bee
100	565	8	0.1	4.9	0.7	0.014	0.168	0.050	6.804	2476	12.4	4.383	1756	51.8	52.0	7.4	0.049	560	495	fbmy8028_rel_221222.cza1_bee
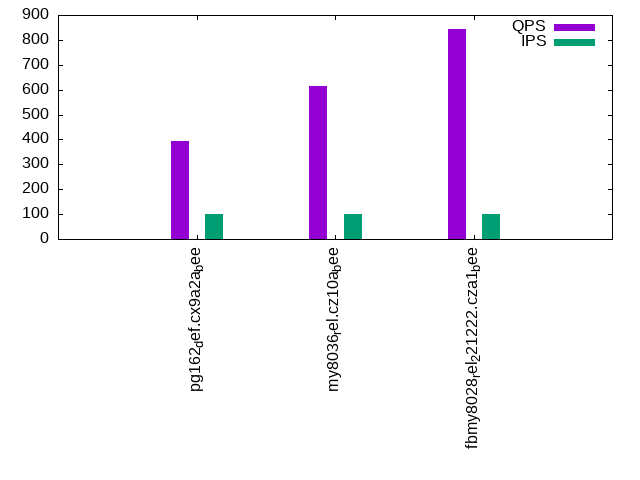
qp100.L2
qp100.L2: point queries with 100 insert/s per client. Graphs for performance per 1-second interval are here.
Average throughput:
Query response time histogram: each cell has the percentage of responses that take <= the time in the header and max is the max response time in seconds. For max values in the top 25% of the range have a red background and in the bottom 25% of the range have a green background. The red background is not used when the min value is within 80% of the max value.
| dbms | 256us | 1ms | 4ms | 16ms | 64ms | 256ms | 1s | 4s | 16s | gt | max |
|---|---|---|---|---|---|---|---|---|---|---|---|
| pg162_def.cx9a2a_bee | nonzero | 99.725 | 0.275 | 0.010 | |||||||
| my8036_rel.cz10a_bee | 0.105 | 99.656 | 0.238 | 0.001 | 0.041 | ||||||
| fbmy8028_rel_221222.cza1_bee | 15.301 | 84.681 | 0.018 | nonzero | 0.036 |
Insert response time histogram: each cell has the percentage of responses that take <= the time in the header and max is the max response time in seconds. For max values in the top 25% of the range have a red background and in the bottom 25% of the range have a green background. The red background is not used when the min value is within 80% of the max value.
| dbms | 256us | 1ms | 4ms | 16ms | 64ms | 256ms | 1s | 4s | 16s | gt | max |
|---|---|---|---|---|---|---|---|---|---|---|---|
| pg162_def.cx9a2a_bee | 23.111 | 76.889 | 0.027 | ||||||||
| my8036_rel.cz10a_bee | 7.806 | 92.194 | 0.044 | ||||||||
| fbmy8028_rel_221222.cza1_bee | 99.111 | 0.889 | 0.013 |
Delete response time histogram: each cell has the percentage of responses that take <= the time in the header and max is the max response time in seconds. For max values in the top 25% of the range have a red background and in the bottom 25% of the range have a green background. The red background is not used when the min value is within 80% of the max value.
| dbms | 256us | 1ms | 4ms | 16ms | 64ms | 256ms | 1s | 4s | 16s | gt | max |
|---|---|---|---|---|---|---|---|---|---|---|---|
| pg162_def.cx9a2a_bee | 47.139 | 52.861 | 0.011 | ||||||||
| my8036_rel.cz10a_bee | 98.556 | 1.417 | 0.028 | 0.028 | |||||||
| fbmy8028_rel_221222.cza1_bee | 98.944 | 1.056 | 0.013 |
Performance metrics for the DBMS listed above. Some are normalized by throughput, others are not. Legend for results is here.
ips	qps	rps	rmbps	wps	wmbps	rpq	rkbpq	wpi	wkbpi	csps	cpups	cspq	cpupq	dbgb1	dbgb2	rss	maxop	p50	p99	tag
100	393	6782	53.5	392.9	4.5	17.241	139.181	3.937	45.785	14823	3.9	37.680	793	154.5	190.4	10.1	0.010	400	336	pg162_def.cx9a2a_bee
100	615	6091	95.2	1132.5	29.1	9.908	158.523	11.348	298.673	17636	5.9	28.685	768	149.5	166.4	10.8	0.041	623	559	my8036_rel.cz10a_bee
100	844	6548	48.6	4.7	0.5	7.762	58.942	0.047	5.335	16519	7.6	19.582	721	51.8	52.1	8.8	0.036	847	799	fbmy8028_rel_221222.cza1_bee
qr500.L3
qr500.L3: range queries with 500 insert/s per client. Graphs for performance per 1-second interval are here.
Average throughput:
Query response time histogram: each cell has the percentage of responses that take <= the time in the header and max is the max response time in seconds. For max values in the top 25% of the range have a red background and in the bottom 25% of the range have a green background. The red background is not used when the min value is within 80% of the max value.
| dbms | 256us | 1ms | 4ms | 16ms | 64ms | 256ms | 1s | 4s | 16s | gt | max |
|---|---|---|---|---|---|---|---|---|---|---|---|
| pg162_def.cx9a2a_bee | 99.851 | 0.145 | 0.002 | 0.002 | nonzero | 0.027 | |||||
| my8036_rel.cz10a_bee | 58.375 | 41.616 | 0.008 | 0.001 | nonzero | 0.029 | |||||
| fbmy8028_rel_221222.cza1_bee | 0.531 | 65.818 | 0.151 | 33.498 | 0.001 | 0.063 |
Insert response time histogram: each cell has the percentage of responses that take <= the time in the header and max is the max response time in seconds. For max values in the top 25% of the range have a red background and in the bottom 25% of the range have a green background. The red background is not used when the min value is within 80% of the max value.
| dbms | 256us | 1ms | 4ms | 16ms | 64ms | 256ms | 1s | 4s | 16s | gt | max |
|---|---|---|---|---|---|---|---|---|---|---|---|
| pg162_def.cx9a2a_bee | 81.083 | 18.917 | 0.042 | ||||||||
| my8036_rel.cz10a_bee | 59.933 | 40.067 | 0.047 | ||||||||
| fbmy8028_rel_221222.cza1_bee | 98.461 | 1.494 | 0.044 | 0.024 |
Delete response time histogram: each cell has the percentage of responses that take <= the time in the header and max is the max response time in seconds. For max values in the top 25% of the range have a red background and in the bottom 25% of the range have a green background. The red background is not used when the min value is within 80% of the max value.
| dbms | 256us | 1ms | 4ms | 16ms | 64ms | 256ms | 1s | 4s | 16s | gt | max |
|---|---|---|---|---|---|---|---|---|---|---|---|
| pg162_def.cx9a2a_bee | 98.261 | 1.739 | 0.022 | ||||||||
| my8036_rel.cz10a_bee | 97.583 | 2.400 | 0.017 | 0.017 | |||||||
| fbmy8028_rel_221222.cza1_bee | 96.867 | 3.033 | 0.100 | 0.024 |
Performance metrics for the DBMS listed above. Some are normalized by throughput, others are not. Legend for results is here.
ips	qps	rps	rmbps	wps	wmbps	rpq	rkbpq	wpi	wkbpi	csps	cpups	cspq	cpupq	dbgb1	dbgb2	rss	maxop	p50	p99	tag
499	7964	883	7.1	615.2	11.1	0.111	0.907	1.234	22.803	32555	14.6	4.088	147	154.6	190.2	9.8	0.027	7770	7275	pg162_def.cx9a2a_bee
499	3748	2934	45.8	3883.9	102.3	0.783	12.522	7.782	209.944	31629	18.8	8.438	401	149.5	166.4	10.8	0.029	3708	3372	my8036_rel.cz10a_bee
499	488	36	0.5	12.4	3.6	0.073	0.989	0.025	7.348	2431	14.2	4.984	2328	52.0	52.4	8.4	0.063	495	400	fbmy8028_rel_221222.cza1_bee
qp500.L4
qp500.L4: point queries with 500 insert/s per client. Graphs for performance per 1-second interval are here.
Average throughput:
Query response time histogram: each cell has the percentage of responses that take <= the time in the header and max is the max response time in seconds. For max values in the top 25% of the range have a red background and in the bottom 25% of the range have a green background. The red background is not used when the min value is within 80% of the max value.
| dbms | 256us | 1ms | 4ms | 16ms | 64ms | 256ms | 1s | 4s | 16s | gt | max |
|---|---|---|---|---|---|---|---|---|---|---|---|
| pg162_def.cx9a2a_bee | 99.019 | 0.981 | 0.001 | 0.032 | |||||||
| my8036_rel.cz10a_bee | 0.004 | 98.923 | 0.968 | 0.106 | 0.053 | ||||||
| fbmy8028_rel_221222.cza1_bee | 11.331 | 88.633 | 0.036 | nonzero | 0.061 |
Insert response time histogram: each cell has the percentage of responses that take <= the time in the header and max is the max response time in seconds. For max values in the top 25% of the range have a red background and in the bottom 25% of the range have a green background. The red background is not used when the min value is within 80% of the max value.
| dbms | 256us | 1ms | 4ms | 16ms | 64ms | 256ms | 1s | 4s | 16s | gt | max |
|---|---|---|---|---|---|---|---|---|---|---|---|
| pg162_def.cx9a2a_bee | 97.789 | 2.211 | 0.042 | ||||||||
| my8036_rel.cz10a_bee | 67.994 | 30.822 | 1.183 | 0.119 | |||||||
| fbmy8028_rel_221222.cza1_bee | 99.489 | 0.511 | 0.014 |
Delete response time histogram: each cell has the percentage of responses that take <= the time in the header and max is the max response time in seconds. For max values in the top 25% of the range have a red background and in the bottom 25% of the range have a green background. The red background is not used when the min value is within 80% of the max value.
| dbms | 256us | 1ms | 4ms | 16ms | 64ms | 256ms | 1s | 4s | 16s | gt | max |
|---|---|---|---|---|---|---|---|---|---|---|---|
| pg162_def.cx9a2a_bee | 17.867 | 82.133 | 0.046 | ||||||||
| my8036_rel.cz10a_bee | 94.750 | 4.917 | 0.333 | 0.051 | |||||||
| fbmy8028_rel_221222.cza1_bee | 99.422 | 0.578 | 0.014 |
Performance metrics for the DBMS listed above. Some are normalized by throughput, others are not. Legend for results is here.
ips	qps	rps	rmbps	wps	wmbps	rpq	rkbpq	wpi	wkbpi	csps	cpups	cspq	cpupq	dbgb1	dbgb2	rss	maxop	p50	p99	tag
499	380	7430	58.4	1326.8	16.7	19.527	157.171	2.658	34.352	16199	7.0	42.573	1472	154.7	189.1	8.6	0.032	384	320	pg162_def.cx9a2a_bee
499	554	8251	128.9	4270.4	111.7	14.904	238.463	8.556	229.158	30415	10.7	54.941	1546	149.5	166.4	10.8	0.053	559	527	my8036_rel.cz10a_bee
499	808	6532	49.2	13.1	3.4	8.088	62.413	0.026	6.912	16849	9.6	20.863	951	52.1	52.8	8.6	0.061	815	751	fbmy8028_rel_221222.cza1_bee
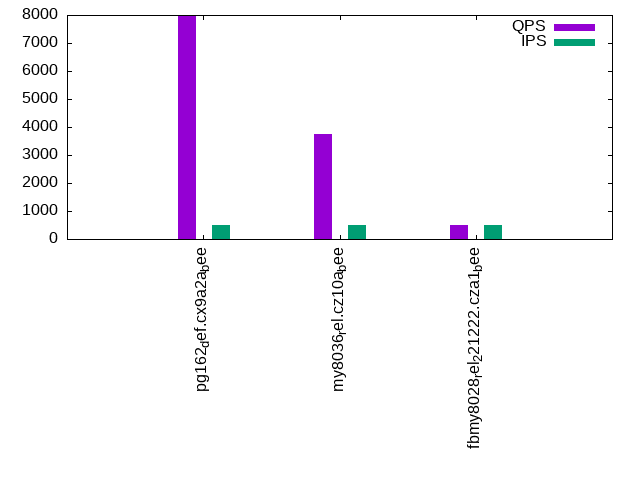
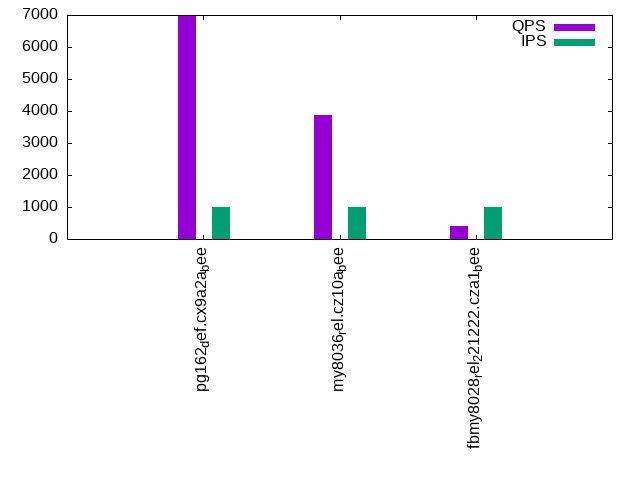
qr1000.L5
qr1000.L5: range queries with 1000 insert/s per client. Graphs for performance per 1-second interval are here.
Average throughput:
Query response time histogram: each cell has the percentage of responses that take <= the time in the header and max is the max response time in seconds. For max values in the top 25% of the range have a red background and in the bottom 25% of the range have a green background. The red background is not used when the min value is within 80% of the max value.
| dbms | 256us | 1ms | 4ms | 16ms | 64ms | 256ms | 1s | 4s | 16s | gt | max |
|---|---|---|---|---|---|---|---|---|---|---|---|
| pg162_def.cx9a2a_bee | 98.003 | 1.985 | 0.007 | 0.004 | nonzero | nonzero | 0.133 | ||||
| my8036_rel.cz10a_bee | 63.786 | 36.198 | 0.015 | 0.001 | nonzero | 0.032 | |||||
| fbmy8028_rel_221222.cza1_bee | 0.190 | 67.602 | 3.795 | 28.409 | 0.003 | nonzero | 0.192 |
Insert response time histogram: each cell has the percentage of responses that take <= the time in the header and max is the max response time in seconds. For max values in the top 25% of the range have a red background and in the bottom 25% of the range have a green background. The red background is not used when the min value is within 80% of the max value.
| dbms | 256us | 1ms | 4ms | 16ms | 64ms | 256ms | 1s | 4s | 16s | gt | max |
|---|---|---|---|---|---|---|---|---|---|---|---|
| pg162_def.cx9a2a_bee | 91.197 | 8.803 | 0.053 | ||||||||
| my8036_rel.cz10a_bee | 87.567 | 12.433 | 0.045 | ||||||||
| fbmy8028_rel_221222.cza1_bee | 99.333 | 0.594 | 0.069 | 0.003 | 0.083 |
Delete response time histogram: each cell has the percentage of responses that take <= the time in the header and max is the max response time in seconds. For max values in the top 25% of the range have a red background and in the bottom 25% of the range have a green background. The red background is not used when the min value is within 80% of the max value.
| dbms | 256us | 1ms | 4ms | 16ms | 64ms | 256ms | 1s | 4s | 16s | gt | max |
|---|---|---|---|---|---|---|---|---|---|---|---|
| pg162_def.cx9a2a_bee | 100.000 | 0.054 | |||||||||
| my8036_rel.cz10a_bee | 96.558 | 3.411 | 0.031 | 0.049 | |||||||
| fbmy8028_rel_221222.cza1_bee | 98.222 | 1.692 | 0.083 | 0.003 | 0.068 |
Performance metrics for the DBMS listed above. Some are normalized by throughput, others are not. Legend for results is here.
ips	qps	rps	rmbps	wps	wmbps	rpq	rkbpq	wpi	wkbpi	csps	cpups	cspq	cpupq	dbgb1	dbgb2	rss	maxop	p50	p99	tag
997	6980	1682	13.5	1553.7	23.3	0.241	1.981	1.558	23.939	30638	22.3	4.389	256	154.8	188.2	8.5	0.133	6792	5881	pg162_def.cx9a2a_bee
997	3870	5547	86.7	7630.0	199.8	1.434	22.937	7.651	205.161	48136	24.0	12.439	496	149.5	166.4	10.8	0.032	3850	3148	my8036_rel.cz10a_bee
998	412	197	1.4	22.0	7.5	0.479	3.436	0.022	7.696	2676	16.6	6.499	3225	52.8	53.8	8.3	0.192	416	320	fbmy8028_rel_221222.cza1_bee
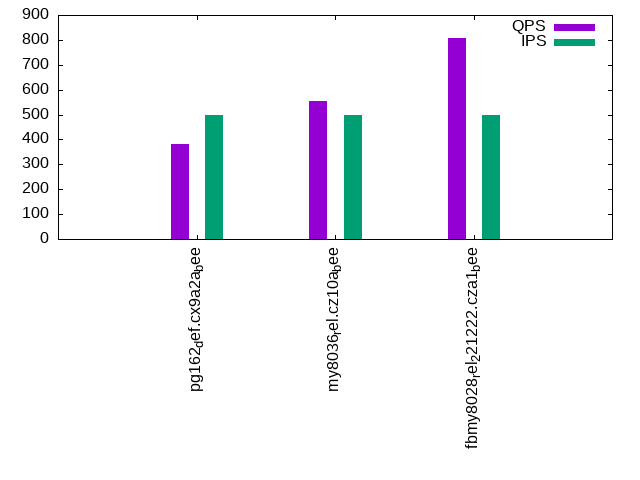
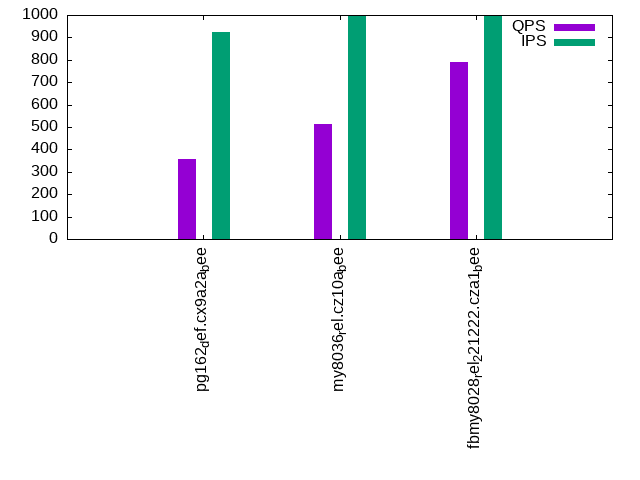
qp1000.L6
qp1000.L6: point queries with 1000 insert/s per client. Graphs for performance per 1-second interval are here.
Average throughput:
Query response time histogram: each cell has the percentage of responses that take <= the time in the header and max is the max response time in seconds. For max values in the top 25% of the range have a red background and in the bottom 25% of the range have a green background. The red background is not used when the min value is within 80% of the max value.
| dbms | 256us | 1ms | 4ms | 16ms | 64ms | 256ms | 1s | 4s | 16s | gt | max |
|---|---|---|---|---|---|---|---|---|---|---|---|
| pg162_def.cx9a2a_bee | 97.610 | 2.387 | 0.003 | 0.038 | |||||||
| my8036_rel.cz10a_bee | 0.001 | 97.884 | 1.922 | 0.194 | 0.056 | ||||||
| fbmy8028_rel_221222.cza1_bee | 8.633 | 91.314 | 0.052 | nonzero | nonzero | 0.102 |
Insert response time histogram: each cell has the percentage of responses that take <= the time in the header and max is the max response time in seconds. For max values in the top 25% of the range have a red background and in the bottom 25% of the range have a green background. The red background is not used when the min value is within 80% of the max value.
| dbms | 256us | 1ms | 4ms | 16ms | 64ms | 256ms | 1s | 4s | 16s | gt | max |
|---|---|---|---|---|---|---|---|---|---|---|---|
| pg162_def.cx9a2a_bee | 97.833 | 2.167 | 0.036 | ||||||||
| my8036_rel.cz10a_bee | 82.747 | 16.672 | 0.581 | 0.117 | |||||||
| fbmy8028_rel_221222.cza1_bee | 99.283 | 0.517 | 0.197 | 0.003 | 0.080 |
Delete response time histogram: each cell has the percentage of responses that take <= the time in the header and max is the max response time in seconds. For max values in the top 25% of the range have a red background and in the bottom 25% of the range have a green background. The red background is not used when the min value is within 80% of the max value.
| dbms | 256us | 1ms | 4ms | 16ms | 64ms | 256ms | 1s | 4s | 16s | gt | max |
|---|---|---|---|---|---|---|---|---|---|---|---|
| pg162_def.cx9a2a_bee | 99.900 | 0.100 | 0.110 | ||||||||
| my8036_rel.cz10a_bee | 95.156 | 4.647 | 0.194 | 0.003 | 0.067 | ||||||
| fbmy8028_rel_221222.cza1_bee | 99.175 | 0.625 | 0.197 | 0.003 | 0.088 |
Performance metrics for the DBMS listed above. Some are normalized by throughput, others are not. Legend for results is here.
ips	qps	rps	rmbps	wps	wmbps	rpq	rkbpq	wpi	wkbpi	csps	cpups	cspq	cpupq	dbgb1	dbgb2	rss	maxop	p50	p99	tag
924	357	7954	62.5	2170.9	30.0	22.256	178.932	2.349	33.236	17482	17.3	48.915	3872	155.0	192.6	8.1	0.038	367	304	pg162_def.cx9a2a_bee
997	513	10652	166.4	7782.0	202.3	20.779	332.469	7.809	207.909	45110	16.0	88.003	2497	149.5	166.4	10.8	0.056	511	479	my8036_rel.cz10a_bee
998	790	7100	52.8	29.0	8.8	8.986	68.488	0.029	9.017	18278	14.5	23.134	1468	53.4	54.8	8.7	0.102	799	656	fbmy8028_rel_221222.cza1_bee
l.i0
l.i0: load without secondary indexes
Performance metrics for all DBMS, not just the ones listed above. Some are normalized by throughput, others are not. Legend for results is here.
ips	qps	rps	rmbps	wps	wmbps	rpq	rkbpq	wpi	wkbpi	csps	cpups	cspq	cpupq	dbgb1	dbgb2	rss	maxop	p50	p99	tag
74864	0	32	0.3	107.6	30.7	0.000	0.003	0.001	0.420	9095	23.0	0.121	25	76.5	116.6	1.5	0.080	75020	73014	pg162_def.cx9a2a_bee
55517	0	0	0.0	341.1	21.1	0.000	0.000	0.006	0.389	6636	20.2	0.120	29	52.4	69.0	11.1	0.097	55691	49844	my8036_rel.cz10a_bee
57958	0	0	0.0	44.5	13.2	0.000	0.000	0.001	0.234	6230	22.7	0.107	31	23.0	23.8	2.0	0.135	58144	50044	fbmy8028_rel_221222.cza1_bee
l.x
l.x: create secondary indexes
Performance metrics for all DBMS, not just the ones listed above. Some are normalized by throughput, others are not. Legend for results is here.
ips	qps	rps	rmbps	wps	wmbps	rpq	rkbpq	wpi	wkbpi	csps	cpups	cspq	cpupq	dbgb1	dbgb2	rss	maxop	p50	p99	tag
194789	0	590	73.2	200.2	72.6	0.003	0.385	0.001	0.382	387	12.4	0.002	5	153.6	193.7	10.2	0.005	NA	NA	pg162_def.cx9a2a_bee
105291	0	1764	167.1	2145.2	150.6	0.017	1.625	0.020	1.465	8696	43.7	0.083	33	120.7	137.3	11.3	0.004	NA	NA	my8036_rel.cz10a_bee
73455	0	97	15.0	30.6	11.2	0.001	0.209	0.000	0.156	407	11.6	0.006	13	50.9	51.7	10.3	0.003	NA	NA	fbmy8028_rel_221222.cza1_bee
l.i1
l.i1: continue load after secondary indexes created with 50 inserts per transaction
Performance metrics for all DBMS, not just the ones listed above. Some are normalized by throughput, others are not. Legend for results is here.
ips	qps	rps	rmbps	wps	wmbps	rpq	rkbpq	wpi	wkbpi	csps	cpups	cspq	cpupq	dbgb1	dbgb2	rss	maxop	p50	p99	tag
2068	0	3443	27.3	3497.6	50.5	1.665	13.493	1.691	25.004	8065	15.3	3.900	592	154.3	194.3	9.4	0.061	1698	1148	pg162_def.cx9a2a_bee
1720	0	8866	138.5	13290.3	368.8	5.156	82.496	7.729	219.617	55995	23.0	32.563	1070	149.5	166.3	10.7	0.247	1648	899	my8036_rel.cz10a_bee
23669	0	140	0.8	187.1	62.3	0.006	0.033	0.008	2.694	11220	48.7	0.474	165	51.7	53.4	8.5	0.103	23931	20877	fbmy8028_rel_221222.cza1_bee
l.i2
l.i2: continue load after secondary indexes created with 5 inserts per transaction
Performance metrics for all DBMS, not just the ones listed above. Some are normalized by throughput, others are not. Legend for results is here.
ips	qps	rps	rmbps	wps	wmbps	rpq	rkbpq	wpi	wkbpi	csps	cpups	cspq	cpupq	dbgb1	dbgb2	rss	maxop	p50	p99	tag
103	0	165	1.3	219.9	3.3	1.606	13.033	2.137	32.447	989	12.4	9.616	9640	154.5	186.7	10.1	0.034	100	90	pg162_def.cx9a2a_bee
1890	0	8087	126.4	11888.6	317.6	4.278	68.450	6.289	172.058	56350	31.8	29.810	1346	149.5	166.4	10.7	0.103	1854	1633	my8036_rel.cz10a_bee
7576	0	42	0.2	112.2	36.2	0.006	0.029	0.015	4.890	31649	40.4	4.178	427	52.1	52.5	7.4	0.064	7582	6368	fbmy8028_rel_221222.cza1_bee
qr100.L1
qr100.L1: range queries with 100 insert/s per client
Performance metrics for all DBMS, not just the ones listed above. Some are normalized by throughput, others are not. Legend for results is here.
ips	qps	rps	rmbps	wps	wmbps	rpq	rkbpq	wpi	wkbpi	csps	cpups	cspq	cpupq	dbgb1	dbgb2	rss	maxop	p50	p99	tag
100	8484	166	1.4	15.2	1.5	0.020	0.164	0.152	15.426	32880	12.7	3.875	120	154.5	190.4	10.1	0.010	8087	7861	pg162_def.cx9a2a_bee
100	3530	579	9.0	626.3	16.5	0.164	2.624	6.282	169.301	16751	14.0	4.745	317	149.5	166.4	10.7	0.010	3500	3262	my8036_rel.cz10a_bee
100	565	8	0.1	4.9	0.7	0.014	0.168	0.050	6.804	2476	12.4	4.383	1756	51.8	52.0	7.4	0.049	560	495	fbmy8028_rel_221222.cza1_bee
qp100.L2
qp100.L2: point queries with 100 insert/s per client
Performance metrics for all DBMS, not just the ones listed above. Some are normalized by throughput, others are not. Legend for results is here.
ips	qps	rps	rmbps	wps	wmbps	rpq	rkbpq	wpi	wkbpi	csps	cpups	cspq	cpupq	dbgb1	dbgb2	rss	maxop	p50	p99	tag
100	393	6782	53.5	392.9	4.5	17.241	139.181	3.937	45.785	14823	3.9	37.680	793	154.5	190.4	10.1	0.010	400	336	pg162_def.cx9a2a_bee
100	615	6091	95.2	1132.5	29.1	9.908	158.523	11.348	298.673	17636	5.9	28.685	768	149.5	166.4	10.8	0.041	623	559	my8036_rel.cz10a_bee
100	844	6548	48.6	4.7	0.5	7.762	58.942	0.047	5.335	16519	7.6	19.582	721	51.8	52.1	8.8	0.036	847	799	fbmy8028_rel_221222.cza1_bee
qr500.L3
qr500.L3: range queries with 500 insert/s per client
Performance metrics for all DBMS, not just the ones listed above. Some are normalized by throughput, others are not. Legend for results is here.
ips	qps	rps	rmbps	wps	wmbps	rpq	rkbpq	wpi	wkbpi	csps	cpups	cspq	cpupq	dbgb1	dbgb2	rss	maxop	p50	p99	tag
499	7964	883	7.1	615.2	11.1	0.111	0.907	1.234	22.803	32555	14.6	4.088	147	154.6	190.2	9.8	0.027	7770	7275	pg162_def.cx9a2a_bee
499	3748	2934	45.8	3883.9	102.3	0.783	12.522	7.782	209.944	31629	18.8	8.438	401	149.5	166.4	10.8	0.029	3708	3372	my8036_rel.cz10a_bee
499	488	36	0.5	12.4	3.6	0.073	0.989	0.025	7.348	2431	14.2	4.984	2328	52.0	52.4	8.4	0.063	495	400	fbmy8028_rel_221222.cza1_bee
qp500.L4
qp500.L4: point queries with 500 insert/s per client
Performance metrics for all DBMS, not just the ones listed above. Some are normalized by throughput, others are not. Legend for results is here.
ips	qps	rps	rmbps	wps	wmbps	rpq	rkbpq	wpi	wkbpi	csps	cpups	cspq	cpupq	dbgb1	dbgb2	rss	maxop	p50	p99	tag
499	380	7430	58.4	1326.8	16.7	19.527	157.171	2.658	34.352	16199	7.0	42.573	1472	154.7	189.1	8.6	0.032	384	320	pg162_def.cx9a2a_bee
499	554	8251	128.9	4270.4	111.7	14.904	238.463	8.556	229.158	30415	10.7	54.941	1546	149.5	166.4	10.8	0.053	559	527	my8036_rel.cz10a_bee
499	808	6532	49.2	13.1	3.4	8.088	62.413	0.026	6.912	16849	9.6	20.863	951	52.1	52.8	8.6	0.061	815	751	fbmy8028_rel_221222.cza1_bee
qr1000.L5
qr1000.L5: range queries with 1000 insert/s per client
Performance metrics for all DBMS, not just the ones listed above. Some are normalized by throughput, others are not. Legend for results is here.
ips	qps	rps	rmbps	wps	wmbps	rpq	rkbpq	wpi	wkbpi	csps	cpups	cspq	cpupq	dbgb1	dbgb2	rss	maxop	p50	p99	tag
997	6980	1682	13.5	1553.7	23.3	0.241	1.981	1.558	23.939	30638	22.3	4.389	256	154.8	188.2	8.5	0.133	6792	5881	pg162_def.cx9a2a_bee
997	3870	5547	86.7	7630.0	199.8	1.434	22.937	7.651	205.161	48136	24.0	12.439	496	149.5	166.4	10.8	0.032	3850	3148	my8036_rel.cz10a_bee
998	412	197	1.4	22.0	7.5	0.479	3.436	0.022	7.696	2676	16.6	6.499	3225	52.8	53.8	8.3	0.192	416	320	fbmy8028_rel_221222.cza1_bee
qp1000.L6
qp1000.L6: point queries with 1000 insert/s per client
Performance metrics for all DBMS, not just the ones listed above. Some are normalized by throughput, others are not. Legend for results is here.
ips	qps	rps	rmbps	wps	wmbps	rpq	rkbpq	wpi	wkbpi	csps	cpups	cspq	cpupq	dbgb1	dbgb2	rss	maxop	p50	p99	tag
924	357	7954	62.5	2170.9	30.0	22.256	178.932	2.349	33.236	17482	17.3	48.915	3872	155.0	192.6	8.1	0.038	367	304	pg162_def.cx9a2a_bee
997	513	10652	166.4	7782.0	202.3	20.779	332.469	7.809	207.909	45110	16.0	88.003	2497	149.5	166.4	10.8	0.056	511	479	my8036_rel.cz10a_bee
998	790	7100	52.8	29.0	8.8	8.986	68.488	0.029	9.017	18278	14.5	23.134	1468	53.4	54.8	8.7	0.102	799	656	fbmy8028_rel_221222.cza1_bee
l.i0
- l.i0: load without secondary indexes
- Legend for results is here.
- Each entry lists the percentage of responses that fit in that bucket (slower than max time for previous bucket, faster than min time for next bucket).
Insert response time histogram
256us	1ms	4ms	16ms	64ms	256ms	1s	4s	16s	gt	max	tag
0.000	0.000	99.998	0.001	nonzero	nonzero	0.000	0.000	0.000	0.000	0.080	pg162_def.cx9a2a_bee
0.000	0.000	99.409	0.440	0.148	0.003	0.000	0.000	0.000	0.000	0.097	my8036_rel.cz10a_bee
0.000	0.000	99.725	0.194	0.077	0.004	0.000	0.000	0.000	0.000	0.135	fbmy8028_rel_221222.cza1_bee
l.x
- l.x: create secondary indexes
- Legend for results is here.
- Each entry lists the percentage of responses that fit in that bucket (slower than max time for previous bucket, faster than min time for next bucket).
TODO - determine whether there is data for create index response time
l.i1
- l.i1: continue load after secondary indexes created with 50 inserts per transaction
- Legend for results is here.
- Each entry lists the percentage of responses that fit in that bucket (slower than max time for previous bucket, faster than min time for next bucket).
Insert response time histogram
256us	1ms	4ms	16ms	64ms	256ms	1s	4s	16s	gt	max	tag
0.000	0.000	0.000	97.575	2.425	0.000	0.000	0.000	0.000	0.000	0.061	pg162_def.cx9a2a_bee
0.000	0.000	0.000	17.212	77.422	5.365	0.000	0.000	0.000	0.000	0.247	my8036_rel.cz10a_bee
0.000	0.000	99.625	0.351	0.020	0.004	0.000	0.000	0.000	0.000	0.103	fbmy8028_rel_221222.cza1_bee
Delete response time histogram
256us	1ms	4ms	16ms	64ms	256ms	1s	4s	16s	gt	max	tag
0.000	0.305	5.550	30.056	64.089	0.000	0.000	0.000	0.000	0.000	0.045	pg162_def.cx9a2a_bee
0.000	0.000	46.030	53.601	0.364	0.005	0.000	0.000	0.000	0.000	0.115	my8036_rel.cz10a_bee
0.000	0.000	99.585	0.374	0.037	0.004	0.000	0.000	0.000	0.000	0.098	fbmy8028_rel_221222.cza1_bee
l.i2
- l.i2: continue load after secondary indexes created with 5 inserts per transaction
- Legend for results is here.
- Each entry lists the percentage of responses that fit in that bucket (slower than max time for previous bucket, faster than min time for next bucket).
Insert response time histogram
256us	1ms	4ms	16ms	64ms	256ms	1s	4s	16s	gt	max	tag
0.000	0.005	98.879	1.099	0.017	0.000	0.000	0.000	0.000	0.000	0.034	pg162_def.cx9a2a_bee
0.000	2.492	91.249	5.647	0.609	0.003	0.000	0.000	0.000	0.000	0.103	my8036_rel.cz10a_bee
0.000	99.803	0.106	0.081	0.010	0.001	0.000	0.000	0.000	0.000	0.064	fbmy8028_rel_221222.cza1_bee
Delete response time histogram
256us	1ms	4ms	16ms	64ms	256ms	1s	4s	16s	gt	max	tag
0.000	0.000	0.000	0.000	99.999	0.001	0.000	0.000	0.000	0.000	0.089	pg162_def.cx9a2a_bee
0.000	13.338	86.032	0.580	0.049	0.001	0.000	0.000	0.000	0.000	0.103	my8036_rel.cz10a_bee
0.000	99.701	0.204	0.084	0.010	0.001	0.000	0.000	0.000	0.000	0.086	fbmy8028_rel_221222.cza1_bee
qr100.L1
- qr100.L1: range queries with 100 insert/s per client
- Legend for results is here.
- Each entry lists the percentage of responses that fit in that bucket (slower than max time for previous bucket, faster than min time for next bucket).
Query response time histogram
256us	1ms	4ms	16ms	64ms	256ms	1s	4s	16s	gt	max	tag
99.919	0.080	nonzero	0.001	0.000	0.000	0.000	0.000	0.000	0.000	0.010	pg162_def.cx9a2a_bee
49.920	50.076	0.004	0.001	0.000	0.000	0.000	0.000	0.000	0.000	0.010	my8036_rel.cz10a_bee
0.867	65.791	0.019	33.323	nonzero	0.000	0.000	0.000	0.000	0.000	0.049	fbmy8028_rel_221222.cza1_bee
Insert response time histogram
256us	1ms	4ms	16ms	64ms	256ms	1s	4s	16s	gt	max	tag
0.000	0.000	0.000	51.083	48.917	0.000	0.000	0.000	0.000	0.000	0.031	pg162_def.cx9a2a_bee
0.000	0.000	0.000	8.750	91.250	0.000	0.000	0.000	0.000	0.000	0.045	my8036_rel.cz10a_bee
0.000	0.000	99.472	0.472	0.056	0.000	0.000	0.000	0.000	0.000	0.023	fbmy8028_rel_221222.cza1_bee
Delete response time histogram
256us	1ms	4ms	16ms	64ms	256ms	1s	4s	16s	gt	max	tag
0.000	23.472	76.472	0.056	0.000	0.000	0.000	0.000	0.000	0.000	0.009	pg162_def.cx9a2a_bee
0.000	0.000	99.167	0.833	0.000	0.000	0.000	0.000	0.000	0.000	0.013	my8036_rel.cz10a_bee
0.000	0.000	99.444	0.500	0.056	0.000	0.000	0.000	0.000	0.000	0.023	fbmy8028_rel_221222.cza1_bee
qp100.L2
- qp100.L2: point queries with 100 insert/s per client
- Legend for results is here.
- Each entry lists the percentage of responses that fit in that bucket (slower than max time for previous bucket, faster than min time for next bucket).
Query response time histogram
256us	1ms	4ms	16ms	64ms	256ms	1s	4s	16s	gt	max	tag
0.000	nonzero	99.725	0.275	0.000	0.000	0.000	0.000	0.000	0.000	0.010	pg162_def.cx9a2a_bee
0.000	0.105	99.656	0.238	0.001	0.000	0.000	0.000	0.000	0.000	0.041	my8036_rel.cz10a_bee
0.000	15.301	84.681	0.018	nonzero	0.000	0.000	0.000	0.000	0.000	0.036	fbmy8028_rel_221222.cza1_bee
Insert response time histogram
256us	1ms	4ms	16ms	64ms	256ms	1s	4s	16s	gt	max	tag
0.000	0.000	0.000	23.111	76.889	0.000	0.000	0.000	0.000	0.000	0.027	pg162_def.cx9a2a_bee
0.000	0.000	0.000	7.806	92.194	0.000	0.000	0.000	0.000	0.000	0.044	my8036_rel.cz10a_bee
0.000	0.000	99.111	0.889	0.000	0.000	0.000	0.000	0.000	0.000	0.013	fbmy8028_rel_221222.cza1_bee
Delete response time histogram
256us	1ms	4ms	16ms	64ms	256ms	1s	4s	16s	gt	max	tag
0.000	0.000	47.139	52.861	0.000	0.000	0.000	0.000	0.000	0.000	0.011	pg162_def.cx9a2a_bee
0.000	0.000	98.556	1.417	0.028	0.000	0.000	0.000	0.000	0.000	0.028	my8036_rel.cz10a_bee
0.000	0.000	98.944	1.056	0.000	0.000	0.000	0.000	0.000	0.000	0.013	fbmy8028_rel_221222.cza1_bee
qr500.L3
- qr500.L3: range queries with 500 insert/s per client
- Legend for results is here.
- Each entry lists the percentage of responses that fit in that bucket (slower than max time for previous bucket, faster than min time for next bucket).
Query response time histogram
256us	1ms	4ms	16ms	64ms	256ms	1s	4s	16s	gt	max	tag
99.851	0.145	0.002	0.002	nonzero	0.000	0.000	0.000	0.000	0.000	0.027	pg162_def.cx9a2a_bee
58.375	41.616	0.008	0.001	nonzero	0.000	0.000	0.000	0.000	0.000	0.029	my8036_rel.cz10a_bee
0.531	65.818	0.151	33.498	0.001	0.000	0.000	0.000	0.000	0.000	0.063	fbmy8028_rel_221222.cza1_bee
Insert response time histogram
256us	1ms	4ms	16ms	64ms	256ms	1s	4s	16s	gt	max	tag
0.000	0.000	0.000	81.083	18.917	0.000	0.000	0.000	0.000	0.000	0.042	pg162_def.cx9a2a_bee
0.000	0.000	0.000	59.933	40.067	0.000	0.000	0.000	0.000	0.000	0.047	my8036_rel.cz10a_bee
0.000	0.000	98.461	1.494	0.044	0.000	0.000	0.000	0.000	0.000	0.024	fbmy8028_rel_221222.cza1_bee
Delete response time histogram
256us	1ms	4ms	16ms	64ms	256ms	1s	4s	16s	gt	max	tag
0.000	0.000	0.000	98.261	1.739	0.000	0.000	0.000	0.000	0.000	0.022	pg162_def.cx9a2a_bee
0.000	0.000	97.583	2.400	0.017	0.000	0.000	0.000	0.000	0.000	0.017	my8036_rel.cz10a_bee
0.000	0.000	96.867	3.033	0.100	0.000	0.000	0.000	0.000	0.000	0.024	fbmy8028_rel_221222.cza1_bee
qp500.L4
- qp500.L4: point queries with 500 insert/s per client
- Legend for results is here.
- Each entry lists the percentage of responses that fit in that bucket (slower than max time for previous bucket, faster than min time for next bucket).
Query response time histogram
256us	1ms	4ms	16ms	64ms	256ms	1s	4s	16s	gt	max	tag
0.000	0.000	99.019	0.981	0.001	0.000	0.000	0.000	0.000	0.000	0.032	pg162_def.cx9a2a_bee
0.000	0.004	98.923	0.968	0.106	0.000	0.000	0.000	0.000	0.000	0.053	my8036_rel.cz10a_bee
0.000	11.331	88.633	0.036	nonzero	0.000	0.000	0.000	0.000	0.000	0.061	fbmy8028_rel_221222.cza1_bee
Insert response time histogram
256us	1ms	4ms	16ms	64ms	256ms	1s	4s	16s	gt	max	tag
0.000	0.000	0.000	97.789	2.211	0.000	0.000	0.000	0.000	0.000	0.042	pg162_def.cx9a2a_bee
0.000	0.000	0.000	67.994	30.822	1.183	0.000	0.000	0.000	0.000	0.119	my8036_rel.cz10a_bee
0.000	0.000	99.489	0.511	0.000	0.000	0.000	0.000	0.000	0.000	0.014	fbmy8028_rel_221222.cza1_bee
Delete response time histogram
256us	1ms	4ms	16ms	64ms	256ms	1s	4s	16s	gt	max	tag
0.000	0.000	0.000	17.867	82.133	0.000	0.000	0.000	0.000	0.000	0.046	pg162_def.cx9a2a_bee
0.000	0.000	94.750	4.917	0.333	0.000	0.000	0.000	0.000	0.000	0.051	my8036_rel.cz10a_bee
0.000	0.000	99.422	0.578	0.000	0.000	0.000	0.000	0.000	0.000	0.014	fbmy8028_rel_221222.cza1_bee
qr1000.L5
- qr1000.L5: range queries with 1000 insert/s per client
- Legend for results is here.
- Each entry lists the percentage of responses that fit in that bucket (slower than max time for previous bucket, faster than min time for next bucket).
Query response time histogram
256us	1ms	4ms	16ms	64ms	256ms	1s	4s	16s	gt	max	tag
98.003	1.985	0.007	0.004	nonzero	nonzero	0.000	0.000	0.000	0.000	0.133	pg162_def.cx9a2a_bee
63.786	36.198	0.015	0.001	nonzero	0.000	0.000	0.000	0.000	0.000	0.032	my8036_rel.cz10a_bee
0.190	67.602	3.795	28.409	0.003	nonzero	0.000	0.000	0.000	0.000	0.192	fbmy8028_rel_221222.cza1_bee
Insert response time histogram
256us	1ms	4ms	16ms	64ms	256ms	1s	4s	16s	gt	max	tag
0.000	0.000	0.000	91.197	8.803	0.000	0.000	0.000	0.000	0.000	0.053	pg162_def.cx9a2a_bee
0.000	0.000	0.000	87.567	12.433	0.000	0.000	0.000	0.000	0.000	0.045	my8036_rel.cz10a_bee
0.000	0.000	99.333	0.594	0.069	0.003	0.000	0.000	0.000	0.000	0.083	fbmy8028_rel_221222.cza1_bee
Delete response time histogram
256us	1ms	4ms	16ms	64ms	256ms	1s	4s	16s	gt	max	tag
0.000	0.000	0.000	0.000	100.000	0.000	0.000	0.000	0.000	0.000	0.054	pg162_def.cx9a2a_bee
0.000	0.000	96.558	3.411	0.031	0.000	0.000	0.000	0.000	0.000	0.049	my8036_rel.cz10a_bee
0.000	0.000	98.222	1.692	0.083	0.003	0.000	0.000	0.000	0.000	0.068	fbmy8028_rel_221222.cza1_bee
qp1000.L6
- qp1000.L6: point queries with 1000 insert/s per client
- Legend for results is here.
- Each entry lists the percentage of responses that fit in that bucket (slower than max time for previous bucket, faster than min time for next bucket).
Query response time histogram
256us	1ms	4ms	16ms	64ms	256ms	1s	4s	16s	gt	max	tag
0.000	0.000	97.610	2.387	0.003	0.000	0.000	0.000	0.000	0.000	0.038	pg162_def.cx9a2a_bee
0.000	0.001	97.884	1.922	0.194	0.000	0.000	0.000	0.000	0.000	0.056	my8036_rel.cz10a_bee
0.000	8.633	91.314	0.052	nonzero	nonzero	0.000	0.000	0.000	0.000	0.102	fbmy8028_rel_221222.cza1_bee
Insert response time histogram
256us	1ms	4ms	16ms	64ms	256ms	1s	4s	16s	gt	max	tag
0.000	0.000	0.000	97.833	2.167	0.000	0.000	0.000	0.000	0.000	0.036	pg162_def.cx9a2a_bee
0.000	0.000	0.000	82.747	16.672	0.581	0.000	0.000	0.000	0.000	0.117	my8036_rel.cz10a_bee
0.000	0.000	99.283	0.517	0.197	0.003	0.000	0.000	0.000	0.000	0.080	fbmy8028_rel_221222.cza1_bee
Delete response time histogram
256us	1ms	4ms	16ms	64ms	256ms	1s	4s	16s	gt	max	tag
0.000	0.000	0.000	0.000	99.900	0.100	0.000	0.000	0.000	0.000	0.110	pg162_def.cx9a2a_bee
0.000	0.000	95.156	4.647	0.194	0.003	0.000	0.000	0.000	0.000	0.067	my8036_rel.cz10a_bee
0.000	0.000	99.175	0.625	0.197	0.003	0.000	0.000	0.000	0.000	0.088	fbmy8028_rel_221222.cza1_bee