Introduction
This is a report for the insert benchmark with 800M docs and 1 client(s). It is generated by scripts (bash, awk, sed) and Tufte might not be impressed. An overview of the insert benchmark is here and a short update is here. Below, by DBMS, I mean DBMS+version.config. An example is my8020.c10b40 where my means MySQL, 8020 is version 8.0.20 and c10b40 is the name for the configuration file.
The test server has 8 AMD cores, 16G RAM and an NVMe SSD. It is described here as the Beelink. The benchmark was run with 1 client and there were 1 or 3 connections per client (1 for queries or inserts without rate limits, 1+1 for rate limited inserts+deletes). It uses 1 table. It loads 800M rows per table without secondary indexes, creates 3 secondary indexes per table, then inserts 4m+1m rows per table with a delete per insert to avoid growing the table. It then does 6 read+write tests for 1800s each that do queries as fast as possible with 100,100,500,500,1000,1000 inserts/s and the same for deletes/s per client concurrent with the queries. The database is cached in memory. Clients and the DBMS share one server. The per-database configs are in the per-database subdirectories here.
The tested DBMS are:
- pg162_def.cx9a2_bee - Postgres 16.2, cx9a2 config
- pg162_def.cx9a2a_bee - Postgres 16.2, cx9a2a config that adds autovacuum_vacuum_cost_delay= 1ms
- pg162_def.cx9a2b_bee - Postgres 16.2, cx9a2b config that adds autovacuum_vacuum_cost_delay=0
- pg162_def.cx9a2c_bee - Postgres 16.2, cx9a2c config that adds autovacuum_naptime=1s
- pg162_def.cx9a2e_bee - Postgres 16.2, cx9a2e config that adds autovacuum_vacuum_scale_factor=0.01
- pg162_def.cx9a2f_bee - Postgres 16.2, cx9a2f config that adds autovacuum_vacuum_insert_scale_factor=0.01
- pg162_def.cx9a2g_bee - Postgres 16.2, cx9a2g config that adds autovacuum_vacuum_cost_limit=8000
- pg162_def.cx9a2acef_bee - Postgres 16.2, cx9a2acef config that combines cx9a2a, cx9a2c, cz9a2e, cx9a2f configs
- pg162_def.cx9a2bcef_bee - Postgres 16.2, cx9a2bcef config that combines cx9a2b, cx9a2c, cz9a2e, cx9a2f configs
Contents
- Summary
- l.i0: load without secondary indexes
- l.x: create secondary indexes
- l.i1: continue load after secondary indexes created with 50 inserts per transaction
- l.i2: continue load after secondary indexes created with 5 inserts per transaction
- qr100.L1: range queries with 100 insert/s per client
- qp100.L2: point queries with 100 insert/s per client
- qr500.L3: range queries with 500 insert/s per client
- qp500.L4: point queries with 500 insert/s per client
- qr1000.L5: range queries with 1000 insert/s per client
- qp1000.L6: point queries with 1000 insert/s per client
Summary
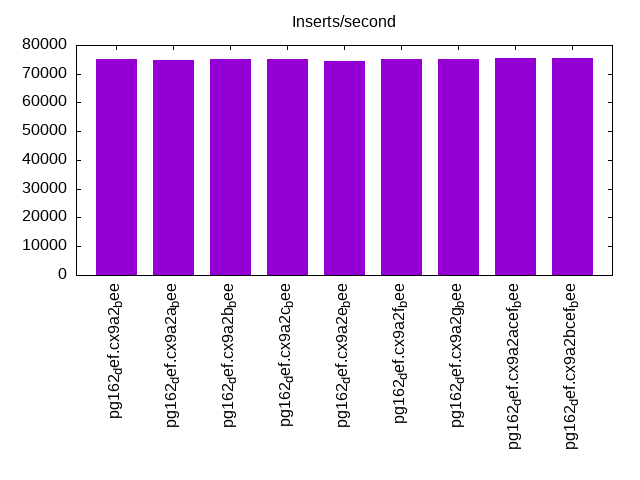
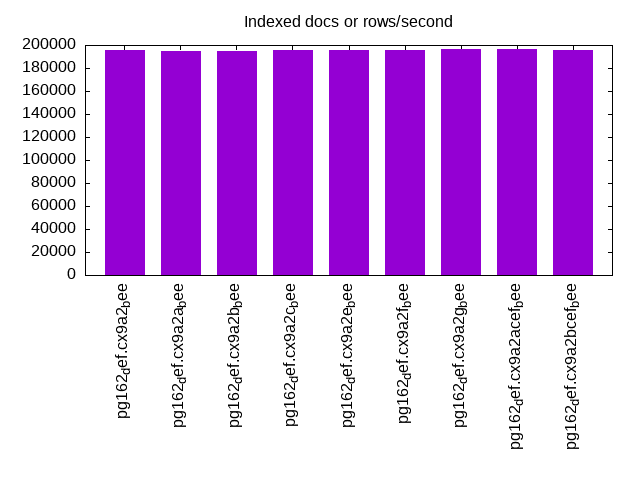
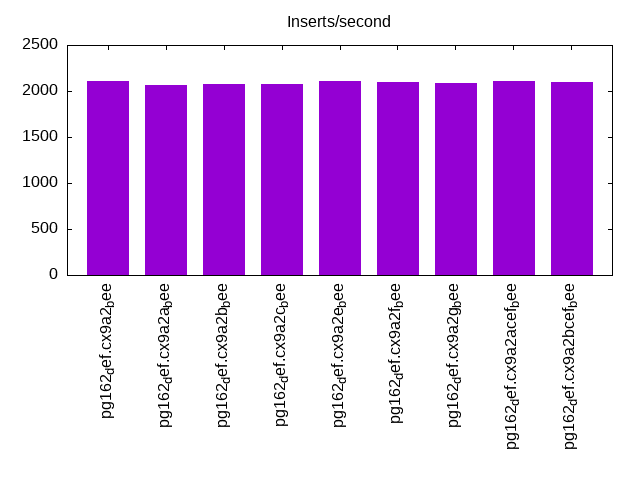
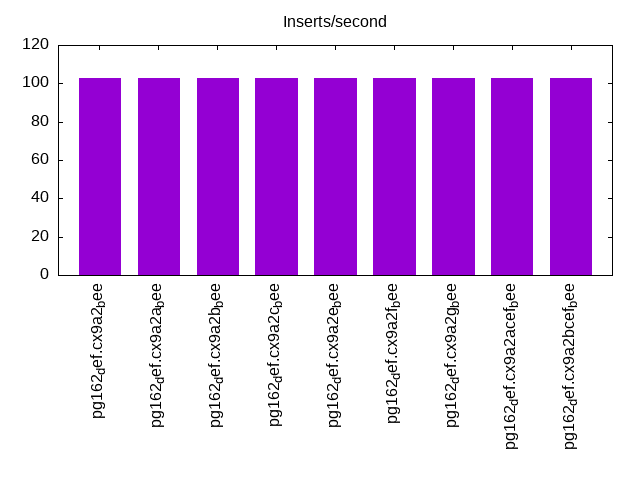
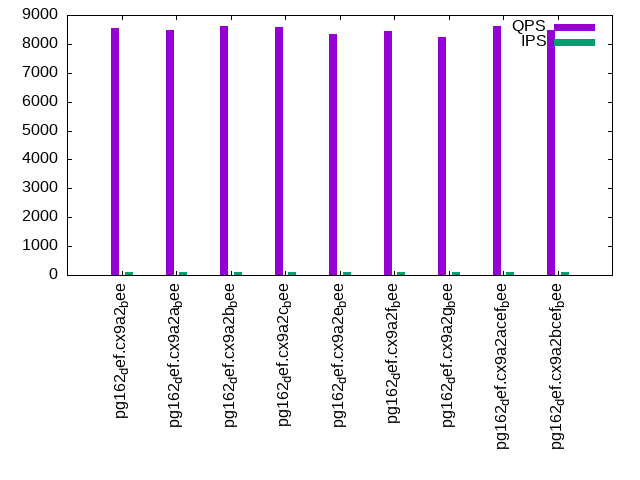
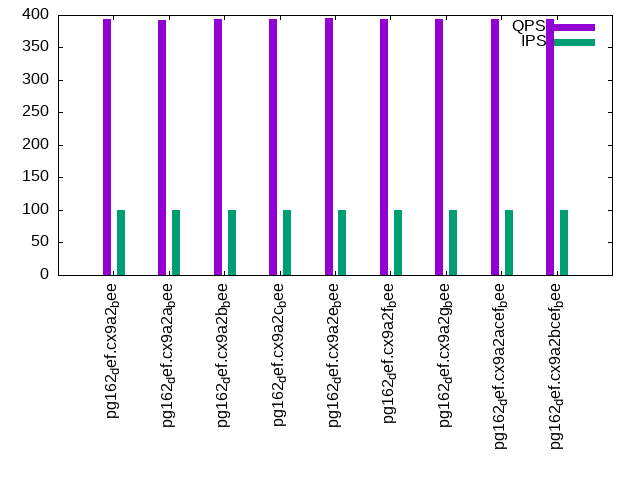
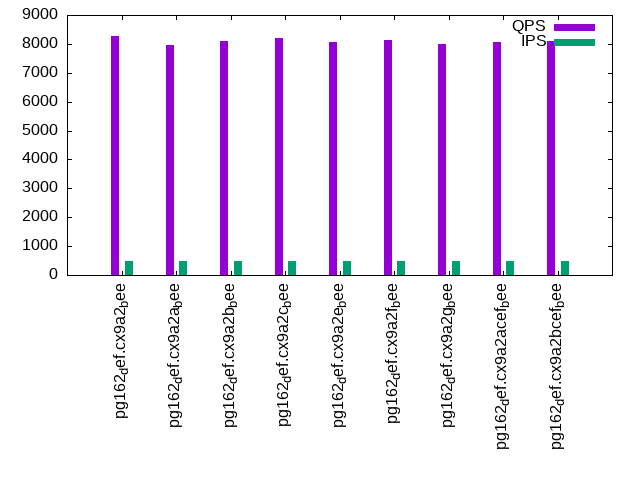
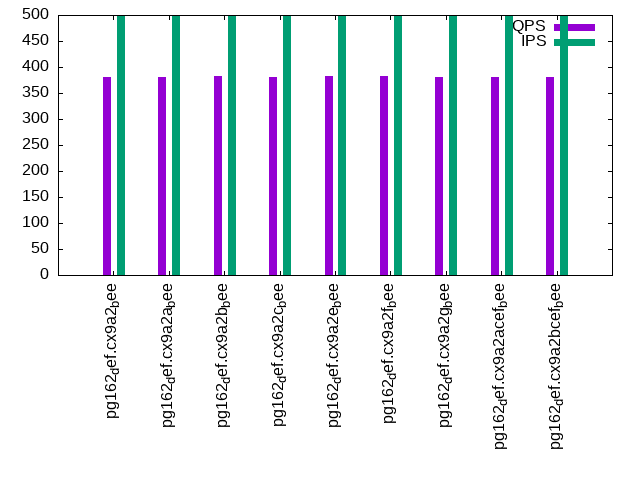
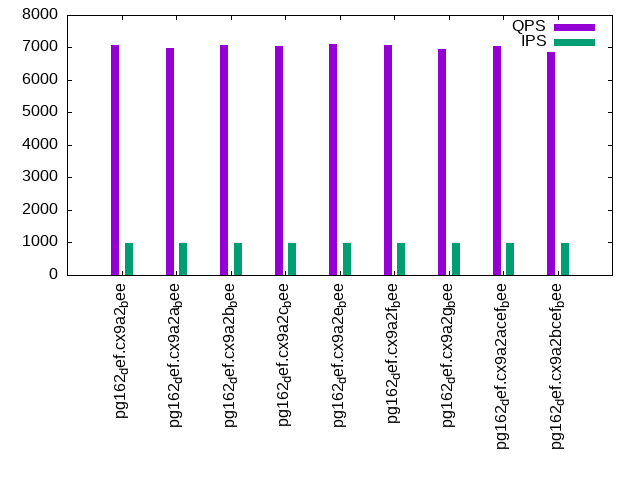
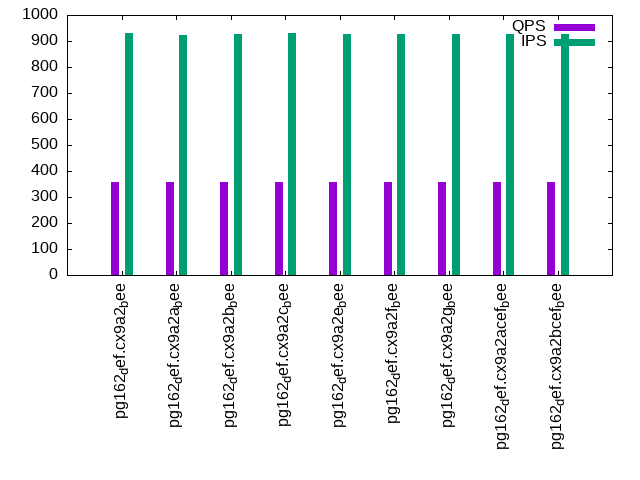
The numbers are inserts/s for l.i0, l.i1 and l.i2, indexed docs (or rows) /s for l.x and queries/s for qr100, qp100 thru qr1000, qp1000" The values are the average rate over the entire test for inserts (IPS) and queries (QPS). The range of values for IPS and QPS is split into 3 parts: bottom 25%, middle 50%, top 25%. Values in the bottom 25% have a red background, values in the top 25% have a green background and values in the middle have no color. A gray background is used for values that can be ignored because the DBMS did not sustain the target insert rate. Red backgrounds are not used when the minimum value is within 80% of the max value.
| dbms | l.i0 | l.x | l.i1 | l.i2 | qr100 | qp100 | qr500 | qp500 | qr1000 | qp1000 |
|---|---|---|---|---|---|---|---|---|---|---|
| pg162_def.cx9a2_bee | 75160 | 195647 | 2104 | 103 | 8559 | 394 | 8258 | 381 | 7071 | 359 |
| pg162_def.cx9a2a_bee | 74864 | 194789 | 2068 | 103 | 8484 | 393 | 7964 | 380 | 6980 | 357 |
| pg162_def.cx9a2b_bee | 75153 | 194742 | 2078 | 103 | 8630 | 394 | 8088 | 382 | 7076 | 358 |
| pg162_def.cx9a2c_bee | 75174 | 195743 | 2078 | 103 | 8573 | 394 | 8199 | 381 | 7049 | 358 |
| pg162_def.cx9a2e_bee | 74585 | 195503 | 2110 | 103 | 8347 | 395 | 8062 | 382 | 7102 | 358 |
| pg162_def.cx9a2f_bee | 74962 | 195743 | 2095 | 103 | 8458 | 394 | 8150 | 382 | 7066 | 358 |
| pg162_def.cx9a2g_bee | 74970 | 196560 | 2084 | 103 | 8254 | 394 | 7979 | 381 | 6943 | 358 |
| pg162_def.cx9a2acef_bee | 75400 | 196271 | 2104 | 103 | 8608 | 394 | 8068 | 381 | 7059 | 358 |
| pg162_def.cx9a2bcef_bee | 75507 | 195599 | 2101 | 103 | 8483 | 394 | 8111 | 381 | 6872 | 359 |
This table has relative throughput, throughput for the DBMS relative to the DBMS in the first line, using the absolute throughput from the previous table. Values less than 0.95 have a yellow background. Values greater than 1.05 have a blue background.
| dbms | l.i0 | l.x | l.i1 | l.i2 | qr100 | qp100 | qr500 | qp500 | qr1000 | qp1000 |
|---|---|---|---|---|---|---|---|---|---|---|
| pg162_def.cx9a2_bee | 1.00 | 1.00 | 1.00 | 1.00 | 1.00 | 1.00 | 1.00 | 1.00 | 1.00 | 1.00 |
| pg162_def.cx9a2a_bee | 1.00 | 1.00 | 0.98 | 1.00 | 0.99 | 1.00 | 0.96 | 1.00 | 0.99 | 0.99 |
| pg162_def.cx9a2b_bee | 1.00 | 1.00 | 0.99 | 1.00 | 1.01 | 1.00 | 0.98 | 1.00 | 1.00 | 1.00 |
| pg162_def.cx9a2c_bee | 1.00 | 1.00 | 0.99 | 1.00 | 1.00 | 1.00 | 0.99 | 1.00 | 1.00 | 1.00 |
| pg162_def.cx9a2e_bee | 0.99 | 1.00 | 1.00 | 1.00 | 0.98 | 1.00 | 0.98 | 1.00 | 1.00 | 1.00 |
| pg162_def.cx9a2f_bee | 1.00 | 1.00 | 1.00 | 1.00 | 0.99 | 1.00 | 0.99 | 1.00 | 1.00 | 1.00 |
| pg162_def.cx9a2g_bee | 1.00 | 1.00 | 0.99 | 1.00 | 0.96 | 1.00 | 0.97 | 1.00 | 0.98 | 1.00 |
| pg162_def.cx9a2acef_bee | 1.00 | 1.00 | 1.00 | 1.00 | 1.01 | 1.00 | 0.98 | 1.00 | 1.00 | 1.00 |
| pg162_def.cx9a2bcef_bee | 1.00 | 1.00 | 1.00 | 1.00 | 0.99 | 1.00 | 0.98 | 1.00 | 0.97 | 1.00 |
This lists the average rate of inserts/s for the tests that do inserts concurrent with queries. For such tests the query rate is listed in the table above. The read+write tests are setup so that the insert rate should match the target rate every second. Cells that are not at least 95% of the target have a red background to indicate a failure to satisfy the target.
| dbms | qr100.L1 | qp100.L2 | qr500.L3 | qp500.L4 | qr1000.L5 | qp1000.L6 |
|---|---|---|---|---|---|---|
| pg162_def.cx9a2_bee | 100 | 100 | 499 | 499 | 998 | 929 |
| pg162_def.cx9a2a_bee | 100 | 100 | 499 | 499 | 997 | 924 |
| pg162_def.cx9a2b_bee | 100 | 100 | 499 | 499 | 998 | 926 |
| pg162_def.cx9a2c_bee | 100 | 100 | 499 | 499 | 998 | 929 |
| pg162_def.cx9a2e_bee | 100 | 100 | 499 | 499 | 998 | 927 |
| pg162_def.cx9a2f_bee | 100 | 100 | 499 | 499 | 998 | 925 |
| pg162_def.cx9a2g_bee | 100 | 100 | 499 | 499 | 998 | 926 |
| pg162_def.cx9a2acef_bee | 100 | 100 | 498 | 498 | 998 | 925 |
| pg162_def.cx9a2bcef_bee | 100 | 100 | 499 | 499 | 998 | 926 |
| target | 100 | 100 | 500 | 500 | 1000 | 1000 |
l.i0
l.i0: load without secondary indexes. Graphs for performance per 1-second interval are here.
Average throughput:
Insert response time histogram: each cell has the percentage of responses that take <= the time in the header and max is the max response time in seconds. For the max column values in the top 25% of the range have a red background and in the bottom 25% of the range have a green background. The red background is not used when the min value is within 80% of the max value.
| dbms | 256us | 1ms | 4ms | 16ms | 64ms | 256ms | 1s | 4s | 16s | gt | max |
|---|---|---|---|---|---|---|---|---|---|---|---|
| pg162_def.cx9a2_bee | 99.998 | 0.001 | nonzero | 0.058 | |||||||
| pg162_def.cx9a2a_bee | 99.998 | 0.001 | nonzero | nonzero | 0.080 | ||||||
| pg162_def.cx9a2b_bee | 99.998 | 0.002 | 0.001 | nonzero | 0.077 | ||||||
| pg162_def.cx9a2c_bee | 99.999 | 0.001 | nonzero | 0.060 | |||||||
| pg162_def.cx9a2e_bee | 99.998 | 0.001 | 0.001 | 0.054 | |||||||
| pg162_def.cx9a2f_bee | 99.999 | 0.001 | nonzero | 0.061 | |||||||
| pg162_def.cx9a2g_bee | 99.999 | 0.001 | 0.001 | 0.058 | |||||||
| pg162_def.cx9a2acef_bee | 99.999 | 0.001 | nonzero | 0.055 | |||||||
| pg162_def.cx9a2bcef_bee | 99.999 | 0.001 | nonzero | 0.059 |
Performance metrics for the DBMS listed above. Some are normalized by throughput, others are not. Legend for results is here.
ips	qps	rps	rmbps	wps	wmbps	rpq	rkbpq	wpi	wkbpi	csps	cpups	cspq	cpupq	dbgb1	dbgb2	rss	maxop	p50	p99	tag
75160	0	31	0.2	107.7	31.0	0.000	0.003	0.001	0.422	9128	23.0	0.121	24	76.5	116.6	0.3	0.058	75345	73200	pg162_def.cx9a2_bee
74864	0	32	0.3	107.6	30.7	0.000	0.003	0.001	0.420	9095	23.0	0.121	25	76.5	116.6	1.5	0.080	75020	73014	pg162_def.cx9a2a_bee
75153	0	31	0.2	104.7	30.8	0.000	0.003	0.001	0.420	9129	23.0	0.121	24	76.5	116.6	3.6	0.077	75333	73269	pg162_def.cx9a2b_bee
75174	0	33	0.3	114.0	30.8	0.000	0.004	0.002	0.420	9171	23.2	0.122	25	76.5	116.6	1.5	0.060	75333	73247	pg162_def.cx9a2c_bee
74585	0	31	0.2	105.0	30.7	0.000	0.003	0.001	0.422	9060	22.9	0.121	25	76.5	116.6	1.2	0.054	74817	72716	pg162_def.cx9a2e_bee
74962	0	30	0.2	107.5	30.6	0.000	0.003	0.001	0.418	9102	23.1	0.121	25	76.5	116.6	0.1	0.061	75134	73018	pg162_def.cx9a2f_bee
74970	0	31	0.2	104.5	31.0	0.000	0.003	0.001	0.423	9099	23.1	0.121	25	76.5	116.6	3.7	0.058	75122	73118	pg162_def.cx9a2g_bee
75400	0	31	0.2	108.0	30.8	0.000	0.003	0.001	0.418	9190	23.2	0.122	25	76.5	116.6	0.5	0.055	75617	73507	pg162_def.cx9a2acef_bee
75507	0	31	0.2	108.0	30.8	0.000	0.003	0.001	0.418	9199	23.2	0.122	25	76.5	116.6	0.6	0.059	75719	73699	pg162_def.cx9a2bcef_bee
l.x
l.x: create secondary indexes.
Average throughput:
Performance metrics for the DBMS listed above. Some are normalized by throughput, others are not. Legend for results is here.
ips	qps	rps	rmbps	wps	wmbps	rpq	rkbpq	wpi	wkbpi	csps	cpups	cspq	cpupq	dbgb1	dbgb2	rss	maxop	p50	p99	tag
195647	0	592	73.6	201.6	73.1	0.003	0.385	0.001	0.383	393	12.4	0.002	5	153.6	193.7	10.3	0.005	NA	NA	pg162_def.cx9a2_bee
194789	0	590	73.2	200.2	72.6	0.003	0.385	0.001	0.382	387	12.4	0.002	5	153.6	193.7	10.2	0.005	NA	NA	pg162_def.cx9a2a_bee
194742	0	590	73.2	198.9	72.6	0.003	0.385	0.001	0.382	392	12.4	0.002	5	153.6	193.7	10.3	0.004	NA	NA	pg162_def.cx9a2b_bee
195743	0	592	73.6	196.8	72.8	0.003	0.385	0.001	0.381	512	12.6	0.003	5	153.6	193.7	10.2	0.004	NA	NA	pg162_def.cx9a2c_bee
195503	0	592	73.5	199.3	73.0	0.003	0.385	0.001	0.382	396	12.4	0.002	5	153.6	193.7	10.3	0.005	NA	NA	pg162_def.cx9a2e_bee
195743	0	592	73.6	195.9	72.9	0.003	0.385	0.001	0.381	416	12.4	0.002	5	153.6	193.7	10.3	0.004	NA	NA	pg162_def.cx9a2f_bee
196560	0	595	74.0	195.8	73.2	0.003	0.385	0.001	0.382	413	12.4	0.002	5	153.6	193.7	10.3	0.009	NA	NA	pg162_def.cx9a2g_bee
196271	0	594	73.8	200.3	73.0	0.003	0.385	0.001	0.381	517	12.6	0.003	5	153.6	193.7	10.3	0.005	NA	NA	pg162_def.cx9a2acef_bee
195599	0	592	73.6	202.1	72.7	0.003	0.385	0.001	0.381	502	12.6	0.003	5	153.6	193.7	10.3	0.004	NA	NA	pg162_def.cx9a2bcef_bee
l.i1
l.i1: continue load after secondary indexes created with 50 inserts per transaction. Graphs for performance per 1-second interval are here.
Average throughput:
Insert response time histogram: each cell has the percentage of responses that take <= the time in the header and max is the max response time in seconds. For the max column values in the top 25% of the range have a red background and in the bottom 25% of the range have a green background. The red background is not used when the min value is within 80% of the max value.
| dbms | 256us | 1ms | 4ms | 16ms | 64ms | 256ms | 1s | 4s | 16s | gt | max |
|---|---|---|---|---|---|---|---|---|---|---|---|
| pg162_def.cx9a2_bee | 98.520 | 1.480 | 0.049 | ||||||||
| pg162_def.cx9a2a_bee | 97.575 | 2.425 | 0.061 | ||||||||
| pg162_def.cx9a2b_bee | 97.765 | 2.235 | 0.053 | ||||||||
| pg162_def.cx9a2c_bee | 97.320 | 2.680 | 0.056 | ||||||||
| pg162_def.cx9a2e_bee | 98.361 | 1.639 | 0.050 | ||||||||
| pg162_def.cx9a2f_bee | 98.650 | 1.350 | 0.060 | ||||||||
| pg162_def.cx9a2g_bee | 97.821 | 2.179 | 0.056 | ||||||||
| pg162_def.cx9a2acef_bee | 98.406 | 1.593 | 0.001 | 0.103 | |||||||
| pg162_def.cx9a2bcef_bee | 98.586 | 1.414 | 0.054 |
Delete response time histogram: each cell has the percentage of responses that take <= the time in the header and max is the max response time in seconds. For the max column values in the top 25% of the range have a red background and in the bottom 25% of the range have a green background. The red background is not used when the min value is within 80% of the max value.
| dbms | 256us | 1ms | 4ms | 16ms | 64ms | 256ms | 1s | 4s | 16s | gt | max |
|---|---|---|---|---|---|---|---|---|---|---|---|
| pg162_def.cx9a2_bee | 0.004 | 0.316 | 5.766 | 30.134 | 63.780 | 0.047 | |||||
| pg162_def.cx9a2a_bee | 0.305 | 5.550 | 30.056 | 64.089 | 0.045 | ||||||
| pg162_def.cx9a2b_bee | 0.001 | 0.294 | 5.792 | 29.755 | 64.157 | 0.045 | |||||
| pg162_def.cx9a2c_bee | 0.298 | 5.440 | 30.814 | 63.449 | 0.046 | ||||||
| pg162_def.cx9a2e_bee | 0.285 | 5.409 | 30.789 | 63.518 | 0.044 | ||||||
| pg162_def.cx9a2f_bee | 0.003 | 0.334 | 6.021 | 29.491 | 64.151 | 0.047 | |||||
| pg162_def.cx9a2g_bee | 0.338 | 5.361 | 30.134 | 64.168 | 0.045 | ||||||
| pg162_def.cx9a2acef_bee | 0.335 | 5.848 | 29.834 | 63.984 | 0.046 | ||||||
| pg162_def.cx9a2bcef_bee | 0.001 | 0.448 | 5.470 | 30.650 | 63.431 | 0.046 |
Performance metrics for the DBMS listed above. Some are normalized by throughput, others are not. Legend for results is here.
ips	qps	rps	rmbps	wps	wmbps	rpq	rkbpq	wpi	wkbpi	csps	cpups	cspq	cpupq	dbgb1	dbgb2	rss	maxop	p50	p99	tag
2104	0	3522	27.9	3562.2	52.5	1.674	13.563	1.693	25.548	8227	15.5	3.910	589	154.3	194.3	10.0	0.049	1698	1148	pg162_def.cx9a2_bee
2068	0	3443	27.3	3497.6	50.5	1.665	13.493	1.691	25.004	8065	15.3	3.900	592	154.3	194.3	9.4	0.061	1698	1148	pg162_def.cx9a2a_bee
2078	0	3455	27.3	3507.0	50.5	1.663	13.478	1.688	24.889	8076	15.3	3.887	589	154.3	194.3	9.9	0.053	1698	1149	pg162_def.cx9a2b_bee
2078	0	3461	27.4	3511.5	51.2	1.666	13.503	1.690	25.253	8187	15.5	3.940	597	154.3	194.3	9.6	0.056	1747	1149	pg162_def.cx9a2c_bee
2110	0	3510	27.8	3574.9	51.6	1.664	13.484	1.695	25.064	8181	15.4	3.878	584	154.3	194.3	9.9	0.050	1698	1148	pg162_def.cx9a2e_bee
2095	0	3490	27.6	3548.2	52.3	1.665	13.501	1.693	25.565	8193	15.5	3.910	592	154.3	194.3	9.2	0.060	1698	1149	pg162_def.cx9a2f_bee
2084	0	3472	27.5	3525.6	50.9	1.666	13.503	1.691	24.993	8112	15.2	3.892	583	154.3	194.3	9.8	0.056	1698	1148	pg162_def.cx9a2g_bee
2104	0	3501	27.7	3561.0	52.5	1.664	13.486	1.692	25.536	8268	15.7	3.930	597	154.3	194.3	9.6	0.103	1698	1148	pg162_def.cx9a2acef_bee
2101	0	3499	27.7	3558.7	52.4	1.665	13.499	1.694	25.560	8274	15.8	3.938	602	154.3	194.3	9.3	0.054	1698	1149	pg162_def.cx9a2bcef_bee
l.i2
l.i2: continue load after secondary indexes created with 5 inserts per transaction. Graphs for performance per 1-second interval are here.
Average throughput:
Insert response time histogram: each cell has the percentage of responses that take <= the time in the header and max is the max response time in seconds. For the max column values in the top 25% of the range have a red background and in the bottom 25% of the range have a green background. The red background is not used when the min value is within 80% of the max value.
| dbms | 256us | 1ms | 4ms | 16ms | 64ms | 256ms | 1s | 4s | 16s | gt | max |
|---|---|---|---|---|---|---|---|---|---|---|---|
| pg162_def.cx9a2_bee | 0.008 | 98.650 | 1.325 | 0.017 | 0.022 | ||||||
| pg162_def.cx9a2a_bee | 0.005 | 98.879 | 1.099 | 0.017 | 0.034 | ||||||
| pg162_def.cx9a2b_bee | 0.006 | 98.862 | 1.114 | 0.018 | 0.033 | ||||||
| pg162_def.cx9a2c_bee | 0.003 | 98.582 | 1.399 | 0.015 | 0.034 | ||||||
| pg162_def.cx9a2e_bee | 0.007 | 99.227 | 0.751 | 0.015 | 0.033 | ||||||
| pg162_def.cx9a2f_bee | 0.006 | 98.643 | 1.336 | 0.016 | 0.033 | ||||||
| pg162_def.cx9a2g_bee | 0.009 | 98.893 | 1.083 | 0.015 | 0.021 | ||||||
| pg162_def.cx9a2acef_bee | 0.005 | 97.520 | 2.462 | 0.013 | 0.034 | ||||||
| pg162_def.cx9a2bcef_bee | 0.005 | 97.787 | 2.193 | 0.015 | 0.033 |
Delete response time histogram: each cell has the percentage of responses that take <= the time in the header and max is the max response time in seconds. For the max column values in the top 25% of the range have a red background and in the bottom 25% of the range have a green background. The red background is not used when the min value is within 80% of the max value.
| dbms | 256us | 1ms | 4ms | 16ms | 64ms | 256ms | 1s | 4s | 16s | gt | max |
|---|---|---|---|---|---|---|---|---|---|---|---|
| pg162_def.cx9a2_bee | 99.999 | 0.001 | 0.112 | ||||||||
| pg162_def.cx9a2a_bee | 99.999 | 0.001 | 0.089 | ||||||||
| pg162_def.cx9a2b_bee | 99.999 | 0.001 | 0.110 | ||||||||
| pg162_def.cx9a2c_bee | 99.999 | 0.001 | 0.110 | ||||||||
| pg162_def.cx9a2e_bee | 99.999 | 0.001 | 0.109 | ||||||||
| pg162_def.cx9a2f_bee | 99.999 | 0.001 | 0.099 | ||||||||
| pg162_def.cx9a2g_bee | 99.999 | 0.001 | 0.106 | ||||||||
| pg162_def.cx9a2acef_bee | 99.999 | 0.001 | 0.109 | ||||||||
| pg162_def.cx9a2bcef_bee | 99.999 | 0.001 | 0.111 |
Performance metrics for the DBMS listed above. Some are normalized by throughput, others are not. Legend for results is here.
ips	qps	rps	rmbps	wps	wmbps	rpq	rkbpq	wpi	wkbpi	csps	cpups	cspq	cpupq	dbgb1	dbgb2	rss	maxop	p50	p99	tag
103	0	166	1.3	221.8	3.3	1.606	13.026	2.145	32.314	1000	12.4	9.673	9594	154.5	187.4	10.1	0.022	105	90	pg162_def.cx9a2_bee
103	0	165	1.3	219.9	3.3	1.606	13.033	2.137	32.447	989	12.4	9.616	9640	154.5	186.7	10.1	0.034	100	90	pg162_def.cx9a2a_bee
103	0	166	1.3	221.0	3.3	1.608	13.046	2.141	32.598	996	12.5	9.652	9690	154.5	186.7	10.2	0.033	105	90	pg162_def.cx9a2b_bee
103	0	166	1.3	220.3	3.3	1.609	13.050	2.137	32.399	1094	12.8	10.608	9932	154.5	186.6	10.1	0.034	105	90	pg162_def.cx9a2c_bee
103	0	166	1.3	220.1	3.3	1.608	13.040	2.131	32.333	996	12.4	9.647	9603	154.5	186.6	10.1	0.033	105	90	pg162_def.cx9a2e_bee
103	0	169	1.3	222.7	3.3	1.638	13.284	2.160	32.488	997	12.4	9.670	9622	154.5	186.2	10.1	0.033	105	90	pg162_def.cx9a2f_bee
103	0	166	1.3	220.4	3.3	1.608	13.046	2.136	32.451	995	12.4	9.644	9612	154.5	186.7	10.1	0.021	105	90	pg162_def.cx9a2g_bee
103	0	165	1.3	221.8	3.3	1.607	13.037	2.156	32.451	1086	12.8	10.549	9951	154.5	186.2	10.1	0.034	105	90	pg162_def.cx9a2acef_bee
103	0	166	1.3	223.1	3.3	1.607	13.037	2.162	32.505	1088	12.8	10.546	9923	154.5	186.2	10.1	0.033	105	90	pg162_def.cx9a2bcef_bee
qr100.L1
qr100.L1: range queries with 100 insert/s per client. Graphs for performance per 1-second interval are here.
Average throughput:
Query response time histogram: each cell has the percentage of responses that take <= the time in the header and max is the max response time in seconds. For max values in the top 25% of the range have a red background and in the bottom 25% of the range have a green background. The red background is not used when the min value is within 80% of the max value.
| dbms | 256us | 1ms | 4ms | 16ms | 64ms | 256ms | 1s | 4s | 16s | gt | max |
|---|---|---|---|---|---|---|---|---|---|---|---|
| pg162_def.cx9a2_bee | 99.927 | 0.072 | nonzero | 0.001 | nonzero | 0.016 | |||||
| pg162_def.cx9a2a_bee | 99.919 | 0.080 | nonzero | 0.001 | 0.010 | ||||||
| pg162_def.cx9a2b_bee | 99.919 | 0.080 | 0.001 | 0.001 | 0.010 | ||||||
| pg162_def.cx9a2c_bee | 99.886 | 0.113 | nonzero | 0.001 | 0.015 | ||||||
| pg162_def.cx9a2e_bee | 99.916 | 0.083 | nonzero | 0.001 | 0.010 | ||||||
| pg162_def.cx9a2f_bee | 99.929 | 0.070 | nonzero | 0.001 | 0.010 | ||||||
| pg162_def.cx9a2g_bee | 99.920 | 0.079 | nonzero | 0.001 | 0.010 | ||||||
| pg162_def.cx9a2acef_bee | 99.841 | 0.157 | 0.001 | 0.001 | 0.010 | ||||||
| pg162_def.cx9a2bcef_bee | 99.880 | 0.119 | nonzero | 0.001 | 0.010 |
Insert response time histogram: each cell has the percentage of responses that take <= the time in the header and max is the max response time in seconds. For max values in the top 25% of the range have a red background and in the bottom 25% of the range have a green background. The red background is not used when the min value is within 80% of the max value.
| dbms | 256us | 1ms | 4ms | 16ms | 64ms | 256ms | 1s | 4s | 16s | gt | max |
|---|---|---|---|---|---|---|---|---|---|---|---|
| pg162_def.cx9a2_bee | 50.611 | 49.389 | 0.030 | ||||||||
| pg162_def.cx9a2a_bee | 51.083 | 48.917 | 0.031 | ||||||||
| pg162_def.cx9a2b_bee | 50.694 | 49.306 | 0.035 | ||||||||
| pg162_def.cx9a2c_bee | 48.028 | 51.972 | 0.031 | ||||||||
| pg162_def.cx9a2e_bee | 51.583 | 48.417 | 0.031 | ||||||||
| pg162_def.cx9a2f_bee | 43.111 | 56.889 | 0.032 | ||||||||
| pg162_def.cx9a2g_bee | 49.944 | 50.056 | 0.031 | ||||||||
| pg162_def.cx9a2acef_bee | 47.639 | 52.361 | 0.031 | ||||||||
| pg162_def.cx9a2bcef_bee | 53.861 | 46.139 | 0.031 |
Delete response time histogram: each cell has the percentage of responses that take <= the time in the header and max is the max response time in seconds. For max values in the top 25% of the range have a red background and in the bottom 25% of the range have a green background. The red background is not used when the min value is within 80% of the max value.
| dbms | 256us | 1ms | 4ms | 16ms | 64ms | 256ms | 1s | 4s | 16s | gt | max |
|---|---|---|---|---|---|---|---|---|---|---|---|
| pg162_def.cx9a2_bee | 24.222 | 75.611 | 0.167 | 0.010 | |||||||
| pg162_def.cx9a2a_bee | 23.472 | 76.472 | 0.056 | 0.009 | |||||||
| pg162_def.cx9a2b_bee | 23.972 | 75.972 | 0.056 | 0.009 | |||||||
| pg162_def.cx9a2c_bee | 23.444 | 76.444 | 0.111 | 0.009 | |||||||
| pg162_def.cx9a2e_bee | 23.222 | 76.639 | 0.139 | 0.010 | |||||||
| pg162_def.cx9a2f_bee | 23.167 | 76.667 | 0.167 | 0.008 | |||||||
| pg162_def.cx9a2g_bee | 23.833 | 76.056 | 0.111 | 0.009 | |||||||
| pg162_def.cx9a2acef_bee | 0.028 | 25.500 | 74.222 | 0.250 | 0.009 | ||||||
| pg162_def.cx9a2bcef_bee | 23.917 | 76.028 | 0.056 | 0.009 |
Performance metrics for the DBMS listed above. Some are normalized by throughput, others are not. Legend for results is here.
ips	qps	rps	rmbps	wps	wmbps	rpq	rkbpq	wpi	wkbpi	csps	cpups	cspq	cpupq	dbgb1	dbgb2	rss	maxop	p50	p99	tag
100	8559	167	1.4	15.0	1.5	0.019	0.163	0.150	15.418	33160	12.5	3.874	117	154.5	192.2	10.1	0.016	8254	8024	pg162_def.cx9a2_bee
100	8484	166	1.4	15.2	1.5	0.020	0.164	0.152	15.426	32880	12.7	3.875	120	154.5	190.4	10.1	0.010	8087	7861	pg162_def.cx9a2a_bee
100	8630	167	1.4	15.0	1.5	0.019	0.161	0.150	15.476	33444	12.7	3.875	118	154.5	190.6	10.1	0.010	8170	7943	pg162_def.cx9a2b_bee
100	8573	166	1.4	15.1	1.5	0.019	0.162	0.152	15.414	33324	13.7	3.887	128	154.5	189.9	9.9	0.015	8183	7973	pg162_def.cx9a2c_bee
100	8347	167	1.4	14.9	1.5	0.020	0.167	0.149	15.434	32378	12.6	3.879	121	154.5	191.4	10.2	0.010	8119	7926	pg162_def.cx9a2e_bee
100	8458	167	1.4	17.2	1.5	0.020	0.165	0.173	15.719	32788	12.5	3.877	118	154.5	183.9	10.1	0.010	8195	8003	pg162_def.cx9a2f_bee
100	8254	166	1.4	14.8	1.5	0.020	0.169	0.149	15.487	32012	12.5	3.878	121	154.5	190.1	10.1	0.010	7969	7766	pg162_def.cx9a2g_bee
100	8608	167	1.4	17.9	1.5	0.019	0.162	0.180	15.765	33480	12.8	3.889	119	154.5	185.5	10.1	0.010	8239	7992	pg162_def.cx9a2acef_bee
100	8483	167	1.4	20.6	1.6	0.020	0.164	0.206	15.986	32967	13.1	3.886	124	154.5	183.5	10.2	0.010	8120	7895	pg162_def.cx9a2bcef_bee
qp100.L2
qp100.L2: point queries with 100 insert/s per client. Graphs for performance per 1-second interval are here.
Average throughput:
Query response time histogram: each cell has the percentage of responses that take <= the time in the header and max is the max response time in seconds. For max values in the top 25% of the range have a red background and in the bottom 25% of the range have a green background. The red background is not used when the min value is within 80% of the max value.
| dbms | 256us | 1ms | 4ms | 16ms | 64ms | 256ms | 1s | 4s | 16s | gt | max |
|---|---|---|---|---|---|---|---|---|---|---|---|
| pg162_def.cx9a2_bee | nonzero | 99.701 | 0.298 | 0.011 | |||||||
| pg162_def.cx9a2a_bee | nonzero | 99.725 | 0.275 | 0.010 | |||||||
| pg162_def.cx9a2b_bee | nonzero | 99.763 | 0.236 | 0.011 | |||||||
| pg162_def.cx9a2c_bee | nonzero | 99.664 | 0.336 | 0.014 | |||||||
| pg162_def.cx9a2e_bee | nonzero | 99.744 | 0.256 | 0.013 | |||||||
| pg162_def.cx9a2f_bee | nonzero | 99.724 | 0.276 | 0.012 | |||||||
| pg162_def.cx9a2g_bee | 99.684 | 0.316 | 0.012 | ||||||||
| pg162_def.cx9a2acef_bee | nonzero | 99.711 | 0.289 | 0.011 | |||||||
| pg162_def.cx9a2bcef_bee | nonzero | 99.716 | 0.283 | nonzero | 0.016 |
Insert response time histogram: each cell has the percentage of responses that take <= the time in the header and max is the max response time in seconds. For max values in the top 25% of the range have a red background and in the bottom 25% of the range have a green background. The red background is not used when the min value is within 80% of the max value.
| dbms | 256us | 1ms | 4ms | 16ms | 64ms | 256ms | 1s | 4s | 16s | gt | max |
|---|---|---|---|---|---|---|---|---|---|---|---|
| pg162_def.cx9a2_bee | 20.306 | 79.694 | 0.027 | ||||||||
| pg162_def.cx9a2a_bee | 23.111 | 76.889 | 0.027 | ||||||||
| pg162_def.cx9a2b_bee | 18.333 | 81.667 | 0.033 | ||||||||
| pg162_def.cx9a2c_bee | 19.833 | 80.167 | 0.033 | ||||||||
| pg162_def.cx9a2e_bee | 19.528 | 80.472 | 0.036 | ||||||||
| pg162_def.cx9a2f_bee | 22.306 | 77.694 | 0.026 | ||||||||
| pg162_def.cx9a2g_bee | 23.111 | 76.889 | 0.029 | ||||||||
| pg162_def.cx9a2acef_bee | 20.333 | 79.667 | 0.025 | ||||||||
| pg162_def.cx9a2bcef_bee | 20.472 | 79.528 | 0.035 |
Delete response time histogram: each cell has the percentage of responses that take <= the time in the header and max is the max response time in seconds. For max values in the top 25% of the range have a red background and in the bottom 25% of the range have a green background. The red background is not used when the min value is within 80% of the max value.
| dbms | 256us | 1ms | 4ms | 16ms | 64ms | 256ms | 1s | 4s | 16s | gt | max |
|---|---|---|---|---|---|---|---|---|---|---|---|
| pg162_def.cx9a2_bee | 46.750 | 53.250 | 0.011 | ||||||||
| pg162_def.cx9a2a_bee | 47.139 | 52.861 | 0.011 | ||||||||
| pg162_def.cx9a2b_bee | 48.333 | 51.667 | 0.012 | ||||||||
| pg162_def.cx9a2c_bee | 53.083 | 46.917 | 0.011 | ||||||||
| pg162_def.cx9a2e_bee | 45.583 | 54.417 | 0.009 | ||||||||
| pg162_def.cx9a2f_bee | 46.222 | 53.778 | 0.009 | ||||||||
| pg162_def.cx9a2g_bee | 47.556 | 52.444 | 0.009 | ||||||||
| pg162_def.cx9a2acef_bee | 44.194 | 55.806 | 0.011 | ||||||||
| pg162_def.cx9a2bcef_bee | 46.028 | 53.972 | 0.011 |
Performance metrics for the DBMS listed above. Some are normalized by throughput, others are not. Legend for results is here.
ips	qps	rps	rmbps	wps	wmbps	rpq	rkbpq	wpi	wkbpi	csps	cpups	cspq	cpupq	dbgb1	dbgb2	rss	maxop	p50	p99	tag
100	394	6802	53.6	393.0	4.5	17.256	139.288	3.942	45.846	14882	3.9	37.751	792	154.5	192.2	10.1	0.011	400	336	pg162_def.cx9a2_bee
100	393	6782	53.5	392.9	4.5	17.241	139.181	3.937	45.785	14823	3.9	37.680	793	154.5	190.4	10.1	0.010	400	336	pg162_def.cx9a2a_bee
100	394	6794	53.6	393.2	4.5	17.221	139.020	3.939	45.774	14860	3.9	37.667	791	154.5	190.6	10.1	0.011	400	335	pg162_def.cx9a2b_bee
100	394	6789	53.5	393.3	4.5	17.223	139.020	3.941	45.825	14937	4.0	37.893	812	154.5	189.9	9.8	0.014	400	335	pg162_def.cx9a2c_bee
100	395	6796	53.6	393.2	4.5	17.223	139.000	3.940	45.804	14864	3.9	37.668	791	154.5	191.5	10.1	0.013	400	320	pg162_def.cx9a2e_bee
100	394	6801	53.6	390.3	4.4	17.244	139.207	3.915	45.597	14877	3.9	37.721	791	154.5	183.9	9.9	0.012	400	320	pg162_def.cx9a2f_bee
100	394	6794	53.6	393.0	4.5	17.244	139.190	3.942	45.796	14860	3.9	37.716	792	154.5	190.1	10.1	0.012	400	336	pg162_def.cx9a2g_bee
100	394	6792	53.5	389.6	4.4	17.244	139.201	3.908	45.544	14942	4.0	37.934	812	154.5	185.6	10.1	0.011	400	320	pg162_def.cx9a2acef_bee
100	394	6793	53.5	387.1	4.4	17.245	139.193	3.883	45.348	14952	4.0	37.959	812	154.5	183.5	10.2	0.016	400	332	pg162_def.cx9a2bcef_bee
qr500.L3
qr500.L3: range queries with 500 insert/s per client. Graphs for performance per 1-second interval are here.
Average throughput:
Query response time histogram: each cell has the percentage of responses that take <= the time in the header and max is the max response time in seconds. For max values in the top 25% of the range have a red background and in the bottom 25% of the range have a green background. The red background is not used when the min value is within 80% of the max value.
| dbms | 256us | 1ms | 4ms | 16ms | 64ms | 256ms | 1s | 4s | 16s | gt | max |
|---|---|---|---|---|---|---|---|---|---|---|---|
| pg162_def.cx9a2_bee | 99.858 | 0.138 | 0.002 | 0.002 | nonzero | 0.023 | |||||
| pg162_def.cx9a2a_bee | 99.851 | 0.145 | 0.002 | 0.002 | nonzero | 0.027 | |||||
| pg162_def.cx9a2b_bee | 99.850 | 0.147 | 0.002 | 0.002 | nonzero | 0.029 | |||||
| pg162_def.cx9a2c_bee | 99.787 | 0.208 | 0.003 | 0.002 | nonzero | 0.033 | |||||
| pg162_def.cx9a2e_bee | 99.851 | 0.146 | 0.002 | 0.002 | nonzero | 0.028 | |||||
| pg162_def.cx9a2f_bee | 99.855 | 0.141 | 0.003 | 0.002 | nonzero | 0.029 | |||||
| pg162_def.cx9a2g_bee | 99.840 | 0.156 | 0.002 | 0.002 | nonzero | 0.028 | |||||
| pg162_def.cx9a2acef_bee | 99.788 | 0.208 | 0.002 | 0.002 | nonzero | 0.040 | |||||
| pg162_def.cx9a2bcef_bee | 99.781 | 0.215 | 0.002 | 0.002 | nonzero | 0.035 |
Insert response time histogram: each cell has the percentage of responses that take <= the time in the header and max is the max response time in seconds. For max values in the top 25% of the range have a red background and in the bottom 25% of the range have a green background. The red background is not used when the min value is within 80% of the max value.
| dbms | 256us | 1ms | 4ms | 16ms | 64ms | 256ms | 1s | 4s | 16s | gt | max |
|---|---|---|---|---|---|---|---|---|---|---|---|
| pg162_def.cx9a2_bee | 78.567 | 21.433 | 0.035 | ||||||||
| pg162_def.cx9a2a_bee | 81.083 | 18.917 | 0.042 | ||||||||
| pg162_def.cx9a2b_bee | 81.217 | 18.783 | 0.035 | ||||||||
| pg162_def.cx9a2c_bee | 82.317 | 17.683 | 0.036 | ||||||||
| pg162_def.cx9a2e_bee | 80.311 | 19.689 | 0.036 | ||||||||
| pg162_def.cx9a2f_bee | 80.833 | 19.167 | 0.038 | ||||||||
| pg162_def.cx9a2g_bee | 82.861 | 17.139 | 0.045 | ||||||||
| pg162_def.cx9a2acef_bee | 81.367 | 18.633 | 0.035 | ||||||||
| pg162_def.cx9a2bcef_bee | 80.589 | 19.411 | 0.037 |
Delete response time histogram: each cell has the percentage of responses that take <= the time in the header and max is the max response time in seconds. For max values in the top 25% of the range have a red background and in the bottom 25% of the range have a green background. The red background is not used when the min value is within 80% of the max value.
| dbms | 256us | 1ms | 4ms | 16ms | 64ms | 256ms | 1s | 4s | 16s | gt | max |
|---|---|---|---|---|---|---|---|---|---|---|---|
| pg162_def.cx9a2_bee | 98.178 | 1.822 | 0.020 | ||||||||
| pg162_def.cx9a2a_bee | 98.261 | 1.739 | 0.022 | ||||||||
| pg162_def.cx9a2b_bee | 98.217 | 1.783 | 0.021 | ||||||||
| pg162_def.cx9a2c_bee | 98.194 | 1.806 | 0.019 | ||||||||
| pg162_def.cx9a2e_bee | 98.056 | 1.944 | 0.020 | ||||||||
| pg162_def.cx9a2f_bee | 98.272 | 1.728 | 0.019 | ||||||||
| pg162_def.cx9a2g_bee | 98.300 | 1.700 | 0.020 | ||||||||
| pg162_def.cx9a2acef_bee | 98.044 | 1.956 | 0.019 | ||||||||
| pg162_def.cx9a2bcef_bee | 98.006 | 1.994 | 0.021 |
Performance metrics for the DBMS listed above. Some are normalized by throughput, others are not. Legend for results is here.
ips	qps	rps	rmbps	wps	wmbps	rpq	rkbpq	wpi	wkbpi	csps	cpups	cspq	cpupq	dbgb1	dbgb2	rss	maxop	p50	p99	tag
499	8258	883	7.1	614.7	11.1	0.107	0.875	1.232	22.796	33652	14.7	4.075	142	154.6	190.5	9.6	0.023	7945	7446	pg162_def.cx9a2_bee
499	7964	883	7.1	615.2	11.1	0.111	0.907	1.234	22.803	32555	14.6	4.088	147	154.6	190.2	9.8	0.027	7770	7275	pg162_def.cx9a2a_bee
499	8088	883	7.1	616.4	11.1	0.109	0.893	1.235	22.813	32992	14.8	4.079	146	154.6	190.3	9.7	0.029	7783	7288	pg162_def.cx9a2b_bee
499	8199	882	7.0	616.1	11.1	0.108	0.880	1.236	22.810	33550	15.4	4.092	150	154.6	190.0	9.5	0.033	7887	7292	pg162_def.cx9a2c_bee
499	8062	883	7.1	614.5	11.1	0.110	0.896	1.232	22.790	32933	14.8	4.085	147	154.6	190.4	9.7	0.028	7754	7303	pg162_def.cx9a2e_bee
499	8150	883	7.1	615.7	11.2	0.108	0.886	1.234	22.949	33234	14.7	4.078	144	154.6	184.0	9.6	0.029	7892	7339	pg162_def.cx9a2f_bee
499	7979	883	7.1	615.7	11.1	0.111	0.905	1.235	22.839	32599	14.7	4.086	147	154.6	190.2	9.6	0.028	7661	7188	pg162_def.cx9a2g_bee
498	8068	883	7.1	616.9	11.2	0.109	0.896	1.238	23.018	33086	15.0	4.101	149	154.6	185.6	9.8	0.040	7851	7368	pg162_def.cx9a2acef_bee
499	8111	882	7.0	619.1	11.2	0.109	0.890	1.241	23.056	33199	15.1	4.093	149	154.6	183.6	9.5	0.035	7815	7288	pg162_def.cx9a2bcef_bee
qp500.L4
qp500.L4: point queries with 500 insert/s per client. Graphs for performance per 1-second interval are here.
Average throughput:
Query response time histogram: each cell has the percentage of responses that take <= the time in the header and max is the max response time in seconds. For max values in the top 25% of the range have a red background and in the bottom 25% of the range have a green background. The red background is not used when the min value is within 80% of the max value.
| dbms | 256us | 1ms | 4ms | 16ms | 64ms | 256ms | 1s | 4s | 16s | gt | max |
|---|---|---|---|---|---|---|---|---|---|---|---|
| pg162_def.cx9a2_bee | nonzero | 98.953 | 1.046 | 0.001 | 0.039 | ||||||
| pg162_def.cx9a2a_bee | 99.019 | 0.981 | 0.001 | 0.032 | |||||||
| pg162_def.cx9a2b_bee | 99.075 | 0.924 | 0.001 | 0.028 | |||||||
| pg162_def.cx9a2c_bee | 99.009 | 0.990 | 0.001 | 0.027 | |||||||
| pg162_def.cx9a2e_bee | 99.083 | 0.916 | 0.001 | 0.033 | |||||||
| pg162_def.cx9a2f_bee | nonzero | 99.031 | 0.968 | 0.001 | 0.035 | ||||||
| pg162_def.cx9a2g_bee | 98.919 | 1.080 | 0.001 | 0.036 | |||||||
| pg162_def.cx9a2acef_bee | 99.076 | 0.923 | 0.001 | 0.034 | |||||||
| pg162_def.cx9a2bcef_bee | nonzero | 98.987 | 1.012 | 0.001 | 0.036 |
Insert response time histogram: each cell has the percentage of responses that take <= the time in the header and max is the max response time in seconds. For max values in the top 25% of the range have a red background and in the bottom 25% of the range have a green background. The red background is not used when the min value is within 80% of the max value.
| dbms | 256us | 1ms | 4ms | 16ms | 64ms | 256ms | 1s | 4s | 16s | gt | max |
|---|---|---|---|---|---|---|---|---|---|---|---|
| pg162_def.cx9a2_bee | 97.017 | 2.978 | 0.006 | 0.069 | |||||||
| pg162_def.cx9a2a_bee | 97.789 | 2.211 | 0.042 | ||||||||
| pg162_def.cx9a2b_bee | 97.672 | 2.328 | 0.039 | ||||||||
| pg162_def.cx9a2c_bee | 97.144 | 2.856 | 0.052 | ||||||||
| pg162_def.cx9a2e_bee | 97.972 | 2.028 | 0.036 | ||||||||
| pg162_def.cx9a2f_bee | 97.872 | 2.128 | 0.037 | ||||||||
| pg162_def.cx9a2g_bee | 96.956 | 3.044 | 0.045 | ||||||||
| pg162_def.cx9a2acef_bee | 97.767 | 2.233 | 0.040 | ||||||||
| pg162_def.cx9a2bcef_bee | 96.789 | 3.211 | 0.053 |
Delete response time histogram: each cell has the percentage of responses that take <= the time in the header and max is the max response time in seconds. For max values in the top 25% of the range have a red background and in the bottom 25% of the range have a green background. The red background is not used when the min value is within 80% of the max value.
| dbms | 256us | 1ms | 4ms | 16ms | 64ms | 256ms | 1s | 4s | 16s | gt | max |
|---|---|---|---|---|---|---|---|---|---|---|---|
| pg162_def.cx9a2_bee | 20.250 | 79.750 | 0.048 | ||||||||
| pg162_def.cx9a2a_bee | 17.867 | 82.133 | 0.046 | ||||||||
| pg162_def.cx9a2b_bee | 18.550 | 81.450 | 0.049 | ||||||||
| pg162_def.cx9a2c_bee | 18.183 | 81.817 | 0.038 | ||||||||
| pg162_def.cx9a2e_bee | 19.011 | 80.989 | 0.038 | ||||||||
| pg162_def.cx9a2f_bee | 18.444 | 81.556 | 0.049 | ||||||||
| pg162_def.cx9a2g_bee | 18.756 | 81.244 | 0.037 | ||||||||
| pg162_def.cx9a2acef_bee | 16.144 | 83.856 | 0.047 | ||||||||
| pg162_def.cx9a2bcef_bee | 17.422 | 82.578 | 0.049 |
Performance metrics for the DBMS listed above. Some are normalized by throughput, others are not. Legend for results is here.
ips	qps	rps	rmbps	wps	wmbps	rpq	rkbpq	wpi	wkbpi	csps	cpups	cspq	cpupq	dbgb1	dbgb2	rss	maxop	p50	p99	tag
499	381	7448	58.5	1327.8	16.8	19.539	157.256	2.663	34.408	16241	7.0	42.604	1469	154.7	189.3	8.7	0.039	384	320	pg162_def.cx9a2_bee
499	380	7430	58.4	1326.8	16.7	19.527	157.171	2.658	34.352	16199	7.0	42.573	1472	154.7	189.1	8.6	0.032	384	320	pg162_def.cx9a2a_bee
499	382	7450	58.6	1326.4	16.7	19.527	157.166	2.659	34.359	16240	7.0	42.568	1468	154.7	189.1	8.8	0.028	384	320	pg162_def.cx9a2b_bee
499	381	7438	58.5	1326.6	16.7	19.521	157.114	2.658	34.352	16296	7.2	42.773	1512	154.7	189.0	8.7	0.027	384	320	pg162_def.cx9a2c_bee
499	382	7450	58.6	1327.2	16.7	19.529	157.197	2.661	34.379	16235	6.9	42.557	1447	154.7	189.2	8.6	0.033	384	320	pg162_def.cx9a2e_bee
499	382	7446	58.5	1326.2	16.7	19.519	157.108	2.657	34.261	16236	7.0	42.559	1468	154.7	184.1	9.0	0.035	384	320	pg162_def.cx9a2f_bee
499	381	7439	58.5	1326.6	16.7	19.525	157.145	2.658	34.340	16223	7.0	42.580	1470	154.7	189.0	8.9	0.036	384	320	pg162_def.cx9a2g_bee
498	381	7448	58.5	1325.4	16.7	19.558	157.420	2.660	34.312	16318	7.2	42.853	1513	154.7	185.7	8.7	0.034	384	320	pg162_def.cx9a2acef_bee
499	381	7443	58.5	1321.8	16.7	19.535	157.228	2.650	34.218	16302	7.2	42.787	1512	154.7	183.7	8.6	0.036	384	320	pg162_def.cx9a2bcef_bee
qr1000.L5
qr1000.L5: range queries with 1000 insert/s per client. Graphs for performance per 1-second interval are here.
Average throughput:
Query response time histogram: each cell has the percentage of responses that take <= the time in the header and max is the max response time in seconds. For max values in the top 25% of the range have a red background and in the bottom 25% of the range have a green background. The red background is not used when the min value is within 80% of the max value.
| dbms | 256us | 1ms | 4ms | 16ms | 64ms | 256ms | 1s | 4s | 16s | gt | max |
|---|---|---|---|---|---|---|---|---|---|---|---|
| pg162_def.cx9a2_bee | 98.138 | 1.850 | 0.008 | 0.005 | nonzero | nonzero | 0.141 | ||||
| pg162_def.cx9a2a_bee | 98.003 | 1.985 | 0.007 | 0.004 | nonzero | nonzero | 0.133 | ||||
| pg162_def.cx9a2b_bee | 98.146 | 1.842 | 0.008 | 0.004 | nonzero | nonzero | 0.145 | ||||
| pg162_def.cx9a2c_bee | 98.026 | 1.962 | 0.008 | 0.004 | nonzero | nonzero | 0.142 | ||||
| pg162_def.cx9a2e_bee | 98.106 | 1.883 | 0.007 | 0.004 | nonzero | nonzero | 0.134 | ||||
| pg162_def.cx9a2f_bee | 98.070 | 1.919 | 0.007 | 0.004 | nonzero | nonzero | 0.134 | ||||
| pg162_def.cx9a2g_bee | 97.822 | 2.166 | 0.007 | 0.004 | nonzero | nonzero | 0.138 | ||||
| pg162_def.cx9a2acef_bee | 98.096 | 1.893 | 0.007 | 0.004 | nonzero | nonzero | 0.138 | ||||
| pg162_def.cx9a2bcef_bee | 97.801 | 2.187 | 0.008 | 0.004 | nonzero | nonzero | 0.140 |
Insert response time histogram: each cell has the percentage of responses that take <= the time in the header and max is the max response time in seconds. For max values in the top 25% of the range have a red background and in the bottom 25% of the range have a green background. The red background is not used when the min value is within 80% of the max value.
| dbms | 256us | 1ms | 4ms | 16ms | 64ms | 256ms | 1s | 4s | 16s | gt | max |
|---|---|---|---|---|---|---|---|---|---|---|---|
| pg162_def.cx9a2_bee | 89.103 | 10.897 | 0.034 | ||||||||
| pg162_def.cx9a2a_bee | 91.197 | 8.803 | 0.053 | ||||||||
| pg162_def.cx9a2b_bee | 87.981 | 12.019 | 0.035 | ||||||||
| pg162_def.cx9a2c_bee | 88.600 | 11.400 | 0.051 | ||||||||
| pg162_def.cx9a2e_bee | 89.908 | 10.092 | 0.046 | ||||||||
| pg162_def.cx9a2f_bee | 90.003 | 9.997 | 0.062 | ||||||||
| pg162_def.cx9a2g_bee | 89.814 | 10.186 | 0.051 | ||||||||
| pg162_def.cx9a2acef_bee | 93.283 | 6.717 | 0.053 | ||||||||
| pg162_def.cx9a2bcef_bee | 88.722 | 11.278 | 0.042 |
Delete response time histogram: each cell has the percentage of responses that take <= the time in the header and max is the max response time in seconds. For max values in the top 25% of the range have a red background and in the bottom 25% of the range have a green background. The red background is not used when the min value is within 80% of the max value.
| dbms | 256us | 1ms | 4ms | 16ms | 64ms | 256ms | 1s | 4s | 16s | gt | max |
|---|---|---|---|---|---|---|---|---|---|---|---|
| pg162_def.cx9a2_bee | 99.997 | 0.003 | 0.066 | ||||||||
| pg162_def.cx9a2a_bee | 100.000 | 0.054 | |||||||||
| pg162_def.cx9a2b_bee | 99.997 | 0.003 | 0.073 | ||||||||
| pg162_def.cx9a2c_bee | 99.997 | 0.003 | 0.075 | ||||||||
| pg162_def.cx9a2e_bee | 100.000 | 0.058 | |||||||||
| pg162_def.cx9a2f_bee | 99.997 | 0.003 | 0.067 | ||||||||
| pg162_def.cx9a2g_bee | 99.997 | 0.003 | 0.071 | ||||||||
| pg162_def.cx9a2acef_bee | 100.000 | 0.056 | |||||||||
| pg162_def.cx9a2bcef_bee | 99.997 | 0.003 | 0.074 |
Performance metrics for the DBMS listed above. Some are normalized by throughput, others are not. Legend for results is here.
ips	qps	rps	rmbps	wps	wmbps	rpq	rkbpq	wpi	wkbpi	csps	cpups	cspq	cpupq	dbgb1	dbgb2	rss	maxop	p50	p99	tag
998	7071	1683	13.5	1555.0	23.3	0.238	1.956	1.559	23.947	31002	22.3	4.384	252	154.8	188.4	8.5	0.141	6904	5934	pg162_def.cx9a2_bee
997	6980	1682	13.5	1553.7	23.3	0.241	1.981	1.558	23.939	30638	22.3	4.389	256	154.8	188.2	8.5	0.133	6792	5881	pg162_def.cx9a2a_bee
998	7076	1683	13.5	1554.5	23.3	0.238	1.954	1.558	23.939	31000	22.3	4.381	252	154.8	188.2	8.6	0.145	6908	5961	pg162_def.cx9a2b_bee
998	7049	1682	13.5	1553.9	23.3	0.239	1.961	1.557	23.914	30997	22.5	4.397	255	154.8	188.1	8.5	0.142	6920	5966	pg162_def.cx9a2c_bee
998	7102	1683	13.5	1554.4	23.3	0.237	1.948	1.557	23.925	31097	22.3	4.378	251	154.8	188.3	8.5	0.134	6919	5946	pg162_def.cx9a2e_bee
998	7066	1682	13.5	1554.6	23.4	0.238	1.957	1.557	24.035	30948	22.3	4.380	252	154.8	184.3	8.8	0.134	6871	5929	pg162_def.cx9a2f_bee
998	6943	1683	13.5	1554.6	23.3	0.242	1.993	1.557	23.936	30491	22.3	4.391	257	154.8	188.1	8.7	0.138	6745	5897	pg162_def.cx9a2g_bee
998	7059	1684	13.5	1557.1	23.5	0.239	1.961	1.560	24.078	31050	22.6	4.398	256	154.8	185.9	8.5	0.138	6950	5993	pg162_def.cx9a2acef_bee
998	6872	1684	13.5	1557.9	23.7	0.245	2.013	1.561	24.333	30339	22.6	4.415	263	154.8	184.2	8.4	0.140	6776	5865	pg162_def.cx9a2bcef_bee
qp1000.L6
qp1000.L6: point queries with 1000 insert/s per client. Graphs for performance per 1-second interval are here.
Average throughput:
Query response time histogram: each cell has the percentage of responses that take <= the time in the header and max is the max response time in seconds. For max values in the top 25% of the range have a red background and in the bottom 25% of the range have a green background. The red background is not used when the min value is within 80% of the max value.
| dbms | 256us | 1ms | 4ms | 16ms | 64ms | 256ms | 1s | 4s | 16s | gt | max |
|---|---|---|---|---|---|---|---|---|---|---|---|
| pg162_def.cx9a2_bee | nonzero | 97.650 | 2.347 | 0.003 | 0.044 | ||||||
| pg162_def.cx9a2a_bee | 97.610 | 2.387 | 0.003 | 0.038 | |||||||
| pg162_def.cx9a2b_bee | 97.627 | 2.369 | 0.004 | 0.037 | |||||||
| pg162_def.cx9a2c_bee | 97.558 | 2.438 | 0.003 | 0.039 | |||||||
| pg162_def.cx9a2e_bee | 97.634 | 2.363 | 0.003 | 0.042 | |||||||
| pg162_def.cx9a2f_bee | 97.609 | 2.387 | 0.004 | 0.043 | |||||||
| pg162_def.cx9a2g_bee | 97.687 | 2.309 | 0.004 | 0.045 | |||||||
| pg162_def.cx9a2acef_bee | 97.551 | 2.445 | 0.004 | 0.043 | |||||||
| pg162_def.cx9a2bcef_bee | 97.607 | 2.389 | 0.003 | 0.044 |
Insert response time histogram: each cell has the percentage of responses that take <= the time in the header and max is the max response time in seconds. For max values in the top 25% of the range have a red background and in the bottom 25% of the range have a green background. The red background is not used when the min value is within 80% of the max value.
| dbms | 256us | 1ms | 4ms | 16ms | 64ms | 256ms | 1s | 4s | 16s | gt | max |
|---|---|---|---|---|---|---|---|---|---|---|---|
| pg162_def.cx9a2_bee | 97.572 | 2.428 | 0.047 | ||||||||
| pg162_def.cx9a2a_bee | 97.833 | 2.167 | 0.036 | ||||||||
| pg162_def.cx9a2b_bee | 97.686 | 2.314 | 0.053 | ||||||||
| pg162_def.cx9a2c_bee | 97.742 | 2.258 | 0.042 | ||||||||
| pg162_def.cx9a2e_bee | 97.689 | 2.311 | 0.054 | ||||||||
| pg162_def.cx9a2f_bee | 97.297 | 2.703 | 0.054 | ||||||||
| pg162_def.cx9a2g_bee | 97.850 | 2.150 | 0.056 | ||||||||
| pg162_def.cx9a2acef_bee | 97.169 | 2.831 | 0.053 | ||||||||
| pg162_def.cx9a2bcef_bee | 97.269 | 2.731 | 0.055 |
Delete response time histogram: each cell has the percentage of responses that take <= the time in the header and max is the max response time in seconds. For max values in the top 25% of the range have a red background and in the bottom 25% of the range have a green background. The red background is not used when the min value is within 80% of the max value.
| dbms | 256us | 1ms | 4ms | 16ms | 64ms | 256ms | 1s | 4s | 16s | gt | max |
|---|---|---|---|---|---|---|---|---|---|---|---|
| pg162_def.cx9a2_bee | 99.958 | 0.042 | 0.100 | ||||||||
| pg162_def.cx9a2a_bee | 99.900 | 0.100 | 0.110 | ||||||||
| pg162_def.cx9a2b_bee | 99.936 | 0.064 | 0.095 | ||||||||
| pg162_def.cx9a2c_bee | 99.964 | 0.036 | 0.109 | ||||||||
| pg162_def.cx9a2e_bee | 99.911 | 0.089 | 0.095 | ||||||||
| pg162_def.cx9a2f_bee | 99.931 | 0.069 | 0.113 | ||||||||
| pg162_def.cx9a2g_bee | 99.919 | 0.081 | 0.108 | ||||||||
| pg162_def.cx9a2acef_bee | 99.950 | 0.050 | 0.101 | ||||||||
| pg162_def.cx9a2bcef_bee | 99.878 | 0.122 | 0.099 |
Performance metrics for the DBMS listed above. Some are normalized by throughput, others are not. Legend for results is here.
ips	qps	rps	rmbps	wps	wmbps	rpq	rkbpq	wpi	wkbpi	csps	cpups	cspq	cpupq	dbgb1	dbgb2	rss	maxop	p50	p99	tag
929	359	7982	62.7	2180.6	30.0	22.245	178.844	2.348	33.091	17528	17.3	48.851	3857	155.0	192.6	7.8	0.044	368	319	pg162_def.cx9a2_bee
924	357	7954	62.5	2170.9	30.0	22.256	178.932	2.349	33.236	17482	17.3	48.915	3872	155.0	192.6	8.1	0.038	367	304	pg162_def.cx9a2a_bee
926	358	7970	62.6	2174.4	30.0	22.232	178.742	2.348	33.202	17504	17.2	48.826	3838	155.0	192.6	8.1	0.037	368	304	pg162_def.cx9a2b_bee
929	358	7972	62.6	2180.7	30.2	22.243	178.816	2.348	33.274	17591	17.5	49.082	3906	155.0	192.6	7.9	0.039	368	304	pg162_def.cx9a2c_bee
927	358	7967	62.5	2175.5	30.0	22.235	178.759	2.347	33.126	17497	17.3	48.834	3863	155.0	192.6	7.9	0.042	367	319	pg162_def.cx9a2e_bee
925	358	7965	62.5	2179.4	32.0	22.243	178.824	2.355	35.377	17532	17.2	48.957	3842	155.0	192.5	8.3	0.043	368	319	pg162_def.cx9a2f_bee
926	358	7972	62.6	2174.9	30.1	22.236	178.770	2.349	33.235	17547	17.2	48.945	3838	155.0	192.6	8.0	0.045	368	304	pg162_def.cx9a2g_bee
925	358	7967	62.5	2177.1	31.1	22.248	178.860	2.353	34.412	17605	17.4	49.163	3887	155.0	192.5	8.4	0.043	368	304	pg162_def.cx9a2acef_bee
926	359	7976	62.6	2178.5	31.9	22.231	178.715	2.353	35.313	17634	17.5	49.148	3902	155.0	192.5	7.9	0.044	368	319	pg162_def.cx9a2bcef_bee
l.i0
l.i0: load without secondary indexes
Performance metrics for all DBMS, not just the ones listed above. Some are normalized by throughput, others are not. Legend for results is here.
ips	qps	rps	rmbps	wps	wmbps	rpq	rkbpq	wpi	wkbpi	csps	cpups	cspq	cpupq	dbgb1	dbgb2	rss	maxop	p50	p99	tag
75160	0	31	0.2	107.7	31.0	0.000	0.003	0.001	0.422	9128	23.0	0.121	24	76.5	116.6	0.3	0.058	75345	73200	pg162_def.cx9a2_bee
74864	0	32	0.3	107.6	30.7	0.000	0.003	0.001	0.420	9095	23.0	0.121	25	76.5	116.6	1.5	0.080	75020	73014	pg162_def.cx9a2a_bee
75153	0	31	0.2	104.7	30.8	0.000	0.003	0.001	0.420	9129	23.0	0.121	24	76.5	116.6	3.6	0.077	75333	73269	pg162_def.cx9a2b_bee
75174	0	33	0.3	114.0	30.8	0.000	0.004	0.002	0.420	9171	23.2	0.122	25	76.5	116.6	1.5	0.060	75333	73247	pg162_def.cx9a2c_bee
74585	0	31	0.2	105.0	30.7	0.000	0.003	0.001	0.422	9060	22.9	0.121	25	76.5	116.6	1.2	0.054	74817	72716	pg162_def.cx9a2e_bee
74962	0	30	0.2	107.5	30.6	0.000	0.003	0.001	0.418	9102	23.1	0.121	25	76.5	116.6	0.1	0.061	75134	73018	pg162_def.cx9a2f_bee
74970	0	31	0.2	104.5	31.0	0.000	0.003	0.001	0.423	9099	23.1	0.121	25	76.5	116.6	3.7	0.058	75122	73118	pg162_def.cx9a2g_bee
75400	0	31	0.2	108.0	30.8	0.000	0.003	0.001	0.418	9190	23.2	0.122	25	76.5	116.6	0.5	0.055	75617	73507	pg162_def.cx9a2acef_bee
75507	0	31	0.2	108.0	30.8	0.000	0.003	0.001	0.418	9199	23.2	0.122	25	76.5	116.6	0.6	0.059	75719	73699	pg162_def.cx9a2bcef_bee
l.x
l.x: create secondary indexes
Performance metrics for all DBMS, not just the ones listed above. Some are normalized by throughput, others are not. Legend for results is here.
ips	qps	rps	rmbps	wps	wmbps	rpq	rkbpq	wpi	wkbpi	csps	cpups	cspq	cpupq	dbgb1	dbgb2	rss	maxop	p50	p99	tag
195647	0	592	73.6	201.6	73.1	0.003	0.385	0.001	0.383	393	12.4	0.002	5	153.6	193.7	10.3	0.005	NA	NA	pg162_def.cx9a2_bee
194789	0	590	73.2	200.2	72.6	0.003	0.385	0.001	0.382	387	12.4	0.002	5	153.6	193.7	10.2	0.005	NA	NA	pg162_def.cx9a2a_bee
194742	0	590	73.2	198.9	72.6	0.003	0.385	0.001	0.382	392	12.4	0.002	5	153.6	193.7	10.3	0.004	NA	NA	pg162_def.cx9a2b_bee
195743	0	592	73.6	196.8	72.8	0.003	0.385	0.001	0.381	512	12.6	0.003	5	153.6	193.7	10.2	0.004	NA	NA	pg162_def.cx9a2c_bee
195503	0	592	73.5	199.3	73.0	0.003	0.385	0.001	0.382	396	12.4	0.002	5	153.6	193.7	10.3	0.005	NA	NA	pg162_def.cx9a2e_bee
195743	0	592	73.6	195.9	72.9	0.003	0.385	0.001	0.381	416	12.4	0.002	5	153.6	193.7	10.3	0.004	NA	NA	pg162_def.cx9a2f_bee
196560	0	595	74.0	195.8	73.2	0.003	0.385	0.001	0.382	413	12.4	0.002	5	153.6	193.7	10.3	0.009	NA	NA	pg162_def.cx9a2g_bee
196271	0	594	73.8	200.3	73.0	0.003	0.385	0.001	0.381	517	12.6	0.003	5	153.6	193.7	10.3	0.005	NA	NA	pg162_def.cx9a2acef_bee
195599	0	592	73.6	202.1	72.7	0.003	0.385	0.001	0.381	502	12.6	0.003	5	153.6	193.7	10.3	0.004	NA	NA	pg162_def.cx9a2bcef_bee
l.i1
l.i1: continue load after secondary indexes created with 50 inserts per transaction
Performance metrics for all DBMS, not just the ones listed above. Some are normalized by throughput, others are not. Legend for results is here.
ips	qps	rps	rmbps	wps	wmbps	rpq	rkbpq	wpi	wkbpi	csps	cpups	cspq	cpupq	dbgb1	dbgb2	rss	maxop	p50	p99	tag
2104	0	3522	27.9	3562.2	52.5	1.674	13.563	1.693	25.548	8227	15.5	3.910	589	154.3	194.3	10.0	0.049	1698	1148	pg162_def.cx9a2_bee
2068	0	3443	27.3	3497.6	50.5	1.665	13.493	1.691	25.004	8065	15.3	3.900	592	154.3	194.3	9.4	0.061	1698	1148	pg162_def.cx9a2a_bee
2078	0	3455	27.3	3507.0	50.5	1.663	13.478	1.688	24.889	8076	15.3	3.887	589	154.3	194.3	9.9	0.053	1698	1149	pg162_def.cx9a2b_bee
2078	0	3461	27.4	3511.5	51.2	1.666	13.503	1.690	25.253	8187	15.5	3.940	597	154.3	194.3	9.6	0.056	1747	1149	pg162_def.cx9a2c_bee
2110	0	3510	27.8	3574.9	51.6	1.664	13.484	1.695	25.064	8181	15.4	3.878	584	154.3	194.3	9.9	0.050	1698	1148	pg162_def.cx9a2e_bee
2095	0	3490	27.6	3548.2	52.3	1.665	13.501	1.693	25.565	8193	15.5	3.910	592	154.3	194.3	9.2	0.060	1698	1149	pg162_def.cx9a2f_bee
2084	0	3472	27.5	3525.6	50.9	1.666	13.503	1.691	24.993	8112	15.2	3.892	583	154.3	194.3	9.8	0.056	1698	1148	pg162_def.cx9a2g_bee
2104	0	3501	27.7	3561.0	52.5	1.664	13.486	1.692	25.536	8268	15.7	3.930	597	154.3	194.3	9.6	0.103	1698	1148	pg162_def.cx9a2acef_bee
2101	0	3499	27.7	3558.7	52.4	1.665	13.499	1.694	25.560	8274	15.8	3.938	602	154.3	194.3	9.3	0.054	1698	1149	pg162_def.cx9a2bcef_bee
l.i2
l.i2: continue load after secondary indexes created with 5 inserts per transaction
Performance metrics for all DBMS, not just the ones listed above. Some are normalized by throughput, others are not. Legend for results is here.
ips	qps	rps	rmbps	wps	wmbps	rpq	rkbpq	wpi	wkbpi	csps	cpups	cspq	cpupq	dbgb1	dbgb2	rss	maxop	p50	p99	tag
103	0	166	1.3	221.8	3.3	1.606	13.026	2.145	32.314	1000	12.4	9.673	9594	154.5	187.4	10.1	0.022	105	90	pg162_def.cx9a2_bee
103	0	165	1.3	219.9	3.3	1.606	13.033	2.137	32.447	989	12.4	9.616	9640	154.5	186.7	10.1	0.034	100	90	pg162_def.cx9a2a_bee
103	0	166	1.3	221.0	3.3	1.608	13.046	2.141	32.598	996	12.5	9.652	9690	154.5	186.7	10.2	0.033	105	90	pg162_def.cx9a2b_bee
103	0	166	1.3	220.3	3.3	1.609	13.050	2.137	32.399	1094	12.8	10.608	9932	154.5	186.6	10.1	0.034	105	90	pg162_def.cx9a2c_bee
103	0	166	1.3	220.1	3.3	1.608	13.040	2.131	32.333	996	12.4	9.647	9603	154.5	186.6	10.1	0.033	105	90	pg162_def.cx9a2e_bee
103	0	169	1.3	222.7	3.3	1.638	13.284	2.160	32.488	997	12.4	9.670	9622	154.5	186.2	10.1	0.033	105	90	pg162_def.cx9a2f_bee
103	0	166	1.3	220.4	3.3	1.608	13.046	2.136	32.451	995	12.4	9.644	9612	154.5	186.7	10.1	0.021	105	90	pg162_def.cx9a2g_bee
103	0	165	1.3	221.8	3.3	1.607	13.037	2.156	32.451	1086	12.8	10.549	9951	154.5	186.2	10.1	0.034	105	90	pg162_def.cx9a2acef_bee
103	0	166	1.3	223.1	3.3	1.607	13.037	2.162	32.505	1088	12.8	10.546	9923	154.5	186.2	10.1	0.033	105	90	pg162_def.cx9a2bcef_bee
qr100.L1
qr100.L1: range queries with 100 insert/s per client
Performance metrics for all DBMS, not just the ones listed above. Some are normalized by throughput, others are not. Legend for results is here.
ips	qps	rps	rmbps	wps	wmbps	rpq	rkbpq	wpi	wkbpi	csps	cpups	cspq	cpupq	dbgb1	dbgb2	rss	maxop	p50	p99	tag
100	8559	167	1.4	15.0	1.5	0.019	0.163	0.150	15.418	33160	12.5	3.874	117	154.5	192.2	10.1	0.016	8254	8024	pg162_def.cx9a2_bee
100	8484	166	1.4	15.2	1.5	0.020	0.164	0.152	15.426	32880	12.7	3.875	120	154.5	190.4	10.1	0.010	8087	7861	pg162_def.cx9a2a_bee
100	8630	167	1.4	15.0	1.5	0.019	0.161	0.150	15.476	33444	12.7	3.875	118	154.5	190.6	10.1	0.010	8170	7943	pg162_def.cx9a2b_bee
100	8573	166	1.4	15.1	1.5	0.019	0.162	0.152	15.414	33324	13.7	3.887	128	154.5	189.9	9.9	0.015	8183	7973	pg162_def.cx9a2c_bee
100	8347	167	1.4	14.9	1.5	0.020	0.167	0.149	15.434	32378	12.6	3.879	121	154.5	191.4	10.2	0.010	8119	7926	pg162_def.cx9a2e_bee
100	8458	167	1.4	17.2	1.5	0.020	0.165	0.173	15.719	32788	12.5	3.877	118	154.5	183.9	10.1	0.010	8195	8003	pg162_def.cx9a2f_bee
100	8254	166	1.4	14.8	1.5	0.020	0.169	0.149	15.487	32012	12.5	3.878	121	154.5	190.1	10.1	0.010	7969	7766	pg162_def.cx9a2g_bee
100	8608	167	1.4	17.9	1.5	0.019	0.162	0.180	15.765	33480	12.8	3.889	119	154.5	185.5	10.1	0.010	8239	7992	pg162_def.cx9a2acef_bee
100	8483	167	1.4	20.6	1.6	0.020	0.164	0.206	15.986	32967	13.1	3.886	124	154.5	183.5	10.2	0.010	8120	7895	pg162_def.cx9a2bcef_bee
qp100.L2
qp100.L2: point queries with 100 insert/s per client
Performance metrics for all DBMS, not just the ones listed above. Some are normalized by throughput, others are not. Legend for results is here.
ips	qps	rps	rmbps	wps	wmbps	rpq	rkbpq	wpi	wkbpi	csps	cpups	cspq	cpupq	dbgb1	dbgb2	rss	maxop	p50	p99	tag
100	394	6802	53.6	393.0	4.5	17.256	139.288	3.942	45.846	14882	3.9	37.751	792	154.5	192.2	10.1	0.011	400	336	pg162_def.cx9a2_bee
100	393	6782	53.5	392.9	4.5	17.241	139.181	3.937	45.785	14823	3.9	37.680	793	154.5	190.4	10.1	0.010	400	336	pg162_def.cx9a2a_bee
100	394	6794	53.6	393.2	4.5	17.221	139.020	3.939	45.774	14860	3.9	37.667	791	154.5	190.6	10.1	0.011	400	335	pg162_def.cx9a2b_bee
100	394	6789	53.5	393.3	4.5	17.223	139.020	3.941	45.825	14937	4.0	37.893	812	154.5	189.9	9.8	0.014	400	335	pg162_def.cx9a2c_bee
100	395	6796	53.6	393.2	4.5	17.223	139.000	3.940	45.804	14864	3.9	37.668	791	154.5	191.5	10.1	0.013	400	320	pg162_def.cx9a2e_bee
100	394	6801	53.6	390.3	4.4	17.244	139.207	3.915	45.597	14877	3.9	37.721	791	154.5	183.9	9.9	0.012	400	320	pg162_def.cx9a2f_bee
100	394	6794	53.6	393.0	4.5	17.244	139.190	3.942	45.796	14860	3.9	37.716	792	154.5	190.1	10.1	0.012	400	336	pg162_def.cx9a2g_bee
100	394	6792	53.5	389.6	4.4	17.244	139.201	3.908	45.544	14942	4.0	37.934	812	154.5	185.6	10.1	0.011	400	320	pg162_def.cx9a2acef_bee
100	394	6793	53.5	387.1	4.4	17.245	139.193	3.883	45.348	14952	4.0	37.959	812	154.5	183.5	10.2	0.016	400	332	pg162_def.cx9a2bcef_bee
qr500.L3
qr500.L3: range queries with 500 insert/s per client
Performance metrics for all DBMS, not just the ones listed above. Some are normalized by throughput, others are not. Legend for results is here.
ips	qps	rps	rmbps	wps	wmbps	rpq	rkbpq	wpi	wkbpi	csps	cpups	cspq	cpupq	dbgb1	dbgb2	rss	maxop	p50	p99	tag
499	8258	883	7.1	614.7	11.1	0.107	0.875	1.232	22.796	33652	14.7	4.075	142	154.6	190.5	9.6	0.023	7945	7446	pg162_def.cx9a2_bee
499	7964	883	7.1	615.2	11.1	0.111	0.907	1.234	22.803	32555	14.6	4.088	147	154.6	190.2	9.8	0.027	7770	7275	pg162_def.cx9a2a_bee
499	8088	883	7.1	616.4	11.1	0.109	0.893	1.235	22.813	32992	14.8	4.079	146	154.6	190.3	9.7	0.029	7783	7288	pg162_def.cx9a2b_bee
499	8199	882	7.0	616.1	11.1	0.108	0.880	1.236	22.810	33550	15.4	4.092	150	154.6	190.0	9.5	0.033	7887	7292	pg162_def.cx9a2c_bee
499	8062	883	7.1	614.5	11.1	0.110	0.896	1.232	22.790	32933	14.8	4.085	147	154.6	190.4	9.7	0.028	7754	7303	pg162_def.cx9a2e_bee
499	8150	883	7.1	615.7	11.2	0.108	0.886	1.234	22.949	33234	14.7	4.078	144	154.6	184.0	9.6	0.029	7892	7339	pg162_def.cx9a2f_bee
499	7979	883	7.1	615.7	11.1	0.111	0.905	1.235	22.839	32599	14.7	4.086	147	154.6	190.2	9.6	0.028	7661	7188	pg162_def.cx9a2g_bee
498	8068	883	7.1	616.9	11.2	0.109	0.896	1.238	23.018	33086	15.0	4.101	149	154.6	185.6	9.8	0.040	7851	7368	pg162_def.cx9a2acef_bee
499	8111	882	7.0	619.1	11.2	0.109	0.890	1.241	23.056	33199	15.1	4.093	149	154.6	183.6	9.5	0.035	7815	7288	pg162_def.cx9a2bcef_bee
qp500.L4
qp500.L4: point queries with 500 insert/s per client
Performance metrics for all DBMS, not just the ones listed above. Some are normalized by throughput, others are not. Legend for results is here.
ips	qps	rps	rmbps	wps	wmbps	rpq	rkbpq	wpi	wkbpi	csps	cpups	cspq	cpupq	dbgb1	dbgb2	rss	maxop	p50	p99	tag
499	381	7448	58.5	1327.8	16.8	19.539	157.256	2.663	34.408	16241	7.0	42.604	1469	154.7	189.3	8.7	0.039	384	320	pg162_def.cx9a2_bee
499	380	7430	58.4	1326.8	16.7	19.527	157.171	2.658	34.352	16199	7.0	42.573	1472	154.7	189.1	8.6	0.032	384	320	pg162_def.cx9a2a_bee
499	382	7450	58.6	1326.4	16.7	19.527	157.166	2.659	34.359	16240	7.0	42.568	1468	154.7	189.1	8.8	0.028	384	320	pg162_def.cx9a2b_bee
499	381	7438	58.5	1326.6	16.7	19.521	157.114	2.658	34.352	16296	7.2	42.773	1512	154.7	189.0	8.7	0.027	384	320	pg162_def.cx9a2c_bee
499	382	7450	58.6	1327.2	16.7	19.529	157.197	2.661	34.379	16235	6.9	42.557	1447	154.7	189.2	8.6	0.033	384	320	pg162_def.cx9a2e_bee
499	382	7446	58.5	1326.2	16.7	19.519	157.108	2.657	34.261	16236	7.0	42.559	1468	154.7	184.1	9.0	0.035	384	320	pg162_def.cx9a2f_bee
499	381	7439	58.5	1326.6	16.7	19.525	157.145	2.658	34.340	16223	7.0	42.580	1470	154.7	189.0	8.9	0.036	384	320	pg162_def.cx9a2g_bee
498	381	7448	58.5	1325.4	16.7	19.558	157.420	2.660	34.312	16318	7.2	42.853	1513	154.7	185.7	8.7	0.034	384	320	pg162_def.cx9a2acef_bee
499	381	7443	58.5	1321.8	16.7	19.535	157.228	2.650	34.218	16302	7.2	42.787	1512	154.7	183.7	8.6	0.036	384	320	pg162_def.cx9a2bcef_bee
qr1000.L5
qr1000.L5: range queries with 1000 insert/s per client
Performance metrics for all DBMS, not just the ones listed above. Some are normalized by throughput, others are not. Legend for results is here.
ips	qps	rps	rmbps	wps	wmbps	rpq	rkbpq	wpi	wkbpi	csps	cpups	cspq	cpupq	dbgb1	dbgb2	rss	maxop	p50	p99	tag
998	7071	1683	13.5	1555.0	23.3	0.238	1.956	1.559	23.947	31002	22.3	4.384	252	154.8	188.4	8.5	0.141	6904	5934	pg162_def.cx9a2_bee
997	6980	1682	13.5	1553.7	23.3	0.241	1.981	1.558	23.939	30638	22.3	4.389	256	154.8	188.2	8.5	0.133	6792	5881	pg162_def.cx9a2a_bee
998	7076	1683	13.5	1554.5	23.3	0.238	1.954	1.558	23.939	31000	22.3	4.381	252	154.8	188.2	8.6	0.145	6908	5961	pg162_def.cx9a2b_bee
998	7049	1682	13.5	1553.9	23.3	0.239	1.961	1.557	23.914	30997	22.5	4.397	255	154.8	188.1	8.5	0.142	6920	5966	pg162_def.cx9a2c_bee
998	7102	1683	13.5	1554.4	23.3	0.237	1.948	1.557	23.925	31097	22.3	4.378	251	154.8	188.3	8.5	0.134	6919	5946	pg162_def.cx9a2e_bee
998	7066	1682	13.5	1554.6	23.4	0.238	1.957	1.557	24.035	30948	22.3	4.380	252	154.8	184.3	8.8	0.134	6871	5929	pg162_def.cx9a2f_bee
998	6943	1683	13.5	1554.6	23.3	0.242	1.993	1.557	23.936	30491	22.3	4.391	257	154.8	188.1	8.7	0.138	6745	5897	pg162_def.cx9a2g_bee
998	7059	1684	13.5	1557.1	23.5	0.239	1.961	1.560	24.078	31050	22.6	4.398	256	154.8	185.9	8.5	0.138	6950	5993	pg162_def.cx9a2acef_bee
998	6872	1684	13.5	1557.9	23.7	0.245	2.013	1.561	24.333	30339	22.6	4.415	263	154.8	184.2	8.4	0.140	6776	5865	pg162_def.cx9a2bcef_bee
qp1000.L6
qp1000.L6: point queries with 1000 insert/s per client
Performance metrics for all DBMS, not just the ones listed above. Some are normalized by throughput, others are not. Legend for results is here.
ips	qps	rps	rmbps	wps	wmbps	rpq	rkbpq	wpi	wkbpi	csps	cpups	cspq	cpupq	dbgb1	dbgb2	rss	maxop	p50	p99	tag
929	359	7982	62.7	2180.6	30.0	22.245	178.844	2.348	33.091	17528	17.3	48.851	3857	155.0	192.6	7.8	0.044	368	319	pg162_def.cx9a2_bee
924	357	7954	62.5	2170.9	30.0	22.256	178.932	2.349	33.236	17482	17.3	48.915	3872	155.0	192.6	8.1	0.038	367	304	pg162_def.cx9a2a_bee
926	358	7970	62.6	2174.4	30.0	22.232	178.742	2.348	33.202	17504	17.2	48.826	3838	155.0	192.6	8.1	0.037	368	304	pg162_def.cx9a2b_bee
929	358	7972	62.6	2180.7	30.2	22.243	178.816	2.348	33.274	17591	17.5	49.082	3906	155.0	192.6	7.9	0.039	368	304	pg162_def.cx9a2c_bee
927	358	7967	62.5	2175.5	30.0	22.235	178.759	2.347	33.126	17497	17.3	48.834	3863	155.0	192.6	7.9	0.042	367	319	pg162_def.cx9a2e_bee
925	358	7965	62.5	2179.4	32.0	22.243	178.824	2.355	35.377	17532	17.2	48.957	3842	155.0	192.5	8.3	0.043	368	319	pg162_def.cx9a2f_bee
926	358	7972	62.6	2174.9	30.1	22.236	178.770	2.349	33.235	17547	17.2	48.945	3838	155.0	192.6	8.0	0.045	368	304	pg162_def.cx9a2g_bee
925	358	7967	62.5	2177.1	31.1	22.248	178.860	2.353	34.412	17605	17.4	49.163	3887	155.0	192.5	8.4	0.043	368	304	pg162_def.cx9a2acef_bee
926	359	7976	62.6	2178.5	31.9	22.231	178.715	2.353	35.313	17634	17.5	49.148	3902	155.0	192.5	7.9	0.044	368	319	pg162_def.cx9a2bcef_bee
l.i0
- l.i0: load without secondary indexes
- Legend for results is here.
- Each entry lists the percentage of responses that fit in that bucket (slower than max time for previous bucket, faster than min time for next bucket).
Insert response time histogram
256us	1ms	4ms	16ms	64ms	256ms	1s	4s	16s	gt	max	tag
0.000	0.000	99.998	0.001	nonzero	0.000	0.000	0.000	0.000	0.000	0.058	pg162_def.cx9a2_bee
0.000	0.000	99.998	0.001	nonzero	nonzero	0.000	0.000	0.000	0.000	0.080	pg162_def.cx9a2a_bee
0.000	0.000	99.998	0.002	0.001	nonzero	0.000	0.000	0.000	0.000	0.077	pg162_def.cx9a2b_bee
0.000	0.000	99.999	0.001	nonzero	0.000	0.000	0.000	0.000	0.000	0.060	pg162_def.cx9a2c_bee
0.000	0.000	99.998	0.001	0.001	0.000	0.000	0.000	0.000	0.000	0.054	pg162_def.cx9a2e_bee
0.000	0.000	99.999	0.001	nonzero	0.000	0.000	0.000	0.000	0.000	0.061	pg162_def.cx9a2f_bee
0.000	0.000	99.999	0.001	0.001	0.000	0.000	0.000	0.000	0.000	0.058	pg162_def.cx9a2g_bee
0.000	0.000	99.999	0.001	nonzero	0.000	0.000	0.000	0.000	0.000	0.055	pg162_def.cx9a2acef_bee
0.000	0.000	99.999	0.001	nonzero	0.000	0.000	0.000	0.000	0.000	0.059	pg162_def.cx9a2bcef_bee
l.x
- l.x: create secondary indexes
- Legend for results is here.
- Each entry lists the percentage of responses that fit in that bucket (slower than max time for previous bucket, faster than min time for next bucket).
TODO - determine whether there is data for create index response time
l.i1
- l.i1: continue load after secondary indexes created with 50 inserts per transaction
- Legend for results is here.
- Each entry lists the percentage of responses that fit in that bucket (slower than max time for previous bucket, faster than min time for next bucket).
Insert response time histogram
256us	1ms	4ms	16ms	64ms	256ms	1s	4s	16s	gt	max	tag
0.000	0.000	0.000	98.520	1.480	0.000	0.000	0.000	0.000	0.000	0.049	pg162_def.cx9a2_bee
0.000	0.000	0.000	97.575	2.425	0.000	0.000	0.000	0.000	0.000	0.061	pg162_def.cx9a2a_bee
0.000	0.000	0.000	97.765	2.235	0.000	0.000	0.000	0.000	0.000	0.053	pg162_def.cx9a2b_bee
0.000	0.000	0.000	97.320	2.680	0.000	0.000	0.000	0.000	0.000	0.056	pg162_def.cx9a2c_bee
0.000	0.000	0.000	98.361	1.639	0.000	0.000	0.000	0.000	0.000	0.050	pg162_def.cx9a2e_bee
0.000	0.000	0.000	98.650	1.350	0.000	0.000	0.000	0.000	0.000	0.060	pg162_def.cx9a2f_bee
0.000	0.000	0.000	97.821	2.179	0.000	0.000	0.000	0.000	0.000	0.056	pg162_def.cx9a2g_bee
0.000	0.000	0.000	98.406	1.593	0.001	0.000	0.000	0.000	0.000	0.103	pg162_def.cx9a2acef_bee
0.000	0.000	0.000	98.586	1.414	0.000	0.000	0.000	0.000	0.000	0.054	pg162_def.cx9a2bcef_bee
Delete response time histogram
256us	1ms	4ms	16ms	64ms	256ms	1s	4s	16s	gt	max	tag
0.004	0.316	5.766	30.134	63.780	0.000	0.000	0.000	0.000	0.000	0.047	pg162_def.cx9a2_bee
0.000	0.305	5.550	30.056	64.089	0.000	0.000	0.000	0.000	0.000	0.045	pg162_def.cx9a2a_bee
0.001	0.294	5.792	29.755	64.157	0.000	0.000	0.000	0.000	0.000	0.045	pg162_def.cx9a2b_bee
0.000	0.298	5.440	30.814	63.449	0.000	0.000	0.000	0.000	0.000	0.046	pg162_def.cx9a2c_bee
0.000	0.285	5.409	30.789	63.518	0.000	0.000	0.000	0.000	0.000	0.044	pg162_def.cx9a2e_bee
0.003	0.334	6.021	29.491	64.151	0.000	0.000	0.000	0.000	0.000	0.047	pg162_def.cx9a2f_bee
0.000	0.338	5.361	30.134	64.168	0.000	0.000	0.000	0.000	0.000	0.045	pg162_def.cx9a2g_bee
0.000	0.335	5.848	29.834	63.984	0.000	0.000	0.000	0.000	0.000	0.046	pg162_def.cx9a2acef_bee
0.001	0.448	5.470	30.650	63.431	0.000	0.000	0.000	0.000	0.000	0.046	pg162_def.cx9a2bcef_bee
l.i2
- l.i2: continue load after secondary indexes created with 5 inserts per transaction
- Legend for results is here.
- Each entry lists the percentage of responses that fit in that bucket (slower than max time for previous bucket, faster than min time for next bucket).
Insert response time histogram
256us	1ms	4ms	16ms	64ms	256ms	1s	4s	16s	gt	max	tag
0.000	0.008	98.650	1.325	0.017	0.000	0.000	0.000	0.000	0.000	0.022	pg162_def.cx9a2_bee
0.000	0.005	98.879	1.099	0.017	0.000	0.000	0.000	0.000	0.000	0.034	pg162_def.cx9a2a_bee
0.000	0.006	98.862	1.114	0.018	0.000	0.000	0.000	0.000	0.000	0.033	pg162_def.cx9a2b_bee
0.000	0.003	98.582	1.399	0.015	0.000	0.000	0.000	0.000	0.000	0.034	pg162_def.cx9a2c_bee
0.000	0.007	99.227	0.751	0.015	0.000	0.000	0.000	0.000	0.000	0.033	pg162_def.cx9a2e_bee
0.000	0.006	98.643	1.336	0.016	0.000	0.000	0.000	0.000	0.000	0.033	pg162_def.cx9a2f_bee
0.000	0.009	98.893	1.083	0.015	0.000	0.000	0.000	0.000	0.000	0.021	pg162_def.cx9a2g_bee
0.000	0.005	97.520	2.462	0.013	0.000	0.000	0.000	0.000	0.000	0.034	pg162_def.cx9a2acef_bee
0.000	0.005	97.787	2.193	0.015	0.000	0.000	0.000	0.000	0.000	0.033	pg162_def.cx9a2bcef_bee
Delete response time histogram
256us	1ms	4ms	16ms	64ms	256ms	1s	4s	16s	gt	max	tag
0.000	0.000	0.000	0.000	99.999	0.001	0.000	0.000	0.000	0.000	0.112	pg162_def.cx9a2_bee
0.000	0.000	0.000	0.000	99.999	0.001	0.000	0.000	0.000	0.000	0.089	pg162_def.cx9a2a_bee
0.000	0.000	0.000	0.000	99.999	0.001	0.000	0.000	0.000	0.000	0.110	pg162_def.cx9a2b_bee
0.000	0.000	0.000	0.000	99.999	0.001	0.000	0.000	0.000	0.000	0.110	pg162_def.cx9a2c_bee
0.000	0.000	0.000	0.000	99.999	0.001	0.000	0.000	0.000	0.000	0.109	pg162_def.cx9a2e_bee
0.000	0.000	0.000	0.000	99.999	0.001	0.000	0.000	0.000	0.000	0.099	pg162_def.cx9a2f_bee
0.000	0.000	0.000	0.000	99.999	0.001	0.000	0.000	0.000	0.000	0.106	pg162_def.cx9a2g_bee
0.000	0.000	0.000	0.000	99.999	0.001	0.000	0.000	0.000	0.000	0.109	pg162_def.cx9a2acef_bee
0.000	0.000	0.000	0.000	99.999	0.001	0.000	0.000	0.000	0.000	0.111	pg162_def.cx9a2bcef_bee
qr100.L1
- qr100.L1: range queries with 100 insert/s per client
- Legend for results is here.
- Each entry lists the percentage of responses that fit in that bucket (slower than max time for previous bucket, faster than min time for next bucket).
Query response time histogram
256us	1ms	4ms	16ms	64ms	256ms	1s	4s	16s	gt	max	tag
99.927	0.072	nonzero	0.001	nonzero	0.000	0.000	0.000	0.000	0.000	0.016	pg162_def.cx9a2_bee
99.919	0.080	nonzero	0.001	0.000	0.000	0.000	0.000	0.000	0.000	0.010	pg162_def.cx9a2a_bee
99.919	0.080	0.001	0.001	0.000	0.000	0.000	0.000	0.000	0.000	0.010	pg162_def.cx9a2b_bee
99.886	0.113	nonzero	0.001	0.000	0.000	0.000	0.000	0.000	0.000	0.015	pg162_def.cx9a2c_bee
99.916	0.083	nonzero	0.001	0.000	0.000	0.000	0.000	0.000	0.000	0.010	pg162_def.cx9a2e_bee
99.929	0.070	nonzero	0.001	0.000	0.000	0.000	0.000	0.000	0.000	0.010	pg162_def.cx9a2f_bee
99.920	0.079	nonzero	0.001	0.000	0.000	0.000	0.000	0.000	0.000	0.010	pg162_def.cx9a2g_bee
99.841	0.157	0.001	0.001	0.000	0.000	0.000	0.000	0.000	0.000	0.010	pg162_def.cx9a2acef_bee
99.880	0.119	nonzero	0.001	0.000	0.000	0.000	0.000	0.000	0.000	0.010	pg162_def.cx9a2bcef_bee
Insert response time histogram
256us	1ms	4ms	16ms	64ms	256ms	1s	4s	16s	gt	max	tag
0.000	0.000	0.000	50.611	49.389	0.000	0.000	0.000	0.000	0.000	0.030	pg162_def.cx9a2_bee
0.000	0.000	0.000	51.083	48.917	0.000	0.000	0.000	0.000	0.000	0.031	pg162_def.cx9a2a_bee
0.000	0.000	0.000	50.694	49.306	0.000	0.000	0.000	0.000	0.000	0.035	pg162_def.cx9a2b_bee
0.000	0.000	0.000	48.028	51.972	0.000	0.000	0.000	0.000	0.000	0.031	pg162_def.cx9a2c_bee
0.000	0.000	0.000	51.583	48.417	0.000	0.000	0.000	0.000	0.000	0.031	pg162_def.cx9a2e_bee
0.000	0.000	0.000	43.111	56.889	0.000	0.000	0.000	0.000	0.000	0.032	pg162_def.cx9a2f_bee
0.000	0.000	0.000	49.944	50.056	0.000	0.000	0.000	0.000	0.000	0.031	pg162_def.cx9a2g_bee
0.000	0.000	0.000	47.639	52.361	0.000	0.000	0.000	0.000	0.000	0.031	pg162_def.cx9a2acef_bee
0.000	0.000	0.000	53.861	46.139	0.000	0.000	0.000	0.000	0.000	0.031	pg162_def.cx9a2bcef_bee
Delete response time histogram
256us	1ms	4ms	16ms	64ms	256ms	1s	4s	16s	gt	max	tag
0.000	24.222	75.611	0.167	0.000	0.000	0.000	0.000	0.000	0.000	0.010	pg162_def.cx9a2_bee
0.000	23.472	76.472	0.056	0.000	0.000	0.000	0.000	0.000	0.000	0.009	pg162_def.cx9a2a_bee
0.000	23.972	75.972	0.056	0.000	0.000	0.000	0.000	0.000	0.000	0.009	pg162_def.cx9a2b_bee
0.000	23.444	76.444	0.111	0.000	0.000	0.000	0.000	0.000	0.000	0.009	pg162_def.cx9a2c_bee
0.000	23.222	76.639	0.139	0.000	0.000	0.000	0.000	0.000	0.000	0.010	pg162_def.cx9a2e_bee
0.000	23.167	76.667	0.167	0.000	0.000	0.000	0.000	0.000	0.000	0.008	pg162_def.cx9a2f_bee
0.000	23.833	76.056	0.111	0.000	0.000	0.000	0.000	0.000	0.000	0.009	pg162_def.cx9a2g_bee
0.028	25.500	74.222	0.250	0.000	0.000	0.000	0.000	0.000	0.000	0.009	pg162_def.cx9a2acef_bee
0.000	23.917	76.028	0.056	0.000	0.000	0.000	0.000	0.000	0.000	0.009	pg162_def.cx9a2bcef_bee
qp100.L2
- qp100.L2: point queries with 100 insert/s per client
- Legend for results is here.
- Each entry lists the percentage of responses that fit in that bucket (slower than max time for previous bucket, faster than min time for next bucket).
Query response time histogram
256us	1ms	4ms	16ms	64ms	256ms	1s	4s	16s	gt	max	tag
0.000	nonzero	99.701	0.298	0.000	0.000	0.000	0.000	0.000	0.000	0.011	pg162_def.cx9a2_bee
0.000	nonzero	99.725	0.275	0.000	0.000	0.000	0.000	0.000	0.000	0.010	pg162_def.cx9a2a_bee
0.000	nonzero	99.763	0.236	0.000	0.000	0.000	0.000	0.000	0.000	0.011	pg162_def.cx9a2b_bee
0.000	nonzero	99.664	0.336	0.000	0.000	0.000	0.000	0.000	0.000	0.014	pg162_def.cx9a2c_bee
0.000	nonzero	99.744	0.256	0.000	0.000	0.000	0.000	0.000	0.000	0.013	pg162_def.cx9a2e_bee
0.000	nonzero	99.724	0.276	0.000	0.000	0.000	0.000	0.000	0.000	0.012	pg162_def.cx9a2f_bee
0.000	0.000	99.684	0.316	0.000	0.000	0.000	0.000	0.000	0.000	0.012	pg162_def.cx9a2g_bee
0.000	nonzero	99.711	0.289	0.000	0.000	0.000	0.000	0.000	0.000	0.011	pg162_def.cx9a2acef_bee
0.000	nonzero	99.716	0.283	nonzero	0.000	0.000	0.000	0.000	0.000	0.016	pg162_def.cx9a2bcef_bee
Insert response time histogram
256us	1ms	4ms	16ms	64ms	256ms	1s	4s	16s	gt	max	tag
0.000	0.000	0.000	20.306	79.694	0.000	0.000	0.000	0.000	0.000	0.027	pg162_def.cx9a2_bee
0.000	0.000	0.000	23.111	76.889	0.000	0.000	0.000	0.000	0.000	0.027	pg162_def.cx9a2a_bee
0.000	0.000	0.000	18.333	81.667	0.000	0.000	0.000	0.000	0.000	0.033	pg162_def.cx9a2b_bee
0.000	0.000	0.000	19.833	80.167	0.000	0.000	0.000	0.000	0.000	0.033	pg162_def.cx9a2c_bee
0.000	0.000	0.000	19.528	80.472	0.000	0.000	0.000	0.000	0.000	0.036	pg162_def.cx9a2e_bee
0.000	0.000	0.000	22.306	77.694	0.000	0.000	0.000	0.000	0.000	0.026	pg162_def.cx9a2f_bee
0.000	0.000	0.000	23.111	76.889	0.000	0.000	0.000	0.000	0.000	0.029	pg162_def.cx9a2g_bee
0.000	0.000	0.000	20.333	79.667	0.000	0.000	0.000	0.000	0.000	0.025	pg162_def.cx9a2acef_bee
0.000	0.000	0.000	20.472	79.528	0.000	0.000	0.000	0.000	0.000	0.035	pg162_def.cx9a2bcef_bee
Delete response time histogram
256us	1ms	4ms	16ms	64ms	256ms	1s	4s	16s	gt	max	tag
0.000	0.000	46.750	53.250	0.000	0.000	0.000	0.000	0.000	0.000	0.011	pg162_def.cx9a2_bee
0.000	0.000	47.139	52.861	0.000	0.000	0.000	0.000	0.000	0.000	0.011	pg162_def.cx9a2a_bee
0.000	0.000	48.333	51.667	0.000	0.000	0.000	0.000	0.000	0.000	0.012	pg162_def.cx9a2b_bee
0.000	0.000	53.083	46.917	0.000	0.000	0.000	0.000	0.000	0.000	0.011	pg162_def.cx9a2c_bee
0.000	0.000	45.583	54.417	0.000	0.000	0.000	0.000	0.000	0.000	0.009	pg162_def.cx9a2e_bee
0.000	0.000	46.222	53.778	0.000	0.000	0.000	0.000	0.000	0.000	0.009	pg162_def.cx9a2f_bee
0.000	0.000	47.556	52.444	0.000	0.000	0.000	0.000	0.000	0.000	0.009	pg162_def.cx9a2g_bee
0.000	0.000	44.194	55.806	0.000	0.000	0.000	0.000	0.000	0.000	0.011	pg162_def.cx9a2acef_bee
0.000	0.000	46.028	53.972	0.000	0.000	0.000	0.000	0.000	0.000	0.011	pg162_def.cx9a2bcef_bee
qr500.L3
- qr500.L3: range queries with 500 insert/s per client
- Legend for results is here.
- Each entry lists the percentage of responses that fit in that bucket (slower than max time for previous bucket, faster than min time for next bucket).
Query response time histogram
256us	1ms	4ms	16ms	64ms	256ms	1s	4s	16s	gt	max	tag
99.858	0.138	0.002	0.002	nonzero	0.000	0.000	0.000	0.000	0.000	0.023	pg162_def.cx9a2_bee
99.851	0.145	0.002	0.002	nonzero	0.000	0.000	0.000	0.000	0.000	0.027	pg162_def.cx9a2a_bee
99.850	0.147	0.002	0.002	nonzero	0.000	0.000	0.000	0.000	0.000	0.029	pg162_def.cx9a2b_bee
99.787	0.208	0.003	0.002	nonzero	0.000	0.000	0.000	0.000	0.000	0.033	pg162_def.cx9a2c_bee
99.851	0.146	0.002	0.002	nonzero	0.000	0.000	0.000	0.000	0.000	0.028	pg162_def.cx9a2e_bee
99.855	0.141	0.003	0.002	nonzero	0.000	0.000	0.000	0.000	0.000	0.029	pg162_def.cx9a2f_bee
99.840	0.156	0.002	0.002	nonzero	0.000	0.000	0.000	0.000	0.000	0.028	pg162_def.cx9a2g_bee
99.788	0.208	0.002	0.002	nonzero	0.000	0.000	0.000	0.000	0.000	0.040	pg162_def.cx9a2acef_bee
99.781	0.215	0.002	0.002	nonzero	0.000	0.000	0.000	0.000	0.000	0.035	pg162_def.cx9a2bcef_bee
Insert response time histogram
256us	1ms	4ms	16ms	64ms	256ms	1s	4s	16s	gt	max	tag
0.000	0.000	0.000	78.567	21.433	0.000	0.000	0.000	0.000	0.000	0.035	pg162_def.cx9a2_bee
0.000	0.000	0.000	81.083	18.917	0.000	0.000	0.000	0.000	0.000	0.042	pg162_def.cx9a2a_bee
0.000	0.000	0.000	81.217	18.783	0.000	0.000	0.000	0.000	0.000	0.035	pg162_def.cx9a2b_bee
0.000	0.000	0.000	82.317	17.683	0.000	0.000	0.000	0.000	0.000	0.036	pg162_def.cx9a2c_bee
0.000	0.000	0.000	80.311	19.689	0.000	0.000	0.000	0.000	0.000	0.036	pg162_def.cx9a2e_bee
0.000	0.000	0.000	80.833	19.167	0.000	0.000	0.000	0.000	0.000	0.038	pg162_def.cx9a2f_bee
0.000	0.000	0.000	82.861	17.139	0.000	0.000	0.000	0.000	0.000	0.045	pg162_def.cx9a2g_bee
0.000	0.000	0.000	81.367	18.633	0.000	0.000	0.000	0.000	0.000	0.035	pg162_def.cx9a2acef_bee
0.000	0.000	0.000	80.589	19.411	0.000	0.000	0.000	0.000	0.000	0.037	pg162_def.cx9a2bcef_bee
Delete response time histogram
256us	1ms	4ms	16ms	64ms	256ms	1s	4s	16s	gt	max	tag
0.000	0.000	0.000	98.178	1.822	0.000	0.000	0.000	0.000	0.000	0.020	pg162_def.cx9a2_bee
0.000	0.000	0.000	98.261	1.739	0.000	0.000	0.000	0.000	0.000	0.022	pg162_def.cx9a2a_bee
0.000	0.000	0.000	98.217	1.783	0.000	0.000	0.000	0.000	0.000	0.021	pg162_def.cx9a2b_bee
0.000	0.000	0.000	98.194	1.806	0.000	0.000	0.000	0.000	0.000	0.019	pg162_def.cx9a2c_bee
0.000	0.000	0.000	98.056	1.944	0.000	0.000	0.000	0.000	0.000	0.020	pg162_def.cx9a2e_bee
0.000	0.000	0.000	98.272	1.728	0.000	0.000	0.000	0.000	0.000	0.019	pg162_def.cx9a2f_bee
0.000	0.000	0.000	98.300	1.700	0.000	0.000	0.000	0.000	0.000	0.020	pg162_def.cx9a2g_bee
0.000	0.000	0.000	98.044	1.956	0.000	0.000	0.000	0.000	0.000	0.019	pg162_def.cx9a2acef_bee
0.000	0.000	0.000	98.006	1.994	0.000	0.000	0.000	0.000	0.000	0.021	pg162_def.cx9a2bcef_bee
qp500.L4
- qp500.L4: point queries with 500 insert/s per client
- Legend for results is here.
- Each entry lists the percentage of responses that fit in that bucket (slower than max time for previous bucket, faster than min time for next bucket).
Query response time histogram
256us	1ms	4ms	16ms	64ms	256ms	1s	4s	16s	gt	max	tag
0.000	nonzero	98.953	1.046	0.001	0.000	0.000	0.000	0.000	0.000	0.039	pg162_def.cx9a2_bee
0.000	0.000	99.019	0.981	0.001	0.000	0.000	0.000	0.000	0.000	0.032	pg162_def.cx9a2a_bee
0.000	0.000	99.075	0.924	0.001	0.000	0.000	0.000	0.000	0.000	0.028	pg162_def.cx9a2b_bee
0.000	0.000	99.009	0.990	0.001	0.000	0.000	0.000	0.000	0.000	0.027	pg162_def.cx9a2c_bee
0.000	0.000	99.083	0.916	0.001	0.000	0.000	0.000	0.000	0.000	0.033	pg162_def.cx9a2e_bee
0.000	nonzero	99.031	0.968	0.001	0.000	0.000	0.000	0.000	0.000	0.035	pg162_def.cx9a2f_bee
0.000	0.000	98.919	1.080	0.001	0.000	0.000	0.000	0.000	0.000	0.036	pg162_def.cx9a2g_bee
0.000	0.000	99.076	0.923	0.001	0.000	0.000	0.000	0.000	0.000	0.034	pg162_def.cx9a2acef_bee
0.000	nonzero	98.987	1.012	0.001	0.000	0.000	0.000	0.000	0.000	0.036	pg162_def.cx9a2bcef_bee
Insert response time histogram
256us	1ms	4ms	16ms	64ms	256ms	1s	4s	16s	gt	max	tag
0.000	0.000	0.000	97.017	2.978	0.006	0.000	0.000	0.000	0.000	0.069	pg162_def.cx9a2_bee
0.000	0.000	0.000	97.789	2.211	0.000	0.000	0.000	0.000	0.000	0.042	pg162_def.cx9a2a_bee
0.000	0.000	0.000	97.672	2.328	0.000	0.000	0.000	0.000	0.000	0.039	pg162_def.cx9a2b_bee
0.000	0.000	0.000	97.144	2.856	0.000	0.000	0.000	0.000	0.000	0.052	pg162_def.cx9a2c_bee
0.000	0.000	0.000	97.972	2.028	0.000	0.000	0.000	0.000	0.000	0.036	pg162_def.cx9a2e_bee
0.000	0.000	0.000	97.872	2.128	0.000	0.000	0.000	0.000	0.000	0.037	pg162_def.cx9a2f_bee
0.000	0.000	0.000	96.956	3.044	0.000	0.000	0.000	0.000	0.000	0.045	pg162_def.cx9a2g_bee
0.000	0.000	0.000	97.767	2.233	0.000	0.000	0.000	0.000	0.000	0.040	pg162_def.cx9a2acef_bee
0.000	0.000	0.000	96.789	3.211	0.000	0.000	0.000	0.000	0.000	0.053	pg162_def.cx9a2bcef_bee
Delete response time histogram
256us	1ms	4ms	16ms	64ms	256ms	1s	4s	16s	gt	max	tag
0.000	0.000	0.000	20.250	79.750	0.000	0.000	0.000	0.000	0.000	0.048	pg162_def.cx9a2_bee
0.000	0.000	0.000	17.867	82.133	0.000	0.000	0.000	0.000	0.000	0.046	pg162_def.cx9a2a_bee
0.000	0.000	0.000	18.550	81.450	0.000	0.000	0.000	0.000	0.000	0.049	pg162_def.cx9a2b_bee
0.000	0.000	0.000	18.183	81.817	0.000	0.000	0.000	0.000	0.000	0.038	pg162_def.cx9a2c_bee
0.000	0.000	0.000	19.011	80.989	0.000	0.000	0.000	0.000	0.000	0.038	pg162_def.cx9a2e_bee
0.000	0.000	0.000	18.444	81.556	0.000	0.000	0.000	0.000	0.000	0.049	pg162_def.cx9a2f_bee
0.000	0.000	0.000	18.756	81.244	0.000	0.000	0.000	0.000	0.000	0.037	pg162_def.cx9a2g_bee
0.000	0.000	0.000	16.144	83.856	0.000	0.000	0.000	0.000	0.000	0.047	pg162_def.cx9a2acef_bee
0.000	0.000	0.000	17.422	82.578	0.000	0.000	0.000	0.000	0.000	0.049	pg162_def.cx9a2bcef_bee
qr1000.L5
- qr1000.L5: range queries with 1000 insert/s per client
- Legend for results is here.
- Each entry lists the percentage of responses that fit in that bucket (slower than max time for previous bucket, faster than min time for next bucket).
Query response time histogram
256us	1ms	4ms	16ms	64ms	256ms	1s	4s	16s	gt	max	tag
98.138	1.850	0.008	0.005	nonzero	nonzero	0.000	0.000	0.000	0.000	0.141	pg162_def.cx9a2_bee
98.003	1.985	0.007	0.004	nonzero	nonzero	0.000	0.000	0.000	0.000	0.133	pg162_def.cx9a2a_bee
98.146	1.842	0.008	0.004	nonzero	nonzero	0.000	0.000	0.000	0.000	0.145	pg162_def.cx9a2b_bee
98.026	1.962	0.008	0.004	nonzero	nonzero	0.000	0.000	0.000	0.000	0.142	pg162_def.cx9a2c_bee
98.106	1.883	0.007	0.004	nonzero	nonzero	0.000	0.000	0.000	0.000	0.134	pg162_def.cx9a2e_bee
98.070	1.919	0.007	0.004	nonzero	nonzero	0.000	0.000	0.000	0.000	0.134	pg162_def.cx9a2f_bee
97.822	2.166	0.007	0.004	nonzero	nonzero	0.000	0.000	0.000	0.000	0.138	pg162_def.cx9a2g_bee
98.096	1.893	0.007	0.004	nonzero	nonzero	0.000	0.000	0.000	0.000	0.138	pg162_def.cx9a2acef_bee
97.801	2.187	0.008	0.004	nonzero	nonzero	0.000	0.000	0.000	0.000	0.140	pg162_def.cx9a2bcef_bee
Insert response time histogram
256us	1ms	4ms	16ms	64ms	256ms	1s	4s	16s	gt	max	tag
0.000	0.000	0.000	89.103	10.897	0.000	0.000	0.000	0.000	0.000	0.034	pg162_def.cx9a2_bee
0.000	0.000	0.000	91.197	8.803	0.000	0.000	0.000	0.000	0.000	0.053	pg162_def.cx9a2a_bee
0.000	0.000	0.000	87.981	12.019	0.000	0.000	0.000	0.000	0.000	0.035	pg162_def.cx9a2b_bee
0.000	0.000	0.000	88.600	11.400	0.000	0.000	0.000	0.000	0.000	0.051	pg162_def.cx9a2c_bee
0.000	0.000	0.000	89.908	10.092	0.000	0.000	0.000	0.000	0.000	0.046	pg162_def.cx9a2e_bee
0.000	0.000	0.000	90.003	9.997	0.000	0.000	0.000	0.000	0.000	0.062	pg162_def.cx9a2f_bee
0.000	0.000	0.000	89.814	10.186	0.000	0.000	0.000	0.000	0.000	0.051	pg162_def.cx9a2g_bee
0.000	0.000	0.000	93.283	6.717	0.000	0.000	0.000	0.000	0.000	0.053	pg162_def.cx9a2acef_bee
0.000	0.000	0.000	88.722	11.278	0.000	0.000	0.000	0.000	0.000	0.042	pg162_def.cx9a2bcef_bee
Delete response time histogram
256us	1ms	4ms	16ms	64ms	256ms	1s	4s	16s	gt	max	tag
0.000	0.000	0.000	0.000	99.997	0.003	0.000	0.000	0.000	0.000	0.066	pg162_def.cx9a2_bee
0.000	0.000	0.000	0.000	100.000	0.000	0.000	0.000	0.000	0.000	0.054	pg162_def.cx9a2a_bee
0.000	0.000	0.000	0.000	99.997	0.003	0.000	0.000	0.000	0.000	0.073	pg162_def.cx9a2b_bee
0.000	0.000	0.000	0.000	99.997	0.003	0.000	0.000	0.000	0.000	0.075	pg162_def.cx9a2c_bee
0.000	0.000	0.000	0.000	100.000	0.000	0.000	0.000	0.000	0.000	0.058	pg162_def.cx9a2e_bee
0.000	0.000	0.000	0.000	99.997	0.003	0.000	0.000	0.000	0.000	0.067	pg162_def.cx9a2f_bee
0.000	0.000	0.000	0.000	99.997	0.003	0.000	0.000	0.000	0.000	0.071	pg162_def.cx9a2g_bee
0.000	0.000	0.000	0.000	100.000	0.000	0.000	0.000	0.000	0.000	0.056	pg162_def.cx9a2acef_bee
0.000	0.000	0.000	0.000	99.997	0.003	0.000	0.000	0.000	0.000	0.074	pg162_def.cx9a2bcef_bee
qp1000.L6
- qp1000.L6: point queries with 1000 insert/s per client
- Legend for results is here.
- Each entry lists the percentage of responses that fit in that bucket (slower than max time for previous bucket, faster than min time for next bucket).
Query response time histogram
256us	1ms	4ms	16ms	64ms	256ms	1s	4s	16s	gt	max	tag
0.000	nonzero	97.650	2.347	0.003	0.000	0.000	0.000	0.000	0.000	0.044	pg162_def.cx9a2_bee
0.000	0.000	97.610	2.387	0.003	0.000	0.000	0.000	0.000	0.000	0.038	pg162_def.cx9a2a_bee
0.000	0.000	97.627	2.369	0.004	0.000	0.000	0.000	0.000	0.000	0.037	pg162_def.cx9a2b_bee
0.000	0.000	97.558	2.438	0.003	0.000	0.000	0.000	0.000	0.000	0.039	pg162_def.cx9a2c_bee
0.000	0.000	97.634	2.363	0.003	0.000	0.000	0.000	0.000	0.000	0.042	pg162_def.cx9a2e_bee
0.000	0.000	97.609	2.387	0.004	0.000	0.000	0.000	0.000	0.000	0.043	pg162_def.cx9a2f_bee
0.000	0.000	97.687	2.309	0.004	0.000	0.000	0.000	0.000	0.000	0.045	pg162_def.cx9a2g_bee
0.000	0.000	97.551	2.445	0.004	0.000	0.000	0.000	0.000	0.000	0.043	pg162_def.cx9a2acef_bee
0.000	0.000	97.607	2.389	0.003	0.000	0.000	0.000	0.000	0.000	0.044	pg162_def.cx9a2bcef_bee
Insert response time histogram
256us	1ms	4ms	16ms	64ms	256ms	1s	4s	16s	gt	max	tag
0.000	0.000	0.000	97.572	2.428	0.000	0.000	0.000	0.000	0.000	0.047	pg162_def.cx9a2_bee
0.000	0.000	0.000	97.833	2.167	0.000	0.000	0.000	0.000	0.000	0.036	pg162_def.cx9a2a_bee
0.000	0.000	0.000	97.686	2.314	0.000	0.000	0.000	0.000	0.000	0.053	pg162_def.cx9a2b_bee
0.000	0.000	0.000	97.742	2.258	0.000	0.000	0.000	0.000	0.000	0.042	pg162_def.cx9a2c_bee
0.000	0.000	0.000	97.689	2.311	0.000	0.000	0.000	0.000	0.000	0.054	pg162_def.cx9a2e_bee
0.000	0.000	0.000	97.297	2.703	0.000	0.000	0.000	0.000	0.000	0.054	pg162_def.cx9a2f_bee
0.000	0.000	0.000	97.850	2.150	0.000	0.000	0.000	0.000	0.000	0.056	pg162_def.cx9a2g_bee
0.000	0.000	0.000	97.169	2.831	0.000	0.000	0.000	0.000	0.000	0.053	pg162_def.cx9a2acef_bee
0.000	0.000	0.000	97.269	2.731	0.000	0.000	0.000	0.000	0.000	0.055	pg162_def.cx9a2bcef_bee
Delete response time histogram
256us	1ms	4ms	16ms	64ms	256ms	1s	4s	16s	gt	max	tag
0.000	0.000	0.000	0.000	99.958	0.042	0.000	0.000	0.000	0.000	0.100	pg162_def.cx9a2_bee
0.000	0.000	0.000	0.000	99.900	0.100	0.000	0.000	0.000	0.000	0.110	pg162_def.cx9a2a_bee
0.000	0.000	0.000	0.000	99.936	0.064	0.000	0.000	0.000	0.000	0.095	pg162_def.cx9a2b_bee
0.000	0.000	0.000	0.000	99.964	0.036	0.000	0.000	0.000	0.000	0.109	pg162_def.cx9a2c_bee
0.000	0.000	0.000	0.000	99.911	0.089	0.000	0.000	0.000	0.000	0.095	pg162_def.cx9a2e_bee
0.000	0.000	0.000	0.000	99.931	0.069	0.000	0.000	0.000	0.000	0.113	pg162_def.cx9a2f_bee
0.000	0.000	0.000	0.000	99.919	0.081	0.000	0.000	0.000	0.000	0.108	pg162_def.cx9a2g_bee
0.000	0.000	0.000	0.000	99.950	0.050	0.000	0.000	0.000	0.000	0.101	pg162_def.cx9a2acef_bee
0.000	0.000	0.000	0.000	99.878	0.122	0.000	0.000	0.000	0.000	0.099	pg162_def.cx9a2bcef_bee