Introduction
This is a report for the insert benchmark with 800M docs and 1 client(s). It is generated by scripts (bash, awk, sed) and Tufte might not be impressed. An overview of the insert benchmark is here and a short update is here. Below, by DBMS, I mean DBMS+version.config. An example is my8020.c10b40 where my means MySQL, 8020 is version 8.0.20 and c10b40 is the name for the configuration file.
The test server has 8 AMD cores, 16G RAM and an NVMe SSD. It is described here as the Beelink. The benchmark was run with 1 client and there were 1 or 3 connections per client (1 for queries or inserts without rate limits, 1+1 for rate limited inserts+deletes). It uses 1 table. It loads 800M rows per table without secondary indexes, creates 3 secondary indexes per table, then inserts 4m+1m rows per table with a delete per insert to avoid growing the table. It then does 6 read+write tests for 1800s each that do queries as fast as possible with 100,100,500,500,1000,1000 inserts/s and the same for deletes/s per client concurrent with the queries. The database is cached in memory. Clients and the DBMS share one server. The per-database configs are in the per-database subdirectories here.
The tested DBMS are:
- my5651_rel.cz10a_bee - MySQL 5.6.51 with InnoDB, rel build, cz10a_bee config
- my5744_rel.cz10a_bee - MySQL 5.7.44 with InnoDB, rel build, cz10a_bee config
- my8036_rel.cz10a_bee - MySQL 8.0.36 with InnoDB, rel build, cz10a_bee config
Contents
- Summary
- l.i0: load without secondary indexes
- l.x: create secondary indexes
- l.i1: continue load after secondary indexes created with 50 inserts per transaction
- l.i2: continue load after secondary indexes created with 5 inserts per transaction
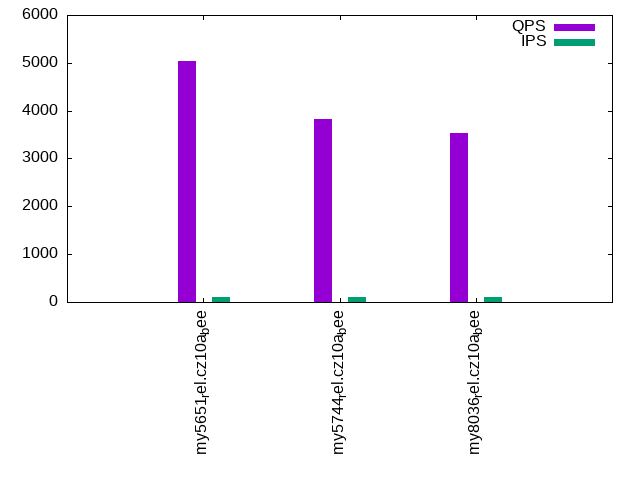
- qr100.L1: range queries with 100 insert/s per client
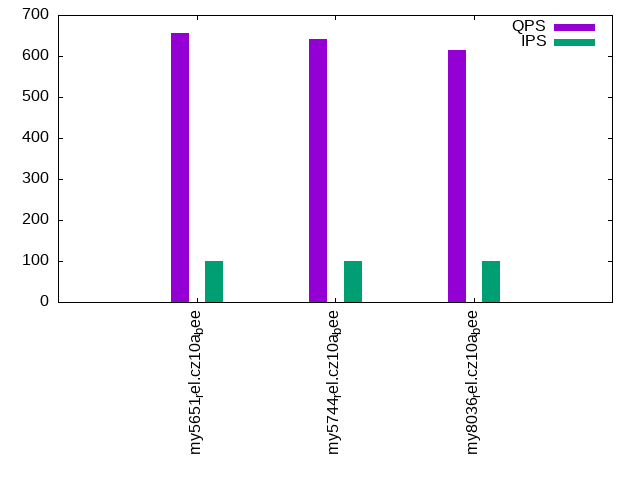
- qp100.L2: point queries with 100 insert/s per client
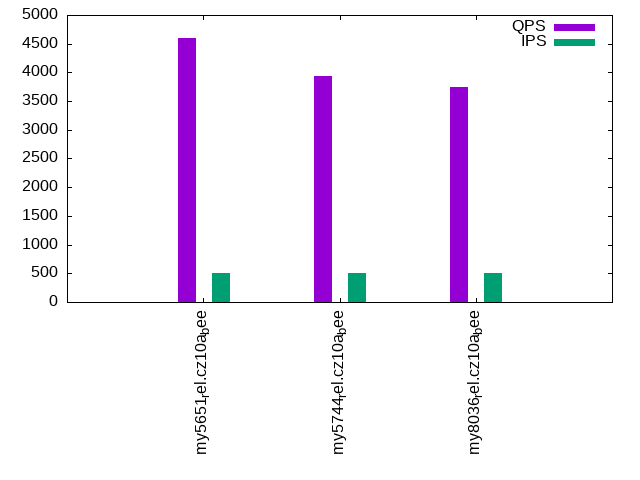
- qr500.L3: range queries with 500 insert/s per client
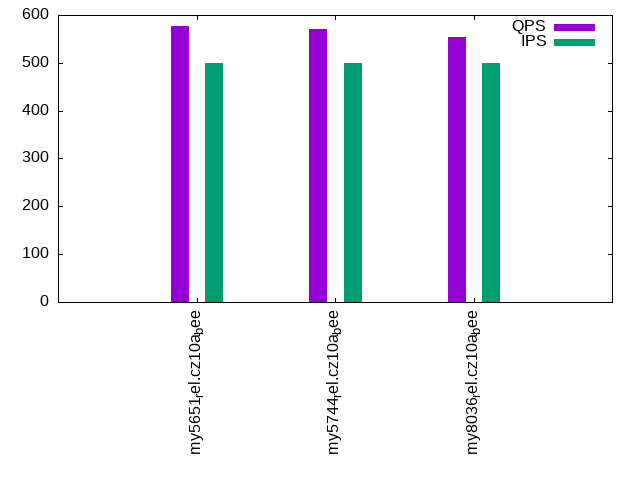
- qp500.L4: point queries with 500 insert/s per client
- qr1000.L5: range queries with 1000 insert/s per client
- qp1000.L6: point queries with 1000 insert/s per client
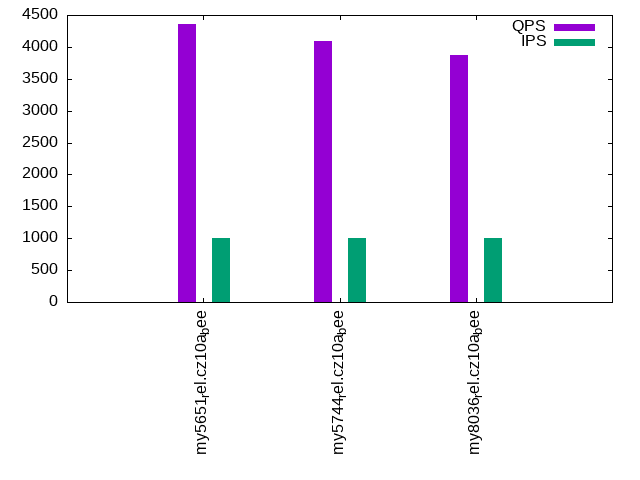
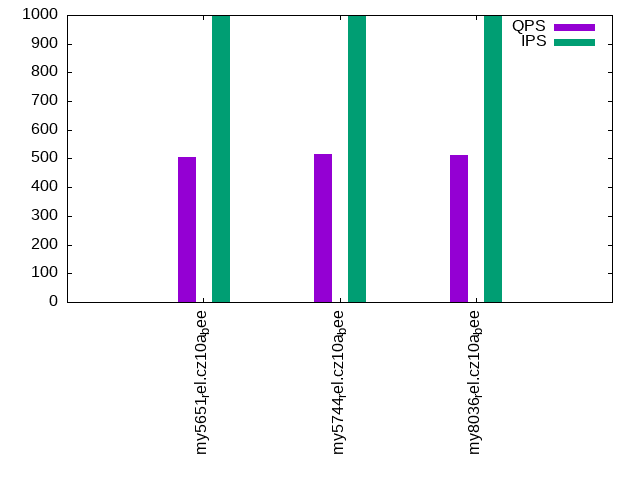
Summary
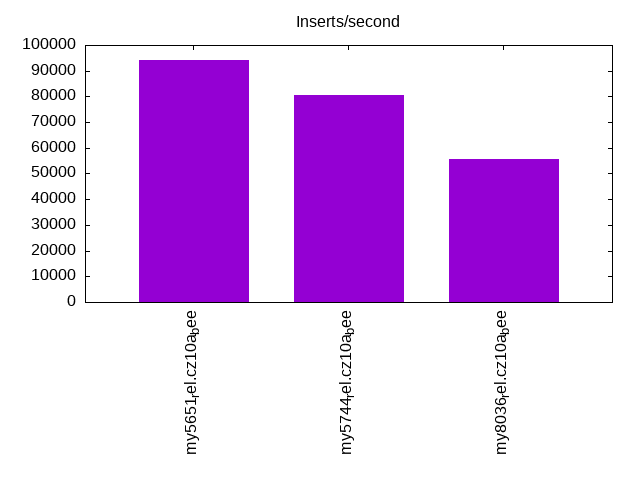
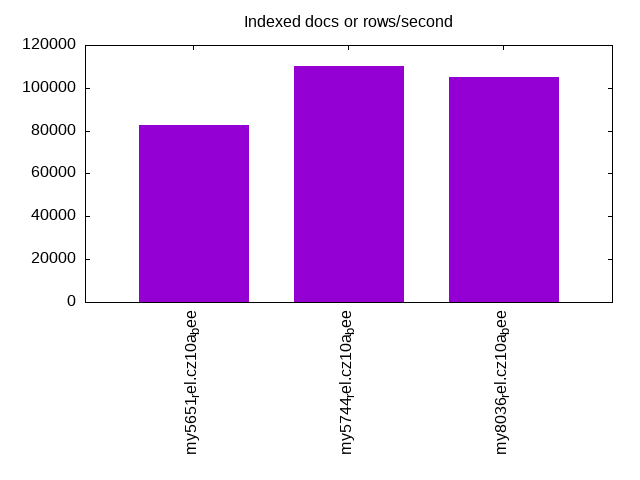
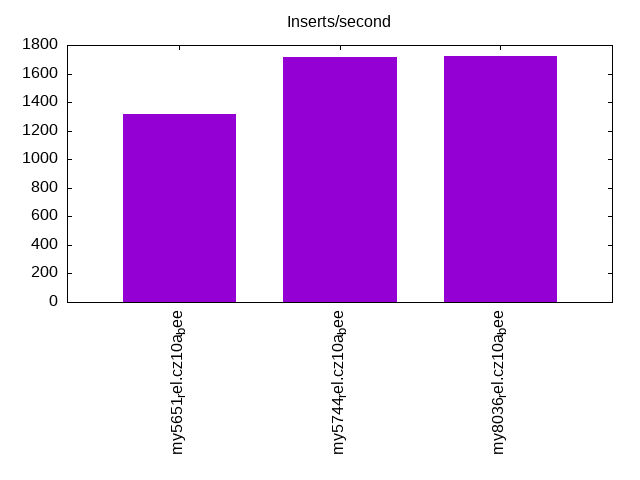
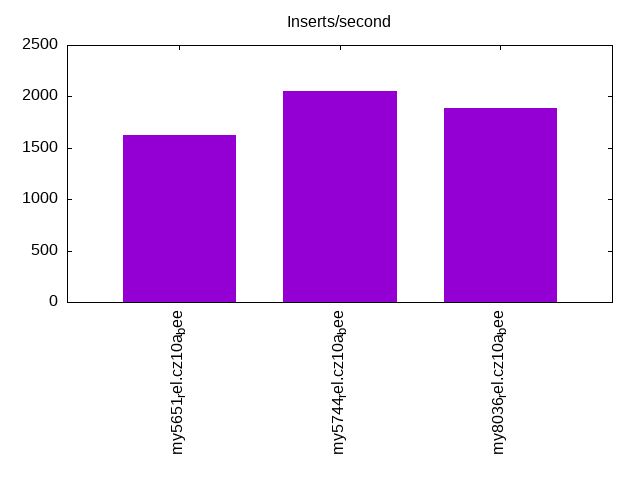
The numbers are inserts/s for l.i0, l.i1 and l.i2, indexed docs (or rows) /s for l.x and queries/s for qr100, qp100 thru qr1000, qp1000" The values are the average rate over the entire test for inserts (IPS) and queries (QPS). The range of values for IPS and QPS is split into 3 parts: bottom 25%, middle 50%, top 25%. Values in the bottom 25% have a red background, values in the top 25% have a green background and values in the middle have no color. A gray background is used for values that can be ignored because the DBMS did not sustain the target insert rate. Red backgrounds are not used when the minimum value is within 80% of the max value.
| dbms | l.i0 | l.x | l.i1 | l.i2 | qr100 | qp100 | qr500 | qp500 | qr1000 | qp1000 |
|---|---|---|---|---|---|---|---|---|---|---|
| my5651_rel.cz10a_bee | 94140 | 82483 | 1320 | 1623 | 5044 | 656 | 4601 | 577 | 4366 | 505 |
| my5744_rel.cz10a_bee | 80572 | 110375 | 1713 | 2049 | 3830 | 642 | 3935 | 571 | 4095 | 517 |
| my8036_rel.cz10a_bee | 55517 | 105291 | 1720 | 1890 | 3530 | 615 | 3748 | 554 | 3870 | 513 |
This table has relative throughput, throughput for the DBMS relative to the DBMS in the first line, using the absolute throughput from the previous table. Values less than 0.95 have a yellow background. Values greater than 1.05 have a blue background.
| dbms | l.i0 | l.x | l.i1 | l.i2 | qr100 | qp100 | qr500 | qp500 | qr1000 | qp1000 |
|---|---|---|---|---|---|---|---|---|---|---|
| my5651_rel.cz10a_bee | 1.00 | 1.00 | 1.00 | 1.00 | 1.00 | 1.00 | 1.00 | 1.00 | 1.00 | 1.00 |
| my5744_rel.cz10a_bee | 0.86 | 1.34 | 1.30 | 1.26 | 0.76 | 0.98 | 0.86 | 0.99 | 0.94 | 1.02 |
| my8036_rel.cz10a_bee | 0.59 | 1.28 | 1.30 | 1.16 | 0.70 | 0.94 | 0.81 | 0.96 | 0.89 | 1.02 |
This lists the average rate of inserts/s for the tests that do inserts concurrent with queries. For such tests the query rate is listed in the table above. The read+write tests are setup so that the insert rate should match the target rate every second. Cells that are not at least 95% of the target have a red background to indicate a failure to satisfy the target.
| dbms | qr100.L1 | qp100.L2 | qr500.L3 | qp500.L4 | qr1000.L5 | qp1000.L6 |
|---|---|---|---|---|---|---|
| my5651_rel.cz10a_bee | 100 | 100 | 499 | 499 | 998 | 998 |
| my5744_rel.cz10a_bee | 100 | 100 | 499 | 499 | 998 | 998 |
| my8036_rel.cz10a_bee | 100 | 100 | 499 | 499 | 997 | 997 |
| target | 100 | 100 | 500 | 500 | 1000 | 1000 |
l.i0
l.i0: load without secondary indexes. Graphs for performance per 1-second interval are here.
Average throughput:
Insert response time histogram: each cell has the percentage of responses that take <= the time in the header and max is the max response time in seconds. For the max column values in the top 25% of the range have a red background and in the bottom 25% of the range have a green background. The red background is not used when the min value is within 80% of the max value.
| dbms | 256us | 1ms | 4ms | 16ms | 64ms | 256ms | 1s | 4s | 16s | gt | max |
|---|---|---|---|---|---|---|---|---|---|---|---|
| my5651_rel.cz10a_bee | 76.153 | 23.693 | 0.103 | 0.047 | 0.004 | 0.237 | |||||
| my5744_rel.cz10a_bee | 0.438 | 99.191 | 0.221 | 0.147 | 0.002 | 0.127 | |||||
| my8036_rel.cz10a_bee | 99.409 | 0.440 | 0.148 | 0.003 | 0.097 |
Performance metrics for the DBMS listed above. Some are normalized by throughput, others are not. Legend for results is here.
ips	qps	rps	rmbps	wps	wmbps	rpq	rkbpq	wpi	wkbpi	csps	cpups	cspq	cpupq	dbgb1	dbgb2	rss	maxop	p50	p99	tag
94140	0	825	3.2	467.7	34.0	0.009	0.035	0.005	0.369	11959	22.2	0.127	19	52.6	69.1	10.6	0.237	94895	75900	my5651_rel.cz10a_bee
80572	0	0	0.0	416.7	29.2	0.000	0.000	0.005	0.371	8879	21.2	0.110	21	52.6	69.1	10.9	0.127	80817	71223	my5744_rel.cz10a_bee
55517	0	0	0.0	341.1	21.1	0.000	0.000	0.006	0.389	6636	20.2	0.120	29	52.4	69.0	11.1	0.097	55691	49844	my8036_rel.cz10a_bee
l.x
l.x: create secondary indexes.
Average throughput:
Performance metrics for the DBMS listed above. Some are normalized by throughput, others are not. Legend for results is here.
ips	qps	rps	rmbps	wps	wmbps	rpq	rkbpq	wpi	wkbpi	csps	cpups	cspq	cpupq	dbgb1	dbgb2	rss	maxop	p50	p99	tag
82483	0	549	83.4	703.4	105.7	0.007	1.035	0.009	1.312	1930	11.2	0.023	11	111.4	127.9	10.8	0.002	NA	NA	my5651_rel.cz10a_bee
110375	0	677	109.9	958.3	131.5	0.006	1.020	0.009	1.220	6541	11.9	0.059	9	121.1	137.7	11.1	0.002	NA	NA	my5744_rel.cz10a_bee
105291	0	1764	167.1	2145.2	150.6	0.017	1.625	0.020	1.465	8696	43.7	0.083	33	120.7	137.3	11.3	0.004	NA	NA	my8036_rel.cz10a_bee
l.i1
l.i1: continue load after secondary indexes created with 50 inserts per transaction. Graphs for performance per 1-second interval are here.
Average throughput:
Insert response time histogram: each cell has the percentage of responses that take <= the time in the header and max is the max response time in seconds. For the max column values in the top 25% of the range have a red background and in the bottom 25% of the range have a green background. The red background is not used when the min value is within 80% of the max value.
| dbms | 256us | 1ms | 4ms | 16ms | 64ms | 256ms | 1s | 4s | 16s | gt | max |
|---|---|---|---|---|---|---|---|---|---|---|---|
| my5651_rel.cz10a_bee | 0.513 | 89.305 | 10.180 | 0.003 | 0.721 | ||||||
| my5744_rel.cz10a_bee | 22.715 | 71.804 | 5.475 | 0.006 | 0.350 | ||||||
| my8036_rel.cz10a_bee | 17.212 | 77.422 | 5.365 | 0.247 |
Delete response time histogram: each cell has the percentage of responses that take <= the time in the header and max is the max response time in seconds. For the max column values in the top 25% of the range have a red background and in the bottom 25% of the range have a green background. The red background is not used when the min value is within 80% of the max value.
| dbms | 256us | 1ms | 4ms | 16ms | 64ms | 256ms | 1s | 4s | 16s | gt | max |
|---|---|---|---|---|---|---|---|---|---|---|---|
| my5651_rel.cz10a_bee | 6.420 | 88.865 | 4.709 | 0.005 | 0.001 | 0.572 | |||||
| my5744_rel.cz10a_bee | 84.026 | 15.712 | 0.251 | 0.010 | 0.142 | ||||||
| my8036_rel.cz10a_bee | 46.030 | 53.601 | 0.364 | 0.005 | 0.115 |
Performance metrics for the DBMS listed above. Some are normalized by throughput, others are not. Legend for results is here.
ips	qps	rps	rmbps	wps	wmbps	rpq	rkbpq	wpi	wkbpi	csps	cpups	cspq	cpupq	dbgb1	dbgb2	rss	maxop	p50	p99	tag
1320	0	7421	115.4	9010.8	294.5	5.621	89.491	6.826	228.422	43247	14.3	32.760	867	148.0	164.5	10.5	0.721	1249	849	my5651_rel.cz10a_bee
1713	0	8830	138.0	10918.1	354.9	5.155	82.472	6.374	212.135	55074	21.2	32.151	990	150.3	166.9	10.7	0.350	1648	898	my5744_rel.cz10a_bee
1720	0	8866	138.5	13290.3	368.8	5.156	82.496	7.729	219.617	55995	23.0	32.563	1070	149.5	166.3	10.7	0.247	1648	899	my8036_rel.cz10a_bee
l.i2
l.i2: continue load after secondary indexes created with 5 inserts per transaction. Graphs for performance per 1-second interval are here.
Average throughput:
Insert response time histogram: each cell has the percentage of responses that take <= the time in the header and max is the max response time in seconds. For the max column values in the top 25% of the range have a red background and in the bottom 25% of the range have a green background. The red background is not used when the min value is within 80% of the max value.
| dbms | 256us | 1ms | 4ms | 16ms | 64ms | 256ms | 1s | 4s | 16s | gt | max |
|---|---|---|---|---|---|---|---|---|---|---|---|
| my5651_rel.cz10a_bee | 3.119 | 82.125 | 14.311 | 0.445 | 0.001 | 0.118 | |||||
| my5744_rel.cz10a_bee | 7.119 | 83.773 | 8.803 | 0.302 | 0.002 | 0.221 | |||||
| my8036_rel.cz10a_bee | 2.492 | 91.249 | 5.647 | 0.609 | 0.003 | 0.103 |
Delete response time histogram: each cell has the percentage of responses that take <= the time in the header and max is the max response time in seconds. For the max column values in the top 25% of the range have a red background and in the bottom 25% of the range have a green background. The red background is not used when the min value is within 80% of the max value.
| dbms | 256us | 1ms | 4ms | 16ms | 64ms | 256ms | 1s | 4s | 16s | gt | max |
|---|---|---|---|---|---|---|---|---|---|---|---|
| my5651_rel.cz10a_bee | 18.918 | 78.055 | 2.918 | 0.108 | 0.001 | 0.117 | |||||
| my5744_rel.cz10a_bee | 59.032 | 40.295 | 0.655 | 0.017 | 0.043 | ||||||
| my8036_rel.cz10a_bee | 13.338 | 86.032 | 0.580 | 0.049 | 0.001 | 0.103 |
Performance metrics for the DBMS listed above. Some are normalized by throughput, others are not. Legend for results is here.
ips	qps	rps	rmbps	wps	wmbps	rpq	rkbpq	wpi	wkbpi	csps	cpups	cspq	cpupq	dbgb1	dbgb2	rss	maxop	p50	p99	tag
1623	0	7667	113.9	8688.8	272.3	4.723	71.853	5.353	171.799	48715	20.7	30.010	1020	148.0	164.5	10.5	0.118	1628	1333	my5651_rel.cz10a_bee
2049	0	8123	126.9	9945.6	312.8	3.964	63.427	4.854	156.293	59233	29.6	28.907	1156	150.4	167.0	10.7	0.221	2024	1688	my5744_rel.cz10a_bee
1890	0	8087	126.4	11888.6	317.6	4.278	68.450	6.289	172.058	56350	31.8	29.810	1346	149.5	166.4	10.7	0.103	1854	1633	my8036_rel.cz10a_bee
qr100.L1
qr100.L1: range queries with 100 insert/s per client. Graphs for performance per 1-second interval are here.
Average throughput:
Query response time histogram: each cell has the percentage of responses that take <= the time in the header and max is the max response time in seconds. For max values in the top 25% of the range have a red background and in the bottom 25% of the range have a green background. The red background is not used when the min value is within 80% of the max value.
| dbms | 256us | 1ms | 4ms | 16ms | 64ms | 256ms | 1s | 4s | 16s | gt | max |
|---|---|---|---|---|---|---|---|---|---|---|---|
| my5651_rel.cz10a_bee | 92.924 | 6.917 | 0.142 | 0.016 | nonzero | 0.017 | |||||
| my5744_rel.cz10a_bee | 63.741 | 36.081 | 0.162 | 0.016 | nonzero | 0.034 | |||||
| my8036_rel.cz10a_bee | 49.920 | 50.076 | 0.004 | 0.001 | 0.010 |
Insert response time histogram: each cell has the percentage of responses that take <= the time in the header and max is the max response time in seconds. For max values in the top 25% of the range have a red background and in the bottom 25% of the range have a green background. The red background is not used when the min value is within 80% of the max value.
| dbms | 256us | 1ms | 4ms | 16ms | 64ms | 256ms | 1s | 4s | 16s | gt | max |
|---|---|---|---|---|---|---|---|---|---|---|---|
| my5651_rel.cz10a_bee | 0.139 | 99.694 | 0.167 | 0.073 | |||||||
| my5744_rel.cz10a_bee | 24.361 | 75.639 | 0.055 | ||||||||
| my8036_rel.cz10a_bee | 8.750 | 91.250 | 0.045 |
Delete response time histogram: each cell has the percentage of responses that take <= the time in the header and max is the max response time in seconds. For max values in the top 25% of the range have a red background and in the bottom 25% of the range have a green background. The red background is not used when the min value is within 80% of the max value.
| dbms | 256us | 1ms | 4ms | 16ms | 64ms | 256ms | 1s | 4s | 16s | gt | max |
|---|---|---|---|---|---|---|---|---|---|---|---|
| my5651_rel.cz10a_bee | 17.056 | 80.861 | 2.083 | 0.035 | |||||||
| my5744_rel.cz10a_bee | 98.389 | 1.611 | 0.013 | ||||||||
| my8036_rel.cz10a_bee | 99.167 | 0.833 | 0.013 |
Performance metrics for the DBMS listed above. Some are normalized by throughput, others are not. Legend for results is here.
ips	qps	rps	rmbps	wps	wmbps	rpq	rkbpq	wpi	wkbpi	csps	cpups	cspq	cpupq	dbgb1	dbgb2	rss	maxop	p50	p99	tag
100	5044	632	9.8	582.1	18.1	0.125	1.992	5.839	185.542	22438	13.1	4.448	208	148.0	164.5	10.5	0.017	5050	3530	my5651_rel.cz10a_bee
100	3830	786	12.3	656.8	20.2	0.205	3.284	6.581	207.110	18296	14.2	4.777	297	150.4	167.0	10.7	0.034	3788	2349	my5744_rel.cz10a_bee
100	3530	579	9.0	626.3	16.5	0.164	2.624	6.282	169.301	16751	14.0	4.745	317	149.5	166.4	10.7	0.010	3500	3262	my8036_rel.cz10a_bee
qp100.L2
qp100.L2: point queries with 100 insert/s per client. Graphs for performance per 1-second interval are here.
Average throughput:
Query response time histogram: each cell has the percentage of responses that take <= the time in the header and max is the max response time in seconds. For max values in the top 25% of the range have a red background and in the bottom 25% of the range have a green background. The red background is not used when the min value is within 80% of the max value.
| dbms | 256us | 1ms | 4ms | 16ms | 64ms | 256ms | 1s | 4s | 16s | gt | max |
|---|---|---|---|---|---|---|---|---|---|---|---|
| my5651_rel.cz10a_bee | 0.644 | 99.116 | 0.239 | 0.001 | 0.036 | ||||||
| my5744_rel.cz10a_bee | 0.323 | 99.344 | 0.332 | 0.001 | 0.036 | ||||||
| my8036_rel.cz10a_bee | 0.105 | 99.656 | 0.238 | 0.001 | 0.041 |
Insert response time histogram: each cell has the percentage of responses that take <= the time in the header and max is the max response time in seconds. For max values in the top 25% of the range have a red background and in the bottom 25% of the range have a green background. The red background is not used when the min value is within 80% of the max value.
| dbms | 256us | 1ms | 4ms | 16ms | 64ms | 256ms | 1s | 4s | 16s | gt | max |
|---|---|---|---|---|---|---|---|---|---|---|---|
| my5651_rel.cz10a_bee | 0.306 | 99.583 | 0.111 | 0.079 | |||||||
| my5744_rel.cz10a_bee | 25.861 | 74.139 | 0.051 | ||||||||
| my8036_rel.cz10a_bee | 7.806 | 92.194 | 0.044 |
Delete response time histogram: each cell has the percentage of responses that take <= the time in the header and max is the max response time in seconds. For max values in the top 25% of the range have a red background and in the bottom 25% of the range have a green background. The red background is not used when the min value is within 80% of the max value.
| dbms | 256us | 1ms | 4ms | 16ms | 64ms | 256ms | 1s | 4s | 16s | gt | max |
|---|---|---|---|---|---|---|---|---|---|---|---|
| my5651_rel.cz10a_bee | 51.917 | 47.111 | 0.972 | 0.041 | |||||||
| my5744_rel.cz10a_bee | 99.222 | 0.750 | 0.028 | 0.034 | |||||||
| my8036_rel.cz10a_bee | 98.556 | 1.417 | 0.028 | 0.028 |
Performance metrics for the DBMS listed above. Some are normalized by throughput, others are not. Legend for results is here.
ips	qps	rps	rmbps	wps	wmbps	rpq	rkbpq	wpi	wkbpi	csps	cpups	cspq	cpupq	dbgb1	dbgb2	rss	maxop	p50	p99	tag
100	656	6414	100.2	927.7	28.5	9.786	156.491	9.305	292.406	17689	4.8	26.986	586	148.0	164.5	10.5	0.036	655	591	my5651_rel.cz10a_bee
100	642	6329	98.9	981.6	30.0	9.864	157.828	9.846	308.297	17924	5.3	27.937	661	150.4	167.0	10.7	0.036	640	575	my5744_rel.cz10a_bee
100	615	6091	95.2	1132.5	29.1	9.908	158.523	11.348	298.673	17636	5.9	28.685	768	149.5	166.4	10.8	0.041	623	559	my8036_rel.cz10a_bee
qr500.L3
qr500.L3: range queries with 500 insert/s per client. Graphs for performance per 1-second interval are here.
Average throughput:
Query response time histogram: each cell has the percentage of responses that take <= the time in the header and max is the max response time in seconds. For max values in the top 25% of the range have a red background and in the bottom 25% of the range have a green background. The red background is not used when the min value is within 80% of the max value.
| dbms | 256us | 1ms | 4ms | 16ms | 64ms | 256ms | 1s | 4s | 16s | gt | max |
|---|---|---|---|---|---|---|---|---|---|---|---|
| my5651_rel.cz10a_bee | 86.846 | 12.868 | 0.257 | 0.029 | nonzero | 0.019 | |||||
| my5744_rel.cz10a_bee | 68.759 | 31.046 | 0.172 | 0.024 | 0.012 | ||||||
| my8036_rel.cz10a_bee | 58.375 | 41.616 | 0.008 | 0.001 | nonzero | 0.029 |
Insert response time histogram: each cell has the percentage of responses that take <= the time in the header and max is the max response time in seconds. For max values in the top 25% of the range have a red background and in the bottom 25% of the range have a green background. The red background is not used when the min value is within 80% of the max value.
| dbms | 256us | 1ms | 4ms | 16ms | 64ms | 256ms | 1s | 4s | 16s | gt | max |
|---|---|---|---|---|---|---|---|---|---|---|---|
| my5651_rel.cz10a_bee | 5.350 | 94.622 | 0.028 | 0.084 | |||||||
| my5744_rel.cz10a_bee | 77.828 | 22.172 | 0.051 | ||||||||
| my8036_rel.cz10a_bee | 59.933 | 40.067 | 0.047 |
Delete response time histogram: each cell has the percentage of responses that take <= the time in the header and max is the max response time in seconds. For max values in the top 25% of the range have a red background and in the bottom 25% of the range have a green background. The red background is not used when the min value is within 80% of the max value.
| dbms | 256us | 1ms | 4ms | 16ms | 64ms | 256ms | 1s | 4s | 16s | gt | max |
|---|---|---|---|---|---|---|---|---|---|---|---|
| my5651_rel.cz10a_bee | 12.506 | 87.239 | 0.256 | 0.025 | |||||||
| my5744_rel.cz10a_bee | 94.728 | 5.272 | 0.016 | ||||||||
| my8036_rel.cz10a_bee | 97.583 | 2.400 | 0.017 | 0.017 |
Performance metrics for the DBMS listed above. Some are normalized by throughput, others are not. Legend for results is here.
ips	qps	rps	rmbps	wps	wmbps	rpq	rkbpq	wpi	wkbpi	csps	cpups	cspq	cpupq	dbgb1	dbgb2	rss	maxop	p50	p99	tag
499	4601	2978	46.3	3127.0	97.1	0.647	10.305	6.272	199.520	32873	16.7	7.145	290	148.0	164.5	10.5	0.019	4619	2706	my5651_rel.cz10a_bee
499	3935	2991	46.7	3211.0	100.1	0.760	12.162	6.437	205.423	31602	18.0	8.032	366	150.4	167.0	10.7	0.012	3884	2493	my5744_rel.cz10a_bee
499	3748	2934	45.8	3883.9	102.3	0.783	12.522	7.782	209.944	31629	18.8	8.438	401	149.5	166.4	10.8	0.029	3708	3372	my8036_rel.cz10a_bee
qp500.L4
qp500.L4: point queries with 500 insert/s per client. Graphs for performance per 1-second interval are here.
Average throughput:
Query response time histogram: each cell has the percentage of responses that take <= the time in the header and max is the max response time in seconds. For max values in the top 25% of the range have a red background and in the bottom 25% of the range have a green background. The red background is not used when the min value is within 80% of the max value.
| dbms | 256us | 1ms | 4ms | 16ms | 64ms | 256ms | 1s | 4s | 16s | gt | max |
|---|---|---|---|---|---|---|---|---|---|---|---|
| my5651_rel.cz10a_bee | 0.032 | 97.826 | 2.135 | 0.007 | 0.042 | ||||||
| my5744_rel.cz10a_bee | 0.019 | 97.587 | 2.388 | 0.007 | 0.041 | ||||||
| my8036_rel.cz10a_bee | 0.004 | 98.923 | 0.968 | 0.106 | 0.053 |
Insert response time histogram: each cell has the percentage of responses that take <= the time in the header and max is the max response time in seconds. For max values in the top 25% of the range have a red background and in the bottom 25% of the range have a green background. The red background is not used when the min value is within 80% of the max value.
| dbms | 256us | 1ms | 4ms | 16ms | 64ms | 256ms | 1s | 4s | 16s | gt | max |
|---|---|---|---|---|---|---|---|---|---|---|---|
| my5651_rel.cz10a_bee | 4.239 | 95.128 | 0.633 | 0.122 | |||||||
| my5744_rel.cz10a_bee | 89.256 | 10.700 | 0.044 | 0.076 | |||||||
| my8036_rel.cz10a_bee | 67.994 | 30.822 | 1.183 | 0.119 |
Delete response time histogram: each cell has the percentage of responses that take <= the time in the header and max is the max response time in seconds. For max values in the top 25% of the range have a red background and in the bottom 25% of the range have a green background. The red background is not used when the min value is within 80% of the max value.
| dbms | 256us | 1ms | 4ms | 16ms | 64ms | 256ms | 1s | 4s | 16s | gt | max |
|---|---|---|---|---|---|---|---|---|---|---|---|
| my5651_rel.cz10a_bee | 22.606 | 74.478 | 2.917 | 0.047 | |||||||
| my5744_rel.cz10a_bee | 95.200 | 4.778 | 0.022 | 0.025 | |||||||
| my8036_rel.cz10a_bee | 94.750 | 4.917 | 0.333 | 0.051 |
Performance metrics for the DBMS listed above. Some are normalized by throughput, others are not. Legend for results is here.
ips	qps	rps	rmbps	wps	wmbps	rpq	rkbpq	wpi	wkbpi	csps	cpups	cspq	cpupq	dbgb1	dbgb2	rss	maxop	p50	p99	tag
499	577	8463	132.0	3483.0	107.6	14.664	234.236	6.983	220.886	28737	8.2	49.796	1137	148.0	164.5	10.5	0.042	575	543	my5651_rel.cz10a_bee
499	571	8410	131.4	3504.2	108.5	14.739	235.820	7.021	222.596	30260	9.6	53.031	1346	150.4	167.0	10.7	0.041	575	543	my5744_rel.cz10a_bee
499	554	8251	128.9	4270.4	111.7	14.904	238.463	8.556	229.158	30415	10.7	54.941	1546	149.5	166.4	10.8	0.053	559	527	my8036_rel.cz10a_bee
qr1000.L5
qr1000.L5: range queries with 1000 insert/s per client. Graphs for performance per 1-second interval are here.
Average throughput:
Query response time histogram: each cell has the percentage of responses that take <= the time in the header and max is the max response time in seconds. For max values in the top 25% of the range have a red background and in the bottom 25% of the range have a green background. The red background is not used when the min value is within 80% of the max value.
| dbms | 256us | 1ms | 4ms | 16ms | 64ms | 256ms | 1s | 4s | 16s | gt | max |
|---|---|---|---|---|---|---|---|---|---|---|---|
| my5651_rel.cz10a_bee | 81.356 | 18.228 | 0.393 | 0.023 | nonzero | 0.035 | |||||
| my5744_rel.cz10a_bee | 73.087 | 26.713 | 0.185 | 0.015 | nonzero | 0.034 | |||||
| my8036_rel.cz10a_bee | 63.786 | 36.198 | 0.015 | 0.001 | nonzero | 0.032 |
Insert response time histogram: each cell has the percentage of responses that take <= the time in the header and max is the max response time in seconds. For max values in the top 25% of the range have a red background and in the bottom 25% of the range have a green background. The red background is not used when the min value is within 80% of the max value.
| dbms | 256us | 1ms | 4ms | 16ms | 64ms | 256ms | 1s | 4s | 16s | gt | max |
|---|---|---|---|---|---|---|---|---|---|---|---|
| my5651_rel.cz10a_bee | 25.422 | 74.364 | 0.214 | 0.097 | |||||||
| my5744_rel.cz10a_bee | 90.569 | 9.422 | 0.008 | 0.078 | |||||||
| my8036_rel.cz10a_bee | 87.567 | 12.433 | 0.045 |
Delete response time histogram: each cell has the percentage of responses that take <= the time in the header and max is the max response time in seconds. For max values in the top 25% of the range have a red background and in the bottom 25% of the range have a green background. The red background is not used when the min value is within 80% of the max value.
| dbms | 256us | 1ms | 4ms | 16ms | 64ms | 256ms | 1s | 4s | 16s | gt | max |
|---|---|---|---|---|---|---|---|---|---|---|---|
| my5651_rel.cz10a_bee | 13.000 | 86.533 | 0.467 | 0.056 | |||||||
| my5744_rel.cz10a_bee | 96.764 | 3.217 | 0.019 | 0.042 | |||||||
| my8036_rel.cz10a_bee | 96.558 | 3.411 | 0.031 | 0.049 |
Performance metrics for the DBMS listed above. Some are normalized by throughput, others are not. Legend for results is here.
ips	qps	rps	rmbps	wps	wmbps	rpq	rkbpq	wpi	wkbpi	csps	cpups	cspq	cpupq	dbgb1	dbgb2	rss	maxop	p50	p99	tag
998	4366	5636	87.6	6271.0	194.0	1.291	20.551	6.282	199.000	47597	20.4	10.901	374	148.0	164.5	10.5	0.035	4428	2381	my5651_rel.cz10a_bee
998	4095	5622	87.9	6327.2	196.6	1.373	21.969	6.342	201.791	48247	22.8	11.783	445	150.4	167.0	10.7	0.034	4061	2317	my5744_rel.cz10a_bee
997	3870	5547	86.7	7630.0	199.8	1.434	22.937	7.651	205.161	48136	24.0	12.439	496	149.5	166.4	10.8	0.032	3850	3148	my8036_rel.cz10a_bee
qp1000.L6
qp1000.L6: point queries with 1000 insert/s per client. Graphs for performance per 1-second interval are here.
Average throughput:
Query response time histogram: each cell has the percentage of responses that take <= the time in the header and max is the max response time in seconds. For max values in the top 25% of the range have a red background and in the bottom 25% of the range have a green background. The red background is not used when the min value is within 80% of the max value.
| dbms | 256us | 1ms | 4ms | 16ms | 64ms | 256ms | 1s | 4s | 16s | gt | max |
|---|---|---|---|---|---|---|---|---|---|---|---|
| my5651_rel.cz10a_bee | 0.007 | 94.804 | 5.175 | 0.014 | 0.041 | ||||||
| my5744_rel.cz10a_bee | 0.002 | 94.922 | 5.062 | 0.014 | 0.045 | ||||||
| my8036_rel.cz10a_bee | 0.001 | 97.884 | 1.922 | 0.194 | 0.056 |
Insert response time histogram: each cell has the percentage of responses that take <= the time in the header and max is the max response time in seconds. For max values in the top 25% of the range have a red background and in the bottom 25% of the range have a green background. The red background is not used when the min value is within 80% of the max value.
| dbms | 256us | 1ms | 4ms | 16ms | 64ms | 256ms | 1s | 4s | 16s | gt | max |
|---|---|---|---|---|---|---|---|---|---|---|---|
| my5651_rel.cz10a_bee | 14.239 | 83.378 | 2.383 | 0.113 | |||||||
| my5744_rel.cz10a_bee | 69.525 | 30.283 | 0.192 | 0.092 | |||||||
| my8036_rel.cz10a_bee | 82.747 | 16.672 | 0.581 | 0.117 |
Delete response time histogram: each cell has the percentage of responses that take <= the time in the header and max is the max response time in seconds. For max values in the top 25% of the range have a red background and in the bottom 25% of the range have a green background. The red background is not used when the min value is within 80% of the max value.
| dbms | 256us | 1ms | 4ms | 16ms | 64ms | 256ms | 1s | 4s | 16s | gt | max |
|---|---|---|---|---|---|---|---|---|---|---|---|
| my5651_rel.cz10a_bee | 18.378 | 80.164 | 1.456 | 0.003 | 0.066 | ||||||
| my5744_rel.cz10a_bee | 96.844 | 3.153 | 0.003 | 0.020 | |||||||
| my8036_rel.cz10a_bee | 95.156 | 4.647 | 0.194 | 0.003 | 0.067 |
Performance metrics for the DBMS listed above. Some are normalized by throughput, others are not. Legend for results is here.
ips	qps	rps	rmbps	wps	wmbps	rpq	rkbpq	wpi	wkbpi	csps	cpups	cspq	cpupq	dbgb1	dbgb2	rss	maxop	p50	p99	tag
998	505	10595	165.1	6363.7	195.9	20.973	334.693	6.375	200.974	42230	12.5	83.590	1979	148.0	164.5	10.5	0.041	511	463	my5651_rel.cz10a_bee
998	517	10671	166.7	6392.0	196.5	20.633	330.122	6.403	201.546	44969	14.6	86.948	2258	150.4	167.0	10.7	0.045	512	448	my5744_rel.cz10a_bee
997	513	10652	166.4	7782.0	202.3	20.779	332.469	7.809	207.909	45110	16.0	88.003	2497	149.5	166.4	10.8	0.056	511	479	my8036_rel.cz10a_bee
l.i0
l.i0: load without secondary indexes
Performance metrics for all DBMS, not just the ones listed above. Some are normalized by throughput, others are not. Legend for results is here.
ips	qps	rps	rmbps	wps	wmbps	rpq	rkbpq	wpi	wkbpi	csps	cpups	cspq	cpupq	dbgb1	dbgb2	rss	maxop	p50	p99	tag
94140	0	825	3.2	467.7	34.0	0.009	0.035	0.005	0.369	11959	22.2	0.127	19	52.6	69.1	10.6	0.237	94895	75900	my5651_rel.cz10a_bee
80572	0	0	0.0	416.7	29.2	0.000	0.000	0.005	0.371	8879	21.2	0.110	21	52.6	69.1	10.9	0.127	80817	71223	my5744_rel.cz10a_bee
55517	0	0	0.0	341.1	21.1	0.000	0.000	0.006	0.389	6636	20.2	0.120	29	52.4	69.0	11.1	0.097	55691	49844	my8036_rel.cz10a_bee
l.x
l.x: create secondary indexes
Performance metrics for all DBMS, not just the ones listed above. Some are normalized by throughput, others are not. Legend for results is here.
ips	qps	rps	rmbps	wps	wmbps	rpq	rkbpq	wpi	wkbpi	csps	cpups	cspq	cpupq	dbgb1	dbgb2	rss	maxop	p50	p99	tag
82483	0	549	83.4	703.4	105.7	0.007	1.035	0.009	1.312	1930	11.2	0.023	11	111.4	127.9	10.8	0.002	NA	NA	my5651_rel.cz10a_bee
110375	0	677	109.9	958.3	131.5	0.006	1.020	0.009	1.220	6541	11.9	0.059	9	121.1	137.7	11.1	0.002	NA	NA	my5744_rel.cz10a_bee
105291	0	1764	167.1	2145.2	150.6	0.017	1.625	0.020	1.465	8696	43.7	0.083	33	120.7	137.3	11.3	0.004	NA	NA	my8036_rel.cz10a_bee
l.i1
l.i1: continue load after secondary indexes created with 50 inserts per transaction
Performance metrics for all DBMS, not just the ones listed above. Some are normalized by throughput, others are not. Legend for results is here.
ips	qps	rps	rmbps	wps	wmbps	rpq	rkbpq	wpi	wkbpi	csps	cpups	cspq	cpupq	dbgb1	dbgb2	rss	maxop	p50	p99	tag
1320	0	7421	115.4	9010.8	294.5	5.621	89.491	6.826	228.422	43247	14.3	32.760	867	148.0	164.5	10.5	0.721	1249	849	my5651_rel.cz10a_bee
1713	0	8830	138.0	10918.1	354.9	5.155	82.472	6.374	212.135	55074	21.2	32.151	990	150.3	166.9	10.7	0.350	1648	898	my5744_rel.cz10a_bee
1720	0	8866	138.5	13290.3	368.8	5.156	82.496	7.729	219.617	55995	23.0	32.563	1070	149.5	166.3	10.7	0.247	1648	899	my8036_rel.cz10a_bee
l.i2
l.i2: continue load after secondary indexes created with 5 inserts per transaction
Performance metrics for all DBMS, not just the ones listed above. Some are normalized by throughput, others are not. Legend for results is here.
ips	qps	rps	rmbps	wps	wmbps	rpq	rkbpq	wpi	wkbpi	csps	cpups	cspq	cpupq	dbgb1	dbgb2	rss	maxop	p50	p99	tag
1623	0	7667	113.9	8688.8	272.3	4.723	71.853	5.353	171.799	48715	20.7	30.010	1020	148.0	164.5	10.5	0.118	1628	1333	my5651_rel.cz10a_bee
2049	0	8123	126.9	9945.6	312.8	3.964	63.427	4.854	156.293	59233	29.6	28.907	1156	150.4	167.0	10.7	0.221	2024	1688	my5744_rel.cz10a_bee
1890	0	8087	126.4	11888.6	317.6	4.278	68.450	6.289	172.058	56350	31.8	29.810	1346	149.5	166.4	10.7	0.103	1854	1633	my8036_rel.cz10a_bee
qr100.L1
qr100.L1: range queries with 100 insert/s per client
Performance metrics for all DBMS, not just the ones listed above. Some are normalized by throughput, others are not. Legend for results is here.
ips	qps	rps	rmbps	wps	wmbps	rpq	rkbpq	wpi	wkbpi	csps	cpups	cspq	cpupq	dbgb1	dbgb2	rss	maxop	p50	p99	tag
100	5044	632	9.8	582.1	18.1	0.125	1.992	5.839	185.542	22438	13.1	4.448	208	148.0	164.5	10.5	0.017	5050	3530	my5651_rel.cz10a_bee
100	3830	786	12.3	656.8	20.2	0.205	3.284	6.581	207.110	18296	14.2	4.777	297	150.4	167.0	10.7	0.034	3788	2349	my5744_rel.cz10a_bee
100	3530	579	9.0	626.3	16.5	0.164	2.624	6.282	169.301	16751	14.0	4.745	317	149.5	166.4	10.7	0.010	3500	3262	my8036_rel.cz10a_bee
qp100.L2
qp100.L2: point queries with 100 insert/s per client
Performance metrics for all DBMS, not just the ones listed above. Some are normalized by throughput, others are not. Legend for results is here.
ips	qps	rps	rmbps	wps	wmbps	rpq	rkbpq	wpi	wkbpi	csps	cpups	cspq	cpupq	dbgb1	dbgb2	rss	maxop	p50	p99	tag
100	656	6414	100.2	927.7	28.5	9.786	156.491	9.305	292.406	17689	4.8	26.986	586	148.0	164.5	10.5	0.036	655	591	my5651_rel.cz10a_bee
100	642	6329	98.9	981.6	30.0	9.864	157.828	9.846	308.297	17924	5.3	27.937	661	150.4	167.0	10.7	0.036	640	575	my5744_rel.cz10a_bee
100	615	6091	95.2	1132.5	29.1	9.908	158.523	11.348	298.673	17636	5.9	28.685	768	149.5	166.4	10.8	0.041	623	559	my8036_rel.cz10a_bee
qr500.L3
qr500.L3: range queries with 500 insert/s per client
Performance metrics for all DBMS, not just the ones listed above. Some are normalized by throughput, others are not. Legend for results is here.
ips	qps	rps	rmbps	wps	wmbps	rpq	rkbpq	wpi	wkbpi	csps	cpups	cspq	cpupq	dbgb1	dbgb2	rss	maxop	p50	p99	tag
499	4601	2978	46.3	3127.0	97.1	0.647	10.305	6.272	199.520	32873	16.7	7.145	290	148.0	164.5	10.5	0.019	4619	2706	my5651_rel.cz10a_bee
499	3935	2991	46.7	3211.0	100.1	0.760	12.162	6.437	205.423	31602	18.0	8.032	366	150.4	167.0	10.7	0.012	3884	2493	my5744_rel.cz10a_bee
499	3748	2934	45.8	3883.9	102.3	0.783	12.522	7.782	209.944	31629	18.8	8.438	401	149.5	166.4	10.8	0.029	3708	3372	my8036_rel.cz10a_bee
qp500.L4
qp500.L4: point queries with 500 insert/s per client
Performance metrics for all DBMS, not just the ones listed above. Some are normalized by throughput, others are not. Legend for results is here.
ips	qps	rps	rmbps	wps	wmbps	rpq	rkbpq	wpi	wkbpi	csps	cpups	cspq	cpupq	dbgb1	dbgb2	rss	maxop	p50	p99	tag
499	577	8463	132.0	3483.0	107.6	14.664	234.236	6.983	220.886	28737	8.2	49.796	1137	148.0	164.5	10.5	0.042	575	543	my5651_rel.cz10a_bee
499	571	8410	131.4	3504.2	108.5	14.739	235.820	7.021	222.596	30260	9.6	53.031	1346	150.4	167.0	10.7	0.041	575	543	my5744_rel.cz10a_bee
499	554	8251	128.9	4270.4	111.7	14.904	238.463	8.556	229.158	30415	10.7	54.941	1546	149.5	166.4	10.8	0.053	559	527	my8036_rel.cz10a_bee
qr1000.L5
qr1000.L5: range queries with 1000 insert/s per client
Performance metrics for all DBMS, not just the ones listed above. Some are normalized by throughput, others are not. Legend for results is here.
ips	qps	rps	rmbps	wps	wmbps	rpq	rkbpq	wpi	wkbpi	csps	cpups	cspq	cpupq	dbgb1	dbgb2	rss	maxop	p50	p99	tag
998	4366	5636	87.6	6271.0	194.0	1.291	20.551	6.282	199.000	47597	20.4	10.901	374	148.0	164.5	10.5	0.035	4428	2381	my5651_rel.cz10a_bee
998	4095	5622	87.9	6327.2	196.6	1.373	21.969	6.342	201.791	48247	22.8	11.783	445	150.4	167.0	10.7	0.034	4061	2317	my5744_rel.cz10a_bee
997	3870	5547	86.7	7630.0	199.8	1.434	22.937	7.651	205.161	48136	24.0	12.439	496	149.5	166.4	10.8	0.032	3850	3148	my8036_rel.cz10a_bee
qp1000.L6
qp1000.L6: point queries with 1000 insert/s per client
Performance metrics for all DBMS, not just the ones listed above. Some are normalized by throughput, others are not. Legend for results is here.
ips	qps	rps	rmbps	wps	wmbps	rpq	rkbpq	wpi	wkbpi	csps	cpups	cspq	cpupq	dbgb1	dbgb2	rss	maxop	p50	p99	tag
998	505	10595	165.1	6363.7	195.9	20.973	334.693	6.375	200.974	42230	12.5	83.590	1979	148.0	164.5	10.5	0.041	511	463	my5651_rel.cz10a_bee
998	517	10671	166.7	6392.0	196.5	20.633	330.122	6.403	201.546	44969	14.6	86.948	2258	150.4	167.0	10.7	0.045	512	448	my5744_rel.cz10a_bee
997	513	10652	166.4	7782.0	202.3	20.779	332.469	7.809	207.909	45110	16.0	88.003	2497	149.5	166.4	10.8	0.056	511	479	my8036_rel.cz10a_bee
l.i0
- l.i0: load without secondary indexes
- Legend for results is here.
- Each entry lists the percentage of responses that fit in that bucket (slower than max time for previous bucket, faster than min time for next bucket).
Insert response time histogram
256us	1ms	4ms	16ms	64ms	256ms	1s	4s	16s	gt	max	tag
0.000	76.153	23.693	0.103	0.047	0.004	0.000	0.000	0.000	0.000	0.237	my5651_rel.cz10a_bee
0.000	0.438	99.191	0.221	0.147	0.002	0.000	0.000	0.000	0.000	0.127	my5744_rel.cz10a_bee
0.000	0.000	99.409	0.440	0.148	0.003	0.000	0.000	0.000	0.000	0.097	my8036_rel.cz10a_bee
l.x
- l.x: create secondary indexes
- Legend for results is here.
- Each entry lists the percentage of responses that fit in that bucket (slower than max time for previous bucket, faster than min time for next bucket).
TODO - determine whether there is data for create index response time
l.i1
- l.i1: continue load after secondary indexes created with 50 inserts per transaction
- Legend for results is here.
- Each entry lists the percentage of responses that fit in that bucket (slower than max time for previous bucket, faster than min time for next bucket).
Insert response time histogram
256us	1ms	4ms	16ms	64ms	256ms	1s	4s	16s	gt	max	tag
0.000	0.000	0.000	0.513	89.305	10.180	0.003	0.000	0.000	0.000	0.721	my5651_rel.cz10a_bee
0.000	0.000	0.000	22.715	71.804	5.475	0.006	0.000	0.000	0.000	0.350	my5744_rel.cz10a_bee
0.000	0.000	0.000	17.212	77.422	5.365	0.000	0.000	0.000	0.000	0.247	my8036_rel.cz10a_bee
Delete response time histogram
256us	1ms	4ms	16ms	64ms	256ms	1s	4s	16s	gt	max	tag
0.000	0.000	6.420	88.865	4.709	0.005	0.001	0.000	0.000	0.000	0.572	my5651_rel.cz10a_bee
0.000	0.000	84.026	15.712	0.251	0.010	0.000	0.000	0.000	0.000	0.142	my5744_rel.cz10a_bee
0.000	0.000	46.030	53.601	0.364	0.005	0.000	0.000	0.000	0.000	0.115	my8036_rel.cz10a_bee
l.i2
- l.i2: continue load after secondary indexes created with 5 inserts per transaction
- Legend for results is here.
- Each entry lists the percentage of responses that fit in that bucket (slower than max time for previous bucket, faster than min time for next bucket).
Insert response time histogram
256us	1ms	4ms	16ms	64ms	256ms	1s	4s	16s	gt	max	tag
0.000	3.119	82.125	14.311	0.445	0.001	0.000	0.000	0.000	0.000	0.118	my5651_rel.cz10a_bee
0.000	7.119	83.773	8.803	0.302	0.002	0.000	0.000	0.000	0.000	0.221	my5744_rel.cz10a_bee
0.000	2.492	91.249	5.647	0.609	0.003	0.000	0.000	0.000	0.000	0.103	my8036_rel.cz10a_bee
Delete response time histogram
256us	1ms	4ms	16ms	64ms	256ms	1s	4s	16s	gt	max	tag
0.000	18.918	78.055	2.918	0.108	0.001	0.000	0.000	0.000	0.000	0.117	my5651_rel.cz10a_bee
0.000	59.032	40.295	0.655	0.017	0.000	0.000	0.000	0.000	0.000	0.043	my5744_rel.cz10a_bee
0.000	13.338	86.032	0.580	0.049	0.001	0.000	0.000	0.000	0.000	0.103	my8036_rel.cz10a_bee
qr100.L1
- qr100.L1: range queries with 100 insert/s per client
- Legend for results is here.
- Each entry lists the percentage of responses that fit in that bucket (slower than max time for previous bucket, faster than min time for next bucket).
Query response time histogram
256us	1ms	4ms	16ms	64ms	256ms	1s	4s	16s	gt	max	tag
92.924	6.917	0.142	0.016	nonzero	0.000	0.000	0.000	0.000	0.000	0.017	my5651_rel.cz10a_bee
63.741	36.081	0.162	0.016	nonzero	0.000	0.000	0.000	0.000	0.000	0.034	my5744_rel.cz10a_bee
49.920	50.076	0.004	0.001	0.000	0.000	0.000	0.000	0.000	0.000	0.010	my8036_rel.cz10a_bee
Insert response time histogram
256us	1ms	4ms	16ms	64ms	256ms	1s	4s	16s	gt	max	tag
0.000	0.000	0.000	0.139	99.694	0.167	0.000	0.000	0.000	0.000	0.073	my5651_rel.cz10a_bee
0.000	0.000	0.000	24.361	75.639	0.000	0.000	0.000	0.000	0.000	0.055	my5744_rel.cz10a_bee
0.000	0.000	0.000	8.750	91.250	0.000	0.000	0.000	0.000	0.000	0.045	my8036_rel.cz10a_bee
Delete response time histogram
256us	1ms	4ms	16ms	64ms	256ms	1s	4s	16s	gt	max	tag
0.000	0.000	17.056	80.861	2.083	0.000	0.000	0.000	0.000	0.000	0.035	my5651_rel.cz10a_bee
0.000	0.000	98.389	1.611	0.000	0.000	0.000	0.000	0.000	0.000	0.013	my5744_rel.cz10a_bee
0.000	0.000	99.167	0.833	0.000	0.000	0.000	0.000	0.000	0.000	0.013	my8036_rel.cz10a_bee
qp100.L2
- qp100.L2: point queries with 100 insert/s per client
- Legend for results is here.
- Each entry lists the percentage of responses that fit in that bucket (slower than max time for previous bucket, faster than min time for next bucket).
Query response time histogram
256us	1ms	4ms	16ms	64ms	256ms	1s	4s	16s	gt	max	tag
0.000	0.644	99.116	0.239	0.001	0.000	0.000	0.000	0.000	0.000	0.036	my5651_rel.cz10a_bee
0.000	0.323	99.344	0.332	0.001	0.000	0.000	0.000	0.000	0.000	0.036	my5744_rel.cz10a_bee
0.000	0.105	99.656	0.238	0.001	0.000	0.000	0.000	0.000	0.000	0.041	my8036_rel.cz10a_bee
Insert response time histogram
256us	1ms	4ms	16ms	64ms	256ms	1s	4s	16s	gt	max	tag
0.000	0.000	0.000	0.306	99.583	0.111	0.000	0.000	0.000	0.000	0.079	my5651_rel.cz10a_bee
0.000	0.000	0.000	25.861	74.139	0.000	0.000	0.000	0.000	0.000	0.051	my5744_rel.cz10a_bee
0.000	0.000	0.000	7.806	92.194	0.000	0.000	0.000	0.000	0.000	0.044	my8036_rel.cz10a_bee
Delete response time histogram
256us	1ms	4ms	16ms	64ms	256ms	1s	4s	16s	gt	max	tag
0.000	0.000	51.917	47.111	0.972	0.000	0.000	0.000	0.000	0.000	0.041	my5651_rel.cz10a_bee
0.000	0.000	99.222	0.750	0.028	0.000	0.000	0.000	0.000	0.000	0.034	my5744_rel.cz10a_bee
0.000	0.000	98.556	1.417	0.028	0.000	0.000	0.000	0.000	0.000	0.028	my8036_rel.cz10a_bee
qr500.L3
- qr500.L3: range queries with 500 insert/s per client
- Legend for results is here.
- Each entry lists the percentage of responses that fit in that bucket (slower than max time for previous bucket, faster than min time for next bucket).
Query response time histogram
256us	1ms	4ms	16ms	64ms	256ms	1s	4s	16s	gt	max	tag
86.846	12.868	0.257	0.029	nonzero	0.000	0.000	0.000	0.000	0.000	0.019	my5651_rel.cz10a_bee
68.759	31.046	0.172	0.024	0.000	0.000	0.000	0.000	0.000	0.000	0.012	my5744_rel.cz10a_bee
58.375	41.616	0.008	0.001	nonzero	0.000	0.000	0.000	0.000	0.000	0.029	my8036_rel.cz10a_bee
Insert response time histogram
256us	1ms	4ms	16ms	64ms	256ms	1s	4s	16s	gt	max	tag
0.000	0.000	0.000	5.350	94.622	0.028	0.000	0.000	0.000	0.000	0.084	my5651_rel.cz10a_bee
0.000	0.000	0.000	77.828	22.172	0.000	0.000	0.000	0.000	0.000	0.051	my5744_rel.cz10a_bee
0.000	0.000	0.000	59.933	40.067	0.000	0.000	0.000	0.000	0.000	0.047	my8036_rel.cz10a_bee
Delete response time histogram
256us	1ms	4ms	16ms	64ms	256ms	1s	4s	16s	gt	max	tag
0.000	0.000	12.506	87.239	0.256	0.000	0.000	0.000	0.000	0.000	0.025	my5651_rel.cz10a_bee
0.000	0.000	94.728	5.272	0.000	0.000	0.000	0.000	0.000	0.000	0.016	my5744_rel.cz10a_bee
0.000	0.000	97.583	2.400	0.017	0.000	0.000	0.000	0.000	0.000	0.017	my8036_rel.cz10a_bee
qp500.L4
- qp500.L4: point queries with 500 insert/s per client
- Legend for results is here.
- Each entry lists the percentage of responses that fit in that bucket (slower than max time for previous bucket, faster than min time for next bucket).
Query response time histogram
256us	1ms	4ms	16ms	64ms	256ms	1s	4s	16s	gt	max	tag
0.000	0.032	97.826	2.135	0.007	0.000	0.000	0.000	0.000	0.000	0.042	my5651_rel.cz10a_bee
0.000	0.019	97.587	2.388	0.007	0.000	0.000	0.000	0.000	0.000	0.041	my5744_rel.cz10a_bee
0.000	0.004	98.923	0.968	0.106	0.000	0.000	0.000	0.000	0.000	0.053	my8036_rel.cz10a_bee
Insert response time histogram
256us	1ms	4ms	16ms	64ms	256ms	1s	4s	16s	gt	max	tag
0.000	0.000	0.000	4.239	95.128	0.633	0.000	0.000	0.000	0.000	0.122	my5651_rel.cz10a_bee
0.000	0.000	0.000	89.256	10.700	0.044	0.000	0.000	0.000	0.000	0.076	my5744_rel.cz10a_bee
0.000	0.000	0.000	67.994	30.822	1.183	0.000	0.000	0.000	0.000	0.119	my8036_rel.cz10a_bee
Delete response time histogram
256us	1ms	4ms	16ms	64ms	256ms	1s	4s	16s	gt	max	tag
0.000	0.000	22.606	74.478	2.917	0.000	0.000	0.000	0.000	0.000	0.047	my5651_rel.cz10a_bee
0.000	0.000	95.200	4.778	0.022	0.000	0.000	0.000	0.000	0.000	0.025	my5744_rel.cz10a_bee
0.000	0.000	94.750	4.917	0.333	0.000	0.000	0.000	0.000	0.000	0.051	my8036_rel.cz10a_bee
qr1000.L5
- qr1000.L5: range queries with 1000 insert/s per client
- Legend for results is here.
- Each entry lists the percentage of responses that fit in that bucket (slower than max time for previous bucket, faster than min time for next bucket).
Query response time histogram
256us	1ms	4ms	16ms	64ms	256ms	1s	4s	16s	gt	max	tag
81.356	18.228	0.393	0.023	nonzero	0.000	0.000	0.000	0.000	0.000	0.035	my5651_rel.cz10a_bee
73.087	26.713	0.185	0.015	nonzero	0.000	0.000	0.000	0.000	0.000	0.034	my5744_rel.cz10a_bee
63.786	36.198	0.015	0.001	nonzero	0.000	0.000	0.000	0.000	0.000	0.032	my8036_rel.cz10a_bee
Insert response time histogram
256us	1ms	4ms	16ms	64ms	256ms	1s	4s	16s	gt	max	tag
0.000	0.000	0.000	25.422	74.364	0.214	0.000	0.000	0.000	0.000	0.097	my5651_rel.cz10a_bee
0.000	0.000	0.000	90.569	9.422	0.008	0.000	0.000	0.000	0.000	0.078	my5744_rel.cz10a_bee
0.000	0.000	0.000	87.567	12.433	0.000	0.000	0.000	0.000	0.000	0.045	my8036_rel.cz10a_bee
Delete response time histogram
256us	1ms	4ms	16ms	64ms	256ms	1s	4s	16s	gt	max	tag
0.000	0.000	13.000	86.533	0.467	0.000	0.000	0.000	0.000	0.000	0.056	my5651_rel.cz10a_bee
0.000	0.000	96.764	3.217	0.019	0.000	0.000	0.000	0.000	0.000	0.042	my5744_rel.cz10a_bee
0.000	0.000	96.558	3.411	0.031	0.000	0.000	0.000	0.000	0.000	0.049	my8036_rel.cz10a_bee
qp1000.L6
- qp1000.L6: point queries with 1000 insert/s per client
- Legend for results is here.
- Each entry lists the percentage of responses that fit in that bucket (slower than max time for previous bucket, faster than min time for next bucket).
Query response time histogram
256us	1ms	4ms	16ms	64ms	256ms	1s	4s	16s	gt	max	tag
0.000	0.007	94.804	5.175	0.014	0.000	0.000	0.000	0.000	0.000	0.041	my5651_rel.cz10a_bee
0.000	0.002	94.922	5.062	0.014	0.000	0.000	0.000	0.000	0.000	0.045	my5744_rel.cz10a_bee
0.000	0.001	97.884	1.922	0.194	0.000	0.000	0.000	0.000	0.000	0.056	my8036_rel.cz10a_bee
Insert response time histogram
256us	1ms	4ms	16ms	64ms	256ms	1s	4s	16s	gt	max	tag
0.000	0.000	0.000	14.239	83.378	2.383	0.000	0.000	0.000	0.000	0.113	my5651_rel.cz10a_bee
0.000	0.000	0.000	69.525	30.283	0.192	0.000	0.000	0.000	0.000	0.092	my5744_rel.cz10a_bee
0.000	0.000	0.000	82.747	16.672	0.581	0.000	0.000	0.000	0.000	0.117	my8036_rel.cz10a_bee
Delete response time histogram
256us	1ms	4ms	16ms	64ms	256ms	1s	4s	16s	gt	max	tag
0.000	0.000	18.378	80.164	1.456	0.003	0.000	0.000	0.000	0.000	0.066	my5651_rel.cz10a_bee
0.000	0.000	96.844	3.153	0.003	0.000	0.000	0.000	0.000	0.000	0.020	my5744_rel.cz10a_bee
0.000	0.000	95.156	4.647	0.194	0.003	0.000	0.000	0.000	0.000	0.067	my8036_rel.cz10a_bee