Introduction
This is a report for the insert benchmark with 800M docs and 1 client(s). It is generated by scripts (bash, awk, sed) and Tufte might not be impressed. An overview of the insert benchmark is here and a short update is here. Below, by DBMS, I mean DBMS+version.config. An example is my8020.c10b40 where my means MySQL, 8020 is version 8.0.20 and c10b40 is the name for the configuration file.
The test server has 8 AMD cores, 16G RAM and an NVMe SSD. It is described here as the Beelink. The benchmark was run with 1 client and there were 1 or 3 connections per client (1 for queries or inserts without rate limits, 1+1 for rate limited inserts+deletes). It uses 1 table. It loads 800M rows per table without secondary indexes, creates 3 secondary indexes per table, then inserts 4m+1m rows per table with a delete per insert to avoid growing the table. It then does 6 read+write tests for 1800s each that do queries as fast as possible with 100,100,500,500,1000,1000 inserts/s and the same for deletes/s per client concurrent with the queries. The database is cached in memory. Clients and the DBMS share one server. The per-database configs are in the per-database subdirectories here.
The tested DBMS are:
- fbmy5635_rel_202203072101.cza1_bee - MyRocks 5.6.35 from code as of 2022-03-07 at git hash e7d976ee with RocksDB 6.28.2, cza1_bee config
- fbmy5635_rel_20230529_850.cza1_bee - MyRocks 5.6.35 from code as of 2023-05-29 at git hash b739eac1 with RocksDB 8.5.0, cza1_bee config
- fbmy8028_rel_20220829_752.cza1_bee - MyRocks 8.0.28 from code as of 2022-08-29 at git hash a35c8dfeab, RocksDB 7.5.2, cza1_bee config
- fbmy8028_rel_20230619_831.cza1_bee - MyRocks 8.0.28 from code as of 2023-06-19 at git hash 6164cf0274, RocksDB 8.3.1, cza1_bee config
- fbmy8028_rel_221222.cza1_bee - MyRocks 8.0.28 from code as of 2023-12-22 at git hash 2ad105fc, RocksDB 8.7.0 at git hash 29005f0b, cza1_bee config
- fbmy8028_rel_231222_870.cza1_bee_cfx - MyRocks 8.0.28 from code as of 2023-12-22 at git hash 2ad105fc, RocksDB 8.7.0 at git hash 29005f0b, cza1_bee config, indexes use a separate column family
Contents
- Summary
- l.i0: load without secondary indexes
- l.x: create secondary indexes
- l.i1: continue load after secondary indexes created with 50 inserts per transaction
- l.i2: continue load after secondary indexes created with 5 inserts per transaction
- qr100.L1: range queries with 100 insert/s per client
- qp100.L2: point queries with 100 insert/s per client
- qr500.L3: range queries with 500 insert/s per client
- qp500.L4: point queries with 500 insert/s per client
- qr1000.L5: range queries with 1000 insert/s per client
- qp1000.L6: point queries with 1000 insert/s per client
Summary
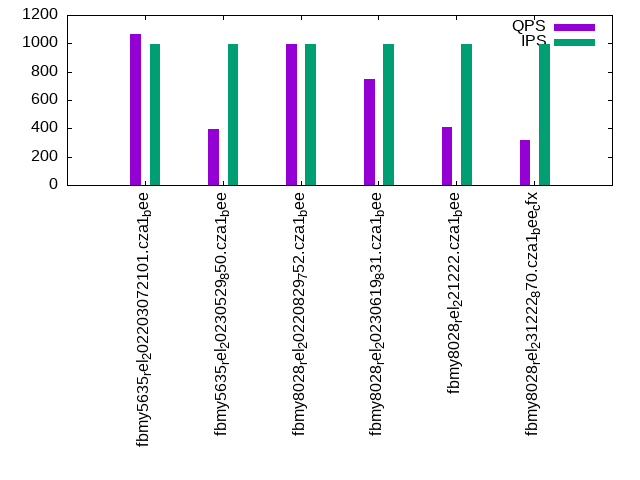
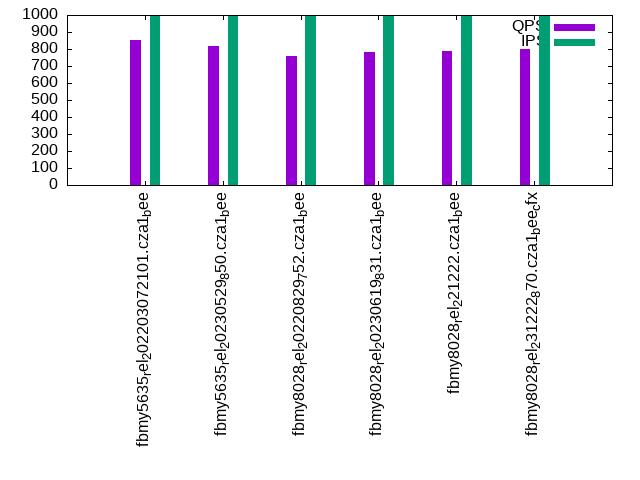
The numbers are inserts/s for l.i0, l.i1 and l.i2, indexed docs (or rows) /s for l.x and queries/s for qr100, qp100 thru qr1000, qp1000" The values are the average rate over the entire test for inserts (IPS) and queries (QPS). The range of values for IPS and QPS is split into 3 parts: bottom 25%, middle 50%, top 25%. Values in the bottom 25% have a red background, values in the top 25% have a green background and values in the middle have no color. A gray background is used for values that can be ignored because the DBMS did not sustain the target insert rate. Red backgrounds are not used when the minimum value is within 80% of the max value.
| dbms | l.i0 | l.x | l.i1 | l.i2 | qr100 | qp100 | qr500 | qp500 | qr1000 | qp1000 |
|---|---|---|---|---|---|---|---|---|---|---|
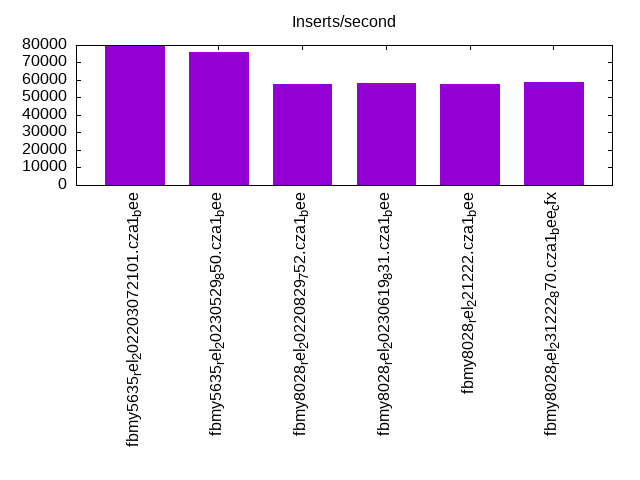
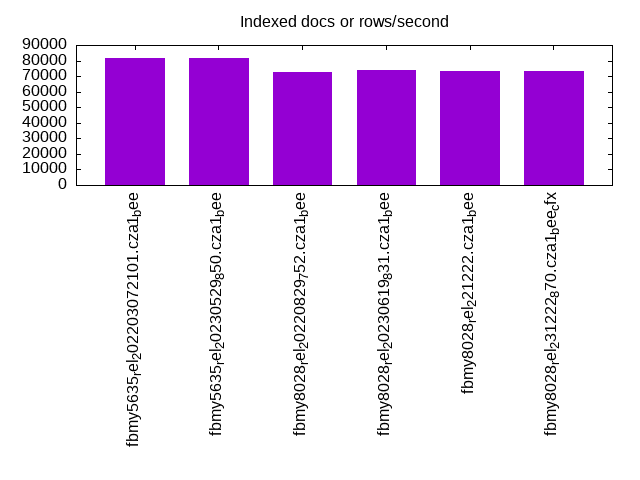
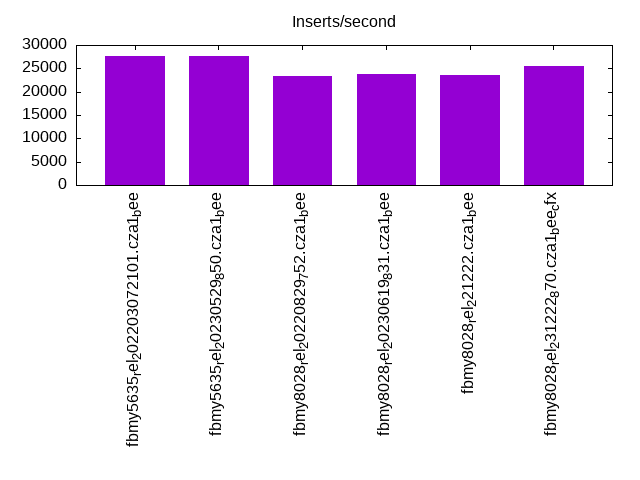
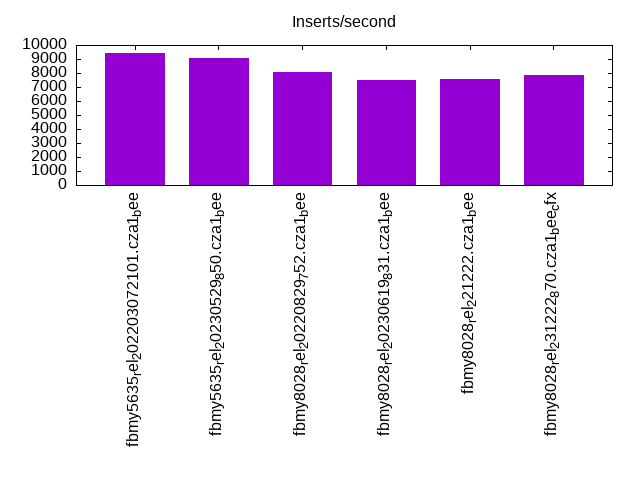
| fbmy5635_rel_202203072101.cza1_bee | 79984 | 81691 | 27586 | 9434 | 702 | 900 | 611 | 867 | 1066 | 850 |
| fbmy5635_rel_20230529_850.cza1_bee | 76111 | 81549 | 27586 | 9091 | 600 | 837 | 534 | 824 | 398 | 816 |
| fbmy8028_rel_20220829_752.cza1_bee | 57782 | 72906 | 23256 | 8064 | 643 | 821 | 561 | 784 | 997 | 761 |
| fbmy8028_rel_20230619_831.cza1_bee | 58407 | 74150 | 23810 | 7519 | 569 | 842 | 503 | 797 | 749 | 784 |
| fbmy8028_rel_221222.cza1_bee | 57958 | 73455 | 23669 | 7576 | 565 | 844 | 488 | 808 | 412 | 790 |
| fbmy8028_rel_231222_870.cza1_bee_cfx | 58940 | 73556 | 25478 | 7874 | 485 | 849 | 424 | 818 | 321 | 800 |
This table has relative throughput, throughput for the DBMS relative to the DBMS in the first line, using the absolute throughput from the previous table. Values less than 0.95 have a yellow background. Values greater than 1.05 have a blue background.
| dbms | l.i0 | l.x | l.i1 | l.i2 | qr100 | qp100 | qr500 | qp500 | qr1000 | qp1000 |
|---|---|---|---|---|---|---|---|---|---|---|
| fbmy5635_rel_202203072101.cza1_bee | 1.00 | 1.00 | 1.00 | 1.00 | 1.00 | 1.00 | 1.00 | 1.00 | 1.00 | 1.00 |
| fbmy5635_rel_20230529_850.cza1_bee | 0.95 | 1.00 | 1.00 | 0.96 | 0.85 | 0.93 | 0.87 | 0.95 | 0.37 | 0.96 |
| fbmy8028_rel_20220829_752.cza1_bee | 0.72 | 0.89 | 0.84 | 0.85 | 0.92 | 0.91 | 0.92 | 0.90 | 0.94 | 0.90 |
| fbmy8028_rel_20230619_831.cza1_bee | 0.73 | 0.91 | 0.86 | 0.80 | 0.81 | 0.94 | 0.82 | 0.92 | 0.70 | 0.92 |
| fbmy8028_rel_221222.cza1_bee | 0.72 | 0.90 | 0.86 | 0.80 | 0.80 | 0.94 | 0.80 | 0.93 | 0.39 | 0.93 |
| fbmy8028_rel_231222_870.cza1_bee_cfx | 0.74 | 0.90 | 0.92 | 0.83 | 0.69 | 0.94 | 0.69 | 0.94 | 0.30 | 0.94 |
This lists the average rate of inserts/s for the tests that do inserts concurrent with queries. For such tests the query rate is listed in the table above. The read+write tests are setup so that the insert rate should match the target rate every second. Cells that are not at least 95% of the target have a red background to indicate a failure to satisfy the target.
| dbms | qr100.L1 | qp100.L2 | qr500.L3 | qp500.L4 | qr1000.L5 | qp1000.L6 |
|---|---|---|---|---|---|---|
| fbmy5635_rel_202203072101.cza1_bee | 100 | 100 | 499 | 499 | 997 | 998 |
| fbmy5635_rel_20230529_850.cza1_bee | 100 | 100 | 499 | 499 | 997 | 998 |
| fbmy8028_rel_20220829_752.cza1_bee | 100 | 100 | 499 | 499 | 998 | 998 |
| fbmy8028_rel_20230619_831.cza1_bee | 100 | 100 | 499 | 499 | 998 | 998 |
| fbmy8028_rel_221222.cza1_bee | 100 | 100 | 499 | 499 | 998 | 998 |
| fbmy8028_rel_231222_870.cza1_bee_cfx | 100 | 100 | 499 | 499 | 998 | 998 |
| target | 100 | 100 | 500 | 500 | 1000 | 1000 |
l.i0
l.i0: load without secondary indexes. Graphs for performance per 1-second interval are here.
Average throughput:
Insert response time histogram: each cell has the percentage of responses that take <= the time in the header and max is the max response time in seconds. For the max column values in the top 25% of the range have a red background and in the bottom 25% of the range have a green background. The red background is not used when the min value is within 80% of the max value.
| dbms | 256us | 1ms | 4ms | 16ms | 64ms | 256ms | 1s | 4s | 16s | gt | max |
|---|---|---|---|---|---|---|---|---|---|---|---|
| fbmy5635_rel_202203072101.cza1_bee | nonzero | 99.872 | 0.124 | 0.001 | 0.003 | 0.131 | |||||
| fbmy5635_rel_20230529_850.cza1_bee | 99.865 | 0.130 | 0.002 | 0.002 | 0.098 | ||||||
| fbmy8028_rel_20220829_752.cza1_bee | 99.724 | 0.199 | 0.073 | 0.004 | 0.114 | ||||||
| fbmy8028_rel_20230619_831.cza1_bee | 99.726 | 0.197 | 0.073 | 0.003 | 0.099 | ||||||
| fbmy8028_rel_221222.cza1_bee | 99.725 | 0.194 | 0.077 | 0.004 | 0.135 | ||||||
| fbmy8028_rel_231222_870.cza1_bee_cfx | 99.727 | 0.196 | 0.073 | 0.003 | 0.109 |
Performance metrics for the DBMS listed above. Some are normalized by throughput, others are not. Legend for results is here.
ips	qps	rps	rmbps	wps	wmbps	rpq	rkbpq	wpi	wkbpi	csps	cpups	cspq	cpupq	dbgb1	dbgb2	rss	maxop	p50	p99	tag
79984	0	0	0.0	42.3	14.2	0.000	0.000	0.001	0.182	7879	22.6	0.099	23	23.0	23.6	1.5	0.131	80293	71922	fbmy5635_rel_202203072101.cza1_bee
76111	0	0	0.0	40.4	13.5	0.000	0.000	0.001	0.182	7533	22.0	0.099	23	23.0	23.6	1.5	0.098	76318	68922	fbmy5635_rel_20230529_850.cza1_bee
57782	0	0	0.0	44.3	13.2	0.000	0.000	0.001	0.233	6079	22.4	0.105	31	23.0	23.8	2.0	0.114	57935	51591	fbmy8028_rel_20220829_752.cza1_bee
58407	0	0	0.0	44.8	13.3	0.000	0.000	0.001	0.233	6138	22.7	0.105	31	23.0	23.8	2.0	0.099	58434	52645	fbmy8028_rel_20230619_831.cza1_bee
57958	0	0	0.0	44.5	13.2	0.000	0.000	0.001	0.234	6230	22.7	0.107	31	23.0	23.8	2.0	0.135	58144	50044	fbmy8028_rel_221222.cza1_bee
58940	0	0	0.0	45.4	13.4	0.000	0.000	0.001	0.233	6198	22.9	0.105	31	23.0	23.8	2.0	0.109	58905	53170	fbmy8028_rel_231222_870.cza1_bee_cfx
l.x
l.x: create secondary indexes.
Average throughput:
Performance metrics for the DBMS listed above. Some are normalized by throughput, others are not. Legend for results is here.
ips	qps	rps	rmbps	wps	wmbps	rpq	rkbpq	wpi	wkbpi	csps	cpups	cspq	cpupq	dbgb1	dbgb2	rss	maxop	p50	p99	tag
81691	0	109	16.8	34.7	12.7	0.001	0.210	0.000	0.159	266	11.7	0.003	11	51.0	51.6	8.8	0.002	NA	NA	fbmy5635_rel_202203072101.cza1_bee
81549	0	137	16.8	34.9	12.7	0.002	0.212	0.000	0.159	272	11.7	0.003	11	51.0	51.6	8.8	0.002	NA	NA	fbmy5635_rel_20230529_850.cza1_bee
72906	0	96	14.9	30.5	11.1	0.001	0.209	0.000	0.156	407	11.7	0.006	13	50.9	51.7	10.3	0.003	NA	NA	fbmy8028_rel_20220829_752.cza1_bee
74150	0	98	15.2	30.6	11.3	0.001	0.209	0.000	0.156	406	11.7	0.005	13	50.9	51.7	10.3	0.003	NA	NA	fbmy8028_rel_20230619_831.cza1_bee
73455	0	97	15.0	30.6	11.2	0.001	0.209	0.000	0.156	407	11.6	0.006	13	50.9	51.7	10.3	0.003	NA	NA	fbmy8028_rel_221222.cza1_bee
73556	0	97	15.0	29.9	11.2	0.001	0.209	0.000	0.156	411	11.7	0.006	13	50.9	51.7	10.3	0.003	NA	NA	fbmy8028_rel_231222_870.cza1_bee_cfx
l.i1
l.i1: continue load after secondary indexes created with 50 inserts per transaction. Graphs for performance per 1-second interval are here.
Average throughput:
Insert response time histogram: each cell has the percentage of responses that take <= the time in the header and max is the max response time in seconds. For the max column values in the top 25% of the range have a red background and in the bottom 25% of the range have a green background. The red background is not used when the min value is within 80% of the max value.
| dbms | 256us | 1ms | 4ms | 16ms | 64ms | 256ms | 1s | 4s | 16s | gt | max |
|---|---|---|---|---|---|---|---|---|---|---|---|
| fbmy5635_rel_202203072101.cza1_bee | 99.785 | 0.211 | 0.003 | 0.001 | 0.076 | ||||||
| fbmy5635_rel_20230529_850.cza1_bee | 99.771 | 0.220 | 0.006 | 0.003 | 0.078 | ||||||
| fbmy8028_rel_20220829_752.cza1_bee | 99.525 | 0.450 | 0.022 | 0.003 | 0.071 | ||||||
| fbmy8028_rel_20230619_831.cza1_bee | 99.599 | 0.391 | 0.009 | 0.001 | 0.080 | ||||||
| fbmy8028_rel_221222.cza1_bee | 99.625 | 0.351 | 0.020 | 0.004 | 0.103 | ||||||
| fbmy8028_rel_231222_870.cza1_bee_cfx | 99.499 | 0.465 | 0.035 | 0.001 | 0.065 |
Delete response time histogram: each cell has the percentage of responses that take <= the time in the header and max is the max response time in seconds. For the max column values in the top 25% of the range have a red background and in the bottom 25% of the range have a green background. The red background is not used when the min value is within 80% of the max value.
| dbms | 256us | 1ms | 4ms | 16ms | 64ms | 256ms | 1s | 4s | 16s | gt | max |
|---|---|---|---|---|---|---|---|---|---|---|---|
| fbmy5635_rel_202203072101.cza1_bee | 99.715 | 0.265 | 0.019 | 0.001 | 0.076 | ||||||
| fbmy5635_rel_20230529_850.cza1_bee | 99.750 | 0.232 | 0.014 | 0.004 | 0.079 | ||||||
| fbmy8028_rel_20220829_752.cza1_bee | 99.565 | 0.424 | 0.009 | 0.003 | 0.083 | ||||||
| fbmy8028_rel_20230619_831.cza1_bee | 99.508 | 0.462 | 0.026 | 0.004 | 0.080 | ||||||
| fbmy8028_rel_221222.cza1_bee | 99.585 | 0.374 | 0.037 | 0.004 | 0.098 | ||||||
| fbmy8028_rel_231222_870.cza1_bee_cfx | 99.554 | 0.409 | 0.034 | 0.004 | 0.107 |
Performance metrics for the DBMS listed above. Some are normalized by throughput, others are not. Legend for results is here.
ips	qps	rps	rmbps	wps	wmbps	rpq	rkbpq	wpi	wkbpi	csps	cpups	cspq	cpupq	dbgb1	dbgb2	rss	maxop	p50	p99	tag
27586	0	126	1.0	190.1	67.2	0.005	0.036	0.007	2.495	12422	45.4	0.450	132	52.0	53.5	7.4	0.076	27868	23573	fbmy5635_rel_202203072101.cza1_bee
27586	0	204	1.2	186.9	65.1	0.007	0.045	0.007	2.415	12407	49.0	0.450	142	51.7	53.2	7.4	0.078	27969	24124	fbmy5635_rel_20230529_850.cza1_bee
23256	0	141	0.7	158.3	56.0	0.006	0.029	0.007	2.464	11112	42.6	0.478	147	52.0	53.7	8.1	0.071	23440	15882	fbmy8028_rel_20220829_752.cza1_bee
23810	0	140	0.7	129.2	43.3	0.006	0.029	0.005	1.863	11127	42.1	0.467	141	51.8	53.5	8.2	0.080	24023	19781	fbmy8028_rel_20230619_831.cza1_bee
23669	0	140	0.8	187.1	62.3	0.006	0.033	0.008	2.694	11220	48.7	0.474	165	51.7	53.4	8.5	0.103	23931	20877	fbmy8028_rel_221222.cza1_bee
25478	0	153	1.7	161.5	57.2	0.006	0.070	0.006	2.301	12037	43.3	0.472	136	51.4	53.2	8.2	0.065	25572	19486	fbmy8028_rel_231222_870.cza1_bee_cfx
l.i2
l.i2: continue load after secondary indexes created with 5 inserts per transaction. Graphs for performance per 1-second interval are here.
Average throughput:
Insert response time histogram: each cell has the percentage of responses that take <= the time in the header and max is the max response time in seconds. For the max column values in the top 25% of the range have a red background and in the bottom 25% of the range have a green background. The red background is not used when the min value is within 80% of the max value.
| dbms | 256us | 1ms | 4ms | 16ms | 64ms | 256ms | 1s | 4s | 16s | gt | max |
|---|---|---|---|---|---|---|---|---|---|---|---|
| fbmy5635_rel_202203072101.cza1_bee | 0.098 | 99.812 | 0.032 | 0.057 | 0.001 | 0.051 | |||||
| fbmy5635_rel_20230529_850.cza1_bee | 0.017 | 99.894 | 0.029 | 0.059 | 0.001 | 0.056 | |||||
| fbmy8028_rel_20220829_752.cza1_bee | 99.841 | 0.068 | 0.090 | 0.002 | 0.048 | ||||||
| fbmy8028_rel_20230619_831.cza1_bee | 99.789 | 0.117 | 0.092 | 0.003 | 0.053 | ||||||
| fbmy8028_rel_221222.cza1_bee | 99.803 | 0.106 | 0.081 | 0.010 | 0.001 | 0.064 | |||||
| fbmy8028_rel_231222_870.cza1_bee_cfx | 99.846 | 0.064 | 0.085 | 0.006 | 0.059 |
Delete response time histogram: each cell has the percentage of responses that take <= the time in the header and max is the max response time in seconds. For the max column values in the top 25% of the range have a red background and in the bottom 25% of the range have a green background. The red background is not used when the min value is within 80% of the max value.
| dbms | 256us | 1ms | 4ms | 16ms | 64ms | 256ms | 1s | 4s | 16s | gt | max |
|---|---|---|---|---|---|---|---|---|---|---|---|
| fbmy5635_rel_202203072101.cza1_bee | 99.830 | 0.111 | 0.060 | 0.001 | 0.051 | ||||||
| fbmy5635_rel_20230529_850.cza1_bee | 99.834 | 0.104 | 0.060 | 0.002 | 0.064 | ||||||
| fbmy8028_rel_20220829_752.cza1_bee | 99.790 | 0.117 | 0.092 | 0.002 | 0.056 | ||||||
| fbmy8028_rel_20230619_831.cza1_bee | 99.695 | 0.210 | 0.092 | 0.002 | 0.001 | 0.066 | |||||
| fbmy8028_rel_221222.cza1_bee | 99.701 | 0.204 | 0.084 | 0.010 | 0.001 | 0.086 | |||||
| fbmy8028_rel_231222_870.cza1_bee_cfx | 99.779 | 0.132 | 0.084 | 0.006 | 0.001 | 0.072 |
Performance metrics for the DBMS listed above. Some are normalized by throughput, others are not. Legend for results is here.
ips	qps	rps	rmbps	wps	wmbps	rpq	rkbpq	wpi	wkbpi	csps	cpups	cspq	cpupq	dbgb1	dbgb2	rss	maxop	p50	p99	tag
9434	0	47	0.3	124.2	43.0	0.005	0.029	0.013	4.669	37757	40.3	4.002	342	52.1	52.3	7.4	0.051	9464	7891	fbmy5635_rel_202203072101.cza1_bee
9091	0	44	0.3	109.3	36.9	0.005	0.029	0.012	4.156	37179	39.7	4.090	349	52.1	52.3	7.4	0.056	9053	7550	fbmy5635_rel_20230529_850.cza1_bee
8064	0	46	0.2	112.5	38.7	0.006	0.029	0.014	4.912	33040	40.2	4.097	399	52.2	52.6	7.4	0.048	7992	6193	fbmy8028_rel_20220829_752.cza1_bee
7519	0	41	0.2	96.6	32.0	0.005	0.029	0.013	4.353	31437	39.6	4.181	421	51.8	52.2	7.4	0.053	7492	6418	fbmy8028_rel_20230619_831.cza1_bee
7576	0	42	0.2	112.2	36.2	0.006	0.029	0.015	4.890	31649	40.4	4.178	427	52.1	52.5	7.4	0.064	7582	6368	fbmy8028_rel_221222.cza1_bee
7874	0	44	0.3	67.1	21.1	0.006	0.033	0.009	2.739	32209	33.3	4.091	338	51.6	52.0	7.4	0.059	7956	6476	fbmy8028_rel_231222_870.cza1_bee_cfx
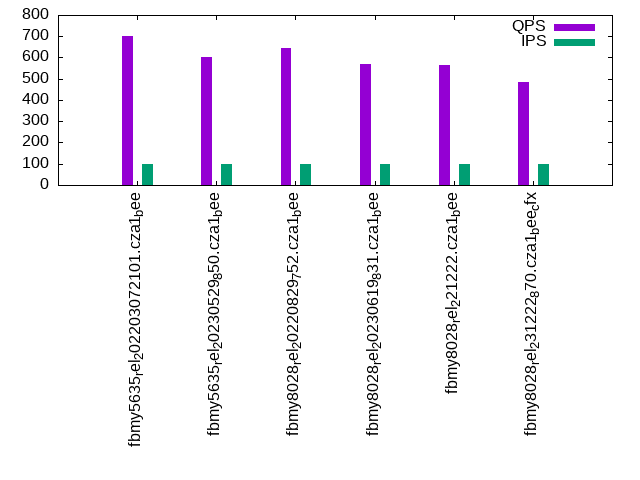
qr100.L1
qr100.L1: range queries with 100 insert/s per client. Graphs for performance per 1-second interval are here.
Average throughput:
Query response time histogram: each cell has the percentage of responses that take <= the time in the header and max is the max response time in seconds. For max values in the top 25% of the range have a red background and in the bottom 25% of the range have a green background. The red background is not used when the min value is within 80% of the max value.
| dbms | 256us | 1ms | 4ms | 16ms | 64ms | 256ms | 1s | 4s | 16s | gt | max |
|---|---|---|---|---|---|---|---|---|---|---|---|
| fbmy5635_rel_202203072101.cza1_bee | 7.020 | 59.603 | 33.100 | 0.277 | nonzero | 0.060 | |||||
| fbmy5635_rel_20230529_850.cza1_bee | 6.361 | 60.221 | 6.985 | 26.433 | nonzero | 0.061 | |||||
| fbmy8028_rel_20220829_752.cza1_bee | 1.401 | 65.226 | 26.819 | 6.554 | nonzero | 0.058 | |||||
| fbmy8028_rel_20230619_831.cza1_bee | 1.101 | 65.510 | 0.250 | 33.139 | nonzero | 0.050 | |||||
| fbmy8028_rel_221222.cza1_bee | 0.867 | 65.791 | 0.019 | 33.323 | nonzero | 0.049 | |||||
| fbmy8028_rel_231222_870.cza1_bee_cfx | 0.355 | 66.252 | 0.025 | 33.368 | 0.010 |
Insert response time histogram: each cell has the percentage of responses that take <= the time in the header and max is the max response time in seconds. For max values in the top 25% of the range have a red background and in the bottom 25% of the range have a green background. The red background is not used when the min value is within 80% of the max value.
| dbms | 256us | 1ms | 4ms | 16ms | 64ms | 256ms | 1s | 4s | 16s | gt | max |
|---|---|---|---|---|---|---|---|---|---|---|---|
| fbmy5635_rel_202203072101.cza1_bee | 99.667 | 0.333 | 0.011 | ||||||||
| fbmy5635_rel_20230529_850.cza1_bee | 99.472 | 0.528 | 0.014 | ||||||||
| fbmy8028_rel_20220829_752.cza1_bee | 98.889 | 1.083 | 0.028 | 0.018 | |||||||
| fbmy8028_rel_20230619_831.cza1_bee | 99.639 | 0.306 | 0.056 | 0.018 | |||||||
| fbmy8028_rel_221222.cza1_bee | 99.472 | 0.472 | 0.056 | 0.023 | |||||||
| fbmy8028_rel_231222_870.cza1_bee_cfx | 99.167 | 0.806 | 0.028 | 0.018 |
Delete response time histogram: each cell has the percentage of responses that take <= the time in the header and max is the max response time in seconds. For max values in the top 25% of the range have a red background and in the bottom 25% of the range have a green background. The red background is not used when the min value is within 80% of the max value.
| dbms | 256us | 1ms | 4ms | 16ms | 64ms | 256ms | 1s | 4s | 16s | gt | max |
|---|---|---|---|---|---|---|---|---|---|---|---|
| fbmy5635_rel_202203072101.cza1_bee | 99.667 | 0.333 | 0.011 | ||||||||
| fbmy5635_rel_20230529_850.cza1_bee | 99.389 | 0.611 | 0.015 | ||||||||
| fbmy8028_rel_20220829_752.cza1_bee | 98.889 | 1.083 | 0.028 | 0.018 | |||||||
| fbmy8028_rel_20230619_831.cza1_bee | 99.611 | 0.333 | 0.056 | 0.018 | |||||||
| fbmy8028_rel_221222.cza1_bee | 99.444 | 0.500 | 0.056 | 0.023 | |||||||
| fbmy8028_rel_231222_870.cza1_bee_cfx | 99.111 | 0.861 | 0.028 | 0.018 |
Performance metrics for the DBMS listed above. Some are normalized by throughput, others are not. Legend for results is here.
ips	qps	rps	rmbps	wps	wmbps	rpq	rkbpq	wpi	wkbpi	csps	cpups	cspq	cpupq	dbgb1	dbgb2	rss	maxop	p50	p99	tag
100	702	8	0.1	4.7	0.6	0.011	0.133	0.047	6.158	2846	12.5	4.057	1426	51.8	51.9	7.4	0.060	703	623	fbmy5635_rel_202203072101.cza1_bee
100	600	8	0.1	5.1	0.7	0.013	0.157	0.051	7.347	2464	12.6	4.104	1679	51.8	51.9	7.5	0.061	607	527	fbmy5635_rel_20230529_850.cza1_bee
100	643	8	0.1	4.7	0.6	0.012	0.148	0.047	6.137	2765	12.5	4.299	1555	51.8	52.0	7.4	0.058	639	572	fbmy8028_rel_20220829_752.cza1_bee
100	569	8	0.1	4.5	0.5	0.014	0.167	0.046	5.374	2480	12.4	4.359	1744	51.8	52.0	7.4	0.050	575	496	fbmy8028_rel_20230619_831.cza1_bee
100	565	8	0.1	4.9	0.7	0.014	0.168	0.050	6.804	2476	12.4	4.383	1756	51.8	52.0	7.4	0.049	560	495	fbmy8028_rel_221222.cza1_bee
100	485	8	0.1	3.4	0.1	0.016	0.196	0.034	1.051	2148	11.8	4.430	1947	51.6	51.8	7.4	0.010	480	430	fbmy8028_rel_231222_870.cza1_bee_cfx
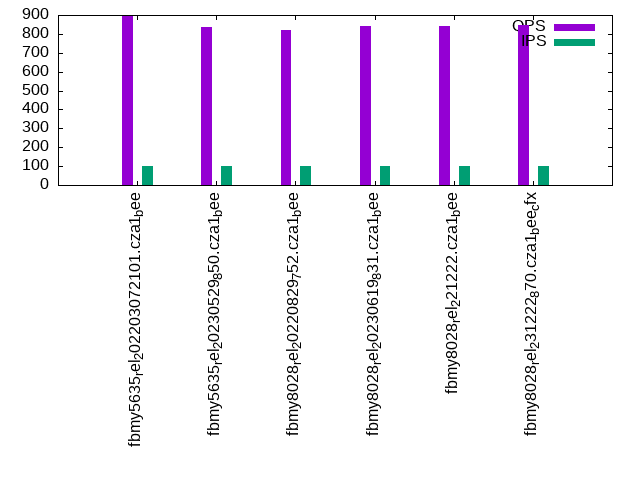
qp100.L2
qp100.L2: point queries with 100 insert/s per client. Graphs for performance per 1-second interval are here.
Average throughput:
Query response time histogram: each cell has the percentage of responses that take <= the time in the header and max is the max response time in seconds. For max values in the top 25% of the range have a red background and in the bottom 25% of the range have a green background. The red background is not used when the min value is within 80% of the max value.
| dbms | 256us | 1ms | 4ms | 16ms | 64ms | 256ms | 1s | 4s | 16s | gt | max |
|---|---|---|---|---|---|---|---|---|---|---|---|
| fbmy5635_rel_202203072101.cza1_bee | 33.106 | 66.866 | 0.028 | 0.001 | 0.040 | ||||||
| fbmy5635_rel_20230529_850.cza1_bee | 18.931 | 81.033 | 0.035 | 0.001 | 0.029 | ||||||
| fbmy8028_rel_20220829_752.cza1_bee | 11.864 | 88.108 | 0.028 | nonzero | 0.020 | ||||||
| fbmy8028_rel_20230619_831.cza1_bee | 15.944 | 84.028 | 0.028 | nonzero | 0.037 | ||||||
| fbmy8028_rel_221222.cza1_bee | 15.301 | 84.681 | 0.018 | nonzero | 0.036 | ||||||
| fbmy8028_rel_231222_870.cza1_bee_cfx | 17.110 | 82.866 | 0.024 | nonzero | 0.017 |
Insert response time histogram: each cell has the percentage of responses that take <= the time in the header and max is the max response time in seconds. For max values in the top 25% of the range have a red background and in the bottom 25% of the range have a green background. The red background is not used when the min value is within 80% of the max value.
| dbms | 256us | 1ms | 4ms | 16ms | 64ms | 256ms | 1s | 4s | 16s | gt | max |
|---|---|---|---|---|---|---|---|---|---|---|---|
| fbmy5635_rel_202203072101.cza1_bee | 99.278 | 0.722 | 0.013 | ||||||||
| fbmy5635_rel_20230529_850.cza1_bee | 99.361 | 0.639 | 0.014 | ||||||||
| fbmy8028_rel_20220829_752.cza1_bee | 98.528 | 1.472 | 0.016 | ||||||||
| fbmy8028_rel_20230619_831.cza1_bee | 96.917 | 3.028 | 0.028 | 0.028 | 0.065 | ||||||
| fbmy8028_rel_221222.cza1_bee | 99.111 | 0.889 | 0.013 | ||||||||
| fbmy8028_rel_231222_870.cza1_bee_cfx | 99.111 | 0.889 | 0.013 |
Delete response time histogram: each cell has the percentage of responses that take <= the time in the header and max is the max response time in seconds. For max values in the top 25% of the range have a red background and in the bottom 25% of the range have a green background. The red background is not used when the min value is within 80% of the max value.
| dbms | 256us | 1ms | 4ms | 16ms | 64ms | 256ms | 1s | 4s | 16s | gt | max |
|---|---|---|---|---|---|---|---|---|---|---|---|
| fbmy5635_rel_202203072101.cza1_bee | 99.222 | 0.778 | 0.014 | ||||||||
| fbmy5635_rel_20230529_850.cza1_bee | 99.278 | 0.722 | 0.014 | ||||||||
| fbmy8028_rel_20220829_752.cza1_bee | 98.000 | 2.000 | 0.015 | ||||||||
| fbmy8028_rel_20230619_831.cza1_bee | 97.778 | 2.194 | 0.028 | 0.017 | |||||||
| fbmy8028_rel_221222.cza1_bee | 98.944 | 1.056 | 0.013 | ||||||||
| fbmy8028_rel_231222_870.cza1_bee_cfx | 98.583 | 1.389 | 0.028 | 0.018 |
Performance metrics for the DBMS listed above. Some are normalized by throughput, others are not. Legend for results is here.
ips	qps	rps	rmbps	wps	wmbps	rpq	rkbpq	wpi	wkbpi	csps	cpups	cspq	cpupq	dbgb1	dbgb2	rss	maxop	p50	p99	tag
100	900	6972	51.9	4.9	0.6	7.752	59.130	0.049	6.461	17483	7.4	19.436	658	51.9	51.9	8.7	0.040	911	822	fbmy5635_rel_202203072101.cza1_bee
100	837	6552	48.5	4.6	0.5	7.825	59.247	0.046	5.115	16513	6.9	19.719	659	51.9	51.9	8.5	0.029	847	751	fbmy5635_rel_20230529_850.cza1_bee
100	821	6338	47.2	4.9	0.6	7.718	58.878	0.049	6.430	16027	7.6	19.517	740	51.8	52.1	8.7	0.020	816	782	fbmy8028_rel_20220829_752.cza1_bee
100	842	6494	48.4	4.8	0.6	7.715	58.878	0.048	5.679	16452	7.6	19.546	722	51.8	52.1	8.8	0.037	847	799	fbmy8028_rel_20230619_831.cza1_bee
100	844	6548	48.6	4.7	0.5	7.762	58.942	0.047	5.335	16519	7.6	19.582	721	51.8	52.1	8.8	0.036	847	799	fbmy8028_rel_221222.cza1_bee
100	849	6520	47.9	3.8	0.2	7.683	57.789	0.038	2.532	16495	7.5	19.437	707	51.6	51.9	8.7	0.017	847	799	fbmy8028_rel_231222_870.cza1_bee_cfx
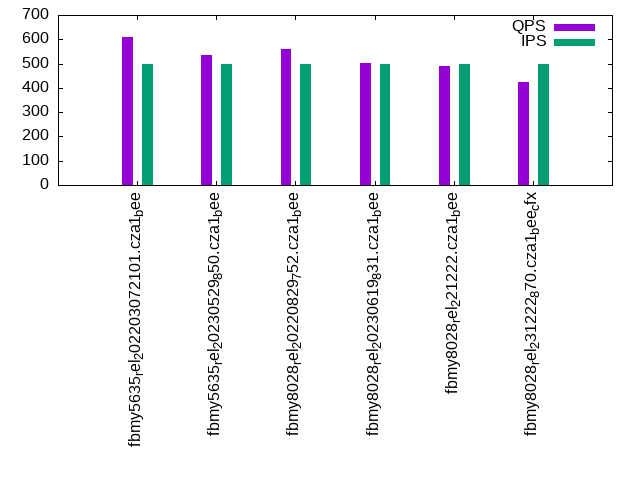
qr500.L3
qr500.L3: range queries with 500 insert/s per client. Graphs for performance per 1-second interval are here.
Average throughput:
Query response time histogram: each cell has the percentage of responses that take <= the time in the header and max is the max response time in seconds. For max values in the top 25% of the range have a red background and in the bottom 25% of the range have a green background. The red background is not used when the min value is within 80% of the max value.
| dbms | 256us | 1ms | 4ms | 16ms | 64ms | 256ms | 1s | 4s | 16s | gt | max |
|---|---|---|---|---|---|---|---|---|---|---|---|
| fbmy5635_rel_202203072101.cza1_bee | 5.698 | 60.747 | 11.326 | 22.227 | 0.002 | 0.061 | |||||
| fbmy5635_rel_20230529_850.cza1_bee | 4.975 | 61.477 | 0.139 | 33.408 | 0.002 | 0.062 | |||||
| fbmy8028_rel_20220829_752.cza1_bee | 0.772 | 65.512 | 1.442 | 32.272 | 0.001 | 0.063 | |||||
| fbmy8028_rel_20230619_831.cza1_bee | 0.539 | 65.740 | 0.194 | 33.525 | 0.002 | 0.061 | |||||
| fbmy8028_rel_221222.cza1_bee | 0.531 | 65.818 | 0.151 | 33.498 | 0.001 | 0.063 | |||||
| fbmy8028_rel_231222_870.cza1_bee_cfx | 0.058 | 66.215 | 0.177 | 33.545 | 0.005 | 0.038 |
Insert response time histogram: each cell has the percentage of responses that take <= the time in the header and max is the max response time in seconds. For max values in the top 25% of the range have a red background and in the bottom 25% of the range have a green background. The red background is not used when the min value is within 80% of the max value.
| dbms | 256us | 1ms | 4ms | 16ms | 64ms | 256ms | 1s | 4s | 16s | gt | max |
|---|---|---|---|---|---|---|---|---|---|---|---|
| fbmy5635_rel_202203072101.cza1_bee | 99.428 | 0.561 | 0.011 | 0.020 | |||||||
| fbmy5635_rel_20230529_850.cza1_bee | 99.650 | 0.350 | 0.014 | ||||||||
| fbmy8028_rel_20220829_752.cza1_bee | 98.261 | 1.678 | 0.061 | 0.027 | |||||||
| fbmy8028_rel_20230619_831.cza1_bee | 99.294 | 0.644 | 0.061 | 0.023 | |||||||
| fbmy8028_rel_221222.cza1_bee | 98.461 | 1.494 | 0.044 | 0.024 | |||||||
| fbmy8028_rel_231222_870.cza1_bee_cfx | 98.144 | 1.800 | 0.056 | 0.018 |
Delete response time histogram: each cell has the percentage of responses that take <= the time in the header and max is the max response time in seconds. For max values in the top 25% of the range have a red background and in the bottom 25% of the range have a green background. The red background is not used when the min value is within 80% of the max value.
| dbms | 256us | 1ms | 4ms | 16ms | 64ms | 256ms | 1s | 4s | 16s | gt | max |
|---|---|---|---|---|---|---|---|---|---|---|---|
| fbmy5635_rel_202203072101.cza1_bee | 98.061 | 1.883 | 0.056 | 0.020 | |||||||
| fbmy5635_rel_20230529_850.cza1_bee | 97.950 | 2.039 | 0.011 | 0.017 | |||||||
| fbmy8028_rel_20220829_752.cza1_bee | 96.339 | 3.567 | 0.094 | 0.031 | |||||||
| fbmy8028_rel_20230619_831.cza1_bee | 97.411 | 2.444 | 0.144 | 0.024 | |||||||
| fbmy8028_rel_221222.cza1_bee | 96.867 | 3.033 | 0.100 | 0.024 | |||||||
| fbmy8028_rel_231222_870.cza1_bee_cfx | 95.611 | 4.222 | 0.167 | 0.023 |
Performance metrics for the DBMS listed above. Some are normalized by throughput, others are not. Legend for results is here.
ips	qps	rps	rmbps	wps	wmbps	rpq	rkbpq	wpi	wkbpi	csps	cpups	cspq	cpupq	dbgb1	dbgb2	rss	maxop	p50	p99	tag
499	611	25	0.5	12.2	3.6	0.041	0.916	0.024	7.442	2695	13.5	4.408	1766	52.0	52.3	8.2	0.061	608	511	fbmy5635_rel_202203072101.cza1_bee
499	534	42	0.5	11.1	3.4	0.078	0.955	0.022	7.062	2447	13.8	4.584	2068	52.0	52.3	8.2	0.062	543	447	fbmy5635_rel_20230529_850.cza1_bee
499	561	26	0.5	12.8	3.6	0.046	0.929	0.026	7.474	2647	14.2	4.720	2025	52.0	52.4	8.3	0.063	559	479	fbmy8028_rel_20220829_752.cza1_bee
499	503	23	0.5	12.3	3.6	0.045	0.970	0.025	7.319	2451	14.3	4.871	2273	52.0	52.4	8.4	0.061	511	416	fbmy8028_rel_20230619_831.cza1_bee
499	488	36	0.5	12.4	3.6	0.073	0.989	0.025	7.348	2431	14.2	4.984	2328	52.0	52.4	8.4	0.063	495	400	fbmy8028_rel_221222.cza1_bee
499	424	47	0.6	6.2	1.2	0.111	1.344	0.013	2.499	2147	13.0	5.065	2453	51.8	52.3	8.2	0.038	431	352	fbmy8028_rel_231222_870.cza1_bee_cfx
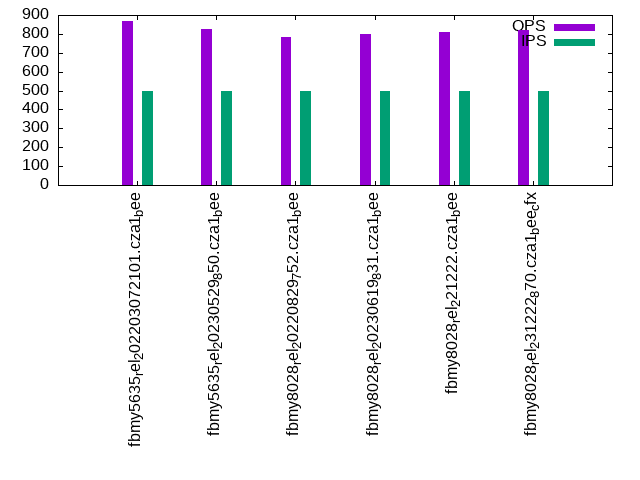
qp500.L4
qp500.L4: point queries with 500 insert/s per client. Graphs for performance per 1-second interval are here.
Average throughput:
Query response time histogram: each cell has the percentage of responses that take <= the time in the header and max is the max response time in seconds. For max values in the top 25% of the range have a red background and in the bottom 25% of the range have a green background. The red background is not used when the min value is within 80% of the max value.
| dbms | 256us | 1ms | 4ms | 16ms | 64ms | 256ms | 1s | 4s | 16s | gt | max |
|---|---|---|---|---|---|---|---|---|---|---|---|
| fbmy5635_rel_202203072101.cza1_bee | 28.133 | 71.794 | 0.072 | 0.001 | nonzero | 0.089 | |||||
| fbmy5635_rel_20230529_850.cza1_bee | 17.765 | 82.171 | 0.064 | nonzero | nonzero | 0.096 | |||||
| fbmy8028_rel_20220829_752.cza1_bee | 9.088 | 90.836 | 0.076 | nonzero | 0.020 | ||||||
| fbmy8028_rel_20230619_831.cza1_bee | 11.053 | 88.868 | 0.079 | 0.001 | 0.018 | ||||||
| fbmy8028_rel_221222.cza1_bee | 11.331 | 88.633 | 0.036 | nonzero | 0.061 | ||||||
| fbmy8028_rel_231222_870.cza1_bee_cfx | 14.448 | 85.494 | 0.058 | nonzero | 0.021 |
Insert response time histogram: each cell has the percentage of responses that take <= the time in the header and max is the max response time in seconds. For max values in the top 25% of the range have a red background and in the bottom 25% of the range have a green background. The red background is not used when the min value is within 80% of the max value.
| dbms | 256us | 1ms | 4ms | 16ms | 64ms | 256ms | 1s | 4s | 16s | gt | max |
|---|---|---|---|---|---|---|---|---|---|---|---|
| fbmy5635_rel_202203072101.cza1_bee | 99.550 | 0.450 | 0.013 | ||||||||
| fbmy5635_rel_20230529_850.cza1_bee | 99.728 | 0.272 | 0.014 | ||||||||
| fbmy8028_rel_20220829_752.cza1_bee | 99.011 | 0.978 | 0.011 | 0.019 | |||||||
| fbmy8028_rel_20230619_831.cza1_bee | 99.500 | 0.500 | 0.010 | ||||||||
| fbmy8028_rel_221222.cza1_bee | 99.489 | 0.511 | 0.014 | ||||||||
| fbmy8028_rel_231222_870.cza1_bee_cfx | 99.761 | 0.239 | 0.011 |
Delete response time histogram: each cell has the percentage of responses that take <= the time in the header and max is the max response time in seconds. For max values in the top 25% of the range have a red background and in the bottom 25% of the range have a green background. The red background is not used when the min value is within 80% of the max value.
| dbms | 256us | 1ms | 4ms | 16ms | 64ms | 256ms | 1s | 4s | 16s | gt | max |
|---|---|---|---|---|---|---|---|---|---|---|---|
| fbmy5635_rel_202203072101.cza1_bee | 99.411 | 0.583 | 0.006 | 0.017 | |||||||
| fbmy5635_rel_20230529_850.cza1_bee | 99.611 | 0.389 | 0.014 | ||||||||
| fbmy8028_rel_20220829_752.cza1_bee | 98.911 | 1.072 | 0.017 | 0.033 | |||||||
| fbmy8028_rel_20230619_831.cza1_bee | 99.433 | 0.567 | 0.010 | ||||||||
| fbmy8028_rel_221222.cza1_bee | 99.422 | 0.578 | 0.014 | ||||||||
| fbmy8028_rel_231222_870.cza1_bee_cfx | 99.700 | 0.300 | 0.010 |
Performance metrics for the DBMS listed above. Some are normalized by throughput, others are not. Legend for results is here.
ips	qps	rps	rmbps	wps	wmbps	rpq	rkbpq	wpi	wkbpi	csps	cpups	cspq	cpupq	dbgb1	dbgb2	rss	maxop	p50	p99	tag
499	867	6729	52.3	12.9	3.3	7.763	61.755	0.026	6.819	17227	8.7	19.875	803	52.2	52.6	8.5	0.089	879	783	fbmy5635_rel_202203072101.cza1_bee
499	824	6684	49.5	12.4	3.1	8.116	61.581	0.025	6.462	16948	8.3	20.579	806	52.2	52.6	8.5	0.096	831	745	fbmy5635_rel_20230529_850.cza1_bee
499	784	6113	47.7	13.1	3.4	7.802	62.351	0.026	6.893	15834	9.0	20.207	919	52.1	52.8	8.5	0.020	783	719	fbmy8028_rel_20220829_752.cza1_bee
499	797	6242	48.9	13.4	3.5	7.832	62.861	0.027	7.117	16216	9.5	20.347	954	52.1	52.8	8.6	0.018	799	719	fbmy8028_rel_20230619_831.cza1_bee
499	808	6532	49.2	13.1	3.4	8.088	62.413	0.026	6.912	16849	9.6	20.863	951	52.1	52.8	8.6	0.061	815	751	fbmy8028_rel_221222.cza1_bee
499	818	6329	46.7	8.0	1.7	7.735	58.410	0.016	3.498	16377	8.8	20.016	860	51.9	52.6	8.4	0.021	815	735	fbmy8028_rel_231222_870.cza1_bee_cfx
qr1000.L5
qr1000.L5: range queries with 1000 insert/s per client. Graphs for performance per 1-second interval are here.
Average throughput:
Query response time histogram: each cell has the percentage of responses that take <= the time in the header and max is the max response time in seconds. For max values in the top 25% of the range have a red background and in the bottom 25% of the range have a green background. The red background is not used when the min value is within 80% of the max value.
| dbms | 256us | 1ms | 4ms | 16ms | 64ms | 256ms | 1s | 4s | 16s | gt | max |
|---|---|---|---|---|---|---|---|---|---|---|---|
| fbmy5635_rel_202203072101.cza1_bee | 6.757 | 73.639 | 11.914 | 7.688 | 0.001 | nonzero | 0.192 | ||||
| fbmy5635_rel_20230529_850.cza1_bee | 3.364 | 62.620 | 0.425 | 33.586 | 0.006 | nonzero | 0.064 | ||||
| fbmy8028_rel_20220829_752.cza1_bee | 0.790 | 76.352 | 15.165 | 7.692 | 0.001 | nonzero | 0.208 | ||||
| fbmy8028_rel_20230619_831.cza1_bee | 0.091 | 71.874 | 17.229 | 10.804 | 0.001 | nonzero | 0.184 | ||||
| fbmy8028_rel_221222.cza1_bee | 0.190 | 67.602 | 3.795 | 28.409 | 0.003 | nonzero | 0.192 | ||||
| fbmy8028_rel_231222_870.cza1_bee_cfx | 0.009 | 66.035 | 0.402 | 33.549 | 0.005 | 0.042 |
Insert response time histogram: each cell has the percentage of responses that take <= the time in the header and max is the max response time in seconds. For max values in the top 25% of the range have a red background and in the bottom 25% of the range have a green background. The red background is not used when the min value is within 80% of the max value.
| dbms | 256us | 1ms | 4ms | 16ms | 64ms | 256ms | 1s | 4s | 16s | gt | max |
|---|---|---|---|---|---|---|---|---|---|---|---|
| fbmy5635_rel_202203072101.cza1_bee | 99.692 | 0.306 | 0.003 | 0.064 | |||||||
| fbmy5635_rel_20230529_850.cza1_bee | 99.544 | 0.439 | 0.017 | 0.056 | |||||||
| fbmy8028_rel_20220829_752.cza1_bee | 99.289 | 0.683 | 0.028 | 0.051 | |||||||
| fbmy8028_rel_20230619_831.cza1_bee | 99.319 | 0.633 | 0.044 | 0.003 | 0.067 | ||||||
| fbmy8028_rel_221222.cza1_bee | 99.333 | 0.594 | 0.069 | 0.003 | 0.083 | ||||||
| fbmy8028_rel_231222_870.cza1_bee_cfx | 99.222 | 0.725 | 0.050 | 0.003 | 0.066 |
Delete response time histogram: each cell has the percentage of responses that take <= the time in the header and max is the max response time in seconds. For max values in the top 25% of the range have a red background and in the bottom 25% of the range have a green background. The red background is not used when the min value is within 80% of the max value.
| dbms | 256us | 1ms | 4ms | 16ms | 64ms | 256ms | 1s | 4s | 16s | gt | max |
|---|---|---|---|---|---|---|---|---|---|---|---|
| fbmy5635_rel_202203072101.cza1_bee | 98.592 | 1.394 | 0.006 | 0.008 | 0.075 | ||||||
| fbmy5635_rel_20230529_850.cza1_bee | 98.239 | 1.733 | 0.028 | 0.062 | |||||||
| fbmy8028_rel_20220829_752.cza1_bee | 98.594 | 1.361 | 0.044 | 0.059 | |||||||
| fbmy8028_rel_20230619_831.cza1_bee | 98.042 | 1.897 | 0.058 | 0.003 | 0.080 | ||||||
| fbmy8028_rel_221222.cza1_bee | 98.222 | 1.692 | 0.083 | 0.003 | 0.068 | ||||||
| fbmy8028_rel_231222_870.cza1_bee_cfx | 97.303 | 2.575 | 0.122 | 0.052 |
Performance metrics for the DBMS listed above. Some are normalized by throughput, others are not. Legend for results is here.
ips	qps	rps	rmbps	wps	wmbps	rpq	rkbpq	wpi	wkbpi	csps	cpups	cspq	cpupq	dbgb1	dbgb2	rss	maxop	p50	p99	tag
997	1066	79	6.6	32.6	11.8	0.074	6.382	0.033	12.168	4739	19.4	4.446	1456	52.1	53.0	8.1	0.192	1055	416	fbmy5635_rel_202203072101.cza1_bee
997	398	165	1.1	20.1	7.2	0.415	2.793	0.020	7.402	2394	16.0	6.020	3219	52.8	53.6	8.4	0.064	400	320	fbmy5635_rel_20230529_850.cza1_bee
998	997	79	6.5	32.3	11.4	0.079	6.633	0.032	11.671	4642	20.1	4.657	1613	52.6	53.6	8.2	0.208	1039	384	fbmy8028_rel_20220829_752.cza1_bee
998	749	68	4.8	22.6	7.3	0.090	6.574	0.023	7.464	3624	18.3	4.839	1955	52.1	53.2	8.4	0.184	847	336	fbmy8028_rel_20230619_831.cza1_bee
998	412	197	1.4	22.0	7.5	0.479	3.436	0.022	7.696	2676	16.6	6.499	3225	52.8	53.8	8.3	0.192	416	320	fbmy8028_rel_221222.cza1_bee
998	321	42	0.6	9.3	2.4	0.130	1.756	0.009	2.479	1927	13.9	6.004	3464	52.2	53.3	8.3	0.042	320	256	fbmy8028_rel_231222_870.cza1_bee_cfx
qp1000.L6
qp1000.L6: point queries with 1000 insert/s per client. Graphs for performance per 1-second interval are here.
Average throughput:
Query response time histogram: each cell has the percentage of responses that take <= the time in the header and max is the max response time in seconds. For max values in the top 25% of the range have a red background and in the bottom 25% of the range have a green background. The red background is not used when the min value is within 80% of the max value.
| dbms | 256us | 1ms | 4ms | 16ms | 64ms | 256ms | 1s | 4s | 16s | gt | max |
|---|---|---|---|---|---|---|---|---|---|---|---|
| fbmy5635_rel_202203072101.cza1_bee | 23.995 | 75.932 | 0.072 | 0.001 | 0.051 | ||||||
| fbmy5635_rel_20230529_850.cza1_bee | 15.163 | 84.771 | 0.065 | 0.001 | nonzero | 0.112 | |||||
| fbmy8028_rel_20220829_752.cza1_bee | 6.340 | 93.576 | 0.084 | 0.001 | 0.026 | ||||||
| fbmy8028_rel_20230619_831.cza1_bee | 9.095 | 90.825 | 0.079 | nonzero | 0.029 | ||||||
| fbmy8028_rel_221222.cza1_bee | 8.633 | 91.314 | 0.052 | nonzero | nonzero | 0.102 | |||||
| fbmy8028_rel_231222_870.cza1_bee_cfx | 11.396 | 88.510 | 0.093 | nonzero | 0.027 |
Insert response time histogram: each cell has the percentage of responses that take <= the time in the header and max is the max response time in seconds. For max values in the top 25% of the range have a red background and in the bottom 25% of the range have a green background. The red background is not used when the min value is within 80% of the max value.
| dbms | 256us | 1ms | 4ms | 16ms | 64ms | 256ms | 1s | 4s | 16s | gt | max |
|---|---|---|---|---|---|---|---|---|---|---|---|
| fbmy5635_rel_202203072101.cza1_bee | 99.331 | 0.664 | 0.006 | 0.043 | |||||||
| fbmy5635_rel_20230529_850.cza1_bee | 99.689 | 0.308 | 0.003 | 0.045 | |||||||
| fbmy8028_rel_20220829_752.cza1_bee | 99.669 | 0.328 | 0.003 | 0.081 | |||||||
| fbmy8028_rel_20230619_831.cza1_bee | 99.442 | 0.556 | 0.003 | 0.073 | |||||||
| fbmy8028_rel_221222.cza1_bee | 99.283 | 0.517 | 0.197 | 0.003 | 0.080 | ||||||
| fbmy8028_rel_231222_870.cza1_bee_cfx | 99.667 | 0.331 | 0.003 | 0.080 |
Delete response time histogram: each cell has the percentage of responses that take <= the time in the header and max is the max response time in seconds. For max values in the top 25% of the range have a red background and in the bottom 25% of the range have a green background. The red background is not used when the min value is within 80% of the max value.
| dbms | 256us | 1ms | 4ms | 16ms | 64ms | 256ms | 1s | 4s | 16s | gt | max |
|---|---|---|---|---|---|---|---|---|---|---|---|
| fbmy5635_rel_202203072101.cza1_bee | 99.294 | 0.703 | 0.003 | 0.044 | |||||||
| fbmy5635_rel_20230529_850.cza1_bee | 99.619 | 0.378 | 0.003 | 0.045 | |||||||
| fbmy8028_rel_20220829_752.cza1_bee | 99.614 | 0.383 | 0.003 | 0.088 | |||||||
| fbmy8028_rel_20230619_831.cza1_bee | 99.453 | 0.542 | 0.003 | 0.003 | 0.088 | ||||||
| fbmy8028_rel_221222.cza1_bee | 99.175 | 0.625 | 0.197 | 0.003 | 0.088 | ||||||
| fbmy8028_rel_231222_870.cza1_bee_cfx | 99.581 | 0.417 | 0.003 | 0.082 |
Performance metrics for the DBMS listed above. Some are normalized by throughput, others are not. Legend for results is here.
ips	qps	rps	rmbps	wps	wmbps	rpq	rkbpq	wpi	wkbpi	csps	cpups	cspq	cpupq	dbgb1	dbgb2	rss	maxop	p50	p99	tag
998	850	6731	54.4	22.3	6.7	7.922	65.520	0.022	6.842	17446	10.4	20.534	979	52.4	53.7	8.5	0.051	863	592	fbmy5635_rel_202203072101.cza1_bee
998	816	7249	51.9	24.7	7.4	8.879	65.046	0.025	7.596	18252	12.5	22.356	1225	52.5	53.8	8.5	0.112	815	735	fbmy5635_rel_20230529_850.cza1_bee
998	761	6065	46.0	24.5	7.2	7.965	61.870	0.025	7.377	15992	11.0	21.003	1156	52.4	53.8	8.7	0.026	767	496	fbmy8028_rel_20220829_752.cza1_bee
998	784	6194	48.7	20.8	6.0	7.905	63.597	0.021	6.167	16324	11.8	20.835	1205	52.3	53.8	8.7	0.029	799	587	fbmy8028_rel_20230619_831.cza1_bee
998	790	7100	52.8	29.0	8.8	8.986	68.488	0.029	9.017	18278	14.5	23.134	1468	53.4	54.8	8.7	0.102	799	656	fbmy8028_rel_221222.cza1_bee
998	800	7325	53.1	24.3	7.4	9.161	68.025	0.024	7.594	18708	14.6	23.396	1461	52.1	53.5	8.5	0.027	799	655	fbmy8028_rel_231222_870.cza1_bee_cfx
l.i0
l.i0: load without secondary indexes
Performance metrics for all DBMS, not just the ones listed above. Some are normalized by throughput, others are not. Legend for results is here.
ips	qps	rps	rmbps	wps	wmbps	rpq	rkbpq	wpi	wkbpi	csps	cpups	cspq	cpupq	dbgb1	dbgb2	rss	maxop	p50	p99	tag
79984	0	0	0.0	42.3	14.2	0.000	0.000	0.001	0.182	7879	22.6	0.099	23	23.0	23.6	1.5	0.131	80293	71922	fbmy5635_rel_202203072101.cza1_bee
76111	0	0	0.0	40.4	13.5	0.000	0.000	0.001	0.182	7533	22.0	0.099	23	23.0	23.6	1.5	0.098	76318	68922	fbmy5635_rel_20230529_850.cza1_bee
57782	0	0	0.0	44.3	13.2	0.000	0.000	0.001	0.233	6079	22.4	0.105	31	23.0	23.8	2.0	0.114	57935	51591	fbmy8028_rel_20220829_752.cza1_bee
58407	0	0	0.0	44.8	13.3	0.000	0.000	0.001	0.233	6138	22.7	0.105	31	23.0	23.8	2.0	0.099	58434	52645	fbmy8028_rel_20230619_831.cza1_bee
57958	0	0	0.0	44.5	13.2	0.000	0.000	0.001	0.234	6230	22.7	0.107	31	23.0	23.8	2.0	0.135	58144	50044	fbmy8028_rel_221222.cza1_bee
58940	0	0	0.0	45.4	13.4	0.000	0.000	0.001	0.233	6198	22.9	0.105	31	23.0	23.8	2.0	0.109	58905	53170	fbmy8028_rel_231222_870.cza1_bee_cfx
l.x
l.x: create secondary indexes
Performance metrics for all DBMS, not just the ones listed above. Some are normalized by throughput, others are not. Legend for results is here.
ips	qps	rps	rmbps	wps	wmbps	rpq	rkbpq	wpi	wkbpi	csps	cpups	cspq	cpupq	dbgb1	dbgb2	rss	maxop	p50	p99	tag
81691	0	109	16.8	34.7	12.7	0.001	0.210	0.000	0.159	266	11.7	0.003	11	51.0	51.6	8.8	0.002	NA	NA	fbmy5635_rel_202203072101.cza1_bee
81549	0	137	16.8	34.9	12.7	0.002	0.212	0.000	0.159	272	11.7	0.003	11	51.0	51.6	8.8	0.002	NA	NA	fbmy5635_rel_20230529_850.cza1_bee
72906	0	96	14.9	30.5	11.1	0.001	0.209	0.000	0.156	407	11.7	0.006	13	50.9	51.7	10.3	0.003	NA	NA	fbmy8028_rel_20220829_752.cza1_bee
74150	0	98	15.2	30.6	11.3	0.001	0.209	0.000	0.156	406	11.7	0.005	13	50.9	51.7	10.3	0.003	NA	NA	fbmy8028_rel_20230619_831.cza1_bee
73455	0	97	15.0	30.6	11.2	0.001	0.209	0.000	0.156	407	11.6	0.006	13	50.9	51.7	10.3	0.003	NA	NA	fbmy8028_rel_221222.cza1_bee
73556	0	97	15.0	29.9	11.2	0.001	0.209	0.000	0.156	411	11.7	0.006	13	50.9	51.7	10.3	0.003	NA	NA	fbmy8028_rel_231222_870.cza1_bee_cfx
l.i1
l.i1: continue load after secondary indexes created with 50 inserts per transaction
Performance metrics for all DBMS, not just the ones listed above. Some are normalized by throughput, others are not. Legend for results is here.
ips	qps	rps	rmbps	wps	wmbps	rpq	rkbpq	wpi	wkbpi	csps	cpups	cspq	cpupq	dbgb1	dbgb2	rss	maxop	p50	p99	tag
27586	0	126	1.0	190.1	67.2	0.005	0.036	0.007	2.495	12422	45.4	0.450	132	52.0	53.5	7.4	0.076	27868	23573	fbmy5635_rel_202203072101.cza1_bee
27586	0	204	1.2	186.9	65.1	0.007	0.045	0.007	2.415	12407	49.0	0.450	142	51.7	53.2	7.4	0.078	27969	24124	fbmy5635_rel_20230529_850.cza1_bee
23256	0	141	0.7	158.3	56.0	0.006	0.029	0.007	2.464	11112	42.6	0.478	147	52.0	53.7	8.1	0.071	23440	15882	fbmy8028_rel_20220829_752.cza1_bee
23810	0	140	0.7	129.2	43.3	0.006	0.029	0.005	1.863	11127	42.1	0.467	141	51.8	53.5	8.2	0.080	24023	19781	fbmy8028_rel_20230619_831.cza1_bee
23669	0	140	0.8	187.1	62.3	0.006	0.033	0.008	2.694	11220	48.7	0.474	165	51.7	53.4	8.5	0.103	23931	20877	fbmy8028_rel_221222.cza1_bee
25478	0	153	1.7	161.5	57.2	0.006	0.070	0.006	2.301	12037	43.3	0.472	136	51.4	53.2	8.2	0.065	25572	19486	fbmy8028_rel_231222_870.cza1_bee_cfx
l.i2
l.i2: continue load after secondary indexes created with 5 inserts per transaction
Performance metrics for all DBMS, not just the ones listed above. Some are normalized by throughput, others are not. Legend for results is here.
ips	qps	rps	rmbps	wps	wmbps	rpq	rkbpq	wpi	wkbpi	csps	cpups	cspq	cpupq	dbgb1	dbgb2	rss	maxop	p50	p99	tag
9434	0	47	0.3	124.2	43.0	0.005	0.029	0.013	4.669	37757	40.3	4.002	342	52.1	52.3	7.4	0.051	9464	7891	fbmy5635_rel_202203072101.cza1_bee
9091	0	44	0.3	109.3	36.9	0.005	0.029	0.012	4.156	37179	39.7	4.090	349	52.1	52.3	7.4	0.056	9053	7550	fbmy5635_rel_20230529_850.cza1_bee
8064	0	46	0.2	112.5	38.7	0.006	0.029	0.014	4.912	33040	40.2	4.097	399	52.2	52.6	7.4	0.048	7992	6193	fbmy8028_rel_20220829_752.cza1_bee
7519	0	41	0.2	96.6	32.0	0.005	0.029	0.013	4.353	31437	39.6	4.181	421	51.8	52.2	7.4	0.053	7492	6418	fbmy8028_rel_20230619_831.cza1_bee
7576	0	42	0.2	112.2	36.2	0.006	0.029	0.015	4.890	31649	40.4	4.178	427	52.1	52.5	7.4	0.064	7582	6368	fbmy8028_rel_221222.cza1_bee
7874	0	44	0.3	67.1	21.1	0.006	0.033	0.009	2.739	32209	33.3	4.091	338	51.6	52.0	7.4	0.059	7956	6476	fbmy8028_rel_231222_870.cza1_bee_cfx
qr100.L1
qr100.L1: range queries with 100 insert/s per client
Performance metrics for all DBMS, not just the ones listed above. Some are normalized by throughput, others are not. Legend for results is here.
ips	qps	rps	rmbps	wps	wmbps	rpq	rkbpq	wpi	wkbpi	csps	cpups	cspq	cpupq	dbgb1	dbgb2	rss	maxop	p50	p99	tag
100	702	8	0.1	4.7	0.6	0.011	0.133	0.047	6.158	2846	12.5	4.057	1426	51.8	51.9	7.4	0.060	703	623	fbmy5635_rel_202203072101.cza1_bee
100	600	8	0.1	5.1	0.7	0.013	0.157	0.051	7.347	2464	12.6	4.104	1679	51.8	51.9	7.5	0.061	607	527	fbmy5635_rel_20230529_850.cza1_bee
100	643	8	0.1	4.7	0.6	0.012	0.148	0.047	6.137	2765	12.5	4.299	1555	51.8	52.0	7.4	0.058	639	572	fbmy8028_rel_20220829_752.cza1_bee
100	569	8	0.1	4.5	0.5	0.014	0.167	0.046	5.374	2480	12.4	4.359	1744	51.8	52.0	7.4	0.050	575	496	fbmy8028_rel_20230619_831.cza1_bee
100	565	8	0.1	4.9	0.7	0.014	0.168	0.050	6.804	2476	12.4	4.383	1756	51.8	52.0	7.4	0.049	560	495	fbmy8028_rel_221222.cza1_bee
100	485	8	0.1	3.4	0.1	0.016	0.196	0.034	1.051	2148	11.8	4.430	1947	51.6	51.8	7.4	0.010	480	430	fbmy8028_rel_231222_870.cza1_bee_cfx
qp100.L2
qp100.L2: point queries with 100 insert/s per client
Performance metrics for all DBMS, not just the ones listed above. Some are normalized by throughput, others are not. Legend for results is here.
ips	qps	rps	rmbps	wps	wmbps	rpq	rkbpq	wpi	wkbpi	csps	cpups	cspq	cpupq	dbgb1	dbgb2	rss	maxop	p50	p99	tag
100	900	6972	51.9	4.9	0.6	7.752	59.130	0.049	6.461	17483	7.4	19.436	658	51.9	51.9	8.7	0.040	911	822	fbmy5635_rel_202203072101.cza1_bee
100	837	6552	48.5	4.6	0.5	7.825	59.247	0.046	5.115	16513	6.9	19.719	659	51.9	51.9	8.5	0.029	847	751	fbmy5635_rel_20230529_850.cza1_bee
100	821	6338	47.2	4.9	0.6	7.718	58.878	0.049	6.430	16027	7.6	19.517	740	51.8	52.1	8.7	0.020	816	782	fbmy8028_rel_20220829_752.cza1_bee
100	842	6494	48.4	4.8	0.6	7.715	58.878	0.048	5.679	16452	7.6	19.546	722	51.8	52.1	8.8	0.037	847	799	fbmy8028_rel_20230619_831.cza1_bee
100	844	6548	48.6	4.7	0.5	7.762	58.942	0.047	5.335	16519	7.6	19.582	721	51.8	52.1	8.8	0.036	847	799	fbmy8028_rel_221222.cza1_bee
100	849	6520	47.9	3.8	0.2	7.683	57.789	0.038	2.532	16495	7.5	19.437	707	51.6	51.9	8.7	0.017	847	799	fbmy8028_rel_231222_870.cza1_bee_cfx
qr500.L3
qr500.L3: range queries with 500 insert/s per client
Performance metrics for all DBMS, not just the ones listed above. Some are normalized by throughput, others are not. Legend for results is here.
ips	qps	rps	rmbps	wps	wmbps	rpq	rkbpq	wpi	wkbpi	csps	cpups	cspq	cpupq	dbgb1	dbgb2	rss	maxop	p50	p99	tag
499	611	25	0.5	12.2	3.6	0.041	0.916	0.024	7.442	2695	13.5	4.408	1766	52.0	52.3	8.2	0.061	608	511	fbmy5635_rel_202203072101.cza1_bee
499	534	42	0.5	11.1	3.4	0.078	0.955	0.022	7.062	2447	13.8	4.584	2068	52.0	52.3	8.2	0.062	543	447	fbmy5635_rel_20230529_850.cza1_bee
499	561	26	0.5	12.8	3.6	0.046	0.929	0.026	7.474	2647	14.2	4.720	2025	52.0	52.4	8.3	0.063	559	479	fbmy8028_rel_20220829_752.cza1_bee
499	503	23	0.5	12.3	3.6	0.045	0.970	0.025	7.319	2451	14.3	4.871	2273	52.0	52.4	8.4	0.061	511	416	fbmy8028_rel_20230619_831.cza1_bee
499	488	36	0.5	12.4	3.6	0.073	0.989	0.025	7.348	2431	14.2	4.984	2328	52.0	52.4	8.4	0.063	495	400	fbmy8028_rel_221222.cza1_bee
499	424	47	0.6	6.2	1.2	0.111	1.344	0.013	2.499	2147	13.0	5.065	2453	51.8	52.3	8.2	0.038	431	352	fbmy8028_rel_231222_870.cza1_bee_cfx
qp500.L4
qp500.L4: point queries with 500 insert/s per client
Performance metrics for all DBMS, not just the ones listed above. Some are normalized by throughput, others are not. Legend for results is here.
ips	qps	rps	rmbps	wps	wmbps	rpq	rkbpq	wpi	wkbpi	csps	cpups	cspq	cpupq	dbgb1	dbgb2	rss	maxop	p50	p99	tag
499	867	6729	52.3	12.9	3.3	7.763	61.755	0.026	6.819	17227	8.7	19.875	803	52.2	52.6	8.5	0.089	879	783	fbmy5635_rel_202203072101.cza1_bee
499	824	6684	49.5	12.4	3.1	8.116	61.581	0.025	6.462	16948	8.3	20.579	806	52.2	52.6	8.5	0.096	831	745	fbmy5635_rel_20230529_850.cza1_bee
499	784	6113	47.7	13.1	3.4	7.802	62.351	0.026	6.893	15834	9.0	20.207	919	52.1	52.8	8.5	0.020	783	719	fbmy8028_rel_20220829_752.cza1_bee
499	797	6242	48.9	13.4	3.5	7.832	62.861	0.027	7.117	16216	9.5	20.347	954	52.1	52.8	8.6	0.018	799	719	fbmy8028_rel_20230619_831.cza1_bee
499	808	6532	49.2	13.1	3.4	8.088	62.413	0.026	6.912	16849	9.6	20.863	951	52.1	52.8	8.6	0.061	815	751	fbmy8028_rel_221222.cza1_bee
499	818	6329	46.7	8.0	1.7	7.735	58.410	0.016	3.498	16377	8.8	20.016	860	51.9	52.6	8.4	0.021	815	735	fbmy8028_rel_231222_870.cza1_bee_cfx
qr1000.L5
qr1000.L5: range queries with 1000 insert/s per client
Performance metrics for all DBMS, not just the ones listed above. Some are normalized by throughput, others are not. Legend for results is here.
ips	qps	rps	rmbps	wps	wmbps	rpq	rkbpq	wpi	wkbpi	csps	cpups	cspq	cpupq	dbgb1	dbgb2	rss	maxop	p50	p99	tag
997	1066	79	6.6	32.6	11.8	0.074	6.382	0.033	12.168	4739	19.4	4.446	1456	52.1	53.0	8.1	0.192	1055	416	fbmy5635_rel_202203072101.cza1_bee
997	398	165	1.1	20.1	7.2	0.415	2.793	0.020	7.402	2394	16.0	6.020	3219	52.8	53.6	8.4	0.064	400	320	fbmy5635_rel_20230529_850.cza1_bee
998	997	79	6.5	32.3	11.4	0.079	6.633	0.032	11.671	4642	20.1	4.657	1613	52.6	53.6	8.2	0.208	1039	384	fbmy8028_rel_20220829_752.cza1_bee
998	749	68	4.8	22.6	7.3	0.090	6.574	0.023	7.464	3624	18.3	4.839	1955	52.1	53.2	8.4	0.184	847	336	fbmy8028_rel_20230619_831.cza1_bee
998	412	197	1.4	22.0	7.5	0.479	3.436	0.022	7.696	2676	16.6	6.499	3225	52.8	53.8	8.3	0.192	416	320	fbmy8028_rel_221222.cza1_bee
998	321	42	0.6	9.3	2.4	0.130	1.756	0.009	2.479	1927	13.9	6.004	3464	52.2	53.3	8.3	0.042	320	256	fbmy8028_rel_231222_870.cza1_bee_cfx
qp1000.L6
qp1000.L6: point queries with 1000 insert/s per client
Performance metrics for all DBMS, not just the ones listed above. Some are normalized by throughput, others are not. Legend for results is here.
ips	qps	rps	rmbps	wps	wmbps	rpq	rkbpq	wpi	wkbpi	csps	cpups	cspq	cpupq	dbgb1	dbgb2	rss	maxop	p50	p99	tag
998	850	6731	54.4	22.3	6.7	7.922	65.520	0.022	6.842	17446	10.4	20.534	979	52.4	53.7	8.5	0.051	863	592	fbmy5635_rel_202203072101.cza1_bee
998	816	7249	51.9	24.7	7.4	8.879	65.046	0.025	7.596	18252	12.5	22.356	1225	52.5	53.8	8.5	0.112	815	735	fbmy5635_rel_20230529_850.cza1_bee
998	761	6065	46.0	24.5	7.2	7.965	61.870	0.025	7.377	15992	11.0	21.003	1156	52.4	53.8	8.7	0.026	767	496	fbmy8028_rel_20220829_752.cza1_bee
998	784	6194	48.7	20.8	6.0	7.905	63.597	0.021	6.167	16324	11.8	20.835	1205	52.3	53.8	8.7	0.029	799	587	fbmy8028_rel_20230619_831.cza1_bee
998	790	7100	52.8	29.0	8.8	8.986	68.488	0.029	9.017	18278	14.5	23.134	1468	53.4	54.8	8.7	0.102	799	656	fbmy8028_rel_221222.cza1_bee
998	800	7325	53.1	24.3	7.4	9.161	68.025	0.024	7.594	18708	14.6	23.396	1461	52.1	53.5	8.5	0.027	799	655	fbmy8028_rel_231222_870.cza1_bee_cfx
l.i0
- l.i0: load without secondary indexes
- Legend for results is here.
- Each entry lists the percentage of responses that fit in that bucket (slower than max time for previous bucket, faster than min time for next bucket).
Insert response time histogram
256us	1ms	4ms	16ms	64ms	256ms	1s	4s	16s	gt	max	tag
0.000	nonzero	99.872	0.124	0.001	0.003	0.000	0.000	0.000	0.000	0.131	fbmy5635_rel_202203072101.cza1_bee
0.000	0.000	99.865	0.130	0.002	0.002	0.000	0.000	0.000	0.000	0.098	fbmy5635_rel_20230529_850.cza1_bee
0.000	0.000	99.724	0.199	0.073	0.004	0.000	0.000	0.000	0.000	0.114	fbmy8028_rel_20220829_752.cza1_bee
0.000	0.000	99.726	0.197	0.073	0.003	0.000	0.000	0.000	0.000	0.099	fbmy8028_rel_20230619_831.cza1_bee
0.000	0.000	99.725	0.194	0.077	0.004	0.000	0.000	0.000	0.000	0.135	fbmy8028_rel_221222.cza1_bee
0.000	0.000	99.727	0.196	0.073	0.003	0.000	0.000	0.000	0.000	0.109	fbmy8028_rel_231222_870.cza1_bee_cfx
l.x
- l.x: create secondary indexes
- Legend for results is here.
- Each entry lists the percentage of responses that fit in that bucket (slower than max time for previous bucket, faster than min time for next bucket).
TODO - determine whether there is data for create index response time
l.i1
- l.i1: continue load after secondary indexes created with 50 inserts per transaction
- Legend for results is here.
- Each entry lists the percentage of responses that fit in that bucket (slower than max time for previous bucket, faster than min time for next bucket).
Insert response time histogram
256us	1ms	4ms	16ms	64ms	256ms	1s	4s	16s	gt	max	tag
0.000	0.000	99.785	0.211	0.003	0.001	0.000	0.000	0.000	0.000	0.076	fbmy5635_rel_202203072101.cza1_bee
0.000	0.000	99.771	0.220	0.006	0.003	0.000	0.000	0.000	0.000	0.078	fbmy5635_rel_20230529_850.cza1_bee
0.000	0.000	99.525	0.450	0.022	0.003	0.000	0.000	0.000	0.000	0.071	fbmy8028_rel_20220829_752.cza1_bee
0.000	0.000	99.599	0.391	0.009	0.001	0.000	0.000	0.000	0.000	0.080	fbmy8028_rel_20230619_831.cza1_bee
0.000	0.000	99.625	0.351	0.020	0.004	0.000	0.000	0.000	0.000	0.103	fbmy8028_rel_221222.cza1_bee
0.000	0.000	99.499	0.465	0.035	0.001	0.000	0.000	0.000	0.000	0.065	fbmy8028_rel_231222_870.cza1_bee_cfx
Delete response time histogram
256us	1ms	4ms	16ms	64ms	256ms	1s	4s	16s	gt	max	tag
0.000	0.000	99.715	0.265	0.019	0.001	0.000	0.000	0.000	0.000	0.076	fbmy5635_rel_202203072101.cza1_bee
0.000	0.000	99.750	0.232	0.014	0.004	0.000	0.000	0.000	0.000	0.079	fbmy5635_rel_20230529_850.cza1_bee
0.000	0.000	99.565	0.424	0.009	0.003	0.000	0.000	0.000	0.000	0.083	fbmy8028_rel_20220829_752.cza1_bee
0.000	0.000	99.508	0.462	0.026	0.004	0.000	0.000	0.000	0.000	0.080	fbmy8028_rel_20230619_831.cza1_bee
0.000	0.000	99.585	0.374	0.037	0.004	0.000	0.000	0.000	0.000	0.098	fbmy8028_rel_221222.cza1_bee
0.000	0.000	99.554	0.409	0.034	0.004	0.000	0.000	0.000	0.000	0.107	fbmy8028_rel_231222_870.cza1_bee_cfx
l.i2
- l.i2: continue load after secondary indexes created with 5 inserts per transaction
- Legend for results is here.
- Each entry lists the percentage of responses that fit in that bucket (slower than max time for previous bucket, faster than min time for next bucket).
Insert response time histogram
256us	1ms	4ms	16ms	64ms	256ms	1s	4s	16s	gt	max	tag
0.098	99.812	0.032	0.057	0.001	0.000	0.000	0.000	0.000	0.000	0.051	fbmy5635_rel_202203072101.cza1_bee
0.017	99.894	0.029	0.059	0.001	0.000	0.000	0.000	0.000	0.000	0.056	fbmy5635_rel_20230529_850.cza1_bee
0.000	99.841	0.068	0.090	0.002	0.000	0.000	0.000	0.000	0.000	0.048	fbmy8028_rel_20220829_752.cza1_bee
0.000	99.789	0.117	0.092	0.003	0.000	0.000	0.000	0.000	0.000	0.053	fbmy8028_rel_20230619_831.cza1_bee
0.000	99.803	0.106	0.081	0.010	0.001	0.000	0.000	0.000	0.000	0.064	fbmy8028_rel_221222.cza1_bee
0.000	99.846	0.064	0.085	0.006	0.000	0.000	0.000	0.000	0.000	0.059	fbmy8028_rel_231222_870.cza1_bee_cfx
Delete response time histogram
256us	1ms	4ms	16ms	64ms	256ms	1s	4s	16s	gt	max	tag
0.000	99.830	0.111	0.060	0.001	0.000	0.000	0.000	0.000	0.000	0.051	fbmy5635_rel_202203072101.cza1_bee
0.000	99.834	0.104	0.060	0.002	0.000	0.000	0.000	0.000	0.000	0.064	fbmy5635_rel_20230529_850.cza1_bee
0.000	99.790	0.117	0.092	0.002	0.000	0.000	0.000	0.000	0.000	0.056	fbmy8028_rel_20220829_752.cza1_bee
0.000	99.695	0.210	0.092	0.002	0.001	0.000	0.000	0.000	0.000	0.066	fbmy8028_rel_20230619_831.cza1_bee
0.000	99.701	0.204	0.084	0.010	0.001	0.000	0.000	0.000	0.000	0.086	fbmy8028_rel_221222.cza1_bee
0.000	99.779	0.132	0.084	0.006	0.001	0.000	0.000	0.000	0.000	0.072	fbmy8028_rel_231222_870.cza1_bee_cfx
qr100.L1
- qr100.L1: range queries with 100 insert/s per client
- Legend for results is here.
- Each entry lists the percentage of responses that fit in that bucket (slower than max time for previous bucket, faster than min time for next bucket).
Query response time histogram
256us	1ms	4ms	16ms	64ms	256ms	1s	4s	16s	gt	max	tag
7.020	59.603	33.100	0.277	nonzero	0.000	0.000	0.000	0.000	0.000	0.060	fbmy5635_rel_202203072101.cza1_bee
6.361	60.221	6.985	26.433	nonzero	0.000	0.000	0.000	0.000	0.000	0.061	fbmy5635_rel_20230529_850.cza1_bee
1.401	65.226	26.819	6.554	nonzero	0.000	0.000	0.000	0.000	0.000	0.058	fbmy8028_rel_20220829_752.cza1_bee
1.101	65.510	0.250	33.139	nonzero	0.000	0.000	0.000	0.000	0.000	0.050	fbmy8028_rel_20230619_831.cza1_bee
0.867	65.791	0.019	33.323	nonzero	0.000	0.000	0.000	0.000	0.000	0.049	fbmy8028_rel_221222.cza1_bee
0.355	66.252	0.025	33.368	0.000	0.000	0.000	0.000	0.000	0.000	0.010	fbmy8028_rel_231222_870.cza1_bee_cfx
Insert response time histogram
256us	1ms	4ms	16ms	64ms	256ms	1s	4s	16s	gt	max	tag
0.000	0.000	99.667	0.333	0.000	0.000	0.000	0.000	0.000	0.000	0.011	fbmy5635_rel_202203072101.cza1_bee
0.000	0.000	99.472	0.528	0.000	0.000	0.000	0.000	0.000	0.000	0.014	fbmy5635_rel_20230529_850.cza1_bee
0.000	0.000	98.889	1.083	0.028	0.000	0.000	0.000	0.000	0.000	0.018	fbmy8028_rel_20220829_752.cza1_bee
0.000	0.000	99.639	0.306	0.056	0.000	0.000	0.000	0.000	0.000	0.018	fbmy8028_rel_20230619_831.cza1_bee
0.000	0.000	99.472	0.472	0.056	0.000	0.000	0.000	0.000	0.000	0.023	fbmy8028_rel_221222.cza1_bee
0.000	0.000	99.167	0.806	0.028	0.000	0.000	0.000	0.000	0.000	0.018	fbmy8028_rel_231222_870.cza1_bee_cfx
Delete response time histogram
256us	1ms	4ms	16ms	64ms	256ms	1s	4s	16s	gt	max	tag
0.000	0.000	99.667	0.333	0.000	0.000	0.000	0.000	0.000	0.000	0.011	fbmy5635_rel_202203072101.cza1_bee
0.000	0.000	99.389	0.611	0.000	0.000	0.000	0.000	0.000	0.000	0.015	fbmy5635_rel_20230529_850.cza1_bee
0.000	0.000	98.889	1.083	0.028	0.000	0.000	0.000	0.000	0.000	0.018	fbmy8028_rel_20220829_752.cza1_bee
0.000	0.000	99.611	0.333	0.056	0.000	0.000	0.000	0.000	0.000	0.018	fbmy8028_rel_20230619_831.cza1_bee
0.000	0.000	99.444	0.500	0.056	0.000	0.000	0.000	0.000	0.000	0.023	fbmy8028_rel_221222.cza1_bee
0.000	0.000	99.111	0.861	0.028	0.000	0.000	0.000	0.000	0.000	0.018	fbmy8028_rel_231222_870.cza1_bee_cfx
qp100.L2
- qp100.L2: point queries with 100 insert/s per client
- Legend for results is here.
- Each entry lists the percentage of responses that fit in that bucket (slower than max time for previous bucket, faster than min time for next bucket).
Query response time histogram
256us	1ms	4ms	16ms	64ms	256ms	1s	4s	16s	gt	max	tag
0.000	33.106	66.866	0.028	0.001	0.000	0.000	0.000	0.000	0.000	0.040	fbmy5635_rel_202203072101.cza1_bee
0.000	18.931	81.033	0.035	0.001	0.000	0.000	0.000	0.000	0.000	0.029	fbmy5635_rel_20230529_850.cza1_bee
0.000	11.864	88.108	0.028	nonzero	0.000	0.000	0.000	0.000	0.000	0.020	fbmy8028_rel_20220829_752.cza1_bee
0.000	15.944	84.028	0.028	nonzero	0.000	0.000	0.000	0.000	0.000	0.037	fbmy8028_rel_20230619_831.cza1_bee
0.000	15.301	84.681	0.018	nonzero	0.000	0.000	0.000	0.000	0.000	0.036	fbmy8028_rel_221222.cza1_bee
0.000	17.110	82.866	0.024	nonzero	0.000	0.000	0.000	0.000	0.000	0.017	fbmy8028_rel_231222_870.cza1_bee_cfx
Insert response time histogram
256us	1ms	4ms	16ms	64ms	256ms	1s	4s	16s	gt	max	tag
0.000	0.000	99.278	0.722	0.000	0.000	0.000	0.000	0.000	0.000	0.013	fbmy5635_rel_202203072101.cza1_bee
0.000	0.000	99.361	0.639	0.000	0.000	0.000	0.000	0.000	0.000	0.014	fbmy5635_rel_20230529_850.cza1_bee
0.000	0.000	98.528	1.472	0.000	0.000	0.000	0.000	0.000	0.000	0.016	fbmy8028_rel_20220829_752.cza1_bee
0.000	0.000	96.917	3.028	0.028	0.028	0.000	0.000	0.000	0.000	0.065	fbmy8028_rel_20230619_831.cza1_bee
0.000	0.000	99.111	0.889	0.000	0.000	0.000	0.000	0.000	0.000	0.013	fbmy8028_rel_221222.cza1_bee
0.000	0.000	99.111	0.889	0.000	0.000	0.000	0.000	0.000	0.000	0.013	fbmy8028_rel_231222_870.cza1_bee_cfx
Delete response time histogram
256us	1ms	4ms	16ms	64ms	256ms	1s	4s	16s	gt	max	tag
0.000	0.000	99.222	0.778	0.000	0.000	0.000	0.000	0.000	0.000	0.014	fbmy5635_rel_202203072101.cza1_bee
0.000	0.000	99.278	0.722	0.000	0.000	0.000	0.000	0.000	0.000	0.014	fbmy5635_rel_20230529_850.cza1_bee
0.000	0.000	98.000	2.000	0.000	0.000	0.000	0.000	0.000	0.000	0.015	fbmy8028_rel_20220829_752.cza1_bee
0.000	0.000	97.778	2.194	0.028	0.000	0.000	0.000	0.000	0.000	0.017	fbmy8028_rel_20230619_831.cza1_bee
0.000	0.000	98.944	1.056	0.000	0.000	0.000	0.000	0.000	0.000	0.013	fbmy8028_rel_221222.cza1_bee
0.000	0.000	98.583	1.389	0.028	0.000	0.000	0.000	0.000	0.000	0.018	fbmy8028_rel_231222_870.cza1_bee_cfx
qr500.L3
- qr500.L3: range queries with 500 insert/s per client
- Legend for results is here.
- Each entry lists the percentage of responses that fit in that bucket (slower than max time for previous bucket, faster than min time for next bucket).
Query response time histogram
256us	1ms	4ms	16ms	64ms	256ms	1s	4s	16s	gt	max	tag
5.698	60.747	11.326	22.227	0.002	0.000	0.000	0.000	0.000	0.000	0.061	fbmy5635_rel_202203072101.cza1_bee
4.975	61.477	0.139	33.408	0.002	0.000	0.000	0.000	0.000	0.000	0.062	fbmy5635_rel_20230529_850.cza1_bee
0.772	65.512	1.442	32.272	0.001	0.000	0.000	0.000	0.000	0.000	0.063	fbmy8028_rel_20220829_752.cza1_bee
0.539	65.740	0.194	33.525	0.002	0.000	0.000	0.000	0.000	0.000	0.061	fbmy8028_rel_20230619_831.cza1_bee
0.531	65.818	0.151	33.498	0.001	0.000	0.000	0.000	0.000	0.000	0.063	fbmy8028_rel_221222.cza1_bee
0.058	66.215	0.177	33.545	0.005	0.000	0.000	0.000	0.000	0.000	0.038	fbmy8028_rel_231222_870.cza1_bee_cfx
Insert response time histogram
256us	1ms	4ms	16ms	64ms	256ms	1s	4s	16s	gt	max	tag
0.000	0.000	99.428	0.561	0.011	0.000	0.000	0.000	0.000	0.000	0.020	fbmy5635_rel_202203072101.cza1_bee
0.000	0.000	99.650	0.350	0.000	0.000	0.000	0.000	0.000	0.000	0.014	fbmy5635_rel_20230529_850.cza1_bee
0.000	0.000	98.261	1.678	0.061	0.000	0.000	0.000	0.000	0.000	0.027	fbmy8028_rel_20220829_752.cza1_bee
0.000	0.000	99.294	0.644	0.061	0.000	0.000	0.000	0.000	0.000	0.023	fbmy8028_rel_20230619_831.cza1_bee
0.000	0.000	98.461	1.494	0.044	0.000	0.000	0.000	0.000	0.000	0.024	fbmy8028_rel_221222.cza1_bee
0.000	0.000	98.144	1.800	0.056	0.000	0.000	0.000	0.000	0.000	0.018	fbmy8028_rel_231222_870.cza1_bee_cfx
Delete response time histogram
256us	1ms	4ms	16ms	64ms	256ms	1s	4s	16s	gt	max	tag
0.000	0.000	98.061	1.883	0.056	0.000	0.000	0.000	0.000	0.000	0.020	fbmy5635_rel_202203072101.cza1_bee
0.000	0.000	97.950	2.039	0.011	0.000	0.000	0.000	0.000	0.000	0.017	fbmy5635_rel_20230529_850.cza1_bee
0.000	0.000	96.339	3.567	0.094	0.000	0.000	0.000	0.000	0.000	0.031	fbmy8028_rel_20220829_752.cza1_bee
0.000	0.000	97.411	2.444	0.144	0.000	0.000	0.000	0.000	0.000	0.024	fbmy8028_rel_20230619_831.cza1_bee
0.000	0.000	96.867	3.033	0.100	0.000	0.000	0.000	0.000	0.000	0.024	fbmy8028_rel_221222.cza1_bee
0.000	0.000	95.611	4.222	0.167	0.000	0.000	0.000	0.000	0.000	0.023	fbmy8028_rel_231222_870.cza1_bee_cfx
qp500.L4
- qp500.L4: point queries with 500 insert/s per client
- Legend for results is here.
- Each entry lists the percentage of responses that fit in that bucket (slower than max time for previous bucket, faster than min time for next bucket).
Query response time histogram
256us	1ms	4ms	16ms	64ms	256ms	1s	4s	16s	gt	max	tag
0.000	28.133	71.794	0.072	0.001	nonzero	0.000	0.000	0.000	0.000	0.089	fbmy5635_rel_202203072101.cza1_bee
0.000	17.765	82.171	0.064	nonzero	nonzero	0.000	0.000	0.000	0.000	0.096	fbmy5635_rel_20230529_850.cza1_bee
0.000	9.088	90.836	0.076	nonzero	0.000	0.000	0.000	0.000	0.000	0.020	fbmy8028_rel_20220829_752.cza1_bee
0.000	11.053	88.868	0.079	0.001	0.000	0.000	0.000	0.000	0.000	0.018	fbmy8028_rel_20230619_831.cza1_bee
0.000	11.331	88.633	0.036	nonzero	0.000	0.000	0.000	0.000	0.000	0.061	fbmy8028_rel_221222.cza1_bee
0.000	14.448	85.494	0.058	nonzero	0.000	0.000	0.000	0.000	0.000	0.021	fbmy8028_rel_231222_870.cza1_bee_cfx
Insert response time histogram
256us	1ms	4ms	16ms	64ms	256ms	1s	4s	16s	gt	max	tag
0.000	0.000	99.550	0.450	0.000	0.000	0.000	0.000	0.000	0.000	0.013	fbmy5635_rel_202203072101.cza1_bee
0.000	0.000	99.728	0.272	0.000	0.000	0.000	0.000	0.000	0.000	0.014	fbmy5635_rel_20230529_850.cza1_bee
0.000	0.000	99.011	0.978	0.011	0.000	0.000	0.000	0.000	0.000	0.019	fbmy8028_rel_20220829_752.cza1_bee
0.000	0.000	99.500	0.500	0.000	0.000	0.000	0.000	0.000	0.000	0.010	fbmy8028_rel_20230619_831.cza1_bee
0.000	0.000	99.489	0.511	0.000	0.000	0.000	0.000	0.000	0.000	0.014	fbmy8028_rel_221222.cza1_bee
0.000	0.000	99.761	0.239	0.000	0.000	0.000	0.000	0.000	0.000	0.011	fbmy8028_rel_231222_870.cza1_bee_cfx
Delete response time histogram
256us	1ms	4ms	16ms	64ms	256ms	1s	4s	16s	gt	max	tag
0.000	0.000	99.411	0.583	0.006	0.000	0.000	0.000	0.000	0.000	0.017	fbmy5635_rel_202203072101.cza1_bee
0.000	0.000	99.611	0.389	0.000	0.000	0.000	0.000	0.000	0.000	0.014	fbmy5635_rel_20230529_850.cza1_bee
0.000	0.000	98.911	1.072	0.017	0.000	0.000	0.000	0.000	0.000	0.033	fbmy8028_rel_20220829_752.cza1_bee
0.000	0.000	99.433	0.567	0.000	0.000	0.000	0.000	0.000	0.000	0.010	fbmy8028_rel_20230619_831.cza1_bee
0.000	0.000	99.422	0.578	0.000	0.000	0.000	0.000	0.000	0.000	0.014	fbmy8028_rel_221222.cza1_bee
0.000	0.000	99.700	0.300	0.000	0.000	0.000	0.000	0.000	0.000	0.010	fbmy8028_rel_231222_870.cza1_bee_cfx
qr1000.L5
- qr1000.L5: range queries with 1000 insert/s per client
- Legend for results is here.
- Each entry lists the percentage of responses that fit in that bucket (slower than max time for previous bucket, faster than min time for next bucket).
Query response time histogram
256us	1ms	4ms	16ms	64ms	256ms	1s	4s	16s	gt	max	tag
6.757	73.639	11.914	7.688	0.001	nonzero	0.000	0.000	0.000	0.000	0.192	fbmy5635_rel_202203072101.cza1_bee
3.364	62.620	0.425	33.586	0.006	nonzero	0.000	0.000	0.000	0.000	0.064	fbmy5635_rel_20230529_850.cza1_bee
0.790	76.352	15.165	7.692	0.001	nonzero	0.000	0.000	0.000	0.000	0.208	fbmy8028_rel_20220829_752.cza1_bee
0.091	71.874	17.229	10.804	0.001	nonzero	0.000	0.000	0.000	0.000	0.184	fbmy8028_rel_20230619_831.cza1_bee
0.190	67.602	3.795	28.409	0.003	nonzero	0.000	0.000	0.000	0.000	0.192	fbmy8028_rel_221222.cza1_bee
0.009	66.035	0.402	33.549	0.005	0.000	0.000	0.000	0.000	0.000	0.042	fbmy8028_rel_231222_870.cza1_bee_cfx
Insert response time histogram
256us	1ms	4ms	16ms	64ms	256ms	1s	4s	16s	gt	max	tag
0.000	0.000	99.692	0.306	0.000	0.003	0.000	0.000	0.000	0.000	0.064	fbmy5635_rel_202203072101.cza1_bee
0.000	0.000	99.544	0.439	0.017	0.000	0.000	0.000	0.000	0.000	0.056	fbmy5635_rel_20230529_850.cza1_bee
0.000	0.000	99.289	0.683	0.028	0.000	0.000	0.000	0.000	0.000	0.051	fbmy8028_rel_20220829_752.cza1_bee
0.000	0.000	99.319	0.633	0.044	0.003	0.000	0.000	0.000	0.000	0.067	fbmy8028_rel_20230619_831.cza1_bee
0.000	0.000	99.333	0.594	0.069	0.003	0.000	0.000	0.000	0.000	0.083	fbmy8028_rel_221222.cza1_bee
0.000	0.000	99.222	0.725	0.050	0.003	0.000	0.000	0.000	0.000	0.066	fbmy8028_rel_231222_870.cza1_bee_cfx
Delete response time histogram
256us	1ms	4ms	16ms	64ms	256ms	1s	4s	16s	gt	max	tag
0.000	0.000	98.592	1.394	0.006	0.008	0.000	0.000	0.000	0.000	0.075	fbmy5635_rel_202203072101.cza1_bee
0.000	0.000	98.239	1.733	0.028	0.000	0.000	0.000	0.000	0.000	0.062	fbmy5635_rel_20230529_850.cza1_bee
0.000	0.000	98.594	1.361	0.044	0.000	0.000	0.000	0.000	0.000	0.059	fbmy8028_rel_20220829_752.cza1_bee
0.000	0.000	98.042	1.897	0.058	0.003	0.000	0.000	0.000	0.000	0.080	fbmy8028_rel_20230619_831.cza1_bee
0.000	0.000	98.222	1.692	0.083	0.003	0.000	0.000	0.000	0.000	0.068	fbmy8028_rel_221222.cza1_bee
0.000	0.000	97.303	2.575	0.122	0.000	0.000	0.000	0.000	0.000	0.052	fbmy8028_rel_231222_870.cza1_bee_cfx
qp1000.L6
- qp1000.L6: point queries with 1000 insert/s per client
- Legend for results is here.
- Each entry lists the percentage of responses that fit in that bucket (slower than max time for previous bucket, faster than min time for next bucket).
Query response time histogram
256us	1ms	4ms	16ms	64ms	256ms	1s	4s	16s	gt	max	tag
0.000	23.995	75.932	0.072	0.001	0.000	0.000	0.000	0.000	0.000	0.051	fbmy5635_rel_202203072101.cza1_bee
0.000	15.163	84.771	0.065	0.001	nonzero	0.000	0.000	0.000	0.000	0.112	fbmy5635_rel_20230529_850.cza1_bee
0.000	6.340	93.576	0.084	0.001	0.000	0.000	0.000	0.000	0.000	0.026	fbmy8028_rel_20220829_752.cza1_bee
0.000	9.095	90.825	0.079	nonzero	0.000	0.000	0.000	0.000	0.000	0.029	fbmy8028_rel_20230619_831.cza1_bee
0.000	8.633	91.314	0.052	nonzero	nonzero	0.000	0.000	0.000	0.000	0.102	fbmy8028_rel_221222.cza1_bee
0.000	11.396	88.510	0.093	nonzero	0.000	0.000	0.000	0.000	0.000	0.027	fbmy8028_rel_231222_870.cza1_bee_cfx
Insert response time histogram
256us	1ms	4ms	16ms	64ms	256ms	1s	4s	16s	gt	max	tag
0.000	0.000	99.331	0.664	0.006	0.000	0.000	0.000	0.000	0.000	0.043	fbmy5635_rel_202203072101.cza1_bee
0.000	0.000	99.689	0.308	0.003	0.000	0.000	0.000	0.000	0.000	0.045	fbmy5635_rel_20230529_850.cza1_bee
0.000	0.000	99.669	0.328	0.000	0.003	0.000	0.000	0.000	0.000	0.081	fbmy8028_rel_20220829_752.cza1_bee
0.000	0.000	99.442	0.556	0.000	0.003	0.000	0.000	0.000	0.000	0.073	fbmy8028_rel_20230619_831.cza1_bee
0.000	0.000	99.283	0.517	0.197	0.003	0.000	0.000	0.000	0.000	0.080	fbmy8028_rel_221222.cza1_bee
0.000	0.000	99.667	0.331	0.000	0.003	0.000	0.000	0.000	0.000	0.080	fbmy8028_rel_231222_870.cza1_bee_cfx
Delete response time histogram
256us	1ms	4ms	16ms	64ms	256ms	1s	4s	16s	gt	max	tag
0.000	0.000	99.294	0.703	0.003	0.000	0.000	0.000	0.000	0.000	0.044	fbmy5635_rel_202203072101.cza1_bee
0.000	0.000	99.619	0.378	0.003	0.000	0.000	0.000	0.000	0.000	0.045	fbmy5635_rel_20230529_850.cza1_bee
0.000	0.000	99.614	0.383	0.000	0.003	0.000	0.000	0.000	0.000	0.088	fbmy8028_rel_20220829_752.cza1_bee
0.000	0.000	99.453	0.542	0.003	0.003	0.000	0.000	0.000	0.000	0.088	fbmy8028_rel_20230619_831.cza1_bee
0.000	0.000	99.175	0.625	0.197	0.003	0.000	0.000	0.000	0.000	0.088	fbmy8028_rel_221222.cza1_bee
0.000	0.000	99.581	0.417	0.000	0.003	0.000	0.000	0.000	0.000	0.082	fbmy8028_rel_231222_870.cza1_bee_cfx