Introduction
This is a report for the insert benchmark with 800M docs and 1 client(s). It is generated by scripts (bash, awk, sed) and Tufte might not be impressed. An overview of the insert benchmark is here and a short update is here. Below, by DBMS, I mean DBMS+version.config. An example is my8020.c10b40 where my means MySQL, 8020 is version 8.0.20 and c10b40 is the name for the configuration file.
The test server has 8 AMD cores, 32G RAM and an NVMe SSD. It is described here as the SER7. The benchmark was run with 1 client and there were 1 or 3 connections per client (1 for queries or inserts without rate limits, 1+1 for rate limited inserts+deletes). It uses 1 table. It loads 800M rows per table without secondary indexes, creates 3 secondary indexes per table, then inserts 4m+10 rows per table with a delete per insert to avoid growing the table. It then does 6 read+write tests for 7200s each that do queries as fast as possible with 100,100,500,500,1000,1000 inserts/s and the same for deletes/s per client concurrent with the queries. The database is cached in memory. Clients and the DBMS share one server. The per-database configs are in the per-database subdirectories here.
The tested DBMS are:
- pg1217_def.cx9a2_ser7 - Postgres 12.17, x9a2 config
- pg1313_def.cx9a2_ser7 - Postgres 13.13, x9a2 config
- pg1410_def.cx9a2_ser7 - Postgres 14.10, x9a2 config
- pg1411_def.cx9a2_ser7 - Postgres 14.11, x9a2 config
- pg155_def.cx9a2_ser7 - Postgres 15.5, x9a2 config
- pg156_def.cx9a2_ser7 - Postgres 15.6, x9a2 config
- pg161_def.cx9a2_ser7 - Postgres 16.1, x9a2 config
- pg162_def.cx9a2_ser7 - Postgres 16.2, x9a2 config
Contents
- Summary
- l.i0: load without secondary indexes
- l.x: create secondary indexes
- l.i1: continue load after secondary indexes created with 50 inserts per transaction
- l.i2: continue load after secondary indexes created with 5 inserts per transaction
- qr100.L1: range queries with 100 insert/s per client
- qp100.L2: point queries with 100 insert/s per client
- qr500.L3: range queries with 500 insert/s per client
- qp500.L4: point queries with 500 insert/s per client
- qr1000.L5: range queries with 1000 insert/s per client
- qp1000.L6: point queries with 1000 insert/s per client
Summary
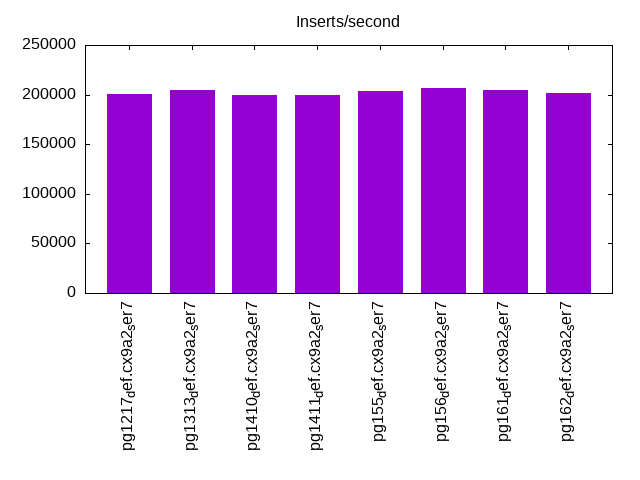
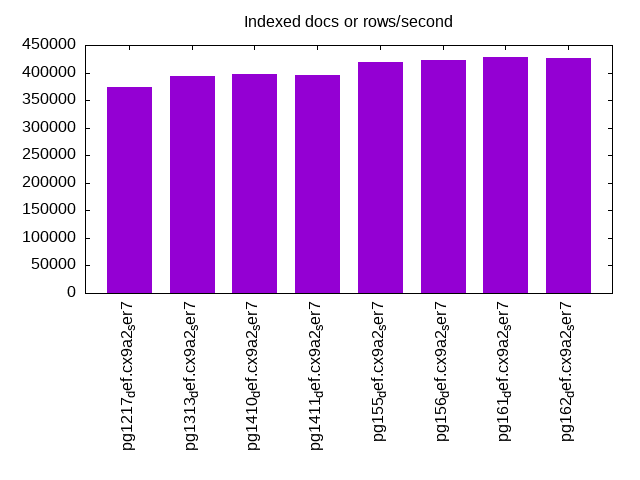
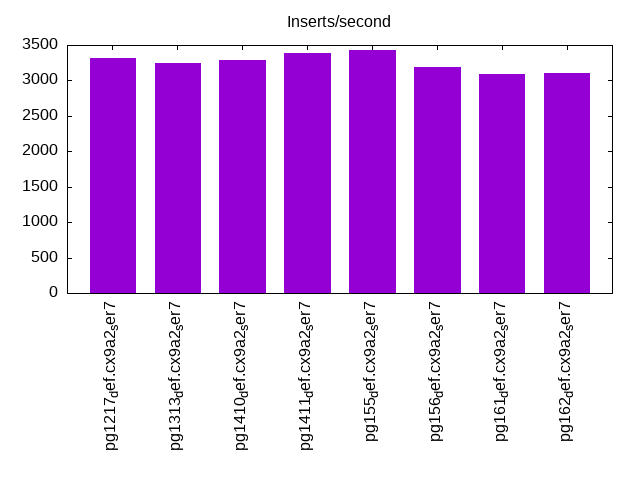
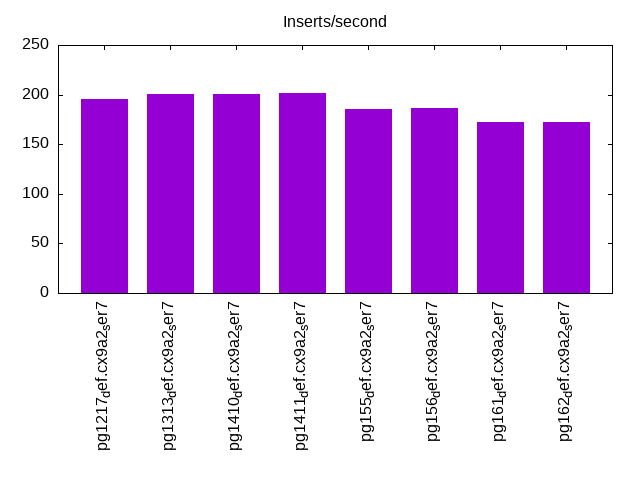
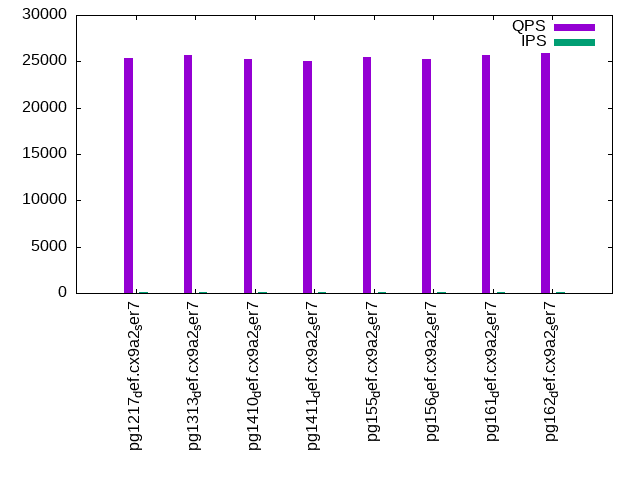
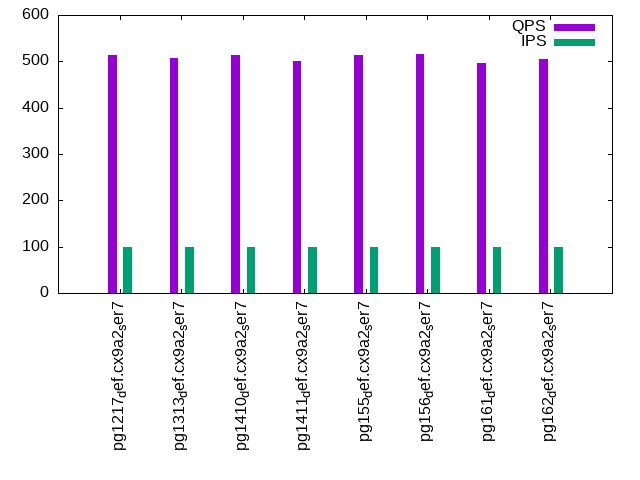
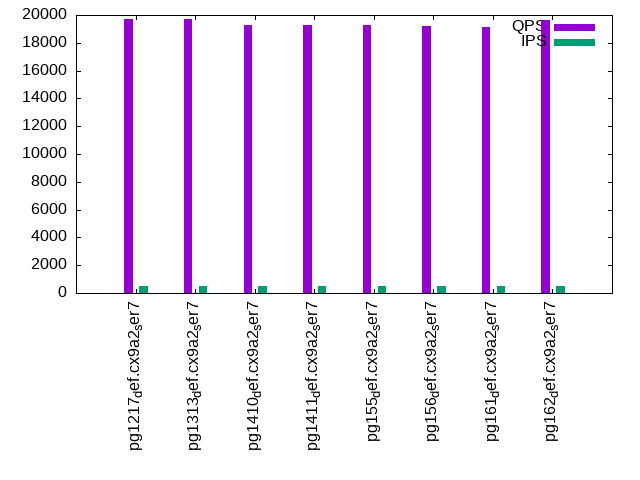
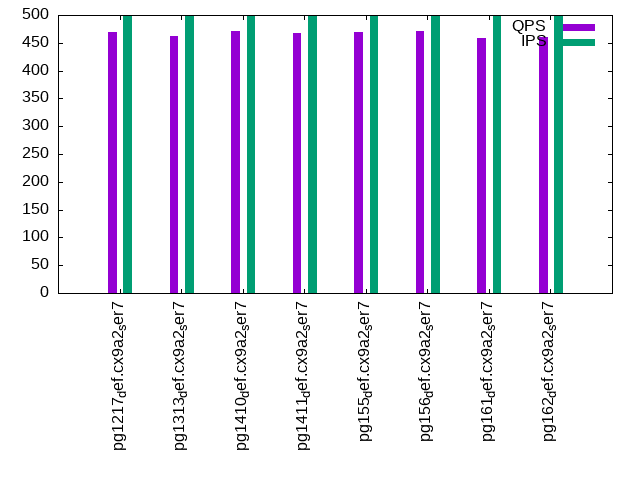
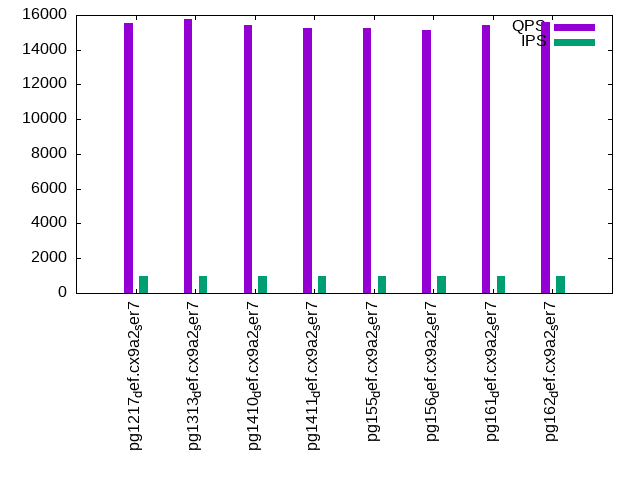
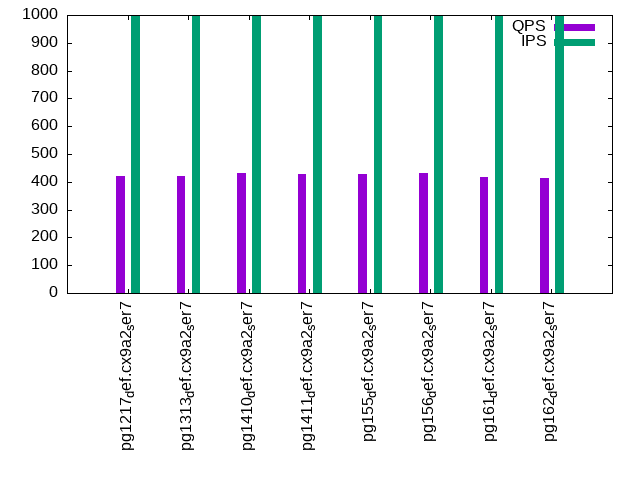
The numbers are inserts/s for l.i0, l.i1 and l.i2, indexed docs (or rows) /s for l.x and queries/s for qr100, qp100 thru qr1000, qp1000" The values are the average rate over the entire test for inserts (IPS) and queries (QPS). The range of values for IPS and QPS is split into 3 parts: bottom 25%, middle 50%, top 25%. Values in the bottom 25% have a red background, values in the top 25% have a green background and values in the middle have no color. A gray background is used for values that can be ignored because the DBMS did not sustain the target insert rate. Red backgrounds are not used when the minimum value is within 80% of the max value.
| dbms | l.i0 | l.x | l.i1 | l.i2 | qr100 | qp100 | qr500 | qp500 | qr1000 | qp1000 |
|---|---|---|---|---|---|---|---|---|---|---|
| pg1217_def.cx9a2_ser7 | 201056 | 373134 | 3320 | 196 | 25322 | 514 | 19714 | 470 | 15549 | 421 |
| pg1313_def.cx9a2_ser7 | 204186 | 394089 | 3239 | 201 | 25660 | 508 | 19714 | 462 | 15774 | 420 |
| pg1410_def.cx9a2_ser7 | 199700 | 398208 | 3295 | 201 | 25299 | 513 | 19315 | 471 | 15403 | 431 |
| pg1411_def.cx9a2_ser7 | 199651 | 395062 | 3387 | 202 | 25054 | 501 | 19291 | 467 | 15265 | 427 |
| pg155_def.cx9a2_ser7 | 203926 | 418410 | 3425 | 185 | 25477 | 513 | 19283 | 470 | 15262 | 429 |
| pg156_def.cx9a2_ser7 | 206772 | 422610 | 3190 | 186 | 25256 | 515 | 19221 | 471 | 15119 | 430 |
| pg161_def.cx9a2_ser7 | 205128 | 427350 | 3096 | 172 | 25677 | 496 | 19134 | 458 | 15430 | 418 |
| pg162_def.cx9a2_ser7 | 201969 | 426894 | 3098 | 172 | 25878 | 506 | 19660 | 460 | 15618 | 412 |
This table has relative throughput, throughput for the DBMS relative to the DBMS in the first line, using the absolute throughput from the previous table. Values less than 0.95 have a yellow background. Values greater than 1.05 have a blue background.
| dbms | l.i0 | l.x | l.i1 | l.i2 | qr100 | qp100 | qr500 | qp500 | qr1000 | qp1000 |
|---|---|---|---|---|---|---|---|---|---|---|
| pg1217_def.cx9a2_ser7 | 1.00 | 1.00 | 1.00 | 1.00 | 1.00 | 1.00 | 1.00 | 1.00 | 1.00 | 1.00 |
| pg1313_def.cx9a2_ser7 | 1.02 | 1.06 | 0.98 | 1.03 | 1.01 | 0.99 | 1.00 | 0.98 | 1.01 | 1.00 |
| pg1410_def.cx9a2_ser7 | 0.99 | 1.07 | 0.99 | 1.03 | 1.00 | 1.00 | 0.98 | 1.00 | 0.99 | 1.02 |
| pg1411_def.cx9a2_ser7 | 0.99 | 1.06 | 1.02 | 1.03 | 0.99 | 0.97 | 0.98 | 0.99 | 0.98 | 1.01 |
| pg155_def.cx9a2_ser7 | 1.01 | 1.12 | 1.03 | 0.94 | 1.01 | 1.00 | 0.98 | 1.00 | 0.98 | 1.02 |
| pg156_def.cx9a2_ser7 | 1.03 | 1.13 | 0.96 | 0.95 | 1.00 | 1.00 | 0.97 | 1.00 | 0.97 | 1.02 |
| pg161_def.cx9a2_ser7 | 1.02 | 1.15 | 0.93 | 0.88 | 1.01 | 0.96 | 0.97 | 0.97 | 0.99 | 0.99 |
| pg162_def.cx9a2_ser7 | 1.00 | 1.14 | 0.93 | 0.88 | 1.02 | 0.98 | 1.00 | 0.98 | 1.00 | 0.98 |
This lists the average rate of inserts/s for the tests that do inserts concurrent with queries. For such tests the query rate is listed in the table above. The read+write tests are setup so that the insert rate should match the target rate every second. Cells that are not at least 95% of the target have a red background to indicate a failure to satisfy the target.
| dbms | qr100.L1 | qp100.L2 | qr500.L3 | qp500.L4 | qr1000.L5 | qp1000.L6 |
|---|---|---|---|---|---|---|
| pg1217_def.cx9a2_ser7 | 100 | 100 | 499 | 499 | 996 | 999 |
| pg1313_def.cx9a2_ser7 | 100 | 100 | 499 | 499 | 994 | 999 |
| pg1410_def.cx9a2_ser7 | 100 | 100 | 499 | 499 | 999 | 999 |
| pg1411_def.cx9a2_ser7 | 100 | 100 | 499 | 499 | 998 | 998 |
| pg155_def.cx9a2_ser7 | 100 | 100 | 499 | 499 | 999 | 999 |
| pg156_def.cx9a2_ser7 | 100 | 100 | 499 | 499 | 999 | 999 |
| pg161_def.cx9a2_ser7 | 100 | 100 | 499 | 499 | 994 | 999 |
| pg162_def.cx9a2_ser7 | 100 | 100 | 499 | 499 | 998 | 997 |
| target | 100 | 100 | 500 | 500 | 1000 | 1000 |
l.i0
l.i0: load without secondary indexes. Graphs for performance per 1-second interval are here.
Average throughput:
Insert response time histogram: each cell has the percentage of responses that take <= the time in the header and max is the max response time in seconds. For the max column values in the top 25% of the range have a red background and in the bottom 25% of the range have a green background. The red background is not used when the min value is within 80% of the max value.
| dbms | 256us | 1ms | 4ms | 16ms | 64ms | 256ms | 1s | 4s | 16s | gt | max |
|---|---|---|---|---|---|---|---|---|---|---|---|
| pg1217_def.cx9a2_ser7 | 99.981 | 0.018 | nonzero | nonzero | nonzero | 0.235 | |||||
| pg1313_def.cx9a2_ser7 | 99.949 | 0.045 | 0.004 | 0.002 | nonzero | 0.106 | |||||
| pg1410_def.cx9a2_ser7 | 99.956 | 0.040 | 0.003 | 0.001 | nonzero | 0.100 | |||||
| pg1411_def.cx9a2_ser7 | 99.953 | 0.043 | 0.002 | 0.001 | nonzero | 0.096 | |||||
| pg155_def.cx9a2_ser7 | 99.954 | 0.041 | 0.004 | 0.002 | nonzero | 0.152 | |||||
| pg156_def.cx9a2_ser7 | 99.952 | 0.045 | 0.002 | 0.001 | nonzero | 0.086 | |||||
| pg161_def.cx9a2_ser7 | 99.948 | 0.047 | 0.003 | 0.002 | nonzero | 0.128 | |||||
| pg162_def.cx9a2_ser7 | 99.951 | 0.044 | 0.003 | 0.002 | nonzero | 0.149 |
Performance metrics for the DBMS listed above. Some are normalized by throughput, others are not. Legend for results is here.
ips	qps	rps	rmbps	wps	wmbps	rpq	rkbpq	wpi	wkbpi	csps	cpups	cspq	cpupq	dbgb1	dbgb2	rss	maxop	p50	p99	tag
201056	0	38	0.3	348.6	82.3	0.000	0.002	0.002	0.419	23718	11.7	0.118	5	76.5	116.6	0.2	0.235	199820	190487	pg1217_def.cx9a2_ser7
204186	0	39	0.3	288.0	83.9	0.000	0.002	0.001	0.421	24252	11.8	0.119	5	76.5	116.6	18.5	0.106	203475	192886	pg1313_def.cx9a2_ser7
199700	0	36	0.3	283.4	82.0	0.000	0.001	0.001	0.421	23946	11.4	0.120	5	76.5	116.6	18.8	0.100	198073	185392	pg1410_def.cx9a2_ser7
199651	0	37	0.3	284.1	81.8	0.000	0.002	0.001	0.420	23998	11.6	0.120	5	76.5	116.6	3.3	0.096	198298	187884	pg1411_def.cx9a2_ser7
203926	0	39	0.3	287.6	83.9	0.000	0.002	0.001	0.421	24394	11.4	0.120	4	76.5	116.6	3.2	0.152	202849	190199	pg155_def.cx9a2_ser7
206772	0	36	0.3	295.2	84.8	0.000	0.001	0.001	0.420	24719	11.4	0.120	4	76.5	116.6	5.7	0.086	206476	195181	pg156_def.cx9a2_ser7
205128	0	34	0.3	288.8	84.2	0.000	0.001	0.001	0.420	24168	11.5	0.118	4	76.5	116.6	0.4	0.128	203978	193681	pg161_def.cx9a2_ser7
201969	0	34	0.3	286.7	83.0	0.000	0.001	0.001	0.421	24055	11.5	0.119	5	76.5	116.6	18.7	0.149	200580	190595	pg162_def.cx9a2_ser7
l.x
l.x: create secondary indexes.
Average throughput:
Performance metrics for the DBMS listed above. Some are normalized by throughput, others are not. Legend for results is here.
ips	qps	rps	rmbps	wps	wmbps	rpq	rkbpq	wpi	wkbpi	csps	cpups	cspq	cpupq	dbgb1	dbgb2	rss	maxop	p50	p99	tag
373134	0	1107	126.2	801.9	190.1	0.003	0.346	0.002	0.522	1272	7.1	0.003	2	153.8	193.8	23.2	0.005	NA	NA	pg1217_def.cx9a2_ser7
394089	0	1123	129.6	385.0	147.3	0.003	0.337	0.001	0.383	1251	7.0	0.003	1	153.6	193.7	21.2	0.007	NA	NA	pg1313_def.cx9a2_ser7
398208	0	1127	131.0	383.5	147.7	0.003	0.337	0.001	0.380	1245	6.9	0.003	1	153.6	193.7	20.5	0.006	NA	NA	pg1410_def.cx9a2_ser7
395062	0	1113	129.9	382.8	147.1	0.003	0.337	0.001	0.381	1201	6.8	0.003	1	153.6	193.7	20.7	0.004	NA	NA	pg1411_def.cx9a2_ser7
418410	0	1495	141.2	411.6	157.9	0.004	0.346	0.001	0.387	1509	6.5	0.004	1	153.6	193.7	22.6	0.003	NA	NA	pg155_def.cx9a2_ser7
422610	0	1510	142.6	411.9	158.4	0.004	0.345	0.001	0.384	1477	6.4	0.003	1	153.6	193.7	22.9	0.006	NA	NA	pg156_def.cx9a2_ser7
427350	0	1512	144.1	420.9	160.9	0.004	0.345	0.001	0.386	1548	6.5	0.004	1	153.6	193.7	22.4	0.005	NA	NA	pg161_def.cx9a2_ser7
426894	0	1506	143.9	418.0	160.3	0.004	0.345	0.001	0.384	1530	6.5	0.004	1	153.6	193.7	23.0	0.005	NA	NA	pg162_def.cx9a2_ser7
l.i1
l.i1: continue load after secondary indexes created with 50 inserts per transaction. Graphs for performance per 1-second interval are here.
Average throughput:
Insert response time histogram: each cell has the percentage of responses that take <= the time in the header and max is the max response time in seconds. For the max column values in the top 25% of the range have a red background and in the bottom 25% of the range have a green background. The red background is not used when the min value is within 80% of the max value.
| dbms | 256us | 1ms | 4ms | 16ms | 64ms | 256ms | 1s | 4s | 16s | gt | max |
|---|---|---|---|---|---|---|---|---|---|---|---|
| pg1217_def.cx9a2_ser7 | 97.308 | 2.684 | 0.009 | 0.118 | |||||||
| pg1313_def.cx9a2_ser7 | 88.331 | 11.539 | 0.130 | 0.139 | |||||||
| pg1410_def.cx9a2_ser7 | 91.196 | 8.775 | 0.029 | 0.116 | |||||||
| pg1411_def.cx9a2_ser7 | 94.911 | 5.060 | 0.029 | 0.249 | |||||||
| pg155_def.cx9a2_ser7 | 97.414 | 2.579 | 0.007 | 0.177 | |||||||
| pg156_def.cx9a2_ser7 | 94.328 | 5.647 | 0.025 | 0.232 | |||||||
| pg161_def.cx9a2_ser7 | 94.647 | 5.334 | 0.019 | 0.157 | |||||||
| pg162_def.cx9a2_ser7 | 94.138 | 5.849 | 0.014 | 0.160 |
Delete response time histogram: each cell has the percentage of responses that take <= the time in the header and max is the max response time in seconds. For the max column values in the top 25% of the range have a red background and in the bottom 25% of the range have a green background. The red background is not used when the min value is within 80% of the max value.
| dbms | 256us | 1ms | 4ms | 16ms | 64ms | 256ms | 1s | 4s | 16s | gt | max |
|---|---|---|---|---|---|---|---|---|---|---|---|
| pg1217_def.cx9a2_ser7 | 0.004 | 1.620 | 11.223 | 56.785 | 30.366 | 0.003 | 0.101 | ||||
| pg1313_def.cx9a2_ser7 | 0.003 | 1.149 | 10.466 | 58.605 | 29.777 | 0.027 | |||||
| pg1410_def.cx9a2_ser7 | 0.004 | 1.188 | 10.350 | 59.231 | 29.227 | 0.030 | |||||
| pg1411_def.cx9a2_ser7 | 0.004 | 1.468 | 10.254 | 57.635 | 30.640 | 0.029 | |||||
| pg155_def.cx9a2_ser7 | 0.004 | 1.411 | 9.738 | 55.456 | 33.391 | 0.027 | |||||
| pg156_def.cx9a2_ser7 | 0.005 | 1.661 | 11.685 | 52.179 | 34.469 | 0.001 | 0.089 | ||||
| pg161_def.cx9a2_ser7 | 0.004 | 1.770 | 9.793 | 50.836 | 37.598 | 0.034 | |||||
| pg162_def.cx9a2_ser7 | 0.005 | 1.480 | 11.389 | 50.578 | 36.549 | 0.031 |
Performance metrics for the DBMS listed above. Some are normalized by throughput, others are not. Legend for results is here.
ips	qps	rps	rmbps	wps	wmbps	rpq	rkbpq	wpi	wkbpi	csps	cpups	cspq	cpupq	dbgb1	dbgb2	rss	maxop	p50	p99	tag
3320	0	4229	33.5	3629.8	70.1	1.274	10.329	1.093	21.622	11788	7.7	3.551	186	154.4	194.5	19.7	0.118	3399	2097	pg1217_def.cx9a2_ser7
3239	0	4668	37.2	3617.8	65.5	1.441	11.767	1.117	20.698	12034	7.4	3.716	183	154.3	194.3	20.7	0.139	3296	950	pg1313_def.cx9a2_ser7
3295	0	4746	37.9	3708.6	67.2	1.441	11.769	1.126	20.893	12132	7.3	3.682	177	154.3	194.3	15.6	0.116	3346	1498	pg1410_def.cx9a2_ser7
3387	0	4872	38.8	3800.5	69.2	1.439	11.736	1.122	20.917	12476	7.6	3.684	180	154.3	194.3	20.6	0.249	3246	1149	pg1411_def.cx9a2_ser7
3425	0	4926	39.3	3791.0	68.8	1.438	11.736	1.107	20.567	12502	8.0	3.651	187	154.3	194.3	20.5	0.177	3195	2047	pg155_def.cx9a2_ser7
3190	0	4594	36.6	3603.8	65.3	1.440	11.750	1.130	20.978	11639	7.4	3.649	186	154.3	194.3	20.0	0.232	3196	1798	pg156_def.cx9a2_ser7
3096	0	4470	35.6	3471.6	62.8	1.444	11.774	1.121	20.774	11367	7.4	3.672	191	154.3	194.3	20.0	0.157	3047	1498	pg161_def.cx9a2_ser7
3098	0	4477	35.6	3469.3	62.8	1.445	11.782	1.120	20.762	11360	7.5	3.666	194	154.3	194.3	20.3	0.160	3096	1548	pg162_def.cx9a2_ser7
l.i2
l.i2: continue load after secondary indexes created with 5 inserts per transaction. Graphs for performance per 1-second interval are here.
Average throughput:
Insert response time histogram: each cell has the percentage of responses that take <= the time in the header and max is the max response time in seconds. For the max column values in the top 25% of the range have a red background and in the bottom 25% of the range have a green background. The red background is not used when the min value is within 80% of the max value.
| dbms | 256us | 1ms | 4ms | 16ms | 64ms | 256ms | 1s | 4s | 16s | gt | max |
|---|---|---|---|---|---|---|---|---|---|---|---|
| pg1217_def.cx9a2_ser7 | 2.015 | 96.596 | 1.378 | 0.009 | 0.002 | 0.118 | |||||
| pg1313_def.cx9a2_ser7 | 1.750 | 96.067 | 2.169 | 0.012 | 0.001 | 0.097 | |||||
| pg1410_def.cx9a2_ser7 | 1.747 | 96.003 | 2.240 | 0.009 | 0.001 | 0.080 | |||||
| pg1411_def.cx9a2_ser7 | 3.728 | 94.398 | 1.851 | 0.022 | 0.001 | 0.070 | |||||
| pg155_def.cx9a2_ser7 | 1.307 | 96.383 | 2.300 | 0.010 | 0.001 | 0.088 | |||||
| pg156_def.cx9a2_ser7 | 1.158 | 96.403 | 2.429 | 0.009 | 0.002 | 0.124 | |||||
| pg161_def.cx9a2_ser7 | 1.056 | 95.948 | 2.985 | 0.009 | 0.002 | 0.113 | |||||
| pg162_def.cx9a2_ser7 | 0.927 | 95.872 | 3.187 | 0.012 | 0.002 | 0.106 |
Delete response time histogram: each cell has the percentage of responses that take <= the time in the header and max is the max response time in seconds. For the max column values in the top 25% of the range have a red background and in the bottom 25% of the range have a green background. The red background is not used when the min value is within 80% of the max value.
| dbms | 256us | 1ms | 4ms | 16ms | 64ms | 256ms | 1s | 4s | 16s | gt | max |
|---|---|---|---|---|---|---|---|---|---|---|---|
| pg1217_def.cx9a2_ser7 | 99.999 | 0.001 | 0.088 | ||||||||
| pg1313_def.cx9a2_ser7 | 99.999 | 0.001 | 0.092 | ||||||||
| pg1410_def.cx9a2_ser7 | 99.999 | 0.001 | 0.090 | ||||||||
| pg1411_def.cx9a2_ser7 | 99.999 | 0.001 | 0.090 | ||||||||
| pg155_def.cx9a2_ser7 | 99.999 | 0.001 | 0.091 | ||||||||
| pg156_def.cx9a2_ser7 | 99.999 | 0.001 | 0.091 | ||||||||
| pg161_def.cx9a2_ser7 | 99.999 | 0.001 | 0.114 | ||||||||
| pg162_def.cx9a2_ser7 | 99.999 | 0.001 | 0.090 |
Performance metrics for the DBMS listed above. Some are normalized by throughput, others are not. Legend for results is here.
ips	qps	rps	rmbps	wps	wmbps	rpq	rkbpq	wpi	wkbpi	csps	cpups	cspq	cpupq	dbgb1	dbgb2	rss	maxop	p50	p99	tag
196	0	211	1.7	453.4	6.5	1.075	8.744	2.310	34.144	1817	6.3	9.254	2568	154.6	193.2	19.7	0.118	195	175	pg1217_def.cx9a2_ser7
201	0	215	1.7	553.7	7.9	1.073	8.750	2.759	40.300	1943	6.5	9.679	2591	154.4	194.5	22.2	0.097	200	180	pg1313_def.cx9a2_ser7
201	0	216	1.7	557.7	7.8	1.073	8.746	2.769	39.494	1745	6.1	8.663	2423	154.4	194.5	22.2	0.080	200	180	pg1410_def.cx9a2_ser7
202	0	216	1.7	555.9	7.8	1.072	8.731	2.758	39.368	1741	6.0	8.635	2381	154.4	194.5	14.6	0.070	200	180	pg1411_def.cx9a2_ser7
185	0	199	1.6	515.8	7.4	1.073	8.756	2.787	41.017	1585	6.0	8.565	2593	154.4	194.5	22.3	0.088	185	165	pg155_def.cx9a2_ser7
186	0	200	1.6	517.4	7.3	1.073	8.742	2.776	40.274	1583	5.9	8.493	2532	154.4	194.5	14.5	0.124	185	165	pg156_def.cx9a2_ser7
172	0	185	1.5	484.7	6.9	1.072	8.755	2.813	41.230	1494	5.9	8.670	2739	154.4	194.5	22.0	0.113	170	155	pg161_def.cx9a2_ser7
172	0	184	1.5	483.4	6.9	1.073	8.757	2.816	41.212	1487	5.9	8.661	2749	154.4	194.5	21.9	0.106	170	155	pg162_def.cx9a2_ser7
qr100.L1
qr100.L1: range queries with 100 insert/s per client. Graphs for performance per 1-second interval are here.
Average throughput:
Query response time histogram: each cell has the percentage of responses that take <= the time in the header and max is the max response time in seconds. For max values in the top 25% of the range have a red background and in the bottom 25% of the range have a green background. The red background is not used when the min value is within 80% of the max value.
| dbms | 256us | 1ms | 4ms | 16ms | 64ms | 256ms | 1s | 4s | 16s | gt | max |
|---|---|---|---|---|---|---|---|---|---|---|---|
| pg1217_def.cx9a2_ser7 | 99.993 | 0.007 | nonzero | nonzero | 0.011 | ||||||
| pg1313_def.cx9a2_ser7 | 99.992 | 0.007 | nonzero | nonzero | 0.014 | ||||||
| pg1410_def.cx9a2_ser7 | 99.992 | 0.008 | nonzero | nonzero | 0.011 | ||||||
| pg1411_def.cx9a2_ser7 | 99.991 | 0.008 | nonzero | nonzero | 0.013 | ||||||
| pg155_def.cx9a2_ser7 | 99.993 | 0.007 | nonzero | nonzero | 0.010 | ||||||
| pg156_def.cx9a2_ser7 | 99.992 | 0.008 | nonzero | nonzero | 0.012 | ||||||
| pg161_def.cx9a2_ser7 | 99.993 | 0.007 | nonzero | nonzero | 0.010 | ||||||
| pg162_def.cx9a2_ser7 | 99.993 | 0.007 | nonzero | nonzero | 0.010 |
Insert response time histogram: each cell has the percentage of responses that take <= the time in the header and max is the max response time in seconds. For max values in the top 25% of the range have a red background and in the bottom 25% of the range have a green background. The red background is not used when the min value is within 80% of the max value.
| dbms | 256us | 1ms | 4ms | 16ms | 64ms | 256ms | 1s | 4s | 16s | gt | max |
|---|---|---|---|---|---|---|---|---|---|---|---|
| pg1217_def.cx9a2_ser7 | 74.201 | 25.799 | 0.024 | ||||||||
| pg1313_def.cx9a2_ser7 | 73.132 | 26.715 | 0.153 | 0.098 | |||||||
| pg1410_def.cx9a2_ser7 | 74.840 | 25.160 | 0.027 | ||||||||
| pg1411_def.cx9a2_ser7 | 71.326 | 28.396 | 0.278 | 0.099 | |||||||
| pg155_def.cx9a2_ser7 | 74.493 | 25.507 | 0.025 | ||||||||
| pg156_def.cx9a2_ser7 | 74.236 | 25.764 | 0.028 | ||||||||
| pg161_def.cx9a2_ser7 | 73.285 | 26.681 | 0.035 | 0.079 | |||||||
| pg162_def.cx9a2_ser7 | 74.611 | 25.389 | 0.025 |
Delete response time histogram: each cell has the percentage of responses that take <= the time in the header and max is the max response time in seconds. For max values in the top 25% of the range have a red background and in the bottom 25% of the range have a green background. The red background is not used when the min value is within 80% of the max value.
| dbms | 256us | 1ms | 4ms | 16ms | 64ms | 256ms | 1s | 4s | 16s | gt | max |
|---|---|---|---|---|---|---|---|---|---|---|---|
| pg1217_def.cx9a2_ser7 | 0.139 | 10.938 | 57.528 | 31.396 | 0.010 | ||||||
| pg1313_def.cx9a2_ser7 | 0.007 | 10.917 | 56.542 | 32.535 | 0.015 | ||||||
| pg1410_def.cx9a2_ser7 | 0.007 | 13.257 | 52.611 | 34.125 | 0.010 | ||||||
| pg1411_def.cx9a2_ser7 | 0.069 | 12.167 | 53.264 | 34.486 | 0.014 | 0.025 | |||||
| pg155_def.cx9a2_ser7 | 0.049 | 12.208 | 53.993 | 33.750 | 0.015 | ||||||
| pg156_def.cx9a2_ser7 | 0.062 | 11.792 | 56.347 | 31.799 | 0.015 | ||||||
| pg161_def.cx9a2_ser7 | 0.007 | 12.118 | 55.785 | 32.090 | 0.016 | ||||||
| pg162_def.cx9a2_ser7 | 0.021 | 12.111 | 54.639 | 33.229 | 0.010 |
Performance metrics for the DBMS listed above. Some are normalized by throughput, others are not. Legend for results is here.
ips	qps	rps	rmbps	wps	wmbps	rpq	rkbpq	wpi	wkbpi	csps	cpups	cspq	cpupq	dbgb1	dbgb2	rss	maxop	p50	p99	tag
100	25322	110	0.9	146.3	2.6	0.004	0.036	1.466	26.751	97275	4.8	3.841	15	154.7	187.2	23.1	0.011	25731	19668	pg1217_def.cx9a2_ser7
100	25660	109	0.9	146.2	2.6	0.004	0.035	1.465	26.789	98571	4.9	3.841	15	154.5	187.9	23.1	0.014	26261	19690	pg1313_def.cx9a2_ser7
100	25299	109	0.9	147.1	2.6	0.004	0.036	1.474	26.866	97087	4.7	3.838	15	154.5	187.6	22.7	0.011	25636	19420	pg1410_def.cx9a2_ser7
100	25054	109	0.9	147.8	2.6	0.004	0.036	1.481	26.923	96181	4.7	3.839	15	154.5	187.5	22.6	0.013	25484	19051	pg1411_def.cx9a2_ser7
100	25477	109	0.9	147.0	2.6	0.004	0.035	1.473	26.847	97745	4.6	3.837	14	154.5	188.0	23.1	0.010	25907	19179	pg155_def.cx9a2_ser7
100	25256	109	0.9	147.1	2.6	0.004	0.035	1.474	26.846	96905	4.7	3.837	15	154.5	187.7	23.1	0.012	25687	19468	pg156_def.cx9a2_ser7
100	25677	109	0.9	147.1	2.6	0.004	0.035	1.474	26.870	98492	4.7	3.836	15	154.5	187.9	23.0	0.010	25971	19802	pg161_def.cx9a2_ser7
100	25878	109	0.9	146.9	2.6	0.004	0.035	1.472	26.853	99274	4.7	3.836	15	154.5	187.9	23.0	0.010	26081	19943	pg162_def.cx9a2_ser7
qp100.L2
qp100.L2: point queries with 100 insert/s per client. Graphs for performance per 1-second interval are here.
Average throughput:
Query response time histogram: each cell has the percentage of responses that take <= the time in the header and max is the max response time in seconds. For max values in the top 25% of the range have a red background and in the bottom 25% of the range have a green background. The red background is not used when the min value is within 80% of the max value.
| dbms | 256us | 1ms | 4ms | 16ms | 64ms | 256ms | 1s | 4s | 16s | gt | max |
|---|---|---|---|---|---|---|---|---|---|---|---|
| pg1217_def.cx9a2_ser7 | nonzero | 0.496 | 99.457 | 0.047 | nonzero | 0.025 | |||||
| pg1313_def.cx9a2_ser7 | 0.493 | 99.064 | 0.437 | 0.005 | 0.043 | ||||||
| pg1410_def.cx9a2_ser7 | nonzero | 0.495 | 99.451 | 0.054 | nonzero | 0.027 | |||||
| pg1411_def.cx9a2_ser7 | nonzero | 0.483 | 98.638 | 0.848 | 0.030 | nonzero | 0.095 | ||||
| pg155_def.cx9a2_ser7 | nonzero | 0.473 | 99.477 | 0.050 | nonzero | nonzero | 0.070 | ||||
| pg156_def.cx9a2_ser7 | nonzero | 0.493 | 99.465 | 0.042 | nonzero | 0.087 | |||||
| pg161_def.cx9a2_ser7 | nonzero | 0.429 | 99.007 | 0.536 | 0.028 | nonzero | 0.078 | ||||
| pg162_def.cx9a2_ser7 | nonzero | 0.443 | 99.515 | 0.043 | nonzero | 0.017 |
Insert response time histogram: each cell has the percentage of responses that take <= the time in the header and max is the max response time in seconds. For max values in the top 25% of the range have a red background and in the bottom 25% of the range have a green background. The red background is not used when the min value is within 80% of the max value.
| dbms | 256us | 1ms | 4ms | 16ms | 64ms | 256ms | 1s | 4s | 16s | gt | max |
|---|---|---|---|---|---|---|---|---|---|---|---|
| pg1217_def.cx9a2_ser7 | 81.667 | 18.333 | 0.038 | ||||||||
| pg1313_def.cx9a2_ser7 | 80.458 | 19.521 | 0.021 | 0.094 | |||||||
| pg1410_def.cx9a2_ser7 | 79.583 | 20.417 | 0.036 | ||||||||
| pg1411_def.cx9a2_ser7 | 92.736 | 6.799 | 0.465 | 0.182 | |||||||
| pg155_def.cx9a2_ser7 | 83.590 | 16.410 | 0.032 | ||||||||
| pg156_def.cx9a2_ser7 | 83.069 | 16.931 | 0.035 | ||||||||
| pg161_def.cx9a2_ser7 | 79.278 | 20.319 | 0.403 | 0.122 | |||||||
| pg162_def.cx9a2_ser7 | 78.500 | 21.500 | 0.040 |
Delete response time histogram: each cell has the percentage of responses that take <= the time in the header and max is the max response time in seconds. For max values in the top 25% of the range have a red background and in the bottom 25% of the range have a green background. The red background is not used when the min value is within 80% of the max value.
| dbms | 256us | 1ms | 4ms | 16ms | 64ms | 256ms | 1s | 4s | 16s | gt | max |
|---|---|---|---|---|---|---|---|---|---|---|---|
| pg1217_def.cx9a2_ser7 | 0.028 | 11.535 | 54.806 | 33.632 | 0.012 | ||||||
| pg1313_def.cx9a2_ser7 | 0.007 | 12.160 | 55.174 | 32.660 | 0.013 | ||||||
| pg1410_def.cx9a2_ser7 | 0.056 | 11.868 | 54.479 | 33.597 | 0.012 | ||||||
| pg1411_def.cx9a2_ser7 | 0.007 | 12.181 | 51.896 | 35.917 | 0.014 | ||||||
| pg155_def.cx9a2_ser7 | 0.035 | 11.132 | 55.951 | 32.882 | 0.012 | ||||||
| pg156_def.cx9a2_ser7 | 0.049 | 11.257 | 54.806 | 33.889 | 0.011 | ||||||
| pg161_def.cx9a2_ser7 | 0.028 | 11.785 | 55.889 | 32.299 | 0.012 | ||||||
| pg162_def.cx9a2_ser7 | 0.007 | 11.799 | 55.674 | 32.521 | 0.009 |
Performance metrics for the DBMS listed above. Some are normalized by throughput, others are not. Legend for results is here.
ips	qps	rps	rmbps	wps	wmbps	rpq	rkbpq	wpi	wkbpi	csps	cpups	cspq	cpupq	dbgb1	dbgb2	rss	maxop	p50	p99	tag
100	514	6497	50.9	208.7	3.0	12.642	101.452	2.091	30.951	15641	2.2	30.437	342	154.7	176.2	22.5	0.025	512	368	pg1217_def.cx9a2_ser7
100	508	6432	50.4	208.5	3.0	12.651	101.514	2.089	30.932	15441	2.1	30.372	330	154.5	177.0	21.9	0.043	512	272	pg1313_def.cx9a2_ser7
100	513	6487	50.8	208.6	3.0	12.641	101.441	2.090	30.949	15552	2.0	30.303	312	154.5	176.9	21.8	0.027	512	368	pg1410_def.cx9a2_ser7
100	501	6341	49.7	208.4	3.0	12.657	101.566	2.089	30.941	15232	2.0	30.403	319	154.5	176.8	21.8	0.095	512	176	pg1411_def.cx9a2_ser7
100	513	6488	50.8	208.6	3.0	12.643	101.454	2.091	30.951	15458	2.1	30.121	327	154.5	177.1	22.0	0.070	512	368	pg155_def.cx9a2_ser7
100	515	6510	51.0	208.7	3.0	12.643	101.453	2.092	30.954	15510	2.0	30.123	311	154.5	176.9	22.0	0.087	527	368	pg156_def.cx9a2_ser7
100	496	6283	49.2	208.4	3.0	12.668	101.673	2.088	30.931	15256	2.1	30.757	339	154.5	177.0	21.7	0.078	511	192	pg161_def.cx9a2_ser7
100	506	6403	50.2	208.4	3.0	12.652	101.537	2.088	30.931	15539	2.1	30.704	332	154.5	177.0	21.8	0.017	511	368	pg162_def.cx9a2_ser7
qr500.L3
qr500.L3: range queries with 500 insert/s per client. Graphs for performance per 1-second interval are here.
Average throughput:
Query response time histogram: each cell has the percentage of responses that take <= the time in the header and max is the max response time in seconds. For max values in the top 25% of the range have a red background and in the bottom 25% of the range have a green background. The red background is not used when the min value is within 80% of the max value.
| dbms | 256us | 1ms | 4ms | 16ms | 64ms | 256ms | 1s | 4s | 16s | gt | max |
|---|---|---|---|---|---|---|---|---|---|---|---|
| pg1217_def.cx9a2_ser7 | 99.965 | 0.035 | nonzero | nonzero | 0.013 | ||||||
| pg1313_def.cx9a2_ser7 | 99.964 | 0.036 | nonzero | nonzero | nonzero | 0.018 | |||||
| pg1410_def.cx9a2_ser7 | 99.965 | 0.035 | nonzero | nonzero | 0.012 | ||||||
| pg1411_def.cx9a2_ser7 | 99.968 | 0.031 | nonzero | nonzero | nonzero | 0.039 | |||||
| pg155_def.cx9a2_ser7 | 99.962 | 0.037 | nonzero | nonzero | nonzero | 0.034 | |||||
| pg156_def.cx9a2_ser7 | 99.966 | 0.034 | nonzero | nonzero | nonzero | 0.021 | |||||
| pg161_def.cx9a2_ser7 | 99.965 | 0.035 | nonzero | nonzero | 0.014 | ||||||
| pg162_def.cx9a2_ser7 | 99.967 | 0.033 | nonzero | nonzero | 0.012 |
Insert response time histogram: each cell has the percentage of responses that take <= the time in the header and max is the max response time in seconds. For max values in the top 25% of the range have a red background and in the bottom 25% of the range have a green background. The red background is not used when the min value is within 80% of the max value.
| dbms | 256us | 1ms | 4ms | 16ms | 64ms | 256ms | 1s | 4s | 16s | gt | max |
|---|---|---|---|---|---|---|---|---|---|---|---|
| pg1217_def.cx9a2_ser7 | 91.094 | 8.904 | 0.001 | 0.079 | |||||||
| pg1313_def.cx9a2_ser7 | 88.074 | 10.938 | 0.989 | 0.184 | |||||||
| pg1410_def.cx9a2_ser7 | 92.369 | 7.628 | 0.003 | 0.069 | |||||||
| pg1411_def.cx9a2_ser7 | 93.207 | 5.085 | 1.708 | 0.171 | |||||||
| pg155_def.cx9a2_ser7 | 90.207 | 9.792 | 0.001 | 0.082 | |||||||
| pg156_def.cx9a2_ser7 | 91.561 | 8.436 | 0.003 | 0.081 | |||||||
| pg161_def.cx9a2_ser7 | 83.172 | 13.917 | 2.911 | 0.168 | |||||||
| pg162_def.cx9a2_ser7 | 91.507 | 8.493 | 0.063 |
Delete response time histogram: each cell has the percentage of responses that take <= the time in the header and max is the max response time in seconds. For max values in the top 25% of the range have a red background and in the bottom 25% of the range have a green background. The red background is not used when the min value is within 80% of the max value.
| dbms | 256us | 1ms | 4ms | 16ms | 64ms | 256ms | 1s | 4s | 16s | gt | max |
|---|---|---|---|---|---|---|---|---|---|---|---|
| pg1217_def.cx9a2_ser7 | 0.031 | 3.424 | 12.271 | 57.139 | 27.136 | 0.028 | |||||
| pg1313_def.cx9a2_ser7 | 0.147 | 3.056 | 13.356 | 56.701 | 26.740 | 0.036 | |||||
| pg1410_def.cx9a2_ser7 | 0.129 | 3.083 | 12.726 | 56.635 | 27.426 | 0.034 | |||||
| pg1411_def.cx9a2_ser7 | 0.035 | 3.300 | 12.771 | 56.290 | 27.604 | 0.038 | |||||
| pg155_def.cx9a2_ser7 | 0.067 | 2.800 | 13.436 | 53.561 | 30.136 | 0.057 | |||||
| pg156_def.cx9a2_ser7 | 0.099 | 3.194 | 12.193 | 55.412 | 29.101 | 0.054 | |||||
| pg161_def.cx9a2_ser7 | 0.106 | 2.633 | 13.364 | 50.793 | 33.100 | 0.004 | 0.115 | ||||
| pg162_def.cx9a2_ser7 | 0.067 | 3.206 | 13.171 | 51.567 | 31.990 | 0.030 |
Performance metrics for the DBMS listed above. Some are normalized by throughput, others are not. Legend for results is here.
ips	qps	rps	rmbps	wps	wmbps	rpq	rkbpq	wpi	wkbpi	csps	cpups	cspq	cpupq	dbgb1	dbgb2	rss	maxop	p50	p99	tag
499	19714	649	5.2	602.3	11.8	0.033	0.272	1.206	24.240	77454	6.2	3.929	25	154.8	176.4	20.1	0.013	18676	12787	pg1217_def.cx9a2_ser7
499	19714	648	5.2	601.6	11.7	0.033	0.272	1.205	24.052	77437	6.3	3.928	26	154.6	176.3	20.0	0.018	18667	12815	pg1313_def.cx9a2_ser7
499	19315	648	5.2	602.8	11.8	0.034	0.277	1.207	24.149	75827	6.0	3.926	25	154.6	176.3	19.5	0.012	18584	12915	pg1410_def.cx9a2_ser7
499	19291	648	5.2	612.0	11.9	0.034	0.278	1.226	24.485	75753	6.0	3.927	25	154.6	176.3	19.9	0.039	18713	12849	pg1411_def.cx9a2_ser7
499	19283	648	5.2	602.4	11.8	0.034	0.278	1.206	24.099	75708	6.0	3.926	25	154.6	176.3	19.7	0.034	18380	12691	pg155_def.cx9a2_ser7
499	19221	648	5.2	601.6	11.8	0.034	0.279	1.205	24.105	75450	6.1	3.925	25	154.6	176.3	20.1	0.021	18328	12660	pg156_def.cx9a2_ser7
499	19134	648	5.2	602.3	11.8	0.034	0.281	1.206	24.108	75139	6.1	3.927	26	154.6	176.3	19.2	0.014	18553	12777	pg161_def.cx9a2_ser7
499	19660	648	5.2	601.8	11.7	0.033	0.273	1.205	24.081	77125	6.1	3.923	25	154.6	176.3	19.1	0.012	18891	12898	pg162_def.cx9a2_ser7
qp500.L4
qp500.L4: point queries with 500 insert/s per client. Graphs for performance per 1-second interval are here.
Average throughput:
Query response time histogram: each cell has the percentage of responses that take <= the time in the header and max is the max response time in seconds. For max values in the top 25% of the range have a red background and in the bottom 25% of the range have a green background. The red background is not used when the min value is within 80% of the max value.
| dbms | 256us | 1ms | 4ms | 16ms | 64ms | 256ms | 1s | 4s | 16s | gt | max |
|---|---|---|---|---|---|---|---|---|---|---|---|
| pg1217_def.cx9a2_ser7 | 0.181 | 99.119 | 0.698 | 0.002 | 0.036 | ||||||
| pg1313_def.cx9a2_ser7 | 0.174 | 98.640 | 1.159 | 0.028 | nonzero | nonzero | 0.880 | ||||
| pg1410_def.cx9a2_ser7 | 0.183 | 99.140 | 0.676 | 0.002 | 0.039 | ||||||
| pg1411_def.cx9a2_ser7 | 0.182 | 99.014 | 0.767 | 0.037 | nonzero | nonzero | 0.411 | ||||
| pg155_def.cx9a2_ser7 | 0.169 | 99.154 | 0.675 | 0.002 | 0.037 | ||||||
| pg156_def.cx9a2_ser7 | 0.180 | 99.110 | 0.708 | 0.002 | 0.041 | ||||||
| pg161_def.cx9a2_ser7 | 0.152 | 98.859 | 0.967 | 0.022 | 0.045 | ||||||
| pg162_def.cx9a2_ser7 | 0.157 | 98.882 | 0.936 | 0.024 | nonzero | 0.078 |
Insert response time histogram: each cell has the percentage of responses that take <= the time in the header and max is the max response time in seconds. For max values in the top 25% of the range have a red background and in the bottom 25% of the range have a green background. The red background is not used when the min value is within 80% of the max value.
| dbms | 256us | 1ms | 4ms | 16ms | 64ms | 256ms | 1s | 4s | 16s | gt | max |
|---|---|---|---|---|---|---|---|---|---|---|---|
| pg1217_def.cx9a2_ser7 | 84.933 | 15.067 | 0.064 | ||||||||
| pg1313_def.cx9a2_ser7 | 82.450 | 17.304 | 0.246 | 0.193 | |||||||
| pg1410_def.cx9a2_ser7 | 86.792 | 13.208 | 0.059 | ||||||||
| pg1411_def.cx9a2_ser7 | 91.518 | 8.178 | 0.303 | 0.001 | 0.283 | ||||||
| pg155_def.cx9a2_ser7 | 85.017 | 14.982 | 0.001 | 0.073 | |||||||
| pg156_def.cx9a2_ser7 | 83.862 | 16.137 | 0.055 | ||||||||
| pg161_def.cx9a2_ser7 | 83.408 | 16.403 | 0.189 | 0.115 | |||||||
| pg162_def.cx9a2_ser7 | 84.247 | 15.528 | 0.225 | 0.113 |
Delete response time histogram: each cell has the percentage of responses that take <= the time in the header and max is the max response time in seconds. For max values in the top 25% of the range have a red background and in the bottom 25% of the range have a green background. The red background is not used when the min value is within 80% of the max value.
| dbms | 256us | 1ms | 4ms | 16ms | 64ms | 256ms | 1s | 4s | 16s | gt | max |
|---|---|---|---|---|---|---|---|---|---|---|---|
| pg1217_def.cx9a2_ser7 | 0.007 | 3.314 | 13.831 | 57.532 | 25.317 | 0.028 | |||||
| pg1313_def.cx9a2_ser7 | 0.029 | 3.299 | 13.779 | 58.150 | 24.743 | 0.033 | |||||
| pg1410_def.cx9a2_ser7 | 0.124 | 3.374 | 13.510 | 57.251 | 25.742 | 0.039 | |||||
| pg1411_def.cx9a2_ser7 | 0.071 | 2.842 | 14.081 | 57.094 | 25.912 | 0.031 | |||||
| pg155_def.cx9a2_ser7 | 0.065 | 3.506 | 14.312 | 53.742 | 28.375 | 0.029 | |||||
| pg156_def.cx9a2_ser7 | 0.132 | 3.658 | 13.981 | 54.485 | 27.744 | 0.030 | |||||
| pg161_def.cx9a2_ser7 | 0.036 | 2.842 | 14.681 | 51.083 | 31.358 | 0.029 | |||||
| pg162_def.cx9a2_ser7 | 0.237 | 2.874 | 14.793 | 51.103 | 30.993 | 0.030 |
Performance metrics for the DBMS listed above. Some are normalized by throughput, others are not. Legend for results is here.
ips	qps	rps	rmbps	wps	wmbps	rpq	rkbpq	wpi	wkbpi	csps	cpups	cspq	cpupq	dbgb1	dbgb2	rss	maxop	p50	p99	tag
499	470	7020	55.0	994.1	14.1	14.921	119.751	1.991	29.010	17083	3.2	36.309	544	155.0	185.0	22.1	0.036	479	368	pg1217_def.cx9a2_ser7
499	462	6923	54.3	993.5	14.1	14.968	120.125	1.989	28.973	16836	3.1	36.402	536	154.8	184.8	22.1	0.880	479	176	pg1313_def.cx9a2_ser7
499	471	7027	55.1	994.5	14.2	14.913	119.684	1.991	29.032	17001	3.1	36.080	526	154.8	185.2	22.2	0.039	479	368	pg1410_def.cx9a2_ser7
499	467	6975	54.7	992.2	14.2	14.939	119.900	1.987	29.016	16915	3.1	36.228	531	154.8	186.3	22.8	0.411	479	160	pg1411_def.cx9a2_ser7
499	470	7014	55.0	994.3	14.2	14.921	119.746	1.991	29.027	16908	3.1	35.968	528	154.8	185.1	22.2	0.037	479	368	pg155_def.cx9a2_ser7
499	471	7030	55.1	994.8	14.2	14.914	119.701	1.992	29.031	16948	3.1	35.952	526	154.8	185.0	22.1	0.041	479	368	pg156_def.cx9a2_ser7
499	458	6869	53.8	992.8	14.1	14.994	120.349	1.988	28.990	16837	3.2	36.754	559	154.8	185.1	21.8	0.045	463	176	pg161_def.cx9a2_ser7
499	460	6890	54.0	992.9	14.1	14.984	120.270	1.988	29.004	16868	3.2	36.686	557	154.8	185.0	21.8	0.078	463	192	pg162_def.cx9a2_ser7
qr1000.L5
qr1000.L5: range queries with 1000 insert/s per client. Graphs for performance per 1-second interval are here.
Average throughput:
Query response time histogram: each cell has the percentage of responses that take <= the time in the header and max is the max response time in seconds. For max values in the top 25% of the range have a red background and in the bottom 25% of the range have a green background. The red background is not used when the min value is within 80% of the max value.
| dbms | 256us | 1ms | 4ms | 16ms | 64ms | 256ms | 1s | 4s | 16s | gt | max |
|---|---|---|---|---|---|---|---|---|---|---|---|
| pg1217_def.cx9a2_ser7 | 99.920 | 0.079 | nonzero | 0.001 | nonzero | 0.016 | |||||
| pg1313_def.cx9a2_ser7 | 99.920 | 0.079 | nonzero | 0.001 | nonzero | 0.023 | |||||
| pg1410_def.cx9a2_ser7 | 99.925 | 0.074 | nonzero | 0.001 | nonzero | 0.091 | |||||
| pg1411_def.cx9a2_ser7 | 99.925 | 0.074 | 0.001 | 0.001 | 0.016 | ||||||
| pg155_def.cx9a2_ser7 | 99.922 | 0.077 | nonzero | 0.001 | 0.016 | ||||||
| pg156_def.cx9a2_ser7 | 99.928 | 0.071 | nonzero | 0.001 | nonzero | 0.021 | |||||
| pg161_def.cx9a2_ser7 | 99.926 | 0.073 | 0.001 | 0.001 | nonzero | 0.017 | |||||
| pg162_def.cx9a2_ser7 | 99.927 | 0.072 | nonzero | 0.001 | nonzero | 0.020 |
Insert response time histogram: each cell has the percentage of responses that take <= the time in the header and max is the max response time in seconds. For max values in the top 25% of the range have a red background and in the bottom 25% of the range have a green background. The red background is not used when the min value is within 80% of the max value.
| dbms | 256us | 1ms | 4ms | 16ms | 64ms | 256ms | 1s | 4s | 16s | gt | max |
|---|---|---|---|---|---|---|---|---|---|---|---|
| pg1217_def.cx9a2_ser7 | 92.328 | 7.026 | 0.647 | 0.165 | |||||||
| pg1313_def.cx9a2_ser7 | 90.665 | 8.565 | 0.770 | 0.190 | |||||||
| pg1410_def.cx9a2_ser7 | 96.561 | 3.438 | 0.001 | 0.116 | |||||||
| pg1411_def.cx9a2_ser7 | 92.161 | 7.651 | 0.188 | 0.128 | |||||||
| pg155_def.cx9a2_ser7 | 96.688 | 3.310 | 0.001 | 0.088 | |||||||
| pg156_def.cx9a2_ser7 | 96.207 | 3.792 | 0.001 | 0.146 | |||||||
| pg161_def.cx9a2_ser7 | 89.812 | 9.262 | 0.926 | 0.166 | |||||||
| pg162_def.cx9a2_ser7 | 91.700 | 8.040 | 0.260 | 0.138 |
Delete response time histogram: each cell has the percentage of responses that take <= the time in the header and max is the max response time in seconds. For max values in the top 25% of the range have a red background and in the bottom 25% of the range have a green background. The red background is not used when the min value is within 80% of the max value.
| dbms | 256us | 1ms | 4ms | 16ms | 64ms | 256ms | 1s | 4s | 16s | gt | max |
|---|---|---|---|---|---|---|---|---|---|---|---|
| pg1217_def.cx9a2_ser7 | 0.010 | 1.272 | 6.300 | 28.850 | 63.566 | 0.001 | 0.078 | ||||
| pg1313_def.cx9a2_ser7 | 0.015 | 1.229 | 6.693 | 28.803 | 63.260 | 0.056 | |||||
| pg1410_def.cx9a2_ser7 | 0.024 | 1.186 | 6.615 | 28.919 | 63.254 | 0.003 | 0.120 | ||||
| pg1411_def.cx9a2_ser7 | 0.008 | 1.223 | 6.647 | 28.531 | 63.591 | 0.001 | 0.077 | ||||
| pg155_def.cx9a2_ser7 | 0.010 | 1.456 | 6.432 | 26.873 | 65.228 | 0.001 | 0.105 | ||||
| pg156_def.cx9a2_ser7 | 0.013 | 1.323 | 6.727 | 26.930 | 65.008 | 0.055 | |||||
| pg161_def.cx9a2_ser7 | 0.019 | 1.390 | 6.447 | 25.163 | 66.981 | 0.059 | |||||
| pg162_def.cx9a2_ser7 | 0.049 | 1.358 | 6.737 | 26.305 | 65.550 | 0.001 | 0.123 |
Performance metrics for the DBMS listed above. Some are normalized by throughput, others are not. Legend for results is here.
ips	qps	rps	rmbps	wps	wmbps	rpq	rkbpq	wpi	wkbpi	csps	cpups	cspq	cpupq	dbgb1	dbgb2	rss	maxop	p50	p99	tag
996	15549	1182	9.5	1325.8	23.1	0.076	0.624	1.332	23.715	63120	9.4	4.059	48	155.6	194.0	19.6	0.016	13553	10740	pg1217_def.cx9a2_ser7
994	15774	1178	9.4	1322.5	23.1	0.075	0.612	1.331	23.780	63913	9.3	4.052	47	155.4	193.8	19.9	0.023	13793	10628	pg1313_def.cx9a2_ser7
999	15403	1184	9.5	1329.5	23.0	0.077	0.631	1.331	23.612	62391	9.1	4.051	47	155.4	193.8	20.0	0.091	13528	10868	pg1410_def.cx9a2_ser7
998	15265	1184	9.5	1331.9	23.2	0.078	0.636	1.334	23.750	61844	9.2	4.051	48	155.4	193.8	19.9	0.016	13537	10692	pg1411_def.cx9a2_ser7
999	15262	1184	9.5	1328.8	23.0	0.078	0.636	1.330	23.604	61826	9.2	4.051	48	155.4	193.8	19.8	0.016	13361	10181	pg155_def.cx9a2_ser7
999	15119	1185	9.5	1330.1	23.0	0.078	0.642	1.332	23.621	61279	9.2	4.053	49	155.4	193.8	20.0	0.021	13377	10398	pg156_def.cx9a2_ser7
994	15430	1179	9.4	1322.7	23.0	0.076	0.627	1.331	23.720	62545	9.3	4.054	48	155.4	193.8	18.9	0.017	13377	10134	pg161_def.cx9a2_ser7
998	15618	1183	9.5	1327.4	23.0	0.076	0.621	1.330	23.615	63252	9.3	4.050	48	155.4	193.8	18.7	0.020	13489	10276	pg162_def.cx9a2_ser7
qp1000.L6
qp1000.L6: point queries with 1000 insert/s per client. Graphs for performance per 1-second interval are here.
Average throughput:
Query response time histogram: each cell has the percentage of responses that take <= the time in the header and max is the max response time in seconds. For max values in the top 25% of the range have a red background and in the bottom 25% of the range have a green background. The red background is not used when the min value is within 80% of the max value.
| dbms | 256us | 1ms | 4ms | 16ms | 64ms | 256ms | 1s | 4s | 16s | gt | max |
|---|---|---|---|---|---|---|---|---|---|---|---|
| pg1217_def.cx9a2_ser7 | 0.054 | 97.794 | 2.074 | 0.078 | 0.047 | ||||||
| pg1313_def.cx9a2_ser7 | 0.050 | 97.809 | 2.064 | 0.078 | nonzero | 0.171 | |||||
| pg1410_def.cx9a2_ser7 | nonzero | 0.054 | 98.522 | 1.421 | 0.004 | 0.041 | |||||
| pg1411_def.cx9a2_ser7 | 0.052 | 98.242 | 1.664 | 0.042 | nonzero | 0.231 | |||||
| pg155_def.cx9a2_ser7 | 0.050 | 98.506 | 1.440 | 0.003 | 0.055 | ||||||
| pg156_def.cx9a2_ser7 | 0.051 | 98.508 | 1.437 | 0.003 | 0.043 | ||||||
| pg161_def.cx9a2_ser7 | 0.038 | 98.444 | 1.490 | 0.027 | nonzero | 0.072 | |||||
| pg162_def.cx9a2_ser7 | 0.040 | 97.934 | 1.919 | 0.107 | nonzero | 0.101 |
Insert response time histogram: each cell has the percentage of responses that take <= the time in the header and max is the max response time in seconds. For max values in the top 25% of the range have a red background and in the bottom 25% of the range have a green background. The red background is not used when the min value is within 80% of the max value.
| dbms | 256us | 1ms | 4ms | 16ms | 64ms | 256ms | 1s | 4s | 16s | gt | max |
|---|---|---|---|---|---|---|---|---|---|---|---|
| pg1217_def.cx9a2_ser7 | 87.307 | 12.342 | 0.351 | 0.143 | |||||||
| pg1313_def.cx9a2_ser7 | 88.092 | 11.612 | 0.297 | 0.143 | |||||||
| pg1410_def.cx9a2_ser7 | 90.306 | 9.694 | 0.064 | ||||||||
| pg1411_def.cx9a2_ser7 | 89.606 | 10.142 | 0.251 | 0.001 | 0.257 | ||||||
| pg155_def.cx9a2_ser7 | 89.955 | 10.045 | 0.057 | ||||||||
| pg156_def.cx9a2_ser7 | 90.402 | 9.598 | 0.060 | ||||||||
| pg161_def.cx9a2_ser7 | 92.133 | 7.762 | 0.105 | 0.113 | |||||||
| pg162_def.cx9a2_ser7 | 89.660 | 9.683 | 0.657 | 0.001 | 0.797 |
Delete response time histogram: each cell has the percentage of responses that take <= the time in the header and max is the max response time in seconds. For max values in the top 25% of the range have a red background and in the bottom 25% of the range have a green background. The red background is not used when the min value is within 80% of the max value.
| dbms | 256us | 1ms | 4ms | 16ms | 64ms | 256ms | 1s | 4s | 16s | gt | max |
|---|---|---|---|---|---|---|---|---|---|---|---|
| pg1217_def.cx9a2_ser7 | 0.031 | 1.706 | 5.844 | 30.303 | 62.117 | 0.055 | |||||
| pg1313_def.cx9a2_ser7 | 0.006 | 1.219 | 6.800 | 29.431 | 62.544 | 0.054 | |||||
| pg1410_def.cx9a2_ser7 | 0.033 | 1.288 | 6.458 | 30.112 | 62.109 | 0.052 | |||||
| pg1411_def.cx9a2_ser7 | 0.023 | 1.481 | 6.417 | 29.917 | 62.163 | 0.055 | |||||
| pg155_def.cx9a2_ser7 | 0.529 | 4.687 | 6.326 | 27.953 | 60.504 | 0.052 | |||||
| pg156_def.cx9a2_ser7 | 0.014 | 1.362 | 6.671 | 28.040 | 63.913 | 0.055 | |||||
| pg161_def.cx9a2_ser7 | 0.324 | 3.192 | 7.121 | 26.235 | 63.128 | 0.056 | |||||
| pg162_def.cx9a2_ser7 | 0.031 | 1.415 | 6.699 | 26.408 | 65.447 | 0.059 |
Performance metrics for the DBMS listed above. Some are normalized by throughput, others are not. Legend for results is here.
ips	qps	rps	rmbps	wps	wmbps	rpq	rkbpq	wpi	wkbpi	csps	cpups	cspq	cpupq	dbgb1	dbgb2	rss	maxop	p50	p99	tag
999	421	7548	59.2	1929.0	26.3	17.942	144.165	1.932	26.991	18565	5.7	44.129	1084	156.0	196.0	22.9	0.047	432	128	pg1217_def.cx9a2_ser7
999	420	7534	59.1	1929.7	26.3	17.955	144.267	1.932	26.984	18509	5.7	44.110	1087	155.9	195.9	22.9	0.171	432	128	pg1313_def.cx9a2_ser7
999	431	7683	60.3	1931.9	26.4	17.813	143.132	1.934	27.100	18781	5.5	43.545	1020	155.9	195.5	11.6	0.041	432	352	pg1410_def.cx9a2_ser7
998	427	7619	59.8	1929.2	26.4	17.855	143.464	1.934	27.101	18624	5.5	43.648	1031	155.9	195.9	11.3	0.231	432	176	pg1411_def.cx9a2_ser7
999	429	7656	60.1	1932.8	26.4	17.842	143.364	1.934	27.098	18658	5.4	43.481	1007	155.9	195.5	11.4	0.055	432	352	pg155_def.cx9a2_ser7
999	430	7658	60.1	1931.3	26.4	17.830	143.265	1.933	27.090	18661	5.6	43.449	1043	155.9	195.5	11.3	0.043	432	352	pg156_def.cx9a2_ser7
999	418	7518	59.0	1929.7	26.4	17.969	144.397	1.932	27.083	18656	5.6	44.588	1071	155.9	195.8	8.7	0.072	416	320	pg161_def.cx9a2_ser7
997	412	7431	58.3	1922.9	26.4	18.044	145.009	1.928	27.065	18439	5.7	44.776	1107	155.9	195.6	2.7	0.101	416	112	pg162_def.cx9a2_ser7
l.i0
l.i0: load without secondary indexes
Performance metrics for all DBMS, not just the ones listed above. Some are normalized by throughput, others are not. Legend for results is here.
ips	qps	rps	rmbps	wps	wmbps	rpq	rkbpq	wpi	wkbpi	csps	cpups	cspq	cpupq	dbgb1	dbgb2	rss	maxop	p50	p99	tag
201056	0	38	0.3	348.6	82.3	0.000	0.002	0.002	0.419	23718	11.7	0.118	5	76.5	116.6	0.2	0.235	199820	190487	pg1217_def.cx9a2_ser7
204186	0	39	0.3	288.0	83.9	0.000	0.002	0.001	0.421	24252	11.8	0.119	5	76.5	116.6	18.5	0.106	203475	192886	pg1313_def.cx9a2_ser7
199700	0	36	0.3	283.4	82.0	0.000	0.001	0.001	0.421	23946	11.4	0.120	5	76.5	116.6	18.8	0.100	198073	185392	pg1410_def.cx9a2_ser7
199651	0	37	0.3	284.1	81.8	0.000	0.002	0.001	0.420	23998	11.6	0.120	5	76.5	116.6	3.3	0.096	198298	187884	pg1411_def.cx9a2_ser7
203926	0	39	0.3	287.6	83.9	0.000	0.002	0.001	0.421	24394	11.4	0.120	4	76.5	116.6	3.2	0.152	202849	190199	pg155_def.cx9a2_ser7
206772	0	36	0.3	295.2	84.8	0.000	0.001	0.001	0.420	24719	11.4	0.120	4	76.5	116.6	5.7	0.086	206476	195181	pg156_def.cx9a2_ser7
205128	0	34	0.3	288.8	84.2	0.000	0.001	0.001	0.420	24168	11.5	0.118	4	76.5	116.6	0.4	0.128	203978	193681	pg161_def.cx9a2_ser7
201969	0	34	0.3	286.7	83.0	0.000	0.001	0.001	0.421	24055	11.5	0.119	5	76.5	116.6	18.7	0.149	200580	190595	pg162_def.cx9a2_ser7
l.x
l.x: create secondary indexes
Performance metrics for all DBMS, not just the ones listed above. Some are normalized by throughput, others are not. Legend for results is here.
ips	qps	rps	rmbps	wps	wmbps	rpq	rkbpq	wpi	wkbpi	csps	cpups	cspq	cpupq	dbgb1	dbgb2	rss	maxop	p50	p99	tag
373134	0	1107	126.2	801.9	190.1	0.003	0.346	0.002	0.522	1272	7.1	0.003	2	153.8	193.8	23.2	0.005	NA	NA	pg1217_def.cx9a2_ser7
394089	0	1123	129.6	385.0	147.3	0.003	0.337	0.001	0.383	1251	7.0	0.003	1	153.6	193.7	21.2	0.007	NA	NA	pg1313_def.cx9a2_ser7
398208	0	1127	131.0	383.5	147.7	0.003	0.337	0.001	0.380	1245	6.9	0.003	1	153.6	193.7	20.5	0.006	NA	NA	pg1410_def.cx9a2_ser7
395062	0	1113	129.9	382.8	147.1	0.003	0.337	0.001	0.381	1201	6.8	0.003	1	153.6	193.7	20.7	0.004	NA	NA	pg1411_def.cx9a2_ser7
418410	0	1495	141.2	411.6	157.9	0.004	0.346	0.001	0.387	1509	6.5	0.004	1	153.6	193.7	22.6	0.003	NA	NA	pg155_def.cx9a2_ser7
422610	0	1510	142.6	411.9	158.4	0.004	0.345	0.001	0.384	1477	6.4	0.003	1	153.6	193.7	22.9	0.006	NA	NA	pg156_def.cx9a2_ser7
427350	0	1512	144.1	420.9	160.9	0.004	0.345	0.001	0.386	1548	6.5	0.004	1	153.6	193.7	22.4	0.005	NA	NA	pg161_def.cx9a2_ser7
426894	0	1506	143.9	418.0	160.3	0.004	0.345	0.001	0.384	1530	6.5	0.004	1	153.6	193.7	23.0	0.005	NA	NA	pg162_def.cx9a2_ser7
l.i1
l.i1: continue load after secondary indexes created with 50 inserts per transaction
Performance metrics for all DBMS, not just the ones listed above. Some are normalized by throughput, others are not. Legend for results is here.
ips	qps	rps	rmbps	wps	wmbps	rpq	rkbpq	wpi	wkbpi	csps	cpups	cspq	cpupq	dbgb1	dbgb2	rss	maxop	p50	p99	tag
3320	0	4229	33.5	3629.8	70.1	1.274	10.329	1.093	21.622	11788	7.7	3.551	186	154.4	194.5	19.7	0.118	3399	2097	pg1217_def.cx9a2_ser7
3239	0	4668	37.2	3617.8	65.5	1.441	11.767	1.117	20.698	12034	7.4	3.716	183	154.3	194.3	20.7	0.139	3296	950	pg1313_def.cx9a2_ser7
3295	0	4746	37.9	3708.6	67.2	1.441	11.769	1.126	20.893	12132	7.3	3.682	177	154.3	194.3	15.6	0.116	3346	1498	pg1410_def.cx9a2_ser7
3387	0	4872	38.8	3800.5	69.2	1.439	11.736	1.122	20.917	12476	7.6	3.684	180	154.3	194.3	20.6	0.249	3246	1149	pg1411_def.cx9a2_ser7
3425	0	4926	39.3	3791.0	68.8	1.438	11.736	1.107	20.567	12502	8.0	3.651	187	154.3	194.3	20.5	0.177	3195	2047	pg155_def.cx9a2_ser7
3190	0	4594	36.6	3603.8	65.3	1.440	11.750	1.130	20.978	11639	7.4	3.649	186	154.3	194.3	20.0	0.232	3196	1798	pg156_def.cx9a2_ser7
3096	0	4470	35.6	3471.6	62.8	1.444	11.774	1.121	20.774	11367	7.4	3.672	191	154.3	194.3	20.0	0.157	3047	1498	pg161_def.cx9a2_ser7
3098	0	4477	35.6	3469.3	62.8	1.445	11.782	1.120	20.762	11360	7.5	3.666	194	154.3	194.3	20.3	0.160	3096	1548	pg162_def.cx9a2_ser7
l.i2
l.i2: continue load after secondary indexes created with 5 inserts per transaction
Performance metrics for all DBMS, not just the ones listed above. Some are normalized by throughput, others are not. Legend for results is here.
ips	qps	rps	rmbps	wps	wmbps	rpq	rkbpq	wpi	wkbpi	csps	cpups	cspq	cpupq	dbgb1	dbgb2	rss	maxop	p50	p99	tag
196	0	211	1.7	453.4	6.5	1.075	8.744	2.310	34.144	1817	6.3	9.254	2568	154.6	193.2	19.7	0.118	195	175	pg1217_def.cx9a2_ser7
201	0	215	1.7	553.7	7.9	1.073	8.750	2.759	40.300	1943	6.5	9.679	2591	154.4	194.5	22.2	0.097	200	180	pg1313_def.cx9a2_ser7
201	0	216	1.7	557.7	7.8	1.073	8.746	2.769	39.494	1745	6.1	8.663	2423	154.4	194.5	22.2	0.080	200	180	pg1410_def.cx9a2_ser7
202	0	216	1.7	555.9	7.8	1.072	8.731	2.758	39.368	1741	6.0	8.635	2381	154.4	194.5	14.6	0.070	200	180	pg1411_def.cx9a2_ser7
185	0	199	1.6	515.8	7.4	1.073	8.756	2.787	41.017	1585	6.0	8.565	2593	154.4	194.5	22.3	0.088	185	165	pg155_def.cx9a2_ser7
186	0	200	1.6	517.4	7.3	1.073	8.742	2.776	40.274	1583	5.9	8.493	2532	154.4	194.5	14.5	0.124	185	165	pg156_def.cx9a2_ser7
172	0	185	1.5	484.7	6.9	1.072	8.755	2.813	41.230	1494	5.9	8.670	2739	154.4	194.5	22.0	0.113	170	155	pg161_def.cx9a2_ser7
172	0	184	1.5	483.4	6.9	1.073	8.757	2.816	41.212	1487	5.9	8.661	2749	154.4	194.5	21.9	0.106	170	155	pg162_def.cx9a2_ser7
qr100.L1
qr100.L1: range queries with 100 insert/s per client
Performance metrics for all DBMS, not just the ones listed above. Some are normalized by throughput, others are not. Legend for results is here.
ips	qps	rps	rmbps	wps	wmbps	rpq	rkbpq	wpi	wkbpi	csps	cpups	cspq	cpupq	dbgb1	dbgb2	rss	maxop	p50	p99	tag
100	25322	110	0.9	146.3	2.6	0.004	0.036	1.466	26.751	97275	4.8	3.841	15	154.7	187.2	23.1	0.011	25731	19668	pg1217_def.cx9a2_ser7
100	25660	109	0.9	146.2	2.6	0.004	0.035	1.465	26.789	98571	4.9	3.841	15	154.5	187.9	23.1	0.014	26261	19690	pg1313_def.cx9a2_ser7
100	25299	109	0.9	147.1	2.6	0.004	0.036	1.474	26.866	97087	4.7	3.838	15	154.5	187.6	22.7	0.011	25636	19420	pg1410_def.cx9a2_ser7
100	25054	109	0.9	147.8	2.6	0.004	0.036	1.481	26.923	96181	4.7	3.839	15	154.5	187.5	22.6	0.013	25484	19051	pg1411_def.cx9a2_ser7
100	25477	109	0.9	147.0	2.6	0.004	0.035	1.473	26.847	97745	4.6	3.837	14	154.5	188.0	23.1	0.010	25907	19179	pg155_def.cx9a2_ser7
100	25256	109	0.9	147.1	2.6	0.004	0.035	1.474	26.846	96905	4.7	3.837	15	154.5	187.7	23.1	0.012	25687	19468	pg156_def.cx9a2_ser7
100	25677	109	0.9	147.1	2.6	0.004	0.035	1.474	26.870	98492	4.7	3.836	15	154.5	187.9	23.0	0.010	25971	19802	pg161_def.cx9a2_ser7
100	25878	109	0.9	146.9	2.6	0.004	0.035	1.472	26.853	99274	4.7	3.836	15	154.5	187.9	23.0	0.010	26081	19943	pg162_def.cx9a2_ser7
qp100.L2
qp100.L2: point queries with 100 insert/s per client
Performance metrics for all DBMS, not just the ones listed above. Some are normalized by throughput, others are not. Legend for results is here.
ips	qps	rps	rmbps	wps	wmbps	rpq	rkbpq	wpi	wkbpi	csps	cpups	cspq	cpupq	dbgb1	dbgb2	rss	maxop	p50	p99	tag
100	514	6497	50.9	208.7	3.0	12.642	101.452	2.091	30.951	15641	2.2	30.437	342	154.7	176.2	22.5	0.025	512	368	pg1217_def.cx9a2_ser7
100	508	6432	50.4	208.5	3.0	12.651	101.514	2.089	30.932	15441	2.1	30.372	330	154.5	177.0	21.9	0.043	512	272	pg1313_def.cx9a2_ser7
100	513	6487	50.8	208.6	3.0	12.641	101.441	2.090	30.949	15552	2.0	30.303	312	154.5	176.9	21.8	0.027	512	368	pg1410_def.cx9a2_ser7
100	501	6341	49.7	208.4	3.0	12.657	101.566	2.089	30.941	15232	2.0	30.403	319	154.5	176.8	21.8	0.095	512	176	pg1411_def.cx9a2_ser7
100	513	6488	50.8	208.6	3.0	12.643	101.454	2.091	30.951	15458	2.1	30.121	327	154.5	177.1	22.0	0.070	512	368	pg155_def.cx9a2_ser7
100	515	6510	51.0	208.7	3.0	12.643	101.453	2.092	30.954	15510	2.0	30.123	311	154.5	176.9	22.0	0.087	527	368	pg156_def.cx9a2_ser7
100	496	6283	49.2	208.4	3.0	12.668	101.673	2.088	30.931	15256	2.1	30.757	339	154.5	177.0	21.7	0.078	511	192	pg161_def.cx9a2_ser7
100	506	6403	50.2	208.4	3.0	12.652	101.537	2.088	30.931	15539	2.1	30.704	332	154.5	177.0	21.8	0.017	511	368	pg162_def.cx9a2_ser7
qr500.L3
qr500.L3: range queries with 500 insert/s per client
Performance metrics for all DBMS, not just the ones listed above. Some are normalized by throughput, others are not. Legend for results is here.
ips	qps	rps	rmbps	wps	wmbps	rpq	rkbpq	wpi	wkbpi	csps	cpups	cspq	cpupq	dbgb1	dbgb2	rss	maxop	p50	p99	tag
499	19714	649	5.2	602.3	11.8	0.033	0.272	1.206	24.240	77454	6.2	3.929	25	154.8	176.4	20.1	0.013	18676	12787	pg1217_def.cx9a2_ser7
499	19714	648	5.2	601.6	11.7	0.033	0.272	1.205	24.052	77437	6.3	3.928	26	154.6	176.3	20.0	0.018	18667	12815	pg1313_def.cx9a2_ser7
499	19315	648	5.2	602.8	11.8	0.034	0.277	1.207	24.149	75827	6.0	3.926	25	154.6	176.3	19.5	0.012	18584	12915	pg1410_def.cx9a2_ser7
499	19291	648	5.2	612.0	11.9	0.034	0.278	1.226	24.485	75753	6.0	3.927	25	154.6	176.3	19.9	0.039	18713	12849	pg1411_def.cx9a2_ser7
499	19283	648	5.2	602.4	11.8	0.034	0.278	1.206	24.099	75708	6.0	3.926	25	154.6	176.3	19.7	0.034	18380	12691	pg155_def.cx9a2_ser7
499	19221	648	5.2	601.6	11.8	0.034	0.279	1.205	24.105	75450	6.1	3.925	25	154.6	176.3	20.1	0.021	18328	12660	pg156_def.cx9a2_ser7
499	19134	648	5.2	602.3	11.8	0.034	0.281	1.206	24.108	75139	6.1	3.927	26	154.6	176.3	19.2	0.014	18553	12777	pg161_def.cx9a2_ser7
499	19660	648	5.2	601.8	11.7	0.033	0.273	1.205	24.081	77125	6.1	3.923	25	154.6	176.3	19.1	0.012	18891	12898	pg162_def.cx9a2_ser7
qp500.L4
qp500.L4: point queries with 500 insert/s per client
Performance metrics for all DBMS, not just the ones listed above. Some are normalized by throughput, others are not. Legend for results is here.
ips	qps	rps	rmbps	wps	wmbps	rpq	rkbpq	wpi	wkbpi	csps	cpups	cspq	cpupq	dbgb1	dbgb2	rss	maxop	p50	p99	tag
499	470	7020	55.0	994.1	14.1	14.921	119.751	1.991	29.010	17083	3.2	36.309	544	155.0	185.0	22.1	0.036	479	368	pg1217_def.cx9a2_ser7
499	462	6923	54.3	993.5	14.1	14.968	120.125	1.989	28.973	16836	3.1	36.402	536	154.8	184.8	22.1	0.880	479	176	pg1313_def.cx9a2_ser7
499	471	7027	55.1	994.5	14.2	14.913	119.684	1.991	29.032	17001	3.1	36.080	526	154.8	185.2	22.2	0.039	479	368	pg1410_def.cx9a2_ser7
499	467	6975	54.7	992.2	14.2	14.939	119.900	1.987	29.016	16915	3.1	36.228	531	154.8	186.3	22.8	0.411	479	160	pg1411_def.cx9a2_ser7
499	470	7014	55.0	994.3	14.2	14.921	119.746	1.991	29.027	16908	3.1	35.968	528	154.8	185.1	22.2	0.037	479	368	pg155_def.cx9a2_ser7
499	471	7030	55.1	994.8	14.2	14.914	119.701	1.992	29.031	16948	3.1	35.952	526	154.8	185.0	22.1	0.041	479	368	pg156_def.cx9a2_ser7
499	458	6869	53.8	992.8	14.1	14.994	120.349	1.988	28.990	16837	3.2	36.754	559	154.8	185.1	21.8	0.045	463	176	pg161_def.cx9a2_ser7
499	460	6890	54.0	992.9	14.1	14.984	120.270	1.988	29.004	16868	3.2	36.686	557	154.8	185.0	21.8	0.078	463	192	pg162_def.cx9a2_ser7
qr1000.L5
qr1000.L5: range queries with 1000 insert/s per client
Performance metrics for all DBMS, not just the ones listed above. Some are normalized by throughput, others are not. Legend for results is here.
ips	qps	rps	rmbps	wps	wmbps	rpq	rkbpq	wpi	wkbpi	csps	cpups	cspq	cpupq	dbgb1	dbgb2	rss	maxop	p50	p99	tag
996	15549	1182	9.5	1325.8	23.1	0.076	0.624	1.332	23.715	63120	9.4	4.059	48	155.6	194.0	19.6	0.016	13553	10740	pg1217_def.cx9a2_ser7
994	15774	1178	9.4	1322.5	23.1	0.075	0.612	1.331	23.780	63913	9.3	4.052	47	155.4	193.8	19.9	0.023	13793	10628	pg1313_def.cx9a2_ser7
999	15403	1184	9.5	1329.5	23.0	0.077	0.631	1.331	23.612	62391	9.1	4.051	47	155.4	193.8	20.0	0.091	13528	10868	pg1410_def.cx9a2_ser7
998	15265	1184	9.5	1331.9	23.2	0.078	0.636	1.334	23.750	61844	9.2	4.051	48	155.4	193.8	19.9	0.016	13537	10692	pg1411_def.cx9a2_ser7
999	15262	1184	9.5	1328.8	23.0	0.078	0.636	1.330	23.604	61826	9.2	4.051	48	155.4	193.8	19.8	0.016	13361	10181	pg155_def.cx9a2_ser7
999	15119	1185	9.5	1330.1	23.0	0.078	0.642	1.332	23.621	61279	9.2	4.053	49	155.4	193.8	20.0	0.021	13377	10398	pg156_def.cx9a2_ser7
994	15430	1179	9.4	1322.7	23.0	0.076	0.627	1.331	23.720	62545	9.3	4.054	48	155.4	193.8	18.9	0.017	13377	10134	pg161_def.cx9a2_ser7
998	15618	1183	9.5	1327.4	23.0	0.076	0.621	1.330	23.615	63252	9.3	4.050	48	155.4	193.8	18.7	0.020	13489	10276	pg162_def.cx9a2_ser7
qp1000.L6
qp1000.L6: point queries with 1000 insert/s per client
Performance metrics for all DBMS, not just the ones listed above. Some are normalized by throughput, others are not. Legend for results is here.
ips	qps	rps	rmbps	wps	wmbps	rpq	rkbpq	wpi	wkbpi	csps	cpups	cspq	cpupq	dbgb1	dbgb2	rss	maxop	p50	p99	tag
999	421	7548	59.2	1929.0	26.3	17.942	144.165	1.932	26.991	18565	5.7	44.129	1084	156.0	196.0	22.9	0.047	432	128	pg1217_def.cx9a2_ser7
999	420	7534	59.1	1929.7	26.3	17.955	144.267	1.932	26.984	18509	5.7	44.110	1087	155.9	195.9	22.9	0.171	432	128	pg1313_def.cx9a2_ser7
999	431	7683	60.3	1931.9	26.4	17.813	143.132	1.934	27.100	18781	5.5	43.545	1020	155.9	195.5	11.6	0.041	432	352	pg1410_def.cx9a2_ser7
998	427	7619	59.8	1929.2	26.4	17.855	143.464	1.934	27.101	18624	5.5	43.648	1031	155.9	195.9	11.3	0.231	432	176	pg1411_def.cx9a2_ser7
999	429	7656	60.1	1932.8	26.4	17.842	143.364	1.934	27.098	18658	5.4	43.481	1007	155.9	195.5	11.4	0.055	432	352	pg155_def.cx9a2_ser7
999	430	7658	60.1	1931.3	26.4	17.830	143.265	1.933	27.090	18661	5.6	43.449	1043	155.9	195.5	11.3	0.043	432	352	pg156_def.cx9a2_ser7
999	418	7518	59.0	1929.7	26.4	17.969	144.397	1.932	27.083	18656	5.6	44.588	1071	155.9	195.8	8.7	0.072	416	320	pg161_def.cx9a2_ser7
997	412	7431	58.3	1922.9	26.4	18.044	145.009	1.928	27.065	18439	5.7	44.776	1107	155.9	195.6	2.7	0.101	416	112	pg162_def.cx9a2_ser7
l.i0
- l.i0: load without secondary indexes
- Legend for results is here.
- Each entry lists the percentage of responses that fit in that bucket (slower than max time for previous bucket, faster than min time for next bucket).
Insert response time histogram
256us	1ms	4ms	16ms	64ms	256ms	1s	4s	16s	gt	max	tag
0.000	99.981	0.018	nonzero	nonzero	nonzero	0.000	0.000	0.000	0.000	0.235	pg1217_def.cx9a2_ser7
0.000	99.949	0.045	0.004	0.002	nonzero	0.000	0.000	0.000	0.000	0.106	pg1313_def.cx9a2_ser7
0.000	99.956	0.040	0.003	0.001	nonzero	0.000	0.000	0.000	0.000	0.100	pg1410_def.cx9a2_ser7
0.000	99.953	0.043	0.002	0.001	nonzero	0.000	0.000	0.000	0.000	0.096	pg1411_def.cx9a2_ser7
0.000	99.954	0.041	0.004	0.002	nonzero	0.000	0.000	0.000	0.000	0.152	pg155_def.cx9a2_ser7
0.000	99.952	0.045	0.002	0.001	nonzero	0.000	0.000	0.000	0.000	0.086	pg156_def.cx9a2_ser7
0.000	99.948	0.047	0.003	0.002	nonzero	0.000	0.000	0.000	0.000	0.128	pg161_def.cx9a2_ser7
0.000	99.951	0.044	0.003	0.002	nonzero	0.000	0.000	0.000	0.000	0.149	pg162_def.cx9a2_ser7
l.x
- l.x: create secondary indexes
- Legend for results is here.
- Each entry lists the percentage of responses that fit in that bucket (slower than max time for previous bucket, faster than min time for next bucket).
TODO - determine whether there is data for create index response time
l.i1
- l.i1: continue load after secondary indexes created with 50 inserts per transaction
- Legend for results is here.
- Each entry lists the percentage of responses that fit in that bucket (slower than max time for previous bucket, faster than min time for next bucket).
Insert response time histogram
256us	1ms	4ms	16ms	64ms	256ms	1s	4s	16s	gt	max	tag
0.000	0.000	0.000	97.308	2.684	0.009	0.000	0.000	0.000	0.000	0.118	pg1217_def.cx9a2_ser7
0.000	0.000	0.000	88.331	11.539	0.130	0.000	0.000	0.000	0.000	0.139	pg1313_def.cx9a2_ser7
0.000	0.000	0.000	91.196	8.775	0.029	0.000	0.000	0.000	0.000	0.116	pg1410_def.cx9a2_ser7
0.000	0.000	0.000	94.911	5.060	0.029	0.000	0.000	0.000	0.000	0.249	pg1411_def.cx9a2_ser7
0.000	0.000	0.000	97.414	2.579	0.007	0.000	0.000	0.000	0.000	0.177	pg155_def.cx9a2_ser7
0.000	0.000	0.000	94.328	5.647	0.025	0.000	0.000	0.000	0.000	0.232	pg156_def.cx9a2_ser7
0.000	0.000	0.000	94.647	5.334	0.019	0.000	0.000	0.000	0.000	0.157	pg161_def.cx9a2_ser7
0.000	0.000	0.000	94.138	5.849	0.014	0.000	0.000	0.000	0.000	0.160	pg162_def.cx9a2_ser7
Delete response time histogram
256us	1ms	4ms	16ms	64ms	256ms	1s	4s	16s	gt	max	tag
0.004	1.620	11.223	56.785	30.366	0.003	0.000	0.000	0.000	0.000	0.101	pg1217_def.cx9a2_ser7
0.003	1.149	10.466	58.605	29.777	0.000	0.000	0.000	0.000	0.000	0.027	pg1313_def.cx9a2_ser7
0.004	1.188	10.350	59.231	29.227	0.000	0.000	0.000	0.000	0.000	0.030	pg1410_def.cx9a2_ser7
0.004	1.468	10.254	57.635	30.640	0.000	0.000	0.000	0.000	0.000	0.029	pg1411_def.cx9a2_ser7
0.004	1.411	9.738	55.456	33.391	0.000	0.000	0.000	0.000	0.000	0.027	pg155_def.cx9a2_ser7
0.005	1.661	11.685	52.179	34.469	0.001	0.000	0.000	0.000	0.000	0.089	pg156_def.cx9a2_ser7
0.004	1.770	9.793	50.836	37.598	0.000	0.000	0.000	0.000	0.000	0.034	pg161_def.cx9a2_ser7
0.005	1.480	11.389	50.578	36.549	0.000	0.000	0.000	0.000	0.000	0.031	pg162_def.cx9a2_ser7
l.i2
- l.i2: continue load after secondary indexes created with 5 inserts per transaction
- Legend for results is here.
- Each entry lists the percentage of responses that fit in that bucket (slower than max time for previous bucket, faster than min time for next bucket).
Insert response time histogram
256us	1ms	4ms	16ms	64ms	256ms	1s	4s	16s	gt	max	tag
0.000	2.015	96.596	1.378	0.009	0.002	0.000	0.000	0.000	0.000	0.118	pg1217_def.cx9a2_ser7
0.000	1.750	96.067	2.169	0.012	0.001	0.000	0.000	0.000	0.000	0.097	pg1313_def.cx9a2_ser7
0.000	1.747	96.003	2.240	0.009	0.001	0.000	0.000	0.000	0.000	0.080	pg1410_def.cx9a2_ser7
0.000	3.728	94.398	1.851	0.022	0.001	0.000	0.000	0.000	0.000	0.070	pg1411_def.cx9a2_ser7
0.000	1.307	96.383	2.300	0.010	0.001	0.000	0.000	0.000	0.000	0.088	pg155_def.cx9a2_ser7
0.000	1.158	96.403	2.429	0.009	0.002	0.000	0.000	0.000	0.000	0.124	pg156_def.cx9a2_ser7
0.000	1.056	95.948	2.985	0.009	0.002	0.000	0.000	0.000	0.000	0.113	pg161_def.cx9a2_ser7
0.000	0.927	95.872	3.187	0.012	0.002	0.000	0.000	0.000	0.000	0.106	pg162_def.cx9a2_ser7
Delete response time histogram
256us	1ms	4ms	16ms	64ms	256ms	1s	4s	16s	gt	max	tag
0.000	0.000	0.000	0.000	99.999	0.001	0.000	0.000	0.000	0.000	0.088	pg1217_def.cx9a2_ser7
0.000	0.000	0.000	0.000	99.999	0.001	0.000	0.000	0.000	0.000	0.092	pg1313_def.cx9a2_ser7
0.000	0.000	0.000	0.000	99.999	0.001	0.000	0.000	0.000	0.000	0.090	pg1410_def.cx9a2_ser7
0.000	0.000	0.000	0.000	99.999	0.001	0.000	0.000	0.000	0.000	0.090	pg1411_def.cx9a2_ser7
0.000	0.000	0.000	0.000	99.999	0.001	0.000	0.000	0.000	0.000	0.091	pg155_def.cx9a2_ser7
0.000	0.000	0.000	0.000	99.999	0.001	0.000	0.000	0.000	0.000	0.091	pg156_def.cx9a2_ser7
0.000	0.000	0.000	0.000	99.999	0.001	0.000	0.000	0.000	0.000	0.114	pg161_def.cx9a2_ser7
0.000	0.000	0.000	0.000	99.999	0.001	0.000	0.000	0.000	0.000	0.090	pg162_def.cx9a2_ser7
qr100.L1
- qr100.L1: range queries with 100 insert/s per client
- Legend for results is here.
- Each entry lists the percentage of responses that fit in that bucket (slower than max time for previous bucket, faster than min time for next bucket).
Query response time histogram
256us	1ms	4ms	16ms	64ms	256ms	1s	4s	16s	gt	max	tag
99.993	0.007	nonzero	nonzero	0.000	0.000	0.000	0.000	0.000	0.000	0.011	pg1217_def.cx9a2_ser7
99.992	0.007	nonzero	nonzero	0.000	0.000	0.000	0.000	0.000	0.000	0.014	pg1313_def.cx9a2_ser7
99.992	0.008	nonzero	nonzero	0.000	0.000	0.000	0.000	0.000	0.000	0.011	pg1410_def.cx9a2_ser7
99.991	0.008	nonzero	nonzero	0.000	0.000	0.000	0.000	0.000	0.000	0.013	pg1411_def.cx9a2_ser7
99.993	0.007	nonzero	nonzero	0.000	0.000	0.000	0.000	0.000	0.000	0.010	pg155_def.cx9a2_ser7
99.992	0.008	nonzero	nonzero	0.000	0.000	0.000	0.000	0.000	0.000	0.012	pg156_def.cx9a2_ser7
99.993	0.007	nonzero	nonzero	0.000	0.000	0.000	0.000	0.000	0.000	0.010	pg161_def.cx9a2_ser7
99.993	0.007	nonzero	nonzero	0.000	0.000	0.000	0.000	0.000	0.000	0.010	pg162_def.cx9a2_ser7
Insert response time histogram
256us	1ms	4ms	16ms	64ms	256ms	1s	4s	16s	gt	max	tag
0.000	0.000	0.000	74.201	25.799	0.000	0.000	0.000	0.000	0.000	0.024	pg1217_def.cx9a2_ser7
0.000	0.000	0.000	73.132	26.715	0.153	0.000	0.000	0.000	0.000	0.098	pg1313_def.cx9a2_ser7
0.000	0.000	0.000	74.840	25.160	0.000	0.000	0.000	0.000	0.000	0.027	pg1410_def.cx9a2_ser7
0.000	0.000	0.000	71.326	28.396	0.278	0.000	0.000	0.000	0.000	0.099	pg1411_def.cx9a2_ser7
0.000	0.000	0.000	74.493	25.507	0.000	0.000	0.000	0.000	0.000	0.025	pg155_def.cx9a2_ser7
0.000	0.000	0.000	74.236	25.764	0.000	0.000	0.000	0.000	0.000	0.028	pg156_def.cx9a2_ser7
0.000	0.000	0.000	73.285	26.681	0.035	0.000	0.000	0.000	0.000	0.079	pg161_def.cx9a2_ser7
0.000	0.000	0.000	74.611	25.389	0.000	0.000	0.000	0.000	0.000	0.025	pg162_def.cx9a2_ser7
Delete response time histogram
256us	1ms	4ms	16ms	64ms	256ms	1s	4s	16s	gt	max	tag
0.139	10.938	57.528	31.396	0.000	0.000	0.000	0.000	0.000	0.000	0.010	pg1217_def.cx9a2_ser7
0.007	10.917	56.542	32.535	0.000	0.000	0.000	0.000	0.000	0.000	0.015	pg1313_def.cx9a2_ser7
0.007	13.257	52.611	34.125	0.000	0.000	0.000	0.000	0.000	0.000	0.010	pg1410_def.cx9a2_ser7
0.069	12.167	53.264	34.486	0.014	0.000	0.000	0.000	0.000	0.000	0.025	pg1411_def.cx9a2_ser7
0.049	12.208	53.993	33.750	0.000	0.000	0.000	0.000	0.000	0.000	0.015	pg155_def.cx9a2_ser7
0.062	11.792	56.347	31.799	0.000	0.000	0.000	0.000	0.000	0.000	0.015	pg156_def.cx9a2_ser7
0.007	12.118	55.785	32.090	0.000	0.000	0.000	0.000	0.000	0.000	0.016	pg161_def.cx9a2_ser7
0.021	12.111	54.639	33.229	0.000	0.000	0.000	0.000	0.000	0.000	0.010	pg162_def.cx9a2_ser7
qp100.L2
- qp100.L2: point queries with 100 insert/s per client
- Legend for results is here.
- Each entry lists the percentage of responses that fit in that bucket (slower than max time for previous bucket, faster than min time for next bucket).
Query response time histogram
256us	1ms	4ms	16ms	64ms	256ms	1s	4s	16s	gt	max	tag
nonzero	0.496	99.457	0.047	nonzero	0.000	0.000	0.000	0.000	0.000	0.025	pg1217_def.cx9a2_ser7
0.000	0.493	99.064	0.437	0.005	0.000	0.000	0.000	0.000	0.000	0.043	pg1313_def.cx9a2_ser7
nonzero	0.495	99.451	0.054	nonzero	0.000	0.000	0.000	0.000	0.000	0.027	pg1410_def.cx9a2_ser7
nonzero	0.483	98.638	0.848	0.030	nonzero	0.000	0.000	0.000	0.000	0.095	pg1411_def.cx9a2_ser7
nonzero	0.473	99.477	0.050	nonzero	nonzero	0.000	0.000	0.000	0.000	0.070	pg155_def.cx9a2_ser7
nonzero	0.493	99.465	0.042	0.000	nonzero	0.000	0.000	0.000	0.000	0.087	pg156_def.cx9a2_ser7
nonzero	0.429	99.007	0.536	0.028	nonzero	0.000	0.000	0.000	0.000	0.078	pg161_def.cx9a2_ser7
nonzero	0.443	99.515	0.043	nonzero	0.000	0.000	0.000	0.000	0.000	0.017	pg162_def.cx9a2_ser7
Insert response time histogram
256us	1ms	4ms	16ms	64ms	256ms	1s	4s	16s	gt	max	tag
0.000	0.000	0.000	81.667	18.333	0.000	0.000	0.000	0.000	0.000	0.038	pg1217_def.cx9a2_ser7
0.000	0.000	0.000	80.458	19.521	0.021	0.000	0.000	0.000	0.000	0.094	pg1313_def.cx9a2_ser7
0.000	0.000	0.000	79.583	20.417	0.000	0.000	0.000	0.000	0.000	0.036	pg1410_def.cx9a2_ser7
0.000	0.000	0.000	92.736	6.799	0.465	0.000	0.000	0.000	0.000	0.182	pg1411_def.cx9a2_ser7
0.000	0.000	0.000	83.590	16.410	0.000	0.000	0.000	0.000	0.000	0.032	pg155_def.cx9a2_ser7
0.000	0.000	0.000	83.069	16.931	0.000	0.000	0.000	0.000	0.000	0.035	pg156_def.cx9a2_ser7
0.000	0.000	0.000	79.278	20.319	0.403	0.000	0.000	0.000	0.000	0.122	pg161_def.cx9a2_ser7
0.000	0.000	0.000	78.500	21.500	0.000	0.000	0.000	0.000	0.000	0.040	pg162_def.cx9a2_ser7
Delete response time histogram
256us	1ms	4ms	16ms	64ms	256ms	1s	4s	16s	gt	max	tag
0.028	11.535	54.806	33.632	0.000	0.000	0.000	0.000	0.000	0.000	0.012	pg1217_def.cx9a2_ser7
0.007	12.160	55.174	32.660	0.000	0.000	0.000	0.000	0.000	0.000	0.013	pg1313_def.cx9a2_ser7
0.056	11.868	54.479	33.597	0.000	0.000	0.000	0.000	0.000	0.000	0.012	pg1410_def.cx9a2_ser7
0.007	12.181	51.896	35.917	0.000	0.000	0.000	0.000	0.000	0.000	0.014	pg1411_def.cx9a2_ser7
0.035	11.132	55.951	32.882	0.000	0.000	0.000	0.000	0.000	0.000	0.012	pg155_def.cx9a2_ser7
0.049	11.257	54.806	33.889	0.000	0.000	0.000	0.000	0.000	0.000	0.011	pg156_def.cx9a2_ser7
0.028	11.785	55.889	32.299	0.000	0.000	0.000	0.000	0.000	0.000	0.012	pg161_def.cx9a2_ser7
0.007	11.799	55.674	32.521	0.000	0.000	0.000	0.000	0.000	0.000	0.009	pg162_def.cx9a2_ser7
qr500.L3
- qr500.L3: range queries with 500 insert/s per client
- Legend for results is here.
- Each entry lists the percentage of responses that fit in that bucket (slower than max time for previous bucket, faster than min time for next bucket).
Query response time histogram
256us	1ms	4ms	16ms	64ms	256ms	1s	4s	16s	gt	max	tag
99.965	0.035	nonzero	nonzero	0.000	0.000	0.000	0.000	0.000	0.000	0.013	pg1217_def.cx9a2_ser7
99.964	0.036	nonzero	nonzero	nonzero	0.000	0.000	0.000	0.000	0.000	0.018	pg1313_def.cx9a2_ser7
99.965	0.035	nonzero	nonzero	0.000	0.000	0.000	0.000	0.000	0.000	0.012	pg1410_def.cx9a2_ser7
99.968	0.031	nonzero	nonzero	nonzero	0.000	0.000	0.000	0.000	0.000	0.039	pg1411_def.cx9a2_ser7
99.962	0.037	nonzero	nonzero	nonzero	0.000	0.000	0.000	0.000	0.000	0.034	pg155_def.cx9a2_ser7
99.966	0.034	nonzero	nonzero	nonzero	0.000	0.000	0.000	0.000	0.000	0.021	pg156_def.cx9a2_ser7
99.965	0.035	nonzero	nonzero	0.000	0.000	0.000	0.000	0.000	0.000	0.014	pg161_def.cx9a2_ser7
99.967	0.033	nonzero	nonzero	0.000	0.000	0.000	0.000	0.000	0.000	0.012	pg162_def.cx9a2_ser7
Insert response time histogram
256us	1ms	4ms	16ms	64ms	256ms	1s	4s	16s	gt	max	tag
0.000	0.000	0.000	91.094	8.904	0.001	0.000	0.000	0.000	0.000	0.079	pg1217_def.cx9a2_ser7
0.000	0.000	0.000	88.074	10.938	0.989	0.000	0.000	0.000	0.000	0.184	pg1313_def.cx9a2_ser7
0.000	0.000	0.000	92.369	7.628	0.003	0.000	0.000	0.000	0.000	0.069	pg1410_def.cx9a2_ser7
0.000	0.000	0.000	93.207	5.085	1.708	0.000	0.000	0.000	0.000	0.171	pg1411_def.cx9a2_ser7
0.000	0.000	0.000	90.207	9.792	0.001	0.000	0.000	0.000	0.000	0.082	pg155_def.cx9a2_ser7
0.000	0.000	0.000	91.561	8.436	0.003	0.000	0.000	0.000	0.000	0.081	pg156_def.cx9a2_ser7
0.000	0.000	0.000	83.172	13.917	2.911	0.000	0.000	0.000	0.000	0.168	pg161_def.cx9a2_ser7
0.000	0.000	0.000	91.507	8.493	0.000	0.000	0.000	0.000	0.000	0.063	pg162_def.cx9a2_ser7
Delete response time histogram
256us	1ms	4ms	16ms	64ms	256ms	1s	4s	16s	gt	max	tag
0.031	3.424	12.271	57.139	27.136	0.000	0.000	0.000	0.000	0.000	0.028	pg1217_def.cx9a2_ser7
0.147	3.056	13.356	56.701	26.740	0.000	0.000	0.000	0.000	0.000	0.036	pg1313_def.cx9a2_ser7
0.129	3.083	12.726	56.635	27.426	0.000	0.000	0.000	0.000	0.000	0.034	pg1410_def.cx9a2_ser7
0.035	3.300	12.771	56.290	27.604	0.000	0.000	0.000	0.000	0.000	0.038	pg1411_def.cx9a2_ser7
0.067	2.800	13.436	53.561	30.136	0.000	0.000	0.000	0.000	0.000	0.057	pg155_def.cx9a2_ser7
0.099	3.194	12.193	55.412	29.101	0.000	0.000	0.000	0.000	0.000	0.054	pg156_def.cx9a2_ser7
0.106	2.633	13.364	50.793	33.100	0.004	0.000	0.000	0.000	0.000	0.115	pg161_def.cx9a2_ser7
0.067	3.206	13.171	51.567	31.990	0.000	0.000	0.000	0.000	0.000	0.030	pg162_def.cx9a2_ser7
qp500.L4
- qp500.L4: point queries with 500 insert/s per client
- Legend for results is here.
- Each entry lists the percentage of responses that fit in that bucket (slower than max time for previous bucket, faster than min time for next bucket).
Query response time histogram
256us	1ms	4ms	16ms	64ms	256ms	1s	4s	16s	gt	max	tag
0.000	0.181	99.119	0.698	0.002	0.000	0.000	0.000	0.000	0.000	0.036	pg1217_def.cx9a2_ser7
0.000	0.174	98.640	1.159	0.028	nonzero	nonzero	0.000	0.000	0.000	0.880	pg1313_def.cx9a2_ser7
0.000	0.183	99.140	0.676	0.002	0.000	0.000	0.000	0.000	0.000	0.039	pg1410_def.cx9a2_ser7
0.000	0.182	99.014	0.767	0.037	nonzero	nonzero	0.000	0.000	0.000	0.411	pg1411_def.cx9a2_ser7
0.000	0.169	99.154	0.675	0.002	0.000	0.000	0.000	0.000	0.000	0.037	pg155_def.cx9a2_ser7
0.000	0.180	99.110	0.708	0.002	0.000	0.000	0.000	0.000	0.000	0.041	pg156_def.cx9a2_ser7
0.000	0.152	98.859	0.967	0.022	0.000	0.000	0.000	0.000	0.000	0.045	pg161_def.cx9a2_ser7
0.000	0.157	98.882	0.936	0.024	nonzero	0.000	0.000	0.000	0.000	0.078	pg162_def.cx9a2_ser7
Insert response time histogram
256us	1ms	4ms	16ms	64ms	256ms	1s	4s	16s	gt	max	tag
0.000	0.000	0.000	84.933	15.067	0.000	0.000	0.000	0.000	0.000	0.064	pg1217_def.cx9a2_ser7
0.000	0.000	0.000	82.450	17.304	0.246	0.000	0.000	0.000	0.000	0.193	pg1313_def.cx9a2_ser7
0.000	0.000	0.000	86.792	13.208	0.000	0.000	0.000	0.000	0.000	0.059	pg1410_def.cx9a2_ser7
0.000	0.000	0.000	91.518	8.178	0.303	0.001	0.000	0.000	0.000	0.283	pg1411_def.cx9a2_ser7
0.000	0.000	0.000	85.017	14.982	0.001	0.000	0.000	0.000	0.000	0.073	pg155_def.cx9a2_ser7
0.000	0.000	0.000	83.862	16.137	0.000	0.000	0.000	0.000	0.000	0.055	pg156_def.cx9a2_ser7
0.000	0.000	0.000	83.408	16.403	0.189	0.000	0.000	0.000	0.000	0.115	pg161_def.cx9a2_ser7
0.000	0.000	0.000	84.247	15.528	0.225	0.000	0.000	0.000	0.000	0.113	pg162_def.cx9a2_ser7
Delete response time histogram
256us	1ms	4ms	16ms	64ms	256ms	1s	4s	16s	gt	max	tag
0.007	3.314	13.831	57.532	25.317	0.000	0.000	0.000	0.000	0.000	0.028	pg1217_def.cx9a2_ser7
0.029	3.299	13.779	58.150	24.743	0.000	0.000	0.000	0.000	0.000	0.033	pg1313_def.cx9a2_ser7
0.124	3.374	13.510	57.251	25.742	0.000	0.000	0.000	0.000	0.000	0.039	pg1410_def.cx9a2_ser7
0.071	2.842	14.081	57.094	25.912	0.000	0.000	0.000	0.000	0.000	0.031	pg1411_def.cx9a2_ser7
0.065	3.506	14.312	53.742	28.375	0.000	0.000	0.000	0.000	0.000	0.029	pg155_def.cx9a2_ser7
0.132	3.658	13.981	54.485	27.744	0.000	0.000	0.000	0.000	0.000	0.030	pg156_def.cx9a2_ser7
0.036	2.842	14.681	51.083	31.358	0.000	0.000	0.000	0.000	0.000	0.029	pg161_def.cx9a2_ser7
0.237	2.874	14.793	51.103	30.993	0.000	0.000	0.000	0.000	0.000	0.030	pg162_def.cx9a2_ser7
qr1000.L5
- qr1000.L5: range queries with 1000 insert/s per client
- Legend for results is here.
- Each entry lists the percentage of responses that fit in that bucket (slower than max time for previous bucket, faster than min time for next bucket).
Query response time histogram
256us	1ms	4ms	16ms	64ms	256ms	1s	4s	16s	gt	max	tag
99.920	0.079	nonzero	0.001	nonzero	0.000	0.000	0.000	0.000	0.000	0.016	pg1217_def.cx9a2_ser7
99.920	0.079	nonzero	0.001	nonzero	0.000	0.000	0.000	0.000	0.000	0.023	pg1313_def.cx9a2_ser7
99.925	0.074	nonzero	0.001	0.000	nonzero	0.000	0.000	0.000	0.000	0.091	pg1410_def.cx9a2_ser7
99.925	0.074	0.001	0.001	0.000	0.000	0.000	0.000	0.000	0.000	0.016	pg1411_def.cx9a2_ser7
99.922	0.077	nonzero	0.001	0.000	0.000	0.000	0.000	0.000	0.000	0.016	pg155_def.cx9a2_ser7
99.928	0.071	nonzero	0.001	nonzero	0.000	0.000	0.000	0.000	0.000	0.021	pg156_def.cx9a2_ser7
99.926	0.073	0.001	0.001	nonzero	0.000	0.000	0.000	0.000	0.000	0.017	pg161_def.cx9a2_ser7
99.927	0.072	nonzero	0.001	nonzero	0.000	0.000	0.000	0.000	0.000	0.020	pg162_def.cx9a2_ser7
Insert response time histogram
256us	1ms	4ms	16ms	64ms	256ms	1s	4s	16s	gt	max	tag
0.000	0.000	0.000	92.328	7.026	0.647	0.000	0.000	0.000	0.000	0.165	pg1217_def.cx9a2_ser7
0.000	0.000	0.000	90.665	8.565	0.770	0.000	0.000	0.000	0.000	0.190	pg1313_def.cx9a2_ser7
0.000	0.000	0.000	96.561	3.438	0.001	0.000	0.000	0.000	0.000	0.116	pg1410_def.cx9a2_ser7
0.000	0.000	0.000	92.161	7.651	0.188	0.000	0.000	0.000	0.000	0.128	pg1411_def.cx9a2_ser7
0.000	0.000	0.000	96.688	3.310	0.001	0.000	0.000	0.000	0.000	0.088	pg155_def.cx9a2_ser7
0.000	0.000	0.000	96.207	3.792	0.001	0.000	0.000	0.000	0.000	0.146	pg156_def.cx9a2_ser7
0.000	0.000	0.000	89.812	9.262	0.926	0.000	0.000	0.000	0.000	0.166	pg161_def.cx9a2_ser7
0.000	0.000	0.000	91.700	8.040	0.260	0.000	0.000	0.000	0.000	0.138	pg162_def.cx9a2_ser7
Delete response time histogram
256us	1ms	4ms	16ms	64ms	256ms	1s	4s	16s	gt	max	tag
0.010	1.272	6.300	28.850	63.566	0.001	0.000	0.000	0.000	0.000	0.078	pg1217_def.cx9a2_ser7
0.015	1.229	6.693	28.803	63.260	0.000	0.000	0.000	0.000	0.000	0.056	pg1313_def.cx9a2_ser7
0.024	1.186	6.615	28.919	63.254	0.003	0.000	0.000	0.000	0.000	0.120	pg1410_def.cx9a2_ser7
0.008	1.223	6.647	28.531	63.591	0.001	0.000	0.000	0.000	0.000	0.077	pg1411_def.cx9a2_ser7
0.010	1.456	6.432	26.873	65.228	0.001	0.000	0.000	0.000	0.000	0.105	pg155_def.cx9a2_ser7
0.013	1.323	6.727	26.930	65.008	0.000	0.000	0.000	0.000	0.000	0.055	pg156_def.cx9a2_ser7
0.019	1.390	6.447	25.163	66.981	0.000	0.000	0.000	0.000	0.000	0.059	pg161_def.cx9a2_ser7
0.049	1.358	6.737	26.305	65.550	0.001	0.000	0.000	0.000	0.000	0.123	pg162_def.cx9a2_ser7
qp1000.L6
- qp1000.L6: point queries with 1000 insert/s per client
- Legend for results is here.
- Each entry lists the percentage of responses that fit in that bucket (slower than max time for previous bucket, faster than min time for next bucket).
Query response time histogram
256us	1ms	4ms	16ms	64ms	256ms	1s	4s	16s	gt	max	tag
0.000	0.054	97.794	2.074	0.078	0.000	0.000	0.000	0.000	0.000	0.047	pg1217_def.cx9a2_ser7
0.000	0.050	97.809	2.064	0.078	nonzero	0.000	0.000	0.000	0.000	0.171	pg1313_def.cx9a2_ser7
nonzero	0.054	98.522	1.421	0.004	0.000	0.000	0.000	0.000	0.000	0.041	pg1410_def.cx9a2_ser7
0.000	0.052	98.242	1.664	0.042	nonzero	0.000	0.000	0.000	0.000	0.231	pg1411_def.cx9a2_ser7
0.000	0.050	98.506	1.440	0.003	0.000	0.000	0.000	0.000	0.000	0.055	pg155_def.cx9a2_ser7
0.000	0.051	98.508	1.437	0.003	0.000	0.000	0.000	0.000	0.000	0.043	pg156_def.cx9a2_ser7
0.000	0.038	98.444	1.490	0.027	nonzero	0.000	0.000	0.000	0.000	0.072	pg161_def.cx9a2_ser7
0.000	0.040	97.934	1.919	0.107	nonzero	0.000	0.000	0.000	0.000	0.101	pg162_def.cx9a2_ser7
Insert response time histogram
256us	1ms	4ms	16ms	64ms	256ms	1s	4s	16s	gt	max	tag
0.000	0.000	0.000	87.307	12.342	0.351	0.000	0.000	0.000	0.000	0.143	pg1217_def.cx9a2_ser7
0.000	0.000	0.000	88.092	11.612	0.297	0.000	0.000	0.000	0.000	0.143	pg1313_def.cx9a2_ser7
0.000	0.000	0.000	90.306	9.694	0.000	0.000	0.000	0.000	0.000	0.064	pg1410_def.cx9a2_ser7
0.000	0.000	0.000	89.606	10.142	0.251	0.001	0.000	0.000	0.000	0.257	pg1411_def.cx9a2_ser7
0.000	0.000	0.000	89.955	10.045	0.000	0.000	0.000	0.000	0.000	0.057	pg155_def.cx9a2_ser7
0.000	0.000	0.000	90.402	9.598	0.000	0.000	0.000	0.000	0.000	0.060	pg156_def.cx9a2_ser7
0.000	0.000	0.000	92.133	7.762	0.105	0.000	0.000	0.000	0.000	0.113	pg161_def.cx9a2_ser7
0.000	0.000	0.000	89.660	9.683	0.657	0.001	0.000	0.000	0.000	0.797	pg162_def.cx9a2_ser7
Delete response time histogram
256us	1ms	4ms	16ms	64ms	256ms	1s	4s	16s	gt	max	tag
0.031	1.706	5.844	30.303	62.117	0.000	0.000	0.000	0.000	0.000	0.055	pg1217_def.cx9a2_ser7
0.006	1.219	6.800	29.431	62.544	0.000	0.000	0.000	0.000	0.000	0.054	pg1313_def.cx9a2_ser7
0.033	1.288	6.458	30.112	62.109	0.000	0.000	0.000	0.000	0.000	0.052	pg1410_def.cx9a2_ser7
0.023	1.481	6.417	29.917	62.163	0.000	0.000	0.000	0.000	0.000	0.055	pg1411_def.cx9a2_ser7
0.529	4.687	6.326	27.953	60.504	0.000	0.000	0.000	0.000	0.000	0.052	pg155_def.cx9a2_ser7
0.014	1.362	6.671	28.040	63.913	0.000	0.000	0.000	0.000	0.000	0.055	pg156_def.cx9a2_ser7
0.324	3.192	7.121	26.235	63.128	0.000	0.000	0.000	0.000	0.000	0.056	pg161_def.cx9a2_ser7
0.031	1.415	6.699	26.408	65.447	0.000	0.000	0.000	0.000	0.000	0.059	pg162_def.cx9a2_ser7