Introduction
This is a report for the insert benchmark with 30M docs and 1 client(s). It is generated by scripts (bash, awk, sed) and Tufte might not be impressed. An overview of the insert benchmark is here and a short update is here. Below, by DBMS, I mean DBMS+version.config. An example is my8020.c10b40 where my means MySQL, 8020 is version 8.0.20 and c10b40 is the name for the configuration file.
The test server has 8 AMD cores, 16G RAM and an NVMe SSD. It is described here as the Beelink. The benchmark was run with 1 client and there were 1 or 3 connections per client (1 for queries or inserts without rate limits, 1+1 for rate limited inserts+deletes). It uses 1 table. It loads 30M rows per table without secondary indexes, creates 3 secondary indexes per table, then inserts 50m+50m rows per table with a delete per insert to avoid growing the table. It then does 6 read+write tests for 1800s each that do queries as fast as possible with 100,100,500,500,1000,1000 inserts/s and the same for deletes/s per client concurrent with the queries. The database is cached in memory. Clients and the DBMS share one server. The per-database configs are in the per-database subdirectories here.
The tested DBMS are:
- my5621_rel.cz10a_bee - MySQL 5.6.21, InnoDB, z10a_bee config
- my5631_rel.cz10a_bee - MySQL 5.6.31, InnoDB, z10a_bee config
- my5641_rel.cz10a_bee - MySQL 5.6.41, InnoDB, z10a_bee config
- my5651_rel.cz10a_bee - MySQL 5.6.51, InnoDB, z10a_bee config
Contents
- Summary
- l.i0: load without secondary indexes
- l.x: create secondary indexes
- l.i1: continue load after secondary indexes created with 50 inserts per transaction
- l.i2: continue load after secondary indexes created with 5 inserts per transaction
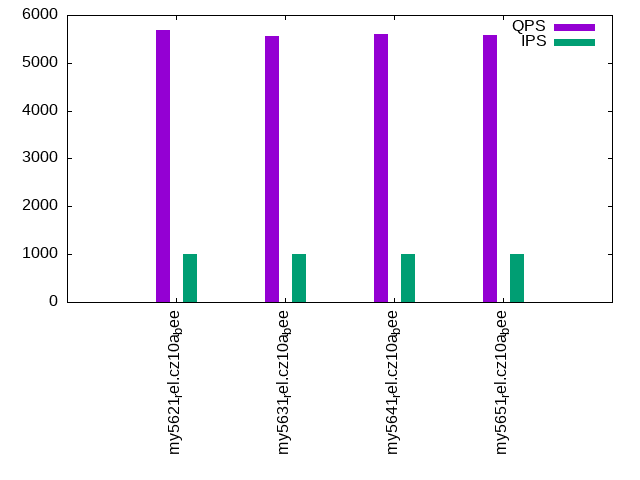
- qr100.L1: range queries with 100 insert/s per client
- qp100.L2: point queries with 100 insert/s per client
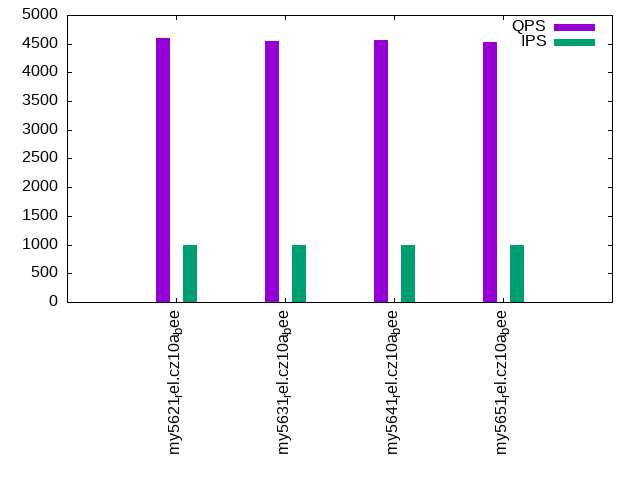
- qr500.L3: range queries with 500 insert/s per client
- qp500.L4: point queries with 500 insert/s per client
- qr1000.L5: range queries with 1000 insert/s per client
- qp1000.L6: point queries with 1000 insert/s per client
Summary
The numbers are inserts/s for l.i0, l.i1 and l.i2, indexed docs (or rows) /s for l.x and queries/s for qr100, qp100 thru qr1000, qp1000" The values are the average rate over the entire test for inserts (IPS) and queries (QPS). The range of values for IPS and QPS is split into 3 parts: bottom 25%, middle 50%, top 25%. Values in the bottom 25% have a red background, values in the top 25% have a green background and values in the middle have no color. A gray background is used for values that can be ignored because the DBMS did not sustain the target insert rate. Red backgrounds are not used when the minimum value is within 80% of the max value.
| dbms | l.i0 | l.x | l.i1 | l.i2 | qr100 | qp100 | qr500 | qp500 | qr1000 | qp1000 |
|---|---|---|---|---|---|---|---|---|---|---|
| my5621_rel.cz10a_bee | 103448 | 101352 | 18527 | 12165 | 5688 | 4652 | 5671 | 4641 | 5680 | 4607 |
| my5631_rel.cz10a_bee | 98361 | 102740 | 17969 | 11962 | 5577 | 4558 | 5598 | 4518 | 5562 | 4553 |
| my5641_rel.cz10a_bee | 98039 | 100000 | 17905 | 11919 | 5592 | 4563 | 5601 | 4605 | 5596 | 4572 |
| my5651_rel.cz10a_bee | 100000 | 107914 | 18124 | 12106 | 5570 | 4574 | 5547 | 4507 | 5573 | 4528 |
This table has relative throughput, throughput for the DBMS relative to the DBMS in the first line, using the absolute throughput from the previous table. Values less than 0.95 have a yellow background. Values greater than 1.05 have a blue background.
| dbms | l.i0 | l.x | l.i1 | l.i2 | qr100 | qp100 | qr500 | qp500 | qr1000 | qp1000 |
|---|---|---|---|---|---|---|---|---|---|---|
| my5621_rel.cz10a_bee | 1.00 | 1.00 | 1.00 | 1.00 | 1.00 | 1.00 | 1.00 | 1.00 | 1.00 | 1.00 |
| my5631_rel.cz10a_bee | 0.95 | 1.01 | 0.97 | 0.98 | 0.98 | 0.98 | 0.99 | 0.97 | 0.98 | 0.99 |
| my5641_rel.cz10a_bee | 0.95 | 0.99 | 0.97 | 0.98 | 0.98 | 0.98 | 0.99 | 0.99 | 0.99 | 0.99 |
| my5651_rel.cz10a_bee | 0.97 | 1.06 | 0.98 | 1.00 | 0.98 | 0.98 | 0.98 | 0.97 | 0.98 | 0.98 |
This lists the average rate of inserts/s for the tests that do inserts concurrent with queries. For such tests the query rate is listed in the table above. The read+write tests are setup so that the insert rate should match the target rate every second. Cells that are not at least 95% of the target have a red background to indicate a failure to satisfy the target.
| dbms | qr100.L1 | qp100.L2 | qr500.L3 | qp500.L4 | qr1000.L5 | qp1000.L6 |
|---|---|---|---|---|---|---|
| my5621_rel.cz10a_bee | 100 | 100 | 499 | 499 | 997 | 998 |
| my5631_rel.cz10a_bee | 100 | 100 | 499 | 499 | 997 | 998 |
| my5641_rel.cz10a_bee | 100 | 100 | 499 | 498 | 997 | 995 |
| my5651_rel.cz10a_bee | 100 | 100 | 499 | 495 | 998 | 998 |
| target | 100 | 100 | 500 | 500 | 1000 | 1000 |
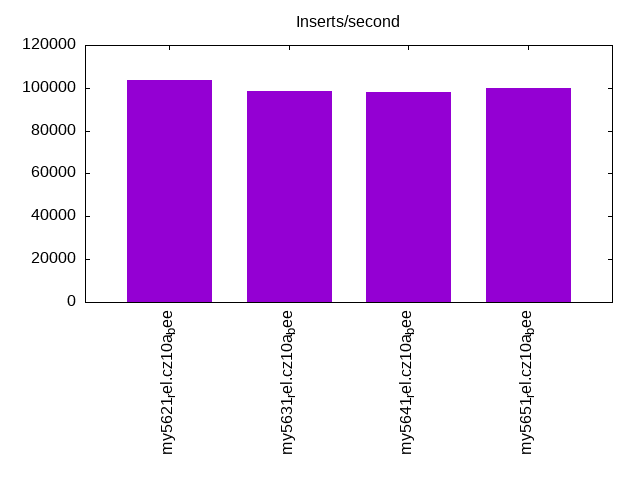
l.i0
l.i0: load without secondary indexes. Graphs for performance per 1-second interval are here.
Average throughput:
Insert response time histogram: each cell has the percentage of responses that take <= the time in the header and max is the max response time in seconds. For the max column values in the top 25% of the range have a red background and in the bottom 25% of the range have a green background. The red background is not used when the min value is within 80% of the max value.
| dbms | 256us | 1ms | 4ms | 16ms | 64ms | 256ms | 1s | 4s | 16s | gt | max |
|---|---|---|---|---|---|---|---|---|---|---|---|
| my5621_rel.cz10a_bee | 94.239 | 5.643 | 0.110 | 0.004 | 0.003 | 0.100 | |||||
| my5631_rel.cz10a_bee | 87.819 | 12.059 | 0.117 | 0.002 | 0.003 | 0.098 | |||||
| my5641_rel.cz10a_bee | 85.496 | 14.381 | 0.119 | 0.001 | 0.003 | 0.100 | |||||
| my5651_rel.cz10a_bee | 90.958 | 8.926 | 0.111 | 0.001 | 0.003 | 0.097 |
Performance metrics for the DBMS listed above. Some are normalized by throughput, others are not. Legend for results is here.
ips	qps	rps	rmbps	wps	wmbps	rpq	rkbpq	wpi	wkbpi	csps	cpups	cspq	cpupq	dbgb1	dbgb2	rss	maxop	p50	p99	tag
103448	0	905	3.5	317.3	31.2	0.009	0.035	0.003	0.309	12308	22.8	0.119	18	2.0	18.5	2.5	0.100	104188	88828	my5621_rel.cz10a_bee
98361	0	854	3.3	300.4	29.8	0.009	0.035	0.003	0.310	11975	22.3	0.122	18	2.0	18.5	2.6	0.098	99116	87333	my5631_rel.cz10a_bee
98039	0	857	3.3	299.9	29.5	0.009	0.035	0.003	0.309	11906	22.5	0.121	18	2.0	18.5	2.6	0.100	98410	84327	my5641_rel.cz10a_bee
100000	0	878	3.4	305.1	30.4	0.009	0.035	0.003	0.311	12305	22.5	0.123	18	2.0	18.5	2.7	0.097	100604	87340	my5651_rel.cz10a_bee
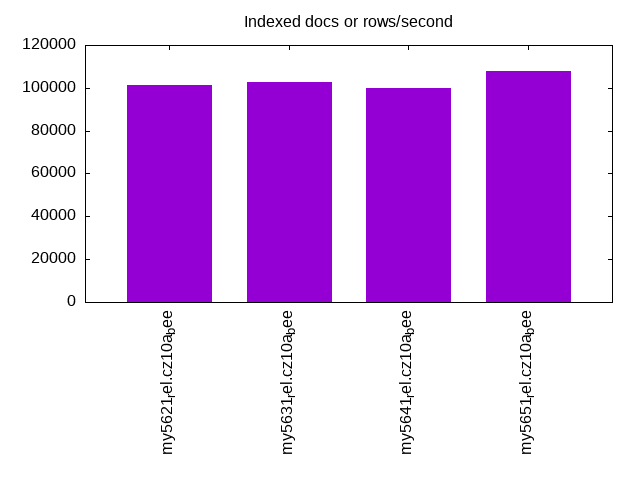
l.x
l.x: create secondary indexes.
Average throughput:
Performance metrics for the DBMS listed above. Some are normalized by throughput, others are not. Legend for results is here.
ips	qps	rps	rmbps	wps	wmbps	rpq	rkbpq	wpi	wkbpi	csps	cpups	cspq	cpupq	dbgb1	dbgb2	rss	maxop	p50	p99	tag
101352	0	15	0.1	855.6	105.4	0.000	0.001	0.008	1.065	2393	11.2	0.024	9	4.2	20.7	4.6	0.002	NA	NA	my5621_rel.cz10a_bee
102740	0	12	0.0	861.7	107.4	0.000	0.000	0.008	1.071	2438	11.4	0.024	9	4.2	20.7	4.6	0.002	NA	NA	my5631_rel.cz10a_bee
100000	0	13	0.1	831.1	103.5	0.000	0.001	0.008	1.060	2328	11.4	0.023	9	4.2	20.7	4.9	0.002	NA	NA	my5641_rel.cz10a_bee
107914	0	11	0.0	858.6	111.7	0.000	0.000	0.008	1.059	2532	11.6	0.023	9	4.2	20.7	4.8	0.002	NA	NA	my5651_rel.cz10a_bee
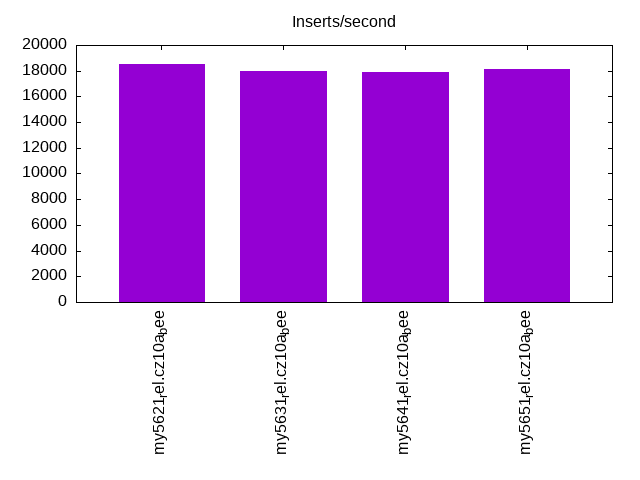
l.i1
l.i1: continue load after secondary indexes created with 50 inserts per transaction. Graphs for performance per 1-second interval are here.
Average throughput:
Insert response time histogram: each cell has the percentage of responses that take <= the time in the header and max is the max response time in seconds. For the max column values in the top 25% of the range have a red background and in the bottom 25% of the range have a green background. The red background is not used when the min value is within 80% of the max value.
| dbms | 256us | 1ms | 4ms | 16ms | 64ms | 256ms | 1s | 4s | 16s | gt | max |
|---|---|---|---|---|---|---|---|---|---|---|---|
| my5621_rel.cz10a_bee | 95.085 | 4.732 | 0.182 | 0.001 | 0.109 | ||||||
| my5631_rel.cz10a_bee | 94.656 | 5.163 | 0.180 | nonzero | 0.110 | ||||||
| my5641_rel.cz10a_bee | 94.592 | 5.229 | 0.178 | nonzero | 0.103 | ||||||
| my5651_rel.cz10a_bee | 94.834 | 4.986 | 0.179 | nonzero | 0.101 |
Delete response time histogram: each cell has the percentage of responses that take <= the time in the header and max is the max response time in seconds. For the max column values in the top 25% of the range have a red background and in the bottom 25% of the range have a green background. The red background is not used when the min value is within 80% of the max value.
| dbms | 256us | 1ms | 4ms | 16ms | 64ms | 256ms | 1s | 4s | 16s | gt | max |
|---|---|---|---|---|---|---|---|---|---|---|---|
| my5621_rel.cz10a_bee | 96.362 | 3.476 | 0.161 | 0.001 | 0.076 | ||||||
| my5631_rel.cz10a_bee | 96.240 | 3.607 | 0.152 | 0.062 | |||||||
| my5641_rel.cz10a_bee | 96.139 | 3.714 | 0.147 | 0.061 | |||||||
| my5651_rel.cz10a_bee | 96.295 | 3.556 | 0.149 | nonzero | 0.073 |
Performance metrics for the DBMS listed above. Some are normalized by throughput, others are not. Legend for results is here.
ips	qps	rps	rmbps	wps	wmbps	rpq	rkbpq	wpi	wkbpi	csps	cpups	cspq	cpupq	dbgb1	dbgb2	rss	maxop	p50	p99	tag
18527	0	625	2.4	1842.3	81.7	0.034	0.135	0.099	4.516	15706	34.5	0.848	149	6.2	22.7	6.8	0.109	19579	5894	my5621_rel.cz10a_bee
17969	0	601	2.3	1794.6	79.4	0.033	0.134	0.100	4.527	15532	34.2	0.864	152	6.1	22.6	6.8	0.110	19029	5547	my5631_rel.cz10a_bee
17905	0	602	2.3	1794.8	79.4	0.034	0.134	0.100	4.543	15492	34.3	0.865	153	6.1	22.6	6.8	0.103	18979	5394	my5641_rel.cz10a_bee
18124	0	611	2.4	1818.4	80.4	0.034	0.135	0.100	4.545	15570	34.4	0.859	152	6.2	22.7	6.8	0.101	19229	5644	my5651_rel.cz10a_bee
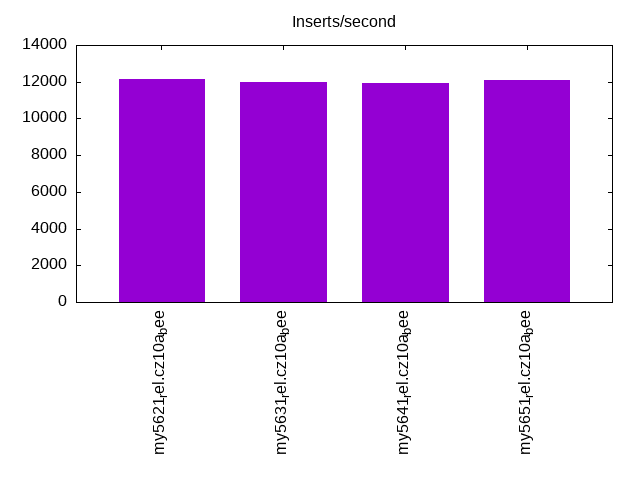
l.i2
l.i2: continue load after secondary indexes created with 5 inserts per transaction. Graphs for performance per 1-second interval are here.
Average throughput:
Insert response time histogram: each cell has the percentage of responses that take <= the time in the header and max is the max response time in seconds. For the max column values in the top 25% of the range have a red background and in the bottom 25% of the range have a green background. The red background is not used when the min value is within 80% of the max value.
| dbms | 256us | 1ms | 4ms | 16ms | 64ms | 256ms | 1s | 4s | 16s | gt | max |
|---|---|---|---|---|---|---|---|---|---|---|---|
| my5621_rel.cz10a_bee | 13.649 | 86.108 | 0.040 | 0.200 | 0.001 | nonzero | 0.079 | ||||
| my5631_rel.cz10a_bee | 10.344 | 89.396 | 0.052 | 0.207 | 0.001 | 0.049 | |||||
| my5641_rel.cz10a_bee | 9.774 | 89.966 | 0.050 | 0.209 | 0.001 | 0.049 | |||||
| my5651_rel.cz10a_bee | 10.521 | 89.230 | 0.048 | 0.200 | 0.001 | nonzero | 0.067 |
Delete response time histogram: each cell has the percentage of responses that take <= the time in the header and max is the max response time in seconds. For the max column values in the top 25% of the range have a red background and in the bottom 25% of the range have a green background. The red background is not used when the min value is within 80% of the max value.
| dbms | 256us | 1ms | 4ms | 16ms | 64ms | 256ms | 1s | 4s | 16s | gt | max |
|---|---|---|---|---|---|---|---|---|---|---|---|
| my5621_rel.cz10a_bee | 13.822 | 85.943 | 0.033 | 0.200 | 0.001 | nonzero | 0.079 | ||||
| my5631_rel.cz10a_bee | 13.423 | 86.334 | 0.035 | 0.206 | 0.001 | 0.049 | |||||
| my5641_rel.cz10a_bee | 12.547 | 87.208 | 0.035 | 0.209 | 0.001 | 0.048 | |||||
| my5651_rel.cz10a_bee | 13.917 | 85.849 | 0.033 | 0.200 | 0.001 | nonzero | 0.068 |
Performance metrics for the DBMS listed above. Some are normalized by throughput, others are not. Legend for results is here.
ips	qps	rps	rmbps	wps	wmbps	rpq	rkbpq	wpi	wkbpi	csps	cpups	cspq	cpupq	dbgb1	dbgb2	rss	maxop	p50	p99	tag
12165	0	2192	8.6	1242.9	51.8	0.180	0.721	0.102	4.360	58349	36.3	4.796	239	6.2	22.7	6.8	0.079	12202	10818	my5621_rel.cz10a_bee
11962	0	2153	8.4	1259.6	52.0	0.180	0.720	0.105	4.454	57575	36.3	4.813	243	6.1	22.6	6.8	0.049	11991	10886	my5631_rel.cz10a_bee
11919	0	2146	8.4	1251.2	51.7	0.180	0.720	0.105	4.441	57422	36.3	4.818	244	6.2	22.7	6.8	0.049	11947	10788	my5641_rel.cz10a_bee
12106	0	2177	8.5	1192.4	50.2	0.180	0.719	0.098	4.242	57886	36.2	4.781	239	6.2	22.7	6.8	0.067	12100	10983	my5651_rel.cz10a_bee
qr100.L1
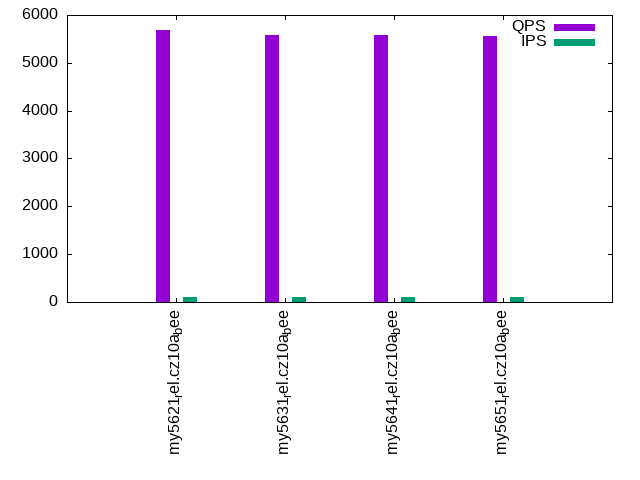
qr100.L1: range queries with 100 insert/s per client. Graphs for performance per 1-second interval are here.
Average throughput:
Query response time histogram: each cell has the percentage of responses that take <= the time in the header and max is the max response time in seconds. For max values in the top 25% of the range have a red background and in the bottom 25% of the range have a green background. The red background is not used when the min value is within 80% of the max value.
| dbms | 256us | 1ms | 4ms | 16ms | 64ms | 256ms | 1s | 4s | 16s | gt | max |
|---|---|---|---|---|---|---|---|---|---|---|---|
| my5621_rel.cz10a_bee | 96.549 | 3.445 | 0.002 | 0.004 | nonzero | 0.017 | |||||
| my5631_rel.cz10a_bee | 96.320 | 3.674 | 0.002 | 0.004 | nonzero | 0.022 | |||||
| my5641_rel.cz10a_bee | 96.317 | 3.677 | 0.002 | 0.003 | nonzero | 0.017 | |||||
| my5651_rel.cz10a_bee | 96.223 | 3.771 | 0.003 | 0.004 | nonzero | 0.023 |
Insert response time histogram: each cell has the percentage of responses that take <= the time in the header and max is the max response time in seconds. For max values in the top 25% of the range have a red background and in the bottom 25% of the range have a green background. The red background is not used when the min value is within 80% of the max value.
| dbms | 256us | 1ms | 4ms | 16ms | 64ms | 256ms | 1s | 4s | 16s | gt | max |
|---|---|---|---|---|---|---|---|---|---|---|---|
| my5621_rel.cz10a_bee | 42.806 | 52.806 | 4.389 | 0.038 | |||||||
| my5631_rel.cz10a_bee | 42.778 | 51.694 | 5.528 | 0.040 | |||||||
| my5641_rel.cz10a_bee | 44.750 | 52.111 | 3.139 | 0.037 | |||||||
| my5651_rel.cz10a_bee | 41.222 | 53.556 | 5.222 | 0.033 |
Delete response time histogram: each cell has the percentage of responses that take <= the time in the header and max is the max response time in seconds. For max values in the top 25% of the range have a red background and in the bottom 25% of the range have a green background. The red background is not used when the min value is within 80% of the max value.
| dbms | 256us | 1ms | 4ms | 16ms | 64ms | 256ms | 1s | 4s | 16s | gt | max |
|---|---|---|---|---|---|---|---|---|---|---|---|
| my5621_rel.cz10a_bee | 42.806 | 54.972 | 2.222 | 0.031 | |||||||
| my5631_rel.cz10a_bee | 41.611 | 55.639 | 2.750 | 0.033 | |||||||
| my5641_rel.cz10a_bee | 44.889 | 53.694 | 1.417 | 0.029 | |||||||
| my5651_rel.cz10a_bee | 41.444 | 56.167 | 2.389 | 0.042 |
Performance metrics for the DBMS listed above. Some are normalized by throughput, others are not. Legend for results is here.
ips	qps	rps	rmbps	wps	wmbps	rpq	rkbpq	wpi	wkbpi	csps	cpups	cspq	cpupq	dbgb1	dbgb2	rss	maxop	p50	p99	tag
100	5688	4	0.0	524.2	15.7	0.001	0.003	5.253	160.667	23529	13.0	4.136	183	6.2	22.7	6.8	0.017	5642	5466	my5621_rel.cz10a_bee
100	5577	4	0.0	527.1	15.8	0.001	0.003	5.282	161.639	23156	13.1	4.152	188	6.1	22.6	6.8	0.022	5532	5370	my5631_rel.cz10a_bee
100	5592	4	0.0	517.6	15.5	0.001	0.003	5.187	158.930	23167	13.1	4.143	187	6.2	22.7	6.8	0.017	5549	5386	my5641_rel.cz10a_bee
100	5570	4	0.0	545.9	16.3	0.001	0.003	5.475	167.560	23178	13.2	4.161	190	6.2	22.7	6.8	0.023	5530	5354	my5651_rel.cz10a_bee
qp100.L2
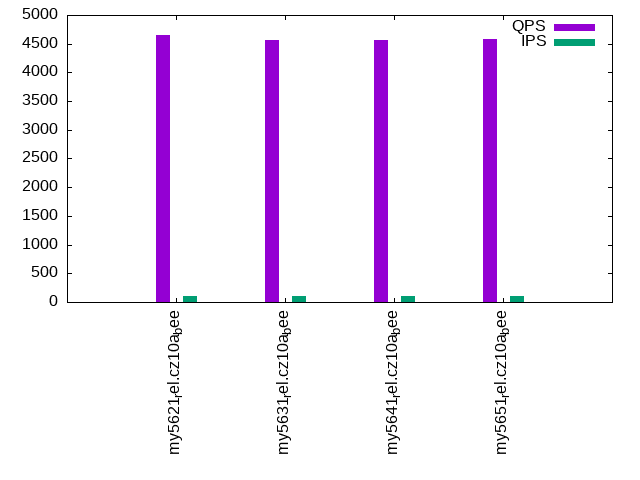
qp100.L2: point queries with 100 insert/s per client. Graphs for performance per 1-second interval are here.
Average throughput:
Query response time histogram: each cell has the percentage of responses that take <= the time in the header and max is the max response time in seconds. For max values in the top 25% of the range have a red background and in the bottom 25% of the range have a green background. The red background is not used when the min value is within 80% of the max value.
| dbms | 256us | 1ms | 4ms | 16ms | 64ms | 256ms | 1s | 4s | 16s | gt | max |
|---|---|---|---|---|---|---|---|---|---|---|---|
| my5621_rel.cz10a_bee | 94.712 | 5.283 | 0.003 | 0.002 | nonzero | 0.018 | |||||
| my5631_rel.cz10a_bee | 93.673 | 6.322 | 0.003 | 0.002 | nonzero | 0.022 | |||||
| my5641_rel.cz10a_bee | 93.887 | 6.109 | 0.003 | 0.002 | nonzero | 0.017 | |||||
| my5651_rel.cz10a_bee | 94.197 | 5.797 | 0.003 | 0.003 | nonzero | 0.017 |
Insert response time histogram: each cell has the percentage of responses that take <= the time in the header and max is the max response time in seconds. For max values in the top 25% of the range have a red background and in the bottom 25% of the range have a green background. The red background is not used when the min value is within 80% of the max value.
| dbms | 256us | 1ms | 4ms | 16ms | 64ms | 256ms | 1s | 4s | 16s | gt | max |
|---|---|---|---|---|---|---|---|---|---|---|---|
| my5621_rel.cz10a_bee | 49.250 | 47.833 | 2.917 | 0.040 | |||||||
| my5631_rel.cz10a_bee | 48.972 | 47.944 | 3.083 | 0.044 | |||||||
| my5641_rel.cz10a_bee | 49.111 | 47.500 | 3.389 | 0.041 | |||||||
| my5651_rel.cz10a_bee | 46.389 | 48.861 | 4.750 | 0.052 |
Delete response time histogram: each cell has the percentage of responses that take <= the time in the header and max is the max response time in seconds. For max values in the top 25% of the range have a red background and in the bottom 25% of the range have a green background. The red background is not used when the min value is within 80% of the max value.
| dbms | 256us | 1ms | 4ms | 16ms | 64ms | 256ms | 1s | 4s | 16s | gt | max |
|---|---|---|---|---|---|---|---|---|---|---|---|
| my5621_rel.cz10a_bee | 48.361 | 49.806 | 1.833 | 0.037 | |||||||
| my5631_rel.cz10a_bee | 48.194 | 50.222 | 1.583 | 0.033 | |||||||
| my5641_rel.cz10a_bee | 48.417 | 49.667 | 1.917 | 0.037 | |||||||
| my5651_rel.cz10a_bee | 44.750 | 53.194 | 2.056 | 0.033 |
Performance metrics for the DBMS listed above. Some are normalized by throughput, others are not. Legend for results is here.
ips	qps	rps	rmbps	wps	wmbps	rpq	rkbpq	wpi	wkbpi	csps	cpups	cspq	cpupq	dbgb1	dbgb2	rss	maxop	p50	p99	tag
100	4652	4	0.0	560.8	16.8	0.001	0.004	5.625	172.263	20635	13.1	4.436	225	6.2	22.7	6.8	0.018	4619	4350	my5621_rel.cz10a_bee
100	4558	4	0.0	533.0	15.9	0.001	0.004	5.346	163.477	20220	13.7	4.436	240	6.1	22.6	6.8	0.022	4519	4253	my5631_rel.cz10a_bee
100	4563	4	0.0	528.8	15.8	0.001	0.004	5.304	162.211	20225	13.5	4.432	237	6.2	22.7	6.8	0.017	4507	4242	my5641_rel.cz10a_bee
100	4574	4	0.0	520.4	15.5	0.001	0.004	5.220	159.592	20225	13.2	4.421	231	6.2	22.7	6.8	0.017	4554	4286	my5651_rel.cz10a_bee
qr500.L3
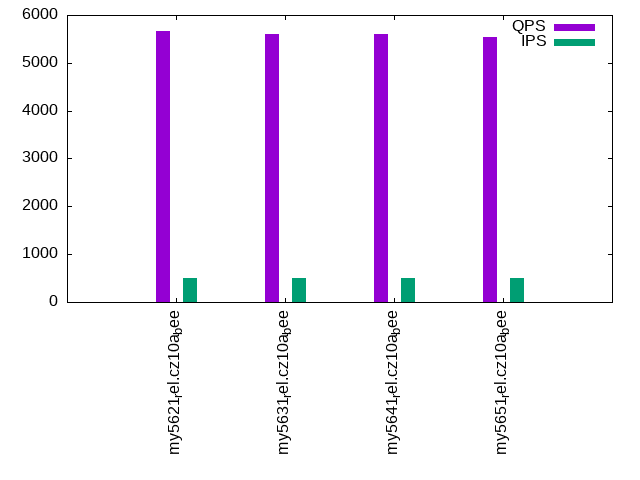
qr500.L3: range queries with 500 insert/s per client. Graphs for performance per 1-second interval are here.
Average throughput:
Query response time histogram: each cell has the percentage of responses that take <= the time in the header and max is the max response time in seconds. For max values in the top 25% of the range have a red background and in the bottom 25% of the range have a green background. The red background is not used when the min value is within 80% of the max value.
| dbms | 256us | 1ms | 4ms | 16ms | 64ms | 256ms | 1s | 4s | 16s | gt | max |
|---|---|---|---|---|---|---|---|---|---|---|---|
| my5621_rel.cz10a_bee | 96.529 | 3.466 | 0.002 | 0.003 | 0.016 | ||||||
| my5631_rel.cz10a_bee | 96.282 | 3.713 | 0.002 | 0.003 | 0.016 | ||||||
| my5641_rel.cz10a_bee | 96.289 | 3.706 | 0.002 | 0.003 | nonzero | 0.016 | |||||
| my5651_rel.cz10a_bee | 95.586 | 4.409 | 0.002 | 0.003 | 0.015 |
Insert response time histogram: each cell has the percentage of responses that take <= the time in the header and max is the max response time in seconds. For max values in the top 25% of the range have a red background and in the bottom 25% of the range have a green background. The red background is not used when the min value is within 80% of the max value.
| dbms | 256us | 1ms | 4ms | 16ms | 64ms | 256ms | 1s | 4s | 16s | gt | max |
|---|---|---|---|---|---|---|---|---|---|---|---|
| my5621_rel.cz10a_bee | 89.550 | 10.178 | 0.272 | 0.035 | |||||||
| my5631_rel.cz10a_bee | 89.650 | 10.183 | 0.167 | 0.035 | |||||||
| my5641_rel.cz10a_bee | 89.689 | 10.194 | 0.117 | 0.033 | |||||||
| my5651_rel.cz10a_bee | 89.739 | 10.128 | 0.133 | 0.029 |
Delete response time histogram: each cell has the percentage of responses that take <= the time in the header and max is the max response time in seconds. For max values in the top 25% of the range have a red background and in the bottom 25% of the range have a green background. The red background is not used when the min value is within 80% of the max value.
| dbms | 256us | 1ms | 4ms | 16ms | 64ms | 256ms | 1s | 4s | 16s | gt | max |
|---|---|---|---|---|---|---|---|---|---|---|---|
| my5621_rel.cz10a_bee | 89.994 | 9.839 | 0.167 | 0.033 | |||||||
| my5631_rel.cz10a_bee | 90.161 | 9.694 | 0.144 | 0.025 | |||||||
| my5641_rel.cz10a_bee | 90.339 | 9.589 | 0.072 | 0.042 | |||||||
| my5651_rel.cz10a_bee | 90.278 | 9.644 | 0.078 | 0.024 |
Performance metrics for the DBMS listed above. Some are normalized by throughput, others are not. Legend for results is here.
ips	qps	rps	rmbps	wps	wmbps	rpq	rkbpq	wpi	wkbpi	csps	cpups	cspq	cpupq	dbgb1	dbgb2	rss	maxop	p50	p99	tag
499	5671	17	0.1	287.1	9.1	0.003	0.012	0.576	18.720	22906	13.5	4.039	190	6.2	22.7	6.8	0.016	5629	5455	my5621_rel.cz10a_bee
499	5598	17	0.1	116.1	4.0	0.003	0.012	0.233	8.157	22090	13.5	3.946	193	6.1	22.6	6.8	0.016	5546	5370	my5631_rel.cz10a_bee
499	5601	17	0.1	69.5	2.6	0.003	0.012	0.139	5.274	22041	13.7	3.935	196	6.2	22.7	6.8	0.016	5562	5370	my5641_rel.cz10a_bee
499	5547	17	0.1	149.8	5.0	0.003	0.012	0.300	10.235	21975	13.4	3.962	193	6.2	22.7	6.8	0.015	5533	5419	my5651_rel.cz10a_bee
qp500.L4
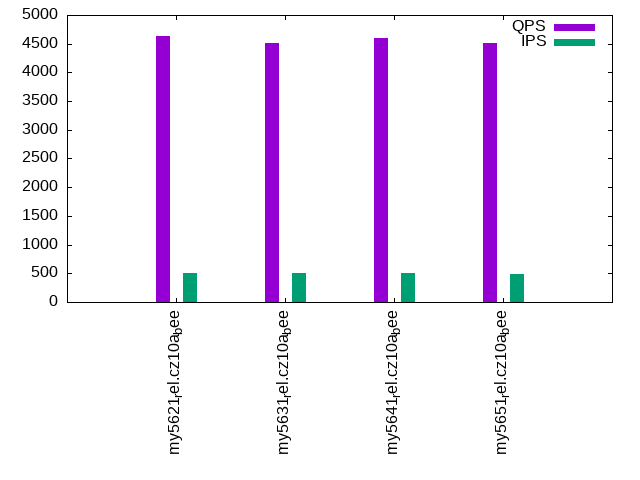
qp500.L4: point queries with 500 insert/s per client. Graphs for performance per 1-second interval are here.
Average throughput:
Query response time histogram: each cell has the percentage of responses that take <= the time in the header and max is the max response time in seconds. For max values in the top 25% of the range have a red background and in the bottom 25% of the range have a green background. The red background is not used when the min value is within 80% of the max value.
| dbms | 256us | 1ms | 4ms | 16ms | 64ms | 256ms | 1s | 4s | 16s | gt | max |
|---|---|---|---|---|---|---|---|---|---|---|---|
| my5621_rel.cz10a_bee | 93.944 | 6.048 | 0.006 | 0.002 | 0.014 | ||||||
| my5631_rel.cz10a_bee | 93.108 | 6.884 | 0.006 | 0.002 | 0.011 | ||||||
| my5641_rel.cz10a_bee | 93.923 | 6.070 | 0.006 | 0.001 | 0.010 | ||||||
| my5651_rel.cz10a_bee | 93.269 | 6.724 | 0.005 | 0.001 | 0.012 |
Insert response time histogram: each cell has the percentage of responses that take <= the time in the header and max is the max response time in seconds. For max values in the top 25% of the range have a red background and in the bottom 25% of the range have a green background. The red background is not used when the min value is within 80% of the max value.
| dbms | 256us | 1ms | 4ms | 16ms | 64ms | 256ms | 1s | 4s | 16s | gt | max |
|---|---|---|---|---|---|---|---|---|---|---|---|
| my5621_rel.cz10a_bee | 89.161 | 10.706 | 0.133 | 0.023 | |||||||
| my5631_rel.cz10a_bee | 89.206 | 10.589 | 0.206 | 0.031 | |||||||
| my5641_rel.cz10a_bee | 88.722 | 11.172 | 0.106 | 0.022 | |||||||
| my5651_rel.cz10a_bee | 88.778 | 11.083 | 0.139 | 0.024 |
Delete response time histogram: each cell has the percentage of responses that take <= the time in the header and max is the max response time in seconds. For max values in the top 25% of the range have a red background and in the bottom 25% of the range have a green background. The red background is not used when the min value is within 80% of the max value.
| dbms | 256us | 1ms | 4ms | 16ms | 64ms | 256ms | 1s | 4s | 16s | gt | max |
|---|---|---|---|---|---|---|---|---|---|---|---|
| my5621_rel.cz10a_bee | 89.494 | 10.489 | 0.017 | 0.022 | |||||||
| my5631_rel.cz10a_bee | 89.978 | 9.911 | 0.111 | 0.027 | |||||||
| my5641_rel.cz10a_bee | 89.761 | 10.222 | 0.017 | 0.017 | |||||||
| my5651_rel.cz10a_bee | 89.206 | 10.739 | 0.056 | 0.028 |
Performance metrics for the DBMS listed above. Some are normalized by throughput, others are not. Legend for results is here.
ips	qps	rps	rmbps	wps	wmbps	rpq	rkbpq	wpi	wkbpi	csps	cpups	cspq	cpupq	dbgb1	dbgb2	rss	maxop	p50	p99	tag
499	4641	17	0.1	134.4	4.5	0.004	0.014	0.269	9.262	19376	13.9	4.175	240	6.2	22.7	6.8	0.014	4586	4282	my5621_rel.cz10a_bee
499	4518	17	0.1	312.2	9.9	0.004	0.015	0.626	20.291	19488	13.7	4.314	243	6.1	22.6	6.8	0.011	4477	4218	my5631_rel.cz10a_bee
498	4605	17	0.1	314.3	9.9	0.004	0.014	0.631	20.392	19998	14.4	4.343	250	6.2	22.7	6.8	0.010	4539	4235	my5641_rel.cz10a_bee
495	4507	17	0.1	265.5	8.4	0.004	0.015	0.536	17.479	19407	13.9	4.306	247	6.2	22.7	6.8	0.012	4491	4219	my5651_rel.cz10a_bee
qr1000.L5
qr1000.L5: range queries with 1000 insert/s per client. Graphs for performance per 1-second interval are here.
Average throughput:
Query response time histogram: each cell has the percentage of responses that take <= the time in the header and max is the max response time in seconds. For max values in the top 25% of the range have a red background and in the bottom 25% of the range have a green background. The red background is not used when the min value is within 80% of the max value.
| dbms | 256us | 1ms | 4ms | 16ms | 64ms | 256ms | 1s | 4s | 16s | gt | max |
|---|---|---|---|---|---|---|---|---|---|---|---|
| my5621_rel.cz10a_bee | 96.436 | 3.558 | 0.003 | 0.003 | nonzero | 0.017 | |||||
| my5631_rel.cz10a_bee | 95.937 | 4.058 | 0.003 | 0.003 | 0.014 | ||||||
| my5641_rel.cz10a_bee | 95.938 | 4.054 | 0.004 | 0.003 | nonzero | 0.021 | |||||
| my5651_rel.cz10a_bee | 96.047 | 3.945 | 0.006 | 0.003 | nonzero | 0.023 |
Insert response time histogram: each cell has the percentage of responses that take <= the time in the header and max is the max response time in seconds. For max values in the top 25% of the range have a red background and in the bottom 25% of the range have a green background. The red background is not used when the min value is within 80% of the max value.
| dbms | 256us | 1ms | 4ms | 16ms | 64ms | 256ms | 1s | 4s | 16s | gt | max |
|---|---|---|---|---|---|---|---|---|---|---|---|
| my5621_rel.cz10a_bee | 93.236 | 6.625 | 0.139 | 0.041 | |||||||
| my5631_rel.cz10a_bee | 93.389 | 6.544 | 0.067 | 0.045 | |||||||
| my5641_rel.cz10a_bee | 91.939 | 7.900 | 0.161 | 0.039 | |||||||
| my5651_rel.cz10a_bee | 90.511 | 9.144 | 0.344 | 0.041 |
Delete response time histogram: each cell has the percentage of responses that take <= the time in the header and max is the max response time in seconds. For max values in the top 25% of the range have a red background and in the bottom 25% of the range have a green background. The red background is not used when the min value is within 80% of the max value.
| dbms | 256us | 1ms | 4ms | 16ms | 64ms | 256ms | 1s | 4s | 16s | gt | max |
|---|---|---|---|---|---|---|---|---|---|---|---|
| my5621_rel.cz10a_bee | 93.753 | 6.147 | 0.100 | 0.040 | |||||||
| my5631_rel.cz10a_bee | 94.183 | 5.783 | 0.033 | 0.045 | |||||||
| my5641_rel.cz10a_bee | 92.797 | 7.078 | 0.125 | 0.040 | |||||||
| my5651_rel.cz10a_bee | 92.183 | 7.550 | 0.267 | 0.041 |
Performance metrics for the DBMS listed above. Some are normalized by throughput, others are not. Legend for results is here.
ips	qps	rps	rmbps	wps	wmbps	rpq	rkbpq	wpi	wkbpi	csps	cpups	cspq	cpupq	dbgb1	dbgb2	rss	maxop	p50	p99	tag
997	5680	33	0.1	419.4	13.6	0.006	0.023	0.421	13.981	23564	14.7	4.149	207	6.2	22.7	6.8	0.017	5627	5438	my5621_rel.cz10a_bee
997	5562	33	0.1	272.2	9.2	0.006	0.024	0.273	9.414	22689	14.7	4.079	211	6.1	22.6	6.8	0.014	5516	5353	my5631_rel.cz10a_bee
997	5596	33	0.1	263.9	8.9	0.006	0.024	0.265	9.164	22951	15.0	4.101	214	6.2	22.7	6.8	0.021	5546	5324	my5641_rel.cz10a_bee
998	5573	33	0.1	1275.3	39.3	0.006	0.024	1.278	40.351	25905	15.1	4.648	217	6.2	22.7	6.8	0.023	5530	5263	my5651_rel.cz10a_bee
qp1000.L6
qp1000.L6: point queries with 1000 insert/s per client. Graphs for performance per 1-second interval are here.
Average throughput:
Query response time histogram: each cell has the percentage of responses that take <= the time in the header and max is the max response time in seconds. For max values in the top 25% of the range have a red background and in the bottom 25% of the range have a green background. The red background is not used when the min value is within 80% of the max value.
| dbms | 256us | 1ms | 4ms | 16ms | 64ms | 256ms | 1s | 4s | 16s | gt | max |
|---|---|---|---|---|---|---|---|---|---|---|---|
| my5621_rel.cz10a_bee | 93.392 | 6.599 | 0.008 | 0.002 | 0.016 | ||||||
| my5631_rel.cz10a_bee | 92.745 | 7.245 | 0.009 | 0.001 | nonzero | 0.017 | |||||
| my5641_rel.cz10a_bee | 93.194 | 6.797 | 0.008 | 0.001 | 0.010 | ||||||
| my5651_rel.cz10a_bee | 92.595 | 7.396 | 0.008 | 0.001 | 0.012 |
Insert response time histogram: each cell has the percentage of responses that take <= the time in the header and max is the max response time in seconds. For max values in the top 25% of the range have a red background and in the bottom 25% of the range have a green background. The red background is not used when the min value is within 80% of the max value.
| dbms | 256us | 1ms | 4ms | 16ms | 64ms | 256ms | 1s | 4s | 16s | gt | max |
|---|---|---|---|---|---|---|---|---|---|---|---|
| my5621_rel.cz10a_bee | 93.325 | 6.497 | 0.178 | 0.040 | |||||||
| my5631_rel.cz10a_bee | 91.333 | 8.381 | 0.286 | 0.039 | |||||||
| my5641_rel.cz10a_bee | 92.222 | 7.636 | 0.142 | 0.045 | |||||||
| my5651_rel.cz10a_bee | 89.864 | 9.836 | 0.300 | 0.040 |
Delete response time histogram: each cell has the percentage of responses that take <= the time in the header and max is the max response time in seconds. For max values in the top 25% of the range have a red background and in the bottom 25% of the range have a green background. The red background is not used when the min value is within 80% of the max value.
| dbms | 256us | 1ms | 4ms | 16ms | 64ms | 256ms | 1s | 4s | 16s | gt | max |
|---|---|---|---|---|---|---|---|---|---|---|---|
| my5621_rel.cz10a_bee | 93.903 | 5.956 | 0.142 | 0.037 | |||||||
| my5631_rel.cz10a_bee | 92.900 | 6.914 | 0.186 | 0.040 | |||||||
| my5641_rel.cz10a_bee | 93.542 | 6.356 | 0.103 | 0.045 | |||||||
| my5651_rel.cz10a_bee | 91.600 | 8.181 | 0.219 | 0.038 |
Performance metrics for the DBMS listed above. Some are normalized by throughput, others are not. Legend for results is here.
ips	qps	rps	rmbps	wps	wmbps	rpq	rkbpq	wpi	wkbpi	csps	cpups	cspq	cpupq	dbgb1	dbgb2	rss	maxop	p50	p99	tag
998	4607	33	0.1	307.4	10.2	0.007	0.028	0.308	10.496	20050	14.9	4.352	259	6.2	22.7	6.8	0.016	4542	4283	my5621_rel.cz10a_bee
998	4553	33	0.1	705.7	22.2	0.007	0.029	0.707	22.804	21108	15.0	4.636	264	6.1	22.6	6.8	0.017	4495	4220	my5631_rel.cz10a_bee
995	4572	33	0.1	565.9	18.0	0.007	0.029	0.569	18.544	20941	15.2	4.580	266	6.2	22.7	6.8	0.010	4509	4171	my5641_rel.cz10a_bee
998	4528	33	0.1	1353.4	41.7	0.007	0.029	1.356	42.773	23057	15.3	5.093	270	6.2	22.7	6.8	0.012	4462	4206	my5651_rel.cz10a_bee
l.i0
l.i0: load without secondary indexes
Performance metrics for all DBMS, not just the ones listed above. Some are normalized by throughput, others are not. Legend for results is here.
ips	qps	rps	rmbps	wps	wmbps	rpq	rkbpq	wpi	wkbpi	csps	cpups	cspq	cpupq	dbgb1	dbgb2	rss	maxop	p50	p99	tag
103448	0	905	3.5	317.3	31.2	0.009	0.035	0.003	0.309	12308	22.8	0.119	18	2.0	18.5	2.5	0.100	104188	88828	my5621_rel.cz10a_bee
98361	0	854	3.3	300.4	29.8	0.009	0.035	0.003	0.310	11975	22.3	0.122	18	2.0	18.5	2.6	0.098	99116	87333	my5631_rel.cz10a_bee
98039	0	857	3.3	299.9	29.5	0.009	0.035	0.003	0.309	11906	22.5	0.121	18	2.0	18.5	2.6	0.100	98410	84327	my5641_rel.cz10a_bee
100000	0	878	3.4	305.1	30.4	0.009	0.035	0.003	0.311	12305	22.5	0.123	18	2.0	18.5	2.7	0.097	100604	87340	my5651_rel.cz10a_bee
l.x
l.x: create secondary indexes
Performance metrics for all DBMS, not just the ones listed above. Some are normalized by throughput, others are not. Legend for results is here.
ips	qps	rps	rmbps	wps	wmbps	rpq	rkbpq	wpi	wkbpi	csps	cpups	cspq	cpupq	dbgb1	dbgb2	rss	maxop	p50	p99	tag
101352	0	15	0.1	855.6	105.4	0.000	0.001	0.008	1.065	2393	11.2	0.024	9	4.2	20.7	4.6	0.002	NA	NA	my5621_rel.cz10a_bee
102740	0	12	0.0	861.7	107.4	0.000	0.000	0.008	1.071	2438	11.4	0.024	9	4.2	20.7	4.6	0.002	NA	NA	my5631_rel.cz10a_bee
100000	0	13	0.1	831.1	103.5	0.000	0.001	0.008	1.060	2328	11.4	0.023	9	4.2	20.7	4.9	0.002	NA	NA	my5641_rel.cz10a_bee
107914	0	11	0.0	858.6	111.7	0.000	0.000	0.008	1.059	2532	11.6	0.023	9	4.2	20.7	4.8	0.002	NA	NA	my5651_rel.cz10a_bee
l.i1
l.i1: continue load after secondary indexes created with 50 inserts per transaction
Performance metrics for all DBMS, not just the ones listed above. Some are normalized by throughput, others are not. Legend for results is here.
ips	qps	rps	rmbps	wps	wmbps	rpq	rkbpq	wpi	wkbpi	csps	cpups	cspq	cpupq	dbgb1	dbgb2	rss	maxop	p50	p99	tag
18527	0	625	2.4	1842.3	81.7	0.034	0.135	0.099	4.516	15706	34.5	0.848	149	6.2	22.7	6.8	0.109	19579	5894	my5621_rel.cz10a_bee
17969	0	601	2.3	1794.6	79.4	0.033	0.134	0.100	4.527	15532	34.2	0.864	152	6.1	22.6	6.8	0.110	19029	5547	my5631_rel.cz10a_bee
17905	0	602	2.3	1794.8	79.4	0.034	0.134	0.100	4.543	15492	34.3	0.865	153	6.1	22.6	6.8	0.103	18979	5394	my5641_rel.cz10a_bee
18124	0	611	2.4	1818.4	80.4	0.034	0.135	0.100	4.545	15570	34.4	0.859	152	6.2	22.7	6.8	0.101	19229	5644	my5651_rel.cz10a_bee
l.i2
l.i2: continue load after secondary indexes created with 5 inserts per transaction
Performance metrics for all DBMS, not just the ones listed above. Some are normalized by throughput, others are not. Legend for results is here.
ips	qps	rps	rmbps	wps	wmbps	rpq	rkbpq	wpi	wkbpi	csps	cpups	cspq	cpupq	dbgb1	dbgb2	rss	maxop	p50	p99	tag
12165	0	2192	8.6	1242.9	51.8	0.180	0.721	0.102	4.360	58349	36.3	4.796	239	6.2	22.7	6.8	0.079	12202	10818	my5621_rel.cz10a_bee
11962	0	2153	8.4	1259.6	52.0	0.180	0.720	0.105	4.454	57575	36.3	4.813	243	6.1	22.6	6.8	0.049	11991	10886	my5631_rel.cz10a_bee
11919	0	2146	8.4	1251.2	51.7	0.180	0.720	0.105	4.441	57422	36.3	4.818	244	6.2	22.7	6.8	0.049	11947	10788	my5641_rel.cz10a_bee
12106	0	2177	8.5	1192.4	50.2	0.180	0.719	0.098	4.242	57886	36.2	4.781	239	6.2	22.7	6.8	0.067	12100	10983	my5651_rel.cz10a_bee
qr100.L1
qr100.L1: range queries with 100 insert/s per client
Performance metrics for all DBMS, not just the ones listed above. Some are normalized by throughput, others are not. Legend for results is here.
ips	qps	rps	rmbps	wps	wmbps	rpq	rkbpq	wpi	wkbpi	csps	cpups	cspq	cpupq	dbgb1	dbgb2	rss	maxop	p50	p99	tag
100	5688	4	0.0	524.2	15.7	0.001	0.003	5.253	160.667	23529	13.0	4.136	183	6.2	22.7	6.8	0.017	5642	5466	my5621_rel.cz10a_bee
100	5577	4	0.0	527.1	15.8	0.001	0.003	5.282	161.639	23156	13.1	4.152	188	6.1	22.6	6.8	0.022	5532	5370	my5631_rel.cz10a_bee
100	5592	4	0.0	517.6	15.5	0.001	0.003	5.187	158.930	23167	13.1	4.143	187	6.2	22.7	6.8	0.017	5549	5386	my5641_rel.cz10a_bee
100	5570	4	0.0	545.9	16.3	0.001	0.003	5.475	167.560	23178	13.2	4.161	190	6.2	22.7	6.8	0.023	5530	5354	my5651_rel.cz10a_bee
qp100.L2
qp100.L2: point queries with 100 insert/s per client
Performance metrics for all DBMS, not just the ones listed above. Some are normalized by throughput, others are not. Legend for results is here.
ips	qps	rps	rmbps	wps	wmbps	rpq	rkbpq	wpi	wkbpi	csps	cpups	cspq	cpupq	dbgb1	dbgb2	rss	maxop	p50	p99	tag
100	4652	4	0.0	560.8	16.8	0.001	0.004	5.625	172.263	20635	13.1	4.436	225	6.2	22.7	6.8	0.018	4619	4350	my5621_rel.cz10a_bee
100	4558	4	0.0	533.0	15.9	0.001	0.004	5.346	163.477	20220	13.7	4.436	240	6.1	22.6	6.8	0.022	4519	4253	my5631_rel.cz10a_bee
100	4563	4	0.0	528.8	15.8	0.001	0.004	5.304	162.211	20225	13.5	4.432	237	6.2	22.7	6.8	0.017	4507	4242	my5641_rel.cz10a_bee
100	4574	4	0.0	520.4	15.5	0.001	0.004	5.220	159.592	20225	13.2	4.421	231	6.2	22.7	6.8	0.017	4554	4286	my5651_rel.cz10a_bee
qr500.L3
qr500.L3: range queries with 500 insert/s per client
Performance metrics for all DBMS, not just the ones listed above. Some are normalized by throughput, others are not. Legend for results is here.
ips	qps	rps	rmbps	wps	wmbps	rpq	rkbpq	wpi	wkbpi	csps	cpups	cspq	cpupq	dbgb1	dbgb2	rss	maxop	p50	p99	tag
499	5671	17	0.1	287.1	9.1	0.003	0.012	0.576	18.720	22906	13.5	4.039	190	6.2	22.7	6.8	0.016	5629	5455	my5621_rel.cz10a_bee
499	5598	17	0.1	116.1	4.0	0.003	0.012	0.233	8.157	22090	13.5	3.946	193	6.1	22.6	6.8	0.016	5546	5370	my5631_rel.cz10a_bee
499	5601	17	0.1	69.5	2.6	0.003	0.012	0.139	5.274	22041	13.7	3.935	196	6.2	22.7	6.8	0.016	5562	5370	my5641_rel.cz10a_bee
499	5547	17	0.1	149.8	5.0	0.003	0.012	0.300	10.235	21975	13.4	3.962	193	6.2	22.7	6.8	0.015	5533	5419	my5651_rel.cz10a_bee
qp500.L4
qp500.L4: point queries with 500 insert/s per client
Performance metrics for all DBMS, not just the ones listed above. Some are normalized by throughput, others are not. Legend for results is here.
ips	qps	rps	rmbps	wps	wmbps	rpq	rkbpq	wpi	wkbpi	csps	cpups	cspq	cpupq	dbgb1	dbgb2	rss	maxop	p50	p99	tag
499	4641	17	0.1	134.4	4.5	0.004	0.014	0.269	9.262	19376	13.9	4.175	240	6.2	22.7	6.8	0.014	4586	4282	my5621_rel.cz10a_bee
499	4518	17	0.1	312.2	9.9	0.004	0.015	0.626	20.291	19488	13.7	4.314	243	6.1	22.6	6.8	0.011	4477	4218	my5631_rel.cz10a_bee
498	4605	17	0.1	314.3	9.9	0.004	0.014	0.631	20.392	19998	14.4	4.343	250	6.2	22.7	6.8	0.010	4539	4235	my5641_rel.cz10a_bee
495	4507	17	0.1	265.5	8.4	0.004	0.015	0.536	17.479	19407	13.9	4.306	247	6.2	22.7	6.8	0.012	4491	4219	my5651_rel.cz10a_bee
qr1000.L5
qr1000.L5: range queries with 1000 insert/s per client
Performance metrics for all DBMS, not just the ones listed above. Some are normalized by throughput, others are not. Legend for results is here.
ips	qps	rps	rmbps	wps	wmbps	rpq	rkbpq	wpi	wkbpi	csps	cpups	cspq	cpupq	dbgb1	dbgb2	rss	maxop	p50	p99	tag
997	5680	33	0.1	419.4	13.6	0.006	0.023	0.421	13.981	23564	14.7	4.149	207	6.2	22.7	6.8	0.017	5627	5438	my5621_rel.cz10a_bee
997	5562	33	0.1	272.2	9.2	0.006	0.024	0.273	9.414	22689	14.7	4.079	211	6.1	22.6	6.8	0.014	5516	5353	my5631_rel.cz10a_bee
997	5596	33	0.1	263.9	8.9	0.006	0.024	0.265	9.164	22951	15.0	4.101	214	6.2	22.7	6.8	0.021	5546	5324	my5641_rel.cz10a_bee
998	5573	33	0.1	1275.3	39.3	0.006	0.024	1.278	40.351	25905	15.1	4.648	217	6.2	22.7	6.8	0.023	5530	5263	my5651_rel.cz10a_bee
qp1000.L6
qp1000.L6: point queries with 1000 insert/s per client
Performance metrics for all DBMS, not just the ones listed above. Some are normalized by throughput, others are not. Legend for results is here.
ips	qps	rps	rmbps	wps	wmbps	rpq	rkbpq	wpi	wkbpi	csps	cpups	cspq	cpupq	dbgb1	dbgb2	rss	maxop	p50	p99	tag
998	4607	33	0.1	307.4	10.2	0.007	0.028	0.308	10.496	20050	14.9	4.352	259	6.2	22.7	6.8	0.016	4542	4283	my5621_rel.cz10a_bee
998	4553	33	0.1	705.7	22.2	0.007	0.029	0.707	22.804	21108	15.0	4.636	264	6.1	22.6	6.8	0.017	4495	4220	my5631_rel.cz10a_bee
995	4572	33	0.1	565.9	18.0	0.007	0.029	0.569	18.544	20941	15.2	4.580	266	6.2	22.7	6.8	0.010	4509	4171	my5641_rel.cz10a_bee
998	4528	33	0.1	1353.4	41.7	0.007	0.029	1.356	42.773	23057	15.3	5.093	270	6.2	22.7	6.8	0.012	4462	4206	my5651_rel.cz10a_bee
l.i0
- l.i0: load without secondary indexes
- Legend for results is here.
- Each entry lists the percentage of responses that fit in that bucket (slower than max time for previous bucket, faster than min time for next bucket).
Insert response time histogram
256us	1ms	4ms	16ms	64ms	256ms	1s	4s	16s	gt	max	tag
0.000	94.239	5.643	0.110	0.004	0.003	0.000	0.000	0.000	0.000	0.100	my5621_rel.cz10a_bee
0.000	87.819	12.059	0.117	0.002	0.003	0.000	0.000	0.000	0.000	0.098	my5631_rel.cz10a_bee
0.000	85.496	14.381	0.119	0.001	0.003	0.000	0.000	0.000	0.000	0.100	my5641_rel.cz10a_bee
0.000	90.958	8.926	0.111	0.001	0.003	0.000	0.000	0.000	0.000	0.097	my5651_rel.cz10a_bee
l.x
- l.x: create secondary indexes
- Legend for results is here.
- Each entry lists the percentage of responses that fit in that bucket (slower than max time for previous bucket, faster than min time for next bucket).
TODO - determine whether there is data for create index response time
l.i1
- l.i1: continue load after secondary indexes created with 50 inserts per transaction
- Legend for results is here.
- Each entry lists the percentage of responses that fit in that bucket (slower than max time for previous bucket, faster than min time for next bucket).
Insert response time histogram
256us	1ms	4ms	16ms	64ms	256ms	1s	4s	16s	gt	max	tag
0.000	0.000	95.085	4.732	0.182	0.001	0.000	0.000	0.000	0.000	0.109	my5621_rel.cz10a_bee
0.000	0.000	94.656	5.163	0.180	nonzero	0.000	0.000	0.000	0.000	0.110	my5631_rel.cz10a_bee
0.000	0.000	94.592	5.229	0.178	nonzero	0.000	0.000	0.000	0.000	0.103	my5641_rel.cz10a_bee
0.000	0.000	94.834	4.986	0.179	nonzero	0.000	0.000	0.000	0.000	0.101	my5651_rel.cz10a_bee
Delete response time histogram
256us	1ms	4ms	16ms	64ms	256ms	1s	4s	16s	gt	max	tag
0.000	0.000	96.362	3.476	0.161	0.001	0.000	0.000	0.000	0.000	0.076	my5621_rel.cz10a_bee
0.000	0.000	96.240	3.607	0.152	0.000	0.000	0.000	0.000	0.000	0.062	my5631_rel.cz10a_bee
0.000	0.000	96.139	3.714	0.147	0.000	0.000	0.000	0.000	0.000	0.061	my5641_rel.cz10a_bee
0.000	0.000	96.295	3.556	0.149	nonzero	0.000	0.000	0.000	0.000	0.073	my5651_rel.cz10a_bee
l.i2
- l.i2: continue load after secondary indexes created with 5 inserts per transaction
- Legend for results is here.
- Each entry lists the percentage of responses that fit in that bucket (slower than max time for previous bucket, faster than min time for next bucket).
Insert response time histogram
256us	1ms	4ms	16ms	64ms	256ms	1s	4s	16s	gt	max	tag
13.649	86.108	0.040	0.200	0.001	nonzero	0.000	0.000	0.000	0.000	0.079	my5621_rel.cz10a_bee
10.344	89.396	0.052	0.207	0.001	0.000	0.000	0.000	0.000	0.000	0.049	my5631_rel.cz10a_bee
9.774	89.966	0.050	0.209	0.001	0.000	0.000	0.000	0.000	0.000	0.049	my5641_rel.cz10a_bee
10.521	89.230	0.048	0.200	0.001	nonzero	0.000	0.000	0.000	0.000	0.067	my5651_rel.cz10a_bee
Delete response time histogram
256us	1ms	4ms	16ms	64ms	256ms	1s	4s	16s	gt	max	tag
13.822	85.943	0.033	0.200	0.001	nonzero	0.000	0.000	0.000	0.000	0.079	my5621_rel.cz10a_bee
13.423	86.334	0.035	0.206	0.001	0.000	0.000	0.000	0.000	0.000	0.049	my5631_rel.cz10a_bee
12.547	87.208	0.035	0.209	0.001	0.000	0.000	0.000	0.000	0.000	0.048	my5641_rel.cz10a_bee
13.917	85.849	0.033	0.200	0.001	nonzero	0.000	0.000	0.000	0.000	0.068	my5651_rel.cz10a_bee
qr100.L1
- qr100.L1: range queries with 100 insert/s per client
- Legend for results is here.
- Each entry lists the percentage of responses that fit in that bucket (slower than max time for previous bucket, faster than min time for next bucket).
Query response time histogram
256us	1ms	4ms	16ms	64ms	256ms	1s	4s	16s	gt	max	tag
96.549	3.445	0.002	0.004	nonzero	0.000	0.000	0.000	0.000	0.000	0.017	my5621_rel.cz10a_bee
96.320	3.674	0.002	0.004	nonzero	0.000	0.000	0.000	0.000	0.000	0.022	my5631_rel.cz10a_bee
96.317	3.677	0.002	0.003	nonzero	0.000	0.000	0.000	0.000	0.000	0.017	my5641_rel.cz10a_bee
96.223	3.771	0.003	0.004	nonzero	0.000	0.000	0.000	0.000	0.000	0.023	my5651_rel.cz10a_bee
Insert response time histogram
256us	1ms	4ms	16ms	64ms	256ms	1s	4s	16s	gt	max	tag
0.000	0.000	42.806	52.806	4.389	0.000	0.000	0.000	0.000	0.000	0.038	my5621_rel.cz10a_bee
0.000	0.000	42.778	51.694	5.528	0.000	0.000	0.000	0.000	0.000	0.040	my5631_rel.cz10a_bee
0.000	0.000	44.750	52.111	3.139	0.000	0.000	0.000	0.000	0.000	0.037	my5641_rel.cz10a_bee
0.000	0.000	41.222	53.556	5.222	0.000	0.000	0.000	0.000	0.000	0.033	my5651_rel.cz10a_bee
Delete response time histogram
256us	1ms	4ms	16ms	64ms	256ms	1s	4s	16s	gt	max	tag
0.000	0.000	42.806	54.972	2.222	0.000	0.000	0.000	0.000	0.000	0.031	my5621_rel.cz10a_bee
0.000	0.000	41.611	55.639	2.750	0.000	0.000	0.000	0.000	0.000	0.033	my5631_rel.cz10a_bee
0.000	0.000	44.889	53.694	1.417	0.000	0.000	0.000	0.000	0.000	0.029	my5641_rel.cz10a_bee
0.000	0.000	41.444	56.167	2.389	0.000	0.000	0.000	0.000	0.000	0.042	my5651_rel.cz10a_bee
qp100.L2
- qp100.L2: point queries with 100 insert/s per client
- Legend for results is here.
- Each entry lists the percentage of responses that fit in that bucket (slower than max time for previous bucket, faster than min time for next bucket).
Query response time histogram
256us	1ms	4ms	16ms	64ms	256ms	1s	4s	16s	gt	max	tag
94.712	5.283	0.003	0.002	nonzero	0.000	0.000	0.000	0.000	0.000	0.018	my5621_rel.cz10a_bee
93.673	6.322	0.003	0.002	nonzero	0.000	0.000	0.000	0.000	0.000	0.022	my5631_rel.cz10a_bee
93.887	6.109	0.003	0.002	nonzero	0.000	0.000	0.000	0.000	0.000	0.017	my5641_rel.cz10a_bee
94.197	5.797	0.003	0.003	nonzero	0.000	0.000	0.000	0.000	0.000	0.017	my5651_rel.cz10a_bee
Insert response time histogram
256us	1ms	4ms	16ms	64ms	256ms	1s	4s	16s	gt	max	tag
0.000	0.000	49.250	47.833	2.917	0.000	0.000	0.000	0.000	0.000	0.040	my5621_rel.cz10a_bee
0.000	0.000	48.972	47.944	3.083	0.000	0.000	0.000	0.000	0.000	0.044	my5631_rel.cz10a_bee
0.000	0.000	49.111	47.500	3.389	0.000	0.000	0.000	0.000	0.000	0.041	my5641_rel.cz10a_bee
0.000	0.000	46.389	48.861	4.750	0.000	0.000	0.000	0.000	0.000	0.052	my5651_rel.cz10a_bee
Delete response time histogram
256us	1ms	4ms	16ms	64ms	256ms	1s	4s	16s	gt	max	tag
0.000	0.000	48.361	49.806	1.833	0.000	0.000	0.000	0.000	0.000	0.037	my5621_rel.cz10a_bee
0.000	0.000	48.194	50.222	1.583	0.000	0.000	0.000	0.000	0.000	0.033	my5631_rel.cz10a_bee
0.000	0.000	48.417	49.667	1.917	0.000	0.000	0.000	0.000	0.000	0.037	my5641_rel.cz10a_bee
0.000	0.000	44.750	53.194	2.056	0.000	0.000	0.000	0.000	0.000	0.033	my5651_rel.cz10a_bee
qr500.L3
- qr500.L3: range queries with 500 insert/s per client
- Legend for results is here.
- Each entry lists the percentage of responses that fit in that bucket (slower than max time for previous bucket, faster than min time for next bucket).
Query response time histogram
256us	1ms	4ms	16ms	64ms	256ms	1s	4s	16s	gt	max	tag
96.529	3.466	0.002	0.003	0.000	0.000	0.000	0.000	0.000	0.000	0.016	my5621_rel.cz10a_bee
96.282	3.713	0.002	0.003	0.000	0.000	0.000	0.000	0.000	0.000	0.016	my5631_rel.cz10a_bee
96.289	3.706	0.002	0.003	nonzero	0.000	0.000	0.000	0.000	0.000	0.016	my5641_rel.cz10a_bee
95.586	4.409	0.002	0.003	0.000	0.000	0.000	0.000	0.000	0.000	0.015	my5651_rel.cz10a_bee
Insert response time histogram
256us	1ms	4ms	16ms	64ms	256ms	1s	4s	16s	gt	max	tag
0.000	0.000	89.550	10.178	0.272	0.000	0.000	0.000	0.000	0.000	0.035	my5621_rel.cz10a_bee
0.000	0.000	89.650	10.183	0.167	0.000	0.000	0.000	0.000	0.000	0.035	my5631_rel.cz10a_bee
0.000	0.000	89.689	10.194	0.117	0.000	0.000	0.000	0.000	0.000	0.033	my5641_rel.cz10a_bee
0.000	0.000	89.739	10.128	0.133	0.000	0.000	0.000	0.000	0.000	0.029	my5651_rel.cz10a_bee
Delete response time histogram
256us	1ms	4ms	16ms	64ms	256ms	1s	4s	16s	gt	max	tag
0.000	0.000	89.994	9.839	0.167	0.000	0.000	0.000	0.000	0.000	0.033	my5621_rel.cz10a_bee
0.000	0.000	90.161	9.694	0.144	0.000	0.000	0.000	0.000	0.000	0.025	my5631_rel.cz10a_bee
0.000	0.000	90.339	9.589	0.072	0.000	0.000	0.000	0.000	0.000	0.042	my5641_rel.cz10a_bee
0.000	0.000	90.278	9.644	0.078	0.000	0.000	0.000	0.000	0.000	0.024	my5651_rel.cz10a_bee
qp500.L4
- qp500.L4: point queries with 500 insert/s per client
- Legend for results is here.
- Each entry lists the percentage of responses that fit in that bucket (slower than max time for previous bucket, faster than min time for next bucket).
Query response time histogram
256us	1ms	4ms	16ms	64ms	256ms	1s	4s	16s	gt	max	tag
93.944	6.048	0.006	0.002	0.000	0.000	0.000	0.000	0.000	0.000	0.014	my5621_rel.cz10a_bee
93.108	6.884	0.006	0.002	0.000	0.000	0.000	0.000	0.000	0.000	0.011	my5631_rel.cz10a_bee
93.923	6.070	0.006	0.001	0.000	0.000	0.000	0.000	0.000	0.000	0.010	my5641_rel.cz10a_bee
93.269	6.724	0.005	0.001	0.000	0.000	0.000	0.000	0.000	0.000	0.012	my5651_rel.cz10a_bee
Insert response time histogram
256us	1ms	4ms	16ms	64ms	256ms	1s	4s	16s	gt	max	tag
0.000	0.000	89.161	10.706	0.133	0.000	0.000	0.000	0.000	0.000	0.023	my5621_rel.cz10a_bee
0.000	0.000	89.206	10.589	0.206	0.000	0.000	0.000	0.000	0.000	0.031	my5631_rel.cz10a_bee
0.000	0.000	88.722	11.172	0.106	0.000	0.000	0.000	0.000	0.000	0.022	my5641_rel.cz10a_bee
0.000	0.000	88.778	11.083	0.139	0.000	0.000	0.000	0.000	0.000	0.024	my5651_rel.cz10a_bee
Delete response time histogram
256us	1ms	4ms	16ms	64ms	256ms	1s	4s	16s	gt	max	tag
0.000	0.000	89.494	10.489	0.017	0.000	0.000	0.000	0.000	0.000	0.022	my5621_rel.cz10a_bee
0.000	0.000	89.978	9.911	0.111	0.000	0.000	0.000	0.000	0.000	0.027	my5631_rel.cz10a_bee
0.000	0.000	89.761	10.222	0.017	0.000	0.000	0.000	0.000	0.000	0.017	my5641_rel.cz10a_bee
0.000	0.000	89.206	10.739	0.056	0.000	0.000	0.000	0.000	0.000	0.028	my5651_rel.cz10a_bee
qr1000.L5
- qr1000.L5: range queries with 1000 insert/s per client
- Legend for results is here.
- Each entry lists the percentage of responses that fit in that bucket (slower than max time for previous bucket, faster than min time for next bucket).
Query response time histogram
256us	1ms	4ms	16ms	64ms	256ms	1s	4s	16s	gt	max	tag
96.436	3.558	0.003	0.003	nonzero	0.000	0.000	0.000	0.000	0.000	0.017	my5621_rel.cz10a_bee
95.937	4.058	0.003	0.003	0.000	0.000	0.000	0.000	0.000	0.000	0.014	my5631_rel.cz10a_bee
95.938	4.054	0.004	0.003	nonzero	0.000	0.000	0.000	0.000	0.000	0.021	my5641_rel.cz10a_bee
96.047	3.945	0.006	0.003	nonzero	0.000	0.000	0.000	0.000	0.000	0.023	my5651_rel.cz10a_bee
Insert response time histogram
256us	1ms	4ms	16ms	64ms	256ms	1s	4s	16s	gt	max	tag
0.000	0.000	93.236	6.625	0.139	0.000	0.000	0.000	0.000	0.000	0.041	my5621_rel.cz10a_bee
0.000	0.000	93.389	6.544	0.067	0.000	0.000	0.000	0.000	0.000	0.045	my5631_rel.cz10a_bee
0.000	0.000	91.939	7.900	0.161	0.000	0.000	0.000	0.000	0.000	0.039	my5641_rel.cz10a_bee
0.000	0.000	90.511	9.144	0.344	0.000	0.000	0.000	0.000	0.000	0.041	my5651_rel.cz10a_bee
Delete response time histogram
256us	1ms	4ms	16ms	64ms	256ms	1s	4s	16s	gt	max	tag
0.000	0.000	93.753	6.147	0.100	0.000	0.000	0.000	0.000	0.000	0.040	my5621_rel.cz10a_bee
0.000	0.000	94.183	5.783	0.033	0.000	0.000	0.000	0.000	0.000	0.045	my5631_rel.cz10a_bee
0.000	0.000	92.797	7.078	0.125	0.000	0.000	0.000	0.000	0.000	0.040	my5641_rel.cz10a_bee
0.000	0.000	92.183	7.550	0.267	0.000	0.000	0.000	0.000	0.000	0.041	my5651_rel.cz10a_bee
qp1000.L6
- qp1000.L6: point queries with 1000 insert/s per client
- Legend for results is here.
- Each entry lists the percentage of responses that fit in that bucket (slower than max time for previous bucket, faster than min time for next bucket).
Query response time histogram
256us	1ms	4ms	16ms	64ms	256ms	1s	4s	16s	gt	max	tag
93.392	6.599	0.008	0.002	0.000	0.000	0.000	0.000	0.000	0.000	0.016	my5621_rel.cz10a_bee
92.745	7.245	0.009	0.001	nonzero	0.000	0.000	0.000	0.000	0.000	0.017	my5631_rel.cz10a_bee
93.194	6.797	0.008	0.001	0.000	0.000	0.000	0.000	0.000	0.000	0.010	my5641_rel.cz10a_bee
92.595	7.396	0.008	0.001	0.000	0.000	0.000	0.000	0.000	0.000	0.012	my5651_rel.cz10a_bee
Insert response time histogram
256us	1ms	4ms	16ms	64ms	256ms	1s	4s	16s	gt	max	tag
0.000	0.000	93.325	6.497	0.178	0.000	0.000	0.000	0.000	0.000	0.040	my5621_rel.cz10a_bee
0.000	0.000	91.333	8.381	0.286	0.000	0.000	0.000	0.000	0.000	0.039	my5631_rel.cz10a_bee
0.000	0.000	92.222	7.636	0.142	0.000	0.000	0.000	0.000	0.000	0.045	my5641_rel.cz10a_bee
0.000	0.000	89.864	9.836	0.300	0.000	0.000	0.000	0.000	0.000	0.040	my5651_rel.cz10a_bee
Delete response time histogram
256us	1ms	4ms	16ms	64ms	256ms	1s	4s	16s	gt	max	tag
0.000	0.000	93.903	5.956	0.142	0.000	0.000	0.000	0.000	0.000	0.037	my5621_rel.cz10a_bee
0.000	0.000	92.900	6.914	0.186	0.000	0.000	0.000	0.000	0.000	0.040	my5631_rel.cz10a_bee
0.000	0.000	93.542	6.356	0.103	0.000	0.000	0.000	0.000	0.000	0.045	my5641_rel.cz10a_bee
0.000	0.000	91.600	8.181	0.219	0.000	0.000	0.000	0.000	0.000	0.038	my5651_rel.cz10a_bee