Introduction
This is a report for the insert benchmark with 4000M docs and 8 client(s). It is generated by scripts (bash, awk, sed) and Tufte might not be impressed. An overview of the insert benchmark is here and a short update is here. Below, by DBMS, I mean DBMS+version.config. An example is my8020.c10b40 where my means MySQL, 8020 is version 8.0.20 and c10b40 is the name for the configuration file.
The test server is a c2-standard-30 from GCP with 15 cores, hyperthreads disabled, Ubuntu 22.04 and XFS using SW RAID 0 over 4 local SSDs. The benchmark was run with 8 clients and there were 1, 2 or 3 connections per client. It uses 8 tables with a client per table. It loads 20M rows per table without secondary indexes, creates 3 secondary indexes per table, then inserts 50m+50m rows per table with a delete per insert to avoid growing the table. It then does 6 read+write tests for 1200s each that do queries as fast as possible with 100,100,500,500,1000,1000 inserts/s and the same for deletes/s per client concurrent with the queries. The database is cached in memory. Clients and the DBMS share one server. The per-database configs are in the per-database subdirectories here.
The tested DBMS are:
- fbmy5635_rel_221222.cza1_gcp_c2s30 - MyRocks 5.6.35 compiled on Dec 22, 2023 at git hash 4f3a57a1, RocksDB 8.7.0 at git hash 29005f0b, cza1_gcp_c2s30 config
- fbmy8028_rel_221222.cza1_gcp_c2s30 - MyRocks 8.0.28 compiled on Dec 22, 2023 at git hash 2ad105fc, RocksDB 8.7.0 at git hash 29005f0b, cza1_gcp_c2s30 config
- fbmy8028_rel_221222.cza1ps0_gcp_c2s30 - MyRocks 8.0.28 compiled on Dec 22, 2023 at git hash 2ad105fc, RocksDB 8.7.0 at git hash 29005f0b, cza1ps0_gcp_c2s30 config
- fbmy8032_rel_221222.cza1_gcp_c2s30 - MyRocks 8.0.32 compiled on Dec 22, 2023 at git hash 76707b44, RocksDB 8.7.0 at git hash 29005f0b, cza1_gcp_c2s30 config
- fbmy8032_rel_221222.cza1ps0_gcp_c2s30 - MyRocks 8.0.32 compiled on Dec 22, 2023 at git hash 76707b44, RocksDB 8.7.0 at git hash 29005f0b, cza1ps0_gcp_c2s30 config
Contents
- Summary
- l.i0: load without secondary indexes
- l.x: create secondary indexes
- l.i1: continue load after secondary indexes created with 50 inserts per transaction
- l.i2: continue load after secondary indexes created with 5 inserts per transaction
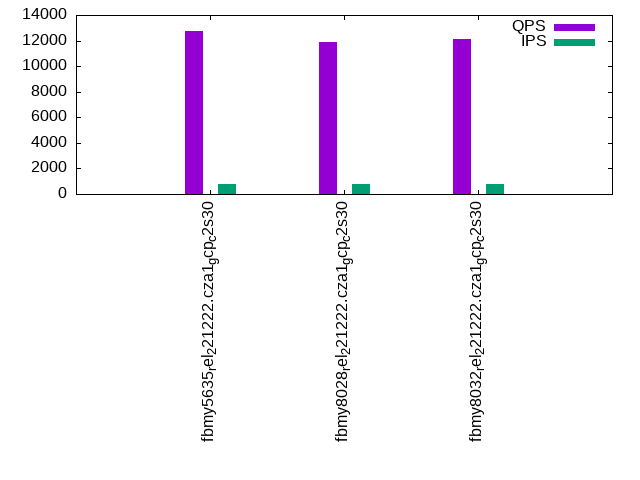
- qr100.L1: range queries with 100 insert/s per client
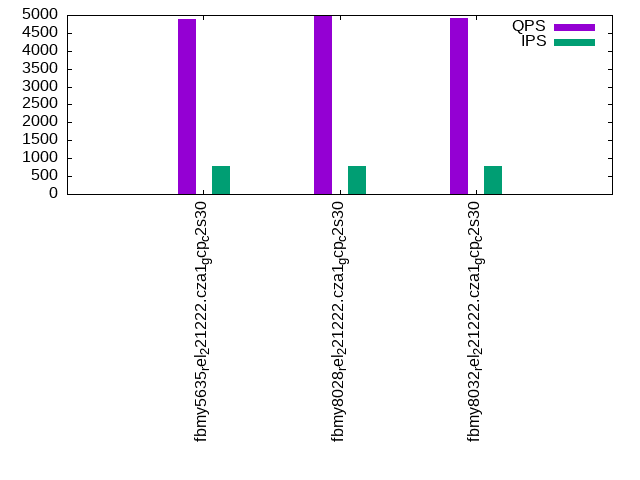
- qp100.L2: point queries with 100 insert/s per client
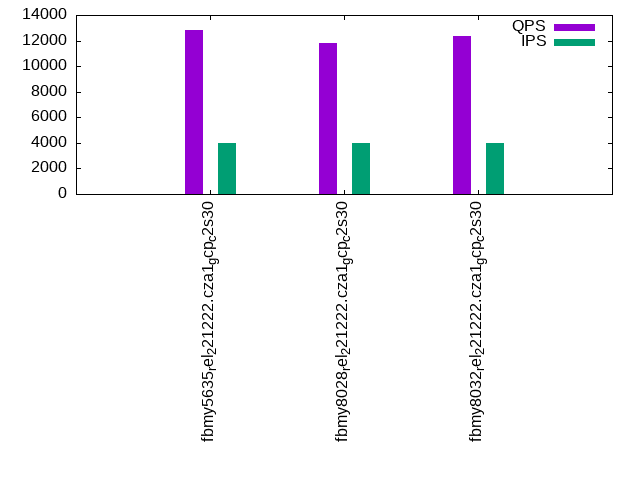
- qr500.L3: range queries with 500 insert/s per client
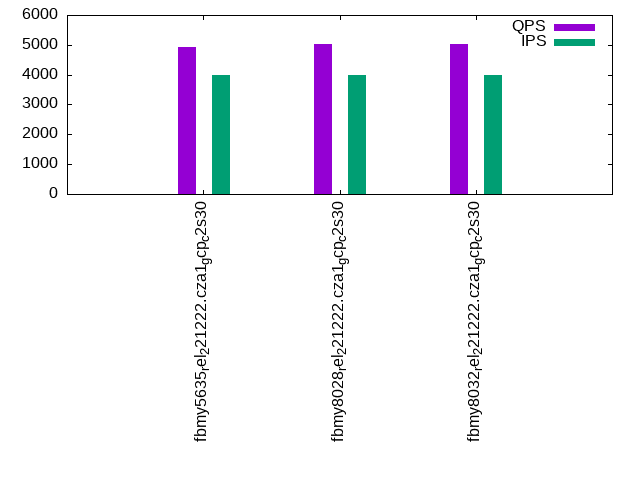
- qp500.L4: point queries with 500 insert/s per client
- qr1000.L5: range queries with 1000 insert/s per client
- qp1000.L6: point queries with 1000 insert/s per client
Summary
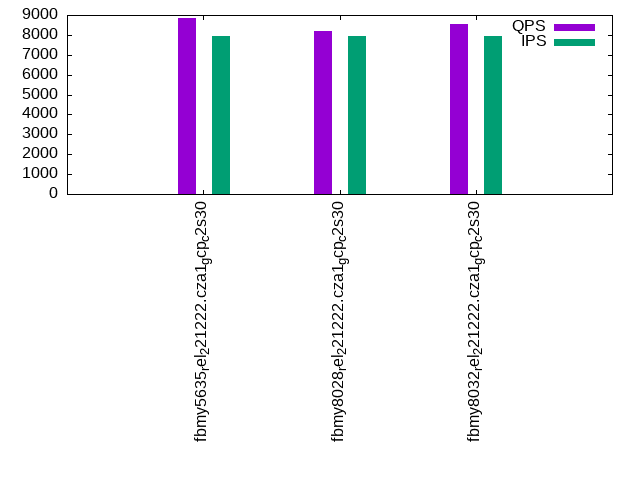
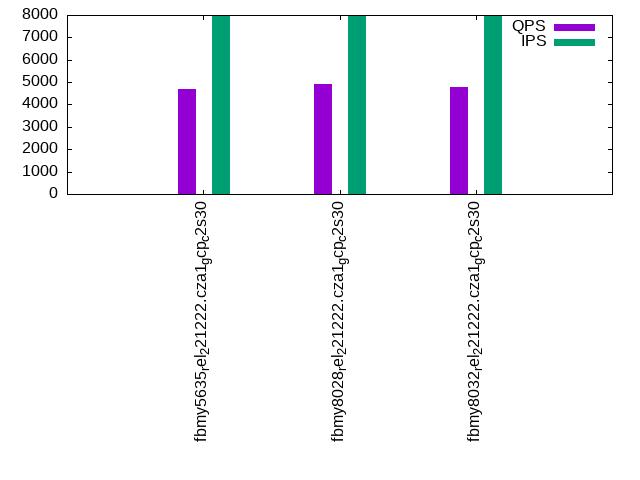
The numbers are inserts/s for l.i0, l.i1 and l.i2, indexed docs (or rows) /s for l.x and queries/s for qr100, qp100 thru qr1000, qp1000" The values are the average rate over the entire test for inserts (IPS) and queries (QPS). The range of values for IPS and QPS is split into 3 parts: bottom 25%, middle 50%, top 25%. Values in the bottom 25% have a red background, values in the top 25% have a green background and values in the middle have no color. A gray background is used for values that can be ignored because the DBMS did not sustain the target insert rate. Red backgrounds are not used when the minimum value is within 80% of the max value.
| dbms | l.i0 | l.x | l.i1 | l.i2 | qr100 | qp100 | qr500 | qp500 | qr1000 | qp1000 |
|---|---|---|---|---|---|---|---|---|---|---|
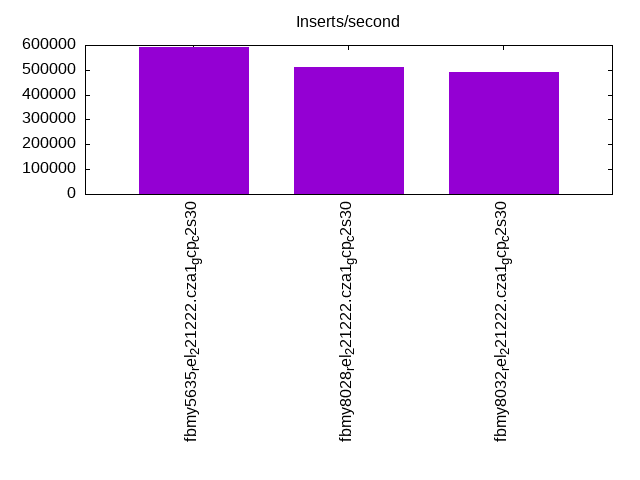
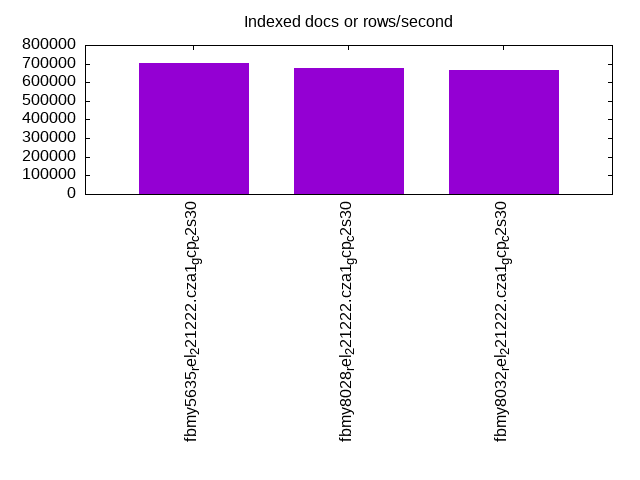
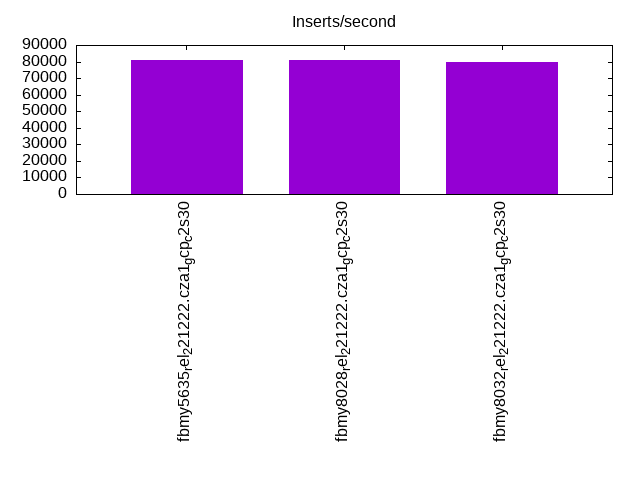
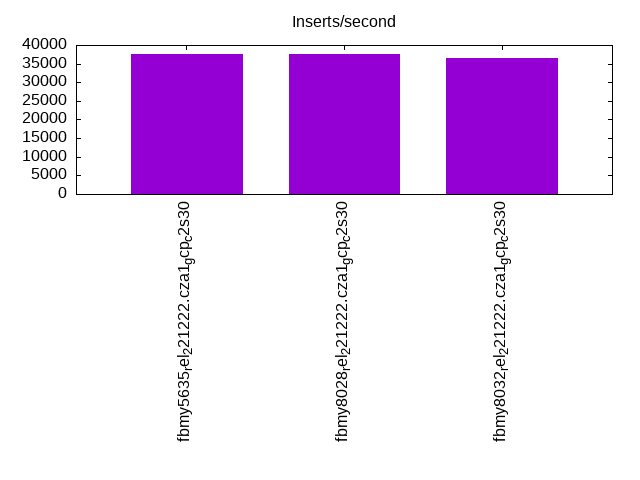
| fbmy5635_rel_221222.cza1_gcp_c2s30 | 593736 | 702617 | 81033 | 37488 | 12762 | 4875 | 12863 | 4922 | 8845 | 4714 |
| fbmy8028_rel_221222.cza1_gcp_c2s30 | 511117 | 679117 | 80849 | 37488 | 11858 | 4977 | 11846 | 5037 | 8217 | 4913 |
| fbmy8032_rel_221222.cza1_gcp_c2s30 | 489476 | 667223 | 79741 | 36513 | 12085 | 4928 | 12362 | 5036 | 8527 | 4802 |
This table has relative throughput, throughput for the DBMS relative to the DBMS in the first line, using the absolute throughput from the previous table. Values less than 0.95 have a yellow background. Values greater than 1.05 have a blue background.
| dbms | l.i0 | l.x | l.i1 | l.i2 | qr100 | qp100 | qr500 | qp500 | qr1000 | qp1000 |
|---|---|---|---|---|---|---|---|---|---|---|
| fbmy5635_rel_221222.cza1_gcp_c2s30 | 1.00 | 1.00 | 1.00 | 1.00 | 1.00 | 1.00 | 1.00 | 1.00 | 1.00 | 1.00 |
| fbmy8028_rel_221222.cza1_gcp_c2s30 | 0.86 | 0.97 | 1.00 | 1.00 | 0.93 | 1.02 | 0.92 | 1.02 | 0.93 | 1.04 |
| fbmy8032_rel_221222.cza1_gcp_c2s30 | 0.82 | 0.95 | 0.98 | 0.97 | 0.95 | 1.01 | 0.96 | 1.02 | 0.96 | 1.02 |
This lists the average rate of inserts/s for the tests that do inserts concurrent with queries. For such tests the query rate is listed in the table above. The read+write tests are setup so that the insert rate should match the target rate every second. Cells that are not at least 95% of the target have a red background to indicate a failure to satisfy the target.
| dbms | qr100.L1 | qp100.L2 | qr500.L3 | qp500.L4 | qr1000.L5 | qp1000.L6 |
|---|---|---|---|---|---|---|
| fbmy5635_rel_221222.cza1_gcp_c2s30 | 796 | 796 | 3978 | 3978 | 7960 | 7960 |
| fbmy8028_rel_221222.cza1_gcp_c2s30 | 796 | 796 | 3980 | 3978 | 7960 | 7960 |
| fbmy8032_rel_221222.cza1_gcp_c2s30 | 796 | 796 | 3978 | 3978 | 7965 | 7960 |
| target | 800 | 800 | 4000 | 4000 | 8000 | 8000 |
l.i0
l.i0: load without secondary indexes. Graphs for performance per 1-second interval are here.
Average throughput:
Insert response time histogram: each cell has the percentage of responses that take <= the time in the header and max is the max response time in seconds. For the max column values in the top 25% of the range have a red background and in the bottom 25% of the range have a green background. The red background is not used when the min value is within 80% of the max value.
| dbms | 256us | 1ms | 4ms | 16ms | 64ms | 256ms | 1s | 4s | 16s | gt | max |
|---|---|---|---|---|---|---|---|---|---|---|---|
| fbmy5635_rel_221222.cza1_gcp_c2s30 | 21.767 | 78.196 | 0.022 | 0.001 | 0.011 | 0.003 | 0.410 | ||||
| fbmy8028_rel_221222.cza1_gcp_c2s30 | 5.822 | 94.025 | 0.125 | 0.010 | 0.016 | 0.004 | 0.412 | ||||
| fbmy8032_rel_221222.cza1_gcp_c2s30 | 3.012 | 96.840 | 0.117 | 0.010 | 0.017 | 0.003 | 0.410 |
Performance metrics for the DBMS listed above. Some are normalized by throughput, others are not. Legend for results is here.
ips	qps	rps	rmbps	wps	wmbps	rpq	rkbpq	wpi	wkbpi	csps	cpups	cspq	cpupq	dbgb1	dbgb2	rss	maxop	p50	p99	tag
593736	0	0	0.0	558.6	129.4	0.000	0.000	0.001	0.223	78465	73.4	0.132	19	114.7	116.3	25.5	0.410	74519	47964	fbmy5635_rel_221222.cza1_gcp_c2s30
511117	0	0	0.0	517.7	120.4	0.000	0.000	0.001	0.241	65582	72.5	0.128	21	114.6	114.8	26.5	0.412	65253	42653	fbmy8028_rel_221222.cza1_gcp_c2s30
489476	0	0	0.0	500.1	112.8	0.000	0.000	0.001	0.236	62475	71.3	0.128	22	114.2	114.5	26.5	0.410	62432	41655	fbmy8032_rel_221222.cza1_gcp_c2s30
l.x
l.x: create secondary indexes.
Average throughput:
Performance metrics for the DBMS listed above. Some are normalized by throughput, others are not. Legend for results is here.
ips	qps	rps	rmbps	wps	wmbps	rpq	rkbpq	wpi	wkbpi	csps	cpups	cspq	cpupq	dbgb1	dbgb2	rss	maxop	p50	p99	tag
702617	0	638	118.1	280.4	84.4	0.001	0.172	0.000	0.123	2241	49.7	0.003	11	256.2	257.8	82.7	0.005	NA	NA	fbmy5635_rel_221222.cza1_gcp_c2s30
679117	0	836	146.4	273.6	80.7	0.001	0.221	0.000	0.122	2330	50.0	0.003	11	255.8	256.1	93.9	0.002	NA	NA	fbmy8028_rel_221222.cza1_gcp_c2s30
667223	0	788	140.0	266.0	77.6	0.001	0.215	0.000	0.119	2534	49.8	0.004	11	255.4	255.6	94.0	0.004	NA	NA	fbmy8032_rel_221222.cza1_gcp_c2s30
l.i1
l.i1: continue load after secondary indexes created with 50 inserts per transaction. Graphs for performance per 1-second interval are here.
Average throughput:
Insert response time histogram: each cell has the percentage of responses that take <= the time in the header and max is the max response time in seconds. For the max column values in the top 25% of the range have a red background and in the bottom 25% of the range have a green background. The red background is not used when the min value is within 80% of the max value.
| dbms | 256us | 1ms | 4ms | 16ms | 64ms | 256ms | 1s | 4s | 16s | gt | max |
|---|---|---|---|---|---|---|---|---|---|---|---|
| fbmy5635_rel_221222.cza1_gcp_c2s30 | 0.052 | 29.113 | 70.675 | 0.152 | 0.006 | 0.002 | 0.410 | ||||
| fbmy8028_rel_221222.cza1_gcp_c2s30 | 0.002 | 29.946 | 69.874 | 0.160 | 0.013 | 0.004 | 0.886 | ||||
| fbmy8032_rel_221222.cza1_gcp_c2s30 | 0.006 | 27.869 | 71.934 | 0.176 | 0.012 | 0.003 | 0.658 |
Delete response time histogram: each cell has the percentage of responses that take <= the time in the header and max is the max response time in seconds. For the max column values in the top 25% of the range have a red background and in the bottom 25% of the range have a green background. The red background is not used when the min value is within 80% of the max value.
| dbms | 256us | 1ms | 4ms | 16ms | 64ms | 256ms | 1s | 4s | 16s | gt | max |
|---|---|---|---|---|---|---|---|---|---|---|---|
| fbmy5635_rel_221222.cza1_gcp_c2s30 | 0.051 | 25.929 | 73.731 | 0.270 | 0.017 | 0.003 | 0.413 | ||||
| fbmy8028_rel_221222.cza1_gcp_c2s30 | 0.006 | 26.822 | 72.859 | 0.284 | 0.024 | 0.004 | 0.889 | ||||
| fbmy8032_rel_221222.cza1_gcp_c2s30 | 0.009 | 25.412 | 74.262 | 0.293 | 0.021 | 0.004 | 0.652 |
Performance metrics for the DBMS listed above. Some are normalized by throughput, others are not. Legend for results is here.
ips	qps	rps	rmbps	wps	wmbps	rpq	rkbpq	wpi	wkbpi	csps	cpups	cspq	cpupq	dbgb1	dbgb2	rss	maxop	p50	p99	tag
81033	0	446	13.6	689.1	157.3	0.006	0.172	0.009	1.988	54622	67.1	0.674	124	284.7	285.2	81.1	0.410	10189	7292	fbmy5635_rel_221222.cza1_gcp_c2s30
80849	0	493	13.9	715.7	148.4	0.006	0.176	0.009	1.880	49832	71.5	0.616	133	282.1	283.0	92.7	0.886	10139	6842	fbmy8028_rel_221222.cza1_gcp_c2s30
79741	0	460	13.0	713.8	145.8	0.006	0.167	0.009	1.872	49273	71.4	0.618	134	279.5	280.4	92.8	0.658	10039	6942	fbmy8032_rel_221222.cza1_gcp_c2s30
l.i2
l.i2: continue load after secondary indexes created with 5 inserts per transaction. Graphs for performance per 1-second interval are here.
Average throughput:
Insert response time histogram: each cell has the percentage of responses that take <= the time in the header and max is the max response time in seconds. For the max column values in the top 25% of the range have a red background and in the bottom 25% of the range have a green background. The red background is not used when the min value is within 80% of the max value.
| dbms | 256us | 1ms | 4ms | 16ms | 64ms | 256ms | 1s | 4s | 16s | gt | max |
|---|---|---|---|---|---|---|---|---|---|---|---|
| fbmy5635_rel_221222.cza1_gcp_c2s30 | 0.121 | 74.855 | 24.943 | 0.074 | 0.007 | nonzero | 0.172 | ||||
| fbmy8028_rel_221222.cza1_gcp_c2s30 | 0.003 | 70.093 | 29.738 | 0.156 | 0.008 | 0.001 | nonzero | 0.423 | |||
| fbmy8032_rel_221222.cza1_gcp_c2s30 | 0.001 | 65.576 | 34.259 | 0.157 | 0.007 | 0.001 | 0.242 |
Delete response time histogram: each cell has the percentage of responses that take <= the time in the header and max is the max response time in seconds. For the max column values in the top 25% of the range have a red background and in the bottom 25% of the range have a green background. The red background is not used when the min value is within 80% of the max value.
| dbms | 256us | 1ms | 4ms | 16ms | 64ms | 256ms | 1s | 4s | 16s | gt | max |
|---|---|---|---|---|---|---|---|---|---|---|---|
| fbmy5635_rel_221222.cza1_gcp_c2s30 | 51.886 | 48.007 | 0.095 | 0.011 | 0.001 | 0.172 | |||||
| fbmy8028_rel_221222.cza1_gcp_c2s30 | 58.124 | 41.687 | 0.176 | 0.012 | 0.002 | nonzero | 0.423 | ||||
| fbmy8032_rel_221222.cza1_gcp_c2s30 | 52.966 | 46.848 | 0.175 | 0.011 | 0.001 | nonzero | 0.266 |
Performance metrics for the DBMS listed above. Some are normalized by throughput, others are not. Legend for results is here.
ips	qps	rps	rmbps	wps	wmbps	rpq	rkbpq	wpi	wkbpi	csps	cpups	cspq	cpupq	dbgb1	dbgb2	rss	maxop	p50	p99	tag
37488	0	214	6.7	395.3	79.9	0.006	0.182	0.011	2.184	220990	67.7	5.895	271	280.2	280.3	80.5	0.172	4887	2942	fbmy5635_rel_221222.cza1_gcp_c2s30
37488	0	203	6.2	411.4	77.7	0.005	0.171	0.011	2.123	198775	70.6	5.302	282	280.0	280.3	81.6	0.423	4911	2842	fbmy8028_rel_221222.cza1_gcp_c2s30
36513	0	202	5.8	401.0	79.0	0.006	0.163	0.011	2.214	194760	70.7	5.334	290	279.8	280.1	81.6	0.242	4840	2753	fbmy8032_rel_221222.cza1_gcp_c2s30
qr100.L1
qr100.L1: range queries with 100 insert/s per client. Graphs for performance per 1-second interval are here.
Average throughput:
Query response time histogram: each cell has the percentage of responses that take <= the time in the header and max is the max response time in seconds. For max values in the top 25% of the range have a red background and in the bottom 25% of the range have a green background. The red background is not used when the min value is within 80% of the max value.
| dbms | 256us | 1ms | 4ms | 16ms | 64ms | 256ms | 1s | 4s | 16s | gt | max |
|---|---|---|---|---|---|---|---|---|---|---|---|
| fbmy5635_rel_221222.cza1_gcp_c2s30 | 52.438 | 29.803 | 16.532 | 1.205 | 0.022 | nonzero | 0.125 | ||||
| fbmy8028_rel_221222.cza1_gcp_c2s30 | 66.164 | 12.446 | 19.886 | 1.498 | 0.007 | nonzero | 0.097 | ||||
| fbmy8032_rel_221222.cza1_gcp_c2s30 | 66.627 | 16.092 | 15.489 | 1.778 | 0.014 | nonzero | 0.117 |
Insert response time histogram: each cell has the percentage of responses that take <= the time in the header and max is the max response time in seconds. For max values in the top 25% of the range have a red background and in the bottom 25% of the range have a green background. The red background is not used when the min value is within 80% of the max value.
| dbms | 256us | 1ms | 4ms | 16ms | 64ms | 256ms | 1s | 4s | 16s | gt | max |
|---|---|---|---|---|---|---|---|---|---|---|---|
| fbmy5635_rel_221222.cza1_gcp_c2s30 | 5.076 | 93.628 | 1.181 | 0.115 | 0.037 | ||||||
| fbmy8028_rel_221222.cza1_gcp_c2s30 | 0.608 | 99.365 | 0.028 | 0.013 | |||||||
| fbmy8032_rel_221222.cza1_gcp_c2s30 | 0.469 | 99.372 | 0.146 | 0.014 | 0.020 |
Delete response time histogram: each cell has the percentage of responses that take <= the time in the header and max is the max response time in seconds. For max values in the top 25% of the range have a red background and in the bottom 25% of the range have a green background. The red background is not used when the min value is within 80% of the max value.
| dbms | 256us | 1ms | 4ms | 16ms | 64ms | 256ms | 1s | 4s | 16s | gt | max |
|---|---|---|---|---|---|---|---|---|---|---|---|
| fbmy5635_rel_221222.cza1_gcp_c2s30 | 4.247 | 94.035 | 1.573 | 0.146 | 0.034 | ||||||
| fbmy8028_rel_221222.cza1_gcp_c2s30 | 3.493 | 96.455 | 0.052 | 0.010 | |||||||
| fbmy8032_rel_221222.cza1_gcp_c2s30 | 1.132 | 98.674 | 0.181 | 0.014 | 0.019 |
Performance metrics for the DBMS listed above. Some are normalized by throughput, others are not. Legend for results is here.
ips	qps	rps	rmbps	wps	wmbps	rpq	rkbpq	wpi	wkbpi	csps	cpups	cspq	cpupq	dbgb1	dbgb2	rss	maxop	p50	p99	tag
796	12762	77	3.8	43.8	9.5	0.006	0.302	0.055	12.233	50918	54.9	3.990	645	272.9	273.2	80.5	0.125	2974	463	fbmy5635_rel_221222.cza1_gcp_c2s30
796	11858	100	4.5	46.5	9.3	0.008	0.393	0.058	11.999	47348	55.7	3.993	705	271.4	271.9	81.0	0.097	991	463	fbmy8028_rel_221222.cza1_gcp_c2s30
796	12085	91	4.3	52.5	10.8	0.008	0.367	0.066	13.841	48241	56.0	3.992	695	272.2	272.7	81.7	0.117	1486	384	fbmy8032_rel_221222.cza1_gcp_c2s30
qp100.L2
qp100.L2: point queries with 100 insert/s per client. Graphs for performance per 1-second interval are here.
Average throughput:
Query response time histogram: each cell has the percentage of responses that take <= the time in the header and max is the max response time in seconds. For max values in the top 25% of the range have a red background and in the bottom 25% of the range have a green background. The red background is not used when the min value is within 80% of the max value.
| dbms | 256us | 1ms | 4ms | 16ms | 64ms | 256ms | 1s | 4s | 16s | gt | max |
|---|---|---|---|---|---|---|---|---|---|---|---|
| fbmy5635_rel_221222.cza1_gcp_c2s30 | 4.342 | 95.563 | 0.086 | 0.009 | nonzero | 0.091 | |||||
| fbmy8028_rel_221222.cza1_gcp_c2s30 | 5.141 | 94.751 | 0.099 | 0.009 | 0.045 | ||||||
| fbmy8032_rel_221222.cza1_gcp_c2s30 | 4.760 | 95.134 | 0.096 | 0.010 | 0.054 |
Insert response time histogram: each cell has the percentage of responses that take <= the time in the header and max is the max response time in seconds. For max values in the top 25% of the range have a red background and in the bottom 25% of the range have a green background. The red background is not used when the min value is within 80% of the max value.
| dbms | 256us | 1ms | 4ms | 16ms | 64ms | 256ms | 1s | 4s | 16s | gt | max |
|---|---|---|---|---|---|---|---|---|---|---|---|
| fbmy5635_rel_221222.cza1_gcp_c2s30 | 1.181 | 58.736 | 39.906 | 0.177 | 0.044 | ||||||
| fbmy8028_rel_221222.cza1_gcp_c2s30 | 0.260 | 74.476 | 25.264 | 0.013 | |||||||
| fbmy8032_rel_221222.cza1_gcp_c2s30 | 0.021 | 84.767 | 15.212 | 0.009 |
Delete response time histogram: each cell has the percentage of responses that take <= the time in the header and max is the max response time in seconds. For max values in the top 25% of the range have a red background and in the bottom 25% of the range have a green background. The red background is not used when the min value is within 80% of the max value.
| dbms | 256us | 1ms | 4ms | 16ms | 64ms | 256ms | 1s | 4s | 16s | gt | max |
|---|---|---|---|---|---|---|---|---|---|---|---|
| fbmy5635_rel_221222.cza1_gcp_c2s30 | 1.562 | 50.264 | 47.951 | 0.222 | 0.054 | ||||||
| fbmy8028_rel_221222.cza1_gcp_c2s30 | 0.670 | 74.490 | 24.837 | 0.003 | 0.028 | ||||||
| fbmy8032_rel_221222.cza1_gcp_c2s30 | 0.226 | 84.667 | 15.108 | 0.010 |
Performance metrics for the DBMS listed above. Some are normalized by throughput, others are not. Legend for results is here.
ips	qps	rps	rmbps	wps	wmbps	rpq	rkbpq	wpi	wkbpi	csps	cpups	cspq	cpupq	dbgb1	dbgb2	rss	maxop	p50	p99	tag
796	4875	31527	230.2	27.5	4.6	6.467	48.356	0.035	5.861	80775	19.8	16.570	609	273.0	273.7	88.6	0.091	640	432	fbmy5635_rel_221222.cza1_gcp_c2s30
796	4977	32363	240.1	33.4	5.5	6.503	49.402	0.042	7.135	82760	19.2	16.628	579	271.6	272.5	94.5	0.045	655	432	fbmy8028_rel_221222.cza1_gcp_c2s30
796	4928	32013	236.4	29.6	4.8	6.496	49.111	0.037	6.149	82045	19.3	16.648	587	272.4	273.3	93.8	0.054	655	432	fbmy8032_rel_221222.cza1_gcp_c2s30
qr500.L3
qr500.L3: range queries with 500 insert/s per client. Graphs for performance per 1-second interval are here.
Average throughput:
Query response time histogram: each cell has the percentage of responses that take <= the time in the header and max is the max response time in seconds. For max values in the top 25% of the range have a red background and in the bottom 25% of the range have a green background. The red background is not used when the min value is within 80% of the max value.
| dbms | 256us | 1ms | 4ms | 16ms | 64ms | 256ms | 1s | 4s | 16s | gt | max |
|---|---|---|---|---|---|---|---|---|---|---|---|
| fbmy5635_rel_221222.cza1_gcp_c2s30 | 39.452 | 40.010 | 20.496 | 0.041 | nonzero | nonzero | 0.134 | ||||
| fbmy8028_rel_221222.cza1_gcp_c2s30 | 58.716 | 12.971 | 28.291 | 0.021 | nonzero | nonzero | 0.124 | ||||
| fbmy8032_rel_221222.cza1_gcp_c2s30 | 62.603 | 12.795 | 24.579 | 0.023 | nonzero | nonzero | 0.124 |
Insert response time histogram: each cell has the percentage of responses that take <= the time in the header and max is the max response time in seconds. For max values in the top 25% of the range have a red background and in the bottom 25% of the range have a green background. The red background is not used when the min value is within 80% of the max value.
| dbms | 256us | 1ms | 4ms | 16ms | 64ms | 256ms | 1s | 4s | 16s | gt | max |
|---|---|---|---|---|---|---|---|---|---|---|---|
| fbmy5635_rel_221222.cza1_gcp_c2s30 | 6.022 | 59.265 | 34.432 | 0.281 | 0.045 | ||||||
| fbmy8028_rel_221222.cza1_gcp_c2s30 | 0.792 | 89.138 | 10.047 | 0.024 | 0.024 | ||||||
| fbmy8032_rel_221222.cza1_gcp_c2s30 | 0.137 | 83.178 | 16.637 | 0.047 | 0.029 |
Delete response time histogram: each cell has the percentage of responses that take <= the time in the header and max is the max response time in seconds. For max values in the top 25% of the range have a red background and in the bottom 25% of the range have a green background. The red background is not used when the min value is within 80% of the max value.
| dbms | 256us | 1ms | 4ms | 16ms | 64ms | 256ms | 1s | 4s | 16s | gt | max |
|---|---|---|---|---|---|---|---|---|---|---|---|
| fbmy5635_rel_221222.cza1_gcp_c2s30 | 5.065 | 59.530 | 35.122 | 0.283 | 0.048 | ||||||
| fbmy8028_rel_221222.cza1_gcp_c2s30 | 2.858 | 87.473 | 9.650 | 0.019 | 0.027 | ||||||
| fbmy8032_rel_221222.cza1_gcp_c2s30 | 1.273 | 82.823 | 15.872 | 0.033 | 0.021 |
Performance metrics for the DBMS listed above. Some are normalized by throughput, others are not. Legend for results is here.
ips	qps	rps	rmbps	wps	wmbps	rpq	rkbpq	wpi	wkbpi	csps	cpups	cspq	cpupq	dbgb1	dbgb2	rss	maxop	p50	p99	tag
3978	12863	73	2.1	96.6	24.8	0.006	0.168	0.024	6.376	53682	57.1	4.173	666	274.0	274.3	83.7	0.134	2285	1918	fbmy5635_rel_221222.cza1_gcp_c2s30
3980	11846	76	2.0	141.1	34.1	0.006	0.174	0.035	8.765	50228	59.4	4.240	752	273.4	273.8	86.5	0.124	1311	1103	fbmy8028_rel_221222.cza1_gcp_c2s30
3978	12362	76	2.3	116.6	26.5	0.006	0.187	0.029	6.818	51772	58.2	4.188	706	273.5	273.9	85.1	0.124	1438	1215	fbmy8032_rel_221222.cza1_gcp_c2s30
qp500.L4
qp500.L4: point queries with 500 insert/s per client. Graphs for performance per 1-second interval are here.
Average throughput:
Query response time histogram: each cell has the percentage of responses that take <= the time in the header and max is the max response time in seconds. For max values in the top 25% of the range have a red background and in the bottom 25% of the range have a green background. The red background is not used when the min value is within 80% of the max value.
| dbms | 256us | 1ms | 4ms | 16ms | 64ms | 256ms | 1s | 4s | 16s | gt | max |
|---|---|---|---|---|---|---|---|---|---|---|---|
| fbmy5635_rel_221222.cza1_gcp_c2s30 | 4.174 | 95.637 | 0.181 | 0.008 | nonzero | 0.109 | |||||
| fbmy8028_rel_221222.cza1_gcp_c2s30 | 4.985 | 94.803 | 0.202 | 0.010 | nonzero | 0.091 | |||||
| fbmy8032_rel_221222.cza1_gcp_c2s30 | 4.840 | 94.985 | 0.167 | 0.008 | 0.056 |
Insert response time histogram: each cell has the percentage of responses that take <= the time in the header and max is the max response time in seconds. For max values in the top 25% of the range have a red background and in the bottom 25% of the range have a green background. The red background is not used when the min value is within 80% of the max value.
| dbms | 256us | 1ms | 4ms | 16ms | 64ms | 256ms | 1s | 4s | 16s | gt | max |
|---|---|---|---|---|---|---|---|---|---|---|---|
| fbmy5635_rel_221222.cza1_gcp_c2s30 | 0.914 | 45.352 | 53.548 | 0.186 | 0.046 | ||||||
| fbmy8028_rel_221222.cza1_gcp_c2s30 | 0.033 | 65.326 | 34.608 | 0.033 | 0.046 | ||||||
| fbmy8032_rel_221222.cza1_gcp_c2s30 | 0.030 | 89.215 | 10.744 | 0.010 | 0.049 |
Delete response time histogram: each cell has the percentage of responses that take <= the time in the header and max is the max response time in seconds. For max values in the top 25% of the range have a red background and in the bottom 25% of the range have a green background. The red background is not used when the min value is within 80% of the max value.
| dbms | 256us | 1ms | 4ms | 16ms | 64ms | 256ms | 1s | 4s | 16s | gt | max |
|---|---|---|---|---|---|---|---|---|---|---|---|
| fbmy5635_rel_221222.cza1_gcp_c2s30 | 0.772 | 45.085 | 53.944 | 0.199 | 0.046 | ||||||
| fbmy8028_rel_221222.cza1_gcp_c2s30 | 0.224 | 65.484 | 34.258 | 0.034 | 0.045 | ||||||
| fbmy8032_rel_221222.cza1_gcp_c2s30 | 0.569 | 89.239 | 10.176 | 0.015 | 0.001 | 0.087 |
Performance metrics for the DBMS listed above. Some are normalized by throughput, others are not. Legend for results is here.
ips	qps	rps	rmbps	wps	wmbps	rpq	rkbpq	wpi	wkbpi	csps	cpups	cspq	cpupq	dbgb1	dbgb2	rss	maxop	p50	p99	tag
3978	4922	29997	220.6	146.6	23.1	6.095	45.888	0.037	5.938	81755	26.5	16.611	808	275.9	277.7	84.7	0.109	624	575	fbmy5635_rel_221222.cza1_gcp_c2s30
3978	5037	30908	228.3	170.0	28.1	6.137	46.423	0.043	7.227	84075	26.6	16.693	792	273.9	275.9	85.2	0.091	639	575	fbmy8028_rel_221222.cza1_gcp_c2s30
3978	5036	30722	224.9	137.0	22.3	6.101	45.733	0.034	5.737	83239	25.7	16.530	766	275.8	277.8	85.7	0.056	639	575	fbmy8032_rel_221222.cza1_gcp_c2s30
qr1000.L5
qr1000.L5: range queries with 1000 insert/s per client. Graphs for performance per 1-second interval are here.
Average throughput:
Query response time histogram: each cell has the percentage of responses that take <= the time in the header and max is the max response time in seconds. For max values in the top 25% of the range have a red background and in the bottom 25% of the range have a green background. The red background is not used when the min value is within 80% of the max value.
| dbms | 256us | 1ms | 4ms | 16ms | 64ms | 256ms | 1s | 4s | 16s | gt | max |
|---|---|---|---|---|---|---|---|---|---|---|---|
| fbmy5635_rel_221222.cza1_gcp_c2s30 | 23.649 | 44.920 | 31.311 | 0.118 | 0.001 | nonzero | 0.137 | ||||
| fbmy8028_rel_221222.cza1_gcp_c2s30 | 48.935 | 19.564 | 31.340 | 0.160 | 0.001 | nonzero | 0.130 | ||||
| fbmy8032_rel_221222.cza1_gcp_c2s30 | 56.043 | 12.762 | 30.951 | 0.242 | 0.001 | nonzero | 0.129 |
Insert response time histogram: each cell has the percentage of responses that take <= the time in the header and max is the max response time in seconds. For max values in the top 25% of the range have a red background and in the bottom 25% of the range have a green background. The red background is not used when the min value is within 80% of the max value.
| dbms | 256us | 1ms | 4ms | 16ms | 64ms | 256ms | 1s | 4s | 16s | gt | max |
|---|---|---|---|---|---|---|---|---|---|---|---|
| fbmy5635_rel_221222.cza1_gcp_c2s30 | 3.463 | 49.567 | 46.805 | 0.166 | 0.033 | ||||||
| fbmy8028_rel_221222.cza1_gcp_c2s30 | 0.130 | 62.960 | 36.832 | 0.078 | 0.034 | ||||||
| fbmy8032_rel_221222.cza1_gcp_c2s30 | 0.007 | 63.608 | 36.300 | 0.084 | 0.039 |
Delete response time histogram: each cell has the percentage of responses that take <= the time in the header and max is the max response time in seconds. For max values in the top 25% of the range have a red background and in the bottom 25% of the range have a green background. The red background is not used when the min value is within 80% of the max value.
| dbms | 256us | 1ms | 4ms | 16ms | 64ms | 256ms | 1s | 4s | 16s | gt | max |
|---|---|---|---|---|---|---|---|---|---|---|---|
| fbmy5635_rel_221222.cza1_gcp_c2s30 | 3.173 | 49.841 | 46.828 | 0.159 | 0.039 | ||||||
| fbmy8028_rel_221222.cza1_gcp_c2s30 | 0.692 | 63.532 | 35.699 | 0.077 | 0.036 | ||||||
| fbmy8032_rel_221222.cza1_gcp_c2s30 | 0.194 | 64.757 | 34.962 | 0.086 | nonzero | 0.119 |
Performance metrics for the DBMS listed above. Some are normalized by throughput, others are not. Legend for results is here.
ips	qps	rps	rmbps	wps	wmbps	rpq	rkbpq	wpi	wkbpi	csps	cpups	cspq	cpupq	dbgb1	dbgb2	rss	maxop	p50	p99	tag
7960	8845	83	3.4	162.3	33.1	0.009	0.390	0.020	4.252	39994	61.1	4.521	1036	277.2	278.2	84.4	0.137	1279	1055	fbmy5635_rel_221222.cza1_gcp_c2s30
7960	8217	87	3.8	164.5	34.7	0.011	0.471	0.021	4.467	37266	61.4	4.535	1121	276.2	277.4	84.6	0.130	1119	879	fbmy8028_rel_221222.cza1_gcp_c2s30
7965	8527	84	3.6	160.8	33.7	0.010	0.431	0.020	4.328	38192	61.5	4.479	1082	276.6	277.8	84.8	0.129	959	783	fbmy8032_rel_221222.cza1_gcp_c2s30
qp1000.L6
qp1000.L6: point queries with 1000 insert/s per client. Graphs for performance per 1-second interval are here.
Average throughput:
Query response time histogram: each cell has the percentage of responses that take <= the time in the header and max is the max response time in seconds. For max values in the top 25% of the range have a red background and in the bottom 25% of the range have a green background. The red background is not used when the min value is within 80% of the max value.
| dbms | 256us | 1ms | 4ms | 16ms | 64ms | 256ms | 1s | 4s | 16s | gt | max |
|---|---|---|---|---|---|---|---|---|---|---|---|
| fbmy5635_rel_221222.cza1_gcp_c2s30 | 3.167 | 96.524 | 0.296 | 0.014 | nonzero | 0.124 | |||||
| fbmy8028_rel_221222.cza1_gcp_c2s30 | 4.215 | 95.550 | 0.223 | 0.012 | nonzero | 0.085 | |||||
| fbmy8032_rel_221222.cza1_gcp_c2s30 | 3.504 | 96.224 | 0.261 | 0.011 | nonzero | 0.108 |
Insert response time histogram: each cell has the percentage of responses that take <= the time in the header and max is the max response time in seconds. For max values in the top 25% of the range have a red background and in the bottom 25% of the range have a green background. The red background is not used when the min value is within 80% of the max value.
| dbms | 256us | 1ms | 4ms | 16ms | 64ms | 256ms | 1s | 4s | 16s | gt | max |
|---|---|---|---|---|---|---|---|---|---|---|---|
| fbmy5635_rel_221222.cza1_gcp_c2s30 | 0.453 | 35.626 | 63.726 | 0.195 | 0.042 | ||||||
| fbmy8028_rel_221222.cza1_gcp_c2s30 | 0.055 | 67.265 | 32.641 | 0.039 | 0.052 | ||||||
| fbmy8032_rel_221222.cza1_gcp_c2s30 | 49.543 | 50.408 | 0.050 | 0.054 |
Delete response time histogram: each cell has the percentage of responses that take <= the time in the header and max is the max response time in seconds. For max values in the top 25% of the range have a red background and in the bottom 25% of the range have a green background. The red background is not used when the min value is within 80% of the max value.
| dbms | 256us | 1ms | 4ms | 16ms | 64ms | 256ms | 1s | 4s | 16s | gt | max |
|---|---|---|---|---|---|---|---|---|---|---|---|
| fbmy5635_rel_221222.cza1_gcp_c2s30 | 0.543 | 35.075 | 64.178 | 0.202 | 0.001 | 0.137 | |||||
| fbmy8028_rel_221222.cza1_gcp_c2s30 | 0.478 | 67.286 | 32.185 | 0.050 | nonzero | 0.067 | |||||
| fbmy8032_rel_221222.cza1_gcp_c2s30 | 0.017 | 50.204 | 49.718 | 0.060 | 0.001 | 0.094 |
Performance metrics for the DBMS listed above. Some are normalized by throughput, others are not. Legend for results is here.
ips	qps	rps	rmbps	wps	wmbps	rpq	rkbpq	wpi	wkbpi	csps	cpups	cspq	cpupq	dbgb1	dbgb2	rss	maxop	p50	p99	tag
7960	4714	29478	219.1	161.2	26.1	6.254	47.595	0.020	3.359	83358	30.1	17.685	958	278.5	278.7	85.5	0.124	607	511	fbmy5635_rel_221222.cza1_gcp_c2s30
7960	4913	30614	227.5	144.4	22.9	6.231	47.412	0.018	2.941	85272	29.0	17.357	885	277.5	277.9	85.9	0.085	639	543	fbmy8028_rel_221222.cza1_gcp_c2s30
7960	4802	30008	225.2	141.5	21.0	6.249	48.014	0.018	2.707	84178	30.0	17.530	937	277.3	277.7	86.5	0.108	623	527	fbmy8032_rel_221222.cza1_gcp_c2s30
l.i0
l.i0: load without secondary indexes
Performance metrics for all DBMS, not just the ones listed above. Some are normalized by throughput, others are not. Legend for results is here.
ips	qps	rps	rmbps	wps	wmbps	rpq	rkbpq	wpi	wkbpi	csps	cpups	cspq	cpupq	dbgb1	dbgb2	rss	maxop	p50	p99	tag
593736	0	0	0.0	558.6	129.4	0.000	0.000	0.001	0.223	78465	73.4	0.132	19	114.7	116.3	25.5	0.410	74519	47964	fbmy5635_rel_221222.cza1_gcp_c2s30
511117	0	0	0.0	517.7	120.4	0.000	0.000	0.001	0.241	65582	72.5	0.128	21	114.6	114.8	26.5	0.412	65253	42653	fbmy8028_rel_221222.cza1_gcp_c2s30
489476	0	0	0.0	500.1	112.8	0.000	0.000	0.001	0.236	62475	71.3	0.128	22	114.2	114.5	26.5	0.410	62432	41655	fbmy8032_rel_221222.cza1_gcp_c2s30
l.x
l.x: create secondary indexes
Performance metrics for all DBMS, not just the ones listed above. Some are normalized by throughput, others are not. Legend for results is here.
ips	qps	rps	rmbps	wps	wmbps	rpq	rkbpq	wpi	wkbpi	csps	cpups	cspq	cpupq	dbgb1	dbgb2	rss	maxop	p50	p99	tag
702617	0	638	118.1	280.4	84.4	0.001	0.172	0.000	0.123	2241	49.7	0.003	11	256.2	257.8	82.7	0.005	NA	NA	fbmy5635_rel_221222.cza1_gcp_c2s30
679117	0	836	146.4	273.6	80.7	0.001	0.221	0.000	0.122	2330	50.0	0.003	11	255.8	256.1	93.9	0.002	NA	NA	fbmy8028_rel_221222.cza1_gcp_c2s30
667223	0	788	140.0	266.0	77.6	0.001	0.215	0.000	0.119	2534	49.8	0.004	11	255.4	255.6	94.0	0.004	NA	NA	fbmy8032_rel_221222.cza1_gcp_c2s30
l.i1
l.i1: continue load after secondary indexes created with 50 inserts per transaction
Performance metrics for all DBMS, not just the ones listed above. Some are normalized by throughput, others are not. Legend for results is here.
ips	qps	rps	rmbps	wps	wmbps	rpq	rkbpq	wpi	wkbpi	csps	cpups	cspq	cpupq	dbgb1	dbgb2	rss	maxop	p50	p99	tag
81033	0	446	13.6	689.1	157.3	0.006	0.172	0.009	1.988	54622	67.1	0.674	124	284.7	285.2	81.1	0.410	10189	7292	fbmy5635_rel_221222.cza1_gcp_c2s30
80849	0	493	13.9	715.7	148.4	0.006	0.176	0.009	1.880	49832	71.5	0.616	133	282.1	283.0	92.7	0.886	10139	6842	fbmy8028_rel_221222.cza1_gcp_c2s30
79741	0	460	13.0	713.8	145.8	0.006	0.167	0.009	1.872	49273	71.4	0.618	134	279.5	280.4	92.8	0.658	10039	6942	fbmy8032_rel_221222.cza1_gcp_c2s30
l.i2
l.i2: continue load after secondary indexes created with 5 inserts per transaction
Performance metrics for all DBMS, not just the ones listed above. Some are normalized by throughput, others are not. Legend for results is here.
ips	qps	rps	rmbps	wps	wmbps	rpq	rkbpq	wpi	wkbpi	csps	cpups	cspq	cpupq	dbgb1	dbgb2	rss	maxop	p50	p99	tag
37488	0	214	6.7	395.3	79.9	0.006	0.182	0.011	2.184	220990	67.7	5.895	271	280.2	280.3	80.5	0.172	4887	2942	fbmy5635_rel_221222.cza1_gcp_c2s30
37488	0	203	6.2	411.4	77.7	0.005	0.171	0.011	2.123	198775	70.6	5.302	282	280.0	280.3	81.6	0.423	4911	2842	fbmy8028_rel_221222.cza1_gcp_c2s30
36513	0	202	5.8	401.0	79.0	0.006	0.163	0.011	2.214	194760	70.7	5.334	290	279.8	280.1	81.6	0.242	4840	2753	fbmy8032_rel_221222.cza1_gcp_c2s30
qr100.L1
qr100.L1: range queries with 100 insert/s per client
Performance metrics for all DBMS, not just the ones listed above. Some are normalized by throughput, others are not. Legend for results is here.
ips	qps	rps	rmbps	wps	wmbps	rpq	rkbpq	wpi	wkbpi	csps	cpups	cspq	cpupq	dbgb1	dbgb2	rss	maxop	p50	p99	tag
796	12762	77	3.8	43.8	9.5	0.006	0.302	0.055	12.233	50918	54.9	3.990	645	272.9	273.2	80.5	0.125	2974	463	fbmy5635_rel_221222.cza1_gcp_c2s30
796	11858	100	4.5	46.5	9.3	0.008	0.393	0.058	11.999	47348	55.7	3.993	705	271.4	271.9	81.0	0.097	991	463	fbmy8028_rel_221222.cza1_gcp_c2s30
796	12085	91	4.3	52.5	10.8	0.008	0.367	0.066	13.841	48241	56.0	3.992	695	272.2	272.7	81.7	0.117	1486	384	fbmy8032_rel_221222.cza1_gcp_c2s30
qp100.L2
qp100.L2: point queries with 100 insert/s per client
Performance metrics for all DBMS, not just the ones listed above. Some are normalized by throughput, others are not. Legend for results is here.
ips	qps	rps	rmbps	wps	wmbps	rpq	rkbpq	wpi	wkbpi	csps	cpups	cspq	cpupq	dbgb1	dbgb2	rss	maxop	p50	p99	tag
796	4875	31527	230.2	27.5	4.6	6.467	48.356	0.035	5.861	80775	19.8	16.570	609	273.0	273.7	88.6	0.091	640	432	fbmy5635_rel_221222.cza1_gcp_c2s30
796	4977	32363	240.1	33.4	5.5	6.503	49.402	0.042	7.135	82760	19.2	16.628	579	271.6	272.5	94.5	0.045	655	432	fbmy8028_rel_221222.cza1_gcp_c2s30
796	4928	32013	236.4	29.6	4.8	6.496	49.111	0.037	6.149	82045	19.3	16.648	587	272.4	273.3	93.8	0.054	655	432	fbmy8032_rel_221222.cza1_gcp_c2s30
qr500.L3
qr500.L3: range queries with 500 insert/s per client
Performance metrics for all DBMS, not just the ones listed above. Some are normalized by throughput, others are not. Legend for results is here.
ips	qps	rps	rmbps	wps	wmbps	rpq	rkbpq	wpi	wkbpi	csps	cpups	cspq	cpupq	dbgb1	dbgb2	rss	maxop	p50	p99	tag
3978	12863	73	2.1	96.6	24.8	0.006	0.168	0.024	6.376	53682	57.1	4.173	666	274.0	274.3	83.7	0.134	2285	1918	fbmy5635_rel_221222.cza1_gcp_c2s30
3980	11846	76	2.0	141.1	34.1	0.006	0.174	0.035	8.765	50228	59.4	4.240	752	273.4	273.8	86.5	0.124	1311	1103	fbmy8028_rel_221222.cza1_gcp_c2s30
3978	12362	76	2.3	116.6	26.5	0.006	0.187	0.029	6.818	51772	58.2	4.188	706	273.5	273.9	85.1	0.124	1438	1215	fbmy8032_rel_221222.cza1_gcp_c2s30
qp500.L4
qp500.L4: point queries with 500 insert/s per client
Performance metrics for all DBMS, not just the ones listed above. Some are normalized by throughput, others are not. Legend for results is here.
ips	qps	rps	rmbps	wps	wmbps	rpq	rkbpq	wpi	wkbpi	csps	cpups	cspq	cpupq	dbgb1	dbgb2	rss	maxop	p50	p99	tag
3978	4922	29997	220.6	146.6	23.1	6.095	45.888	0.037	5.938	81755	26.5	16.611	808	275.9	277.7	84.7	0.109	624	575	fbmy5635_rel_221222.cza1_gcp_c2s30
3978	5037	30908	228.3	170.0	28.1	6.137	46.423	0.043	7.227	84075	26.6	16.693	792	273.9	275.9	85.2	0.091	639	575	fbmy8028_rel_221222.cza1_gcp_c2s30
3978	5036	30722	224.9	137.0	22.3	6.101	45.733	0.034	5.737	83239	25.7	16.530	766	275.8	277.8	85.7	0.056	639	575	fbmy8032_rel_221222.cza1_gcp_c2s30
qr1000.L5
qr1000.L5: range queries with 1000 insert/s per client
Performance metrics for all DBMS, not just the ones listed above. Some are normalized by throughput, others are not. Legend for results is here.
ips	qps	rps	rmbps	wps	wmbps	rpq	rkbpq	wpi	wkbpi	csps	cpups	cspq	cpupq	dbgb1	dbgb2	rss	maxop	p50	p99	tag
7960	8845	83	3.4	162.3	33.1	0.009	0.390	0.020	4.252	39994	61.1	4.521	1036	277.2	278.2	84.4	0.137	1279	1055	fbmy5635_rel_221222.cza1_gcp_c2s30
7960	8217	87	3.8	164.5	34.7	0.011	0.471	0.021	4.467	37266	61.4	4.535	1121	276.2	277.4	84.6	0.130	1119	879	fbmy8028_rel_221222.cza1_gcp_c2s30
7965	8527	84	3.6	160.8	33.7	0.010	0.431	0.020	4.328	38192	61.5	4.479	1082	276.6	277.8	84.8	0.129	959	783	fbmy8032_rel_221222.cza1_gcp_c2s30
qp1000.L6
qp1000.L6: point queries with 1000 insert/s per client
Performance metrics for all DBMS, not just the ones listed above. Some are normalized by throughput, others are not. Legend for results is here.
ips	qps	rps	rmbps	wps	wmbps	rpq	rkbpq	wpi	wkbpi	csps	cpups	cspq	cpupq	dbgb1	dbgb2	rss	maxop	p50	p99	tag
7960	4714	29478	219.1	161.2	26.1	6.254	47.595	0.020	3.359	83358	30.1	17.685	958	278.5	278.7	85.5	0.124	607	511	fbmy5635_rel_221222.cza1_gcp_c2s30
7960	4913	30614	227.5	144.4	22.9	6.231	47.412	0.018	2.941	85272	29.0	17.357	885	277.5	277.9	85.9	0.085	639	543	fbmy8028_rel_221222.cza1_gcp_c2s30
7960	4802	30008	225.2	141.5	21.0	6.249	48.014	0.018	2.707	84178	30.0	17.530	937	277.3	277.7	86.5	0.108	623	527	fbmy8032_rel_221222.cza1_gcp_c2s30
l.i0
- l.i0: load without secondary indexes
- Legend for results is here.
- Each entry lists the percentage of responses that fit in that bucket (slower than max time for previous bucket, faster than min time for next bucket).
Insert response time histogram
256us	1ms	4ms	16ms	64ms	256ms	1s	4s	16s	gt	max	tag
0.000	21.767	78.196	0.022	0.001	0.011	0.003	0.000	0.000	0.000	0.410	fbmy5635_rel_221222.cza1_gcp_c2s30
0.000	5.822	94.025	0.125	0.010	0.016	0.004	0.000	0.000	0.000	0.412	fbmy8028_rel_221222.cza1_gcp_c2s30
0.000	3.012	96.840	0.117	0.010	0.017	0.003	0.000	0.000	0.000	0.410	fbmy8032_rel_221222.cza1_gcp_c2s30
l.x
- l.x: create secondary indexes
- Legend for results is here.
- Each entry lists the percentage of responses that fit in that bucket (slower than max time for previous bucket, faster than min time for next bucket).
TODO - determine whether there is data for create index response time
l.i1
- l.i1: continue load after secondary indexes created with 50 inserts per transaction
- Legend for results is here.
- Each entry lists the percentage of responses that fit in that bucket (slower than max time for previous bucket, faster than min time for next bucket).
Insert response time histogram
256us	1ms	4ms	16ms	64ms	256ms	1s	4s	16s	gt	max	tag
0.000	0.052	29.113	70.675	0.152	0.006	0.002	0.000	0.000	0.000	0.410	fbmy5635_rel_221222.cza1_gcp_c2s30
0.000	0.002	29.946	69.874	0.160	0.013	0.004	0.000	0.000	0.000	0.886	fbmy8028_rel_221222.cza1_gcp_c2s30
0.000	0.006	27.869	71.934	0.176	0.012	0.003	0.000	0.000	0.000	0.658	fbmy8032_rel_221222.cza1_gcp_c2s30
Delete response time histogram
256us	1ms	4ms	16ms	64ms	256ms	1s	4s	16s	gt	max	tag
0.000	0.051	25.929	73.731	0.270	0.017	0.003	0.000	0.000	0.000	0.413	fbmy5635_rel_221222.cza1_gcp_c2s30
0.000	0.006	26.822	72.859	0.284	0.024	0.004	0.000	0.000	0.000	0.889	fbmy8028_rel_221222.cza1_gcp_c2s30
0.000	0.009	25.412	74.262	0.293	0.021	0.004	0.000	0.000	0.000	0.652	fbmy8032_rel_221222.cza1_gcp_c2s30
l.i2
- l.i2: continue load after secondary indexes created with 5 inserts per transaction
- Legend for results is here.
- Each entry lists the percentage of responses that fit in that bucket (slower than max time for previous bucket, faster than min time for next bucket).
Insert response time histogram
256us	1ms	4ms	16ms	64ms	256ms	1s	4s	16s	gt	max	tag
0.121	74.855	24.943	0.074	0.007	nonzero	0.000	0.000	0.000	0.000	0.172	fbmy5635_rel_221222.cza1_gcp_c2s30
0.003	70.093	29.738	0.156	0.008	0.001	nonzero	0.000	0.000	0.000	0.423	fbmy8028_rel_221222.cza1_gcp_c2s30
0.001	65.576	34.259	0.157	0.007	0.001	0.000	0.000	0.000	0.000	0.242	fbmy8032_rel_221222.cza1_gcp_c2s30
Delete response time histogram
256us	1ms	4ms	16ms	64ms	256ms	1s	4s	16s	gt	max	tag
0.000	51.886	48.007	0.095	0.011	0.001	0.000	0.000	0.000	0.000	0.172	fbmy5635_rel_221222.cza1_gcp_c2s30
0.000	58.124	41.687	0.176	0.012	0.002	nonzero	0.000	0.000	0.000	0.423	fbmy8028_rel_221222.cza1_gcp_c2s30
0.000	52.966	46.848	0.175	0.011	0.001	nonzero	0.000	0.000	0.000	0.266	fbmy8032_rel_221222.cza1_gcp_c2s30
qr100.L1
- qr100.L1: range queries with 100 insert/s per client
- Legend for results is here.
- Each entry lists the percentage of responses that fit in that bucket (slower than max time for previous bucket, faster than min time for next bucket).
Query response time histogram
256us	1ms	4ms	16ms	64ms	256ms	1s	4s	16s	gt	max	tag
52.438	29.803	16.532	1.205	0.022	nonzero	0.000	0.000	0.000	0.000	0.125	fbmy5635_rel_221222.cza1_gcp_c2s30
66.164	12.446	19.886	1.498	0.007	nonzero	0.000	0.000	0.000	0.000	0.097	fbmy8028_rel_221222.cza1_gcp_c2s30
66.627	16.092	15.489	1.778	0.014	nonzero	0.000	0.000	0.000	0.000	0.117	fbmy8032_rel_221222.cza1_gcp_c2s30
Insert response time histogram
256us	1ms	4ms	16ms	64ms	256ms	1s	4s	16s	gt	max	tag
0.000	5.076	93.628	1.181	0.115	0.000	0.000	0.000	0.000	0.000	0.037	fbmy5635_rel_221222.cza1_gcp_c2s30
0.000	0.608	99.365	0.028	0.000	0.000	0.000	0.000	0.000	0.000	0.013	fbmy8028_rel_221222.cza1_gcp_c2s30
0.000	0.469	99.372	0.146	0.014	0.000	0.000	0.000	0.000	0.000	0.020	fbmy8032_rel_221222.cza1_gcp_c2s30
Delete response time histogram
256us	1ms	4ms	16ms	64ms	256ms	1s	4s	16s	gt	max	tag
0.000	4.247	94.035	1.573	0.146	0.000	0.000	0.000	0.000	0.000	0.034	fbmy5635_rel_221222.cza1_gcp_c2s30
0.000	3.493	96.455	0.052	0.000	0.000	0.000	0.000	0.000	0.000	0.010	fbmy8028_rel_221222.cza1_gcp_c2s30
0.000	1.132	98.674	0.181	0.014	0.000	0.000	0.000	0.000	0.000	0.019	fbmy8032_rel_221222.cza1_gcp_c2s30
qp100.L2
- qp100.L2: point queries with 100 insert/s per client
- Legend for results is here.
- Each entry lists the percentage of responses that fit in that bucket (slower than max time for previous bucket, faster than min time for next bucket).
Query response time histogram
256us	1ms	4ms	16ms	64ms	256ms	1s	4s	16s	gt	max	tag
0.000	4.342	95.563	0.086	0.009	nonzero	0.000	0.000	0.000	0.000	0.091	fbmy5635_rel_221222.cza1_gcp_c2s30
0.000	5.141	94.751	0.099	0.009	0.000	0.000	0.000	0.000	0.000	0.045	fbmy8028_rel_221222.cza1_gcp_c2s30
0.000	4.760	95.134	0.096	0.010	0.000	0.000	0.000	0.000	0.000	0.054	fbmy8032_rel_221222.cza1_gcp_c2s30
Insert response time histogram
256us	1ms	4ms	16ms	64ms	256ms	1s	4s	16s	gt	max	tag
0.000	1.181	58.736	39.906	0.177	0.000	0.000	0.000	0.000	0.000	0.044	fbmy5635_rel_221222.cza1_gcp_c2s30
0.000	0.260	74.476	25.264	0.000	0.000	0.000	0.000	0.000	0.000	0.013	fbmy8028_rel_221222.cza1_gcp_c2s30
0.000	0.021	84.767	15.212	0.000	0.000	0.000	0.000	0.000	0.000	0.009	fbmy8032_rel_221222.cza1_gcp_c2s30
Delete response time histogram
256us	1ms	4ms	16ms	64ms	256ms	1s	4s	16s	gt	max	tag
0.000	1.562	50.264	47.951	0.222	0.000	0.000	0.000	0.000	0.000	0.054	fbmy5635_rel_221222.cza1_gcp_c2s30
0.000	0.670	74.490	24.837	0.003	0.000	0.000	0.000	0.000	0.000	0.028	fbmy8028_rel_221222.cza1_gcp_c2s30
0.000	0.226	84.667	15.108	0.000	0.000	0.000	0.000	0.000	0.000	0.010	fbmy8032_rel_221222.cza1_gcp_c2s30
qr500.L3
- qr500.L3: range queries with 500 insert/s per client
- Legend for results is here.
- Each entry lists the percentage of responses that fit in that bucket (slower than max time for previous bucket, faster than min time for next bucket).
Query response time histogram
256us	1ms	4ms	16ms	64ms	256ms	1s	4s	16s	gt	max	tag
39.452	40.010	20.496	0.041	nonzero	nonzero	0.000	0.000	0.000	0.000	0.134	fbmy5635_rel_221222.cza1_gcp_c2s30
58.716	12.971	28.291	0.021	nonzero	nonzero	0.000	0.000	0.000	0.000	0.124	fbmy8028_rel_221222.cza1_gcp_c2s30
62.603	12.795	24.579	0.023	nonzero	nonzero	0.000	0.000	0.000	0.000	0.124	fbmy8032_rel_221222.cza1_gcp_c2s30
Insert response time histogram
256us	1ms	4ms	16ms	64ms	256ms	1s	4s	16s	gt	max	tag
0.000	6.022	59.265	34.432	0.281	0.000	0.000	0.000	0.000	0.000	0.045	fbmy5635_rel_221222.cza1_gcp_c2s30
0.000	0.792	89.138	10.047	0.024	0.000	0.000	0.000	0.000	0.000	0.024	fbmy8028_rel_221222.cza1_gcp_c2s30
0.000	0.137	83.178	16.637	0.047	0.000	0.000	0.000	0.000	0.000	0.029	fbmy8032_rel_221222.cza1_gcp_c2s30
Delete response time histogram
256us	1ms	4ms	16ms	64ms	256ms	1s	4s	16s	gt	max	tag
0.000	5.065	59.530	35.122	0.283	0.000	0.000	0.000	0.000	0.000	0.048	fbmy5635_rel_221222.cza1_gcp_c2s30
0.000	2.858	87.473	9.650	0.019	0.000	0.000	0.000	0.000	0.000	0.027	fbmy8028_rel_221222.cza1_gcp_c2s30
0.000	1.273	82.823	15.872	0.033	0.000	0.000	0.000	0.000	0.000	0.021	fbmy8032_rel_221222.cza1_gcp_c2s30
qp500.L4
- qp500.L4: point queries with 500 insert/s per client
- Legend for results is here.
- Each entry lists the percentage of responses that fit in that bucket (slower than max time for previous bucket, faster than min time for next bucket).
Query response time histogram
256us	1ms	4ms	16ms	64ms	256ms	1s	4s	16s	gt	max	tag
0.000	4.174	95.637	0.181	0.008	nonzero	0.000	0.000	0.000	0.000	0.109	fbmy5635_rel_221222.cza1_gcp_c2s30
0.000	4.985	94.803	0.202	0.010	nonzero	0.000	0.000	0.000	0.000	0.091	fbmy8028_rel_221222.cza1_gcp_c2s30
0.000	4.840	94.985	0.167	0.008	0.000	0.000	0.000	0.000	0.000	0.056	fbmy8032_rel_221222.cza1_gcp_c2s30
Insert response time histogram
256us	1ms	4ms	16ms	64ms	256ms	1s	4s	16s	gt	max	tag
0.000	0.914	45.352	53.548	0.186	0.000	0.000	0.000	0.000	0.000	0.046	fbmy5635_rel_221222.cza1_gcp_c2s30
0.000	0.033	65.326	34.608	0.033	0.000	0.000	0.000	0.000	0.000	0.046	fbmy8028_rel_221222.cza1_gcp_c2s30
0.000	0.030	89.215	10.744	0.010	0.000	0.000	0.000	0.000	0.000	0.049	fbmy8032_rel_221222.cza1_gcp_c2s30
Delete response time histogram
256us	1ms	4ms	16ms	64ms	256ms	1s	4s	16s	gt	max	tag
0.000	0.772	45.085	53.944	0.199	0.000	0.000	0.000	0.000	0.000	0.046	fbmy5635_rel_221222.cza1_gcp_c2s30
0.000	0.224	65.484	34.258	0.034	0.000	0.000	0.000	0.000	0.000	0.045	fbmy8028_rel_221222.cza1_gcp_c2s30
0.000	0.569	89.239	10.176	0.015	0.001	0.000	0.000	0.000	0.000	0.087	fbmy8032_rel_221222.cza1_gcp_c2s30
qr1000.L5
- qr1000.L5: range queries with 1000 insert/s per client
- Legend for results is here.
- Each entry lists the percentage of responses that fit in that bucket (slower than max time for previous bucket, faster than min time for next bucket).
Query response time histogram
256us	1ms	4ms	16ms	64ms	256ms	1s	4s	16s	gt	max	tag
23.649	44.920	31.311	0.118	0.001	nonzero	0.000	0.000	0.000	0.000	0.137	fbmy5635_rel_221222.cza1_gcp_c2s30
48.935	19.564	31.340	0.160	0.001	nonzero	0.000	0.000	0.000	0.000	0.130	fbmy8028_rel_221222.cza1_gcp_c2s30
56.043	12.762	30.951	0.242	0.001	nonzero	0.000	0.000	0.000	0.000	0.129	fbmy8032_rel_221222.cza1_gcp_c2s30
Insert response time histogram
256us	1ms	4ms	16ms	64ms	256ms	1s	4s	16s	gt	max	tag
0.000	3.463	49.567	46.805	0.166	0.000	0.000	0.000	0.000	0.000	0.033	fbmy5635_rel_221222.cza1_gcp_c2s30
0.000	0.130	62.960	36.832	0.078	0.000	0.000	0.000	0.000	0.000	0.034	fbmy8028_rel_221222.cza1_gcp_c2s30
0.000	0.007	63.608	36.300	0.084	0.000	0.000	0.000	0.000	0.000	0.039	fbmy8032_rel_221222.cza1_gcp_c2s30
Delete response time histogram
256us	1ms	4ms	16ms	64ms	256ms	1s	4s	16s	gt	max	tag
0.000	3.173	49.841	46.828	0.159	0.000	0.000	0.000	0.000	0.000	0.039	fbmy5635_rel_221222.cza1_gcp_c2s30
0.000	0.692	63.532	35.699	0.077	0.000	0.000	0.000	0.000	0.000	0.036	fbmy8028_rel_221222.cza1_gcp_c2s30
0.000	0.194	64.757	34.962	0.086	nonzero	0.000	0.000	0.000	0.000	0.119	fbmy8032_rel_221222.cza1_gcp_c2s30
qp1000.L6
- qp1000.L6: point queries with 1000 insert/s per client
- Legend for results is here.
- Each entry lists the percentage of responses that fit in that bucket (slower than max time for previous bucket, faster than min time for next bucket).
Query response time histogram
256us	1ms	4ms	16ms	64ms	256ms	1s	4s	16s	gt	max	tag
0.000	3.167	96.524	0.296	0.014	nonzero	0.000	0.000	0.000	0.000	0.124	fbmy5635_rel_221222.cza1_gcp_c2s30
0.000	4.215	95.550	0.223	0.012	nonzero	0.000	0.000	0.000	0.000	0.085	fbmy8028_rel_221222.cza1_gcp_c2s30
0.000	3.504	96.224	0.261	0.011	nonzero	0.000	0.000	0.000	0.000	0.108	fbmy8032_rel_221222.cza1_gcp_c2s30
Insert response time histogram
256us	1ms	4ms	16ms	64ms	256ms	1s	4s	16s	gt	max	tag
0.000	0.453	35.626	63.726	0.195	0.000	0.000	0.000	0.000	0.000	0.042	fbmy5635_rel_221222.cza1_gcp_c2s30
0.000	0.055	67.265	32.641	0.039	0.000	0.000	0.000	0.000	0.000	0.052	fbmy8028_rel_221222.cza1_gcp_c2s30
0.000	0.000	49.543	50.408	0.050	0.000	0.000	0.000	0.000	0.000	0.054	fbmy8032_rel_221222.cza1_gcp_c2s30
Delete response time histogram
256us	1ms	4ms	16ms	64ms	256ms	1s	4s	16s	gt	max	tag
0.000	0.543	35.075	64.178	0.202	0.001	0.000	0.000	0.000	0.000	0.137	fbmy5635_rel_221222.cza1_gcp_c2s30
0.000	0.478	67.286	32.185	0.050	nonzero	0.000	0.000	0.000	0.000	0.067	fbmy8028_rel_221222.cza1_gcp_c2s30
0.000	0.017	50.204	49.718	0.060	0.001	0.000	0.000	0.000	0.000	0.094	fbmy8032_rel_221222.cza1_gcp_c2s30