Introduction
This is a report for the insert benchmark with 30M docs and 1 client(s). It is generated by scripts (bash, awk, sed) and Tufte might not be impressed. An overview of the insert benchmark is here and a short update is here. Below, by DBMS, I mean DBMS+version.config. An example is my8020.c10b40 where my means MySQL, 8020 is version 8.0.20 and c10b40 is the name for the configuration file.
The test server has a Beelink SER4 with 8 AMD cores, 16G RAM and an NVMe SSD. It is described here. The benchmark was run with 1 client and there were 1 or 3 connections per client (1 for queries or inserts without rate limits, 1+1 for rate limited inserts+deletes). It uses 1 table. It loads 30M rows per table without secondary indexes, creates 3 secondary indexes per table, then inserts 50m+50m rows per table with a delete per insert to avoid growing the table. It then does 6 read+write tests for 1800s each that do queries as fast as possible with 100,100,500,500,1000,1000 inserts/s and the same for deletes/s per client concurrent with the queries. The database is cached in memory. Clients and the DBMS share one server. The per-database configs are in the per-database subdirectories here.
The tested DBMS are:
- fbmy5635_rel_221222.cza1_bee - MyRocks 5.6.35 from code as of 2023-12-22 at git hash 4f3a57a1, RocksDB 8.7.0 at git hash 29005f0b, cza1_bee config
- fbmy8028_rel_221222.cza1_bee - MyRocks 8.0.28 from code as of 2023-12-22 at git hash 2ad105fc, RocksDB 8.7.0 at git hash 29005f0b, cza1_bee config
- fbmy8032_rel_221222.cza1_bee - MyRocks 8.0.32 from code as of 2023-12-22 at git hash 76707b44, RocksDB 8.7.0 at git hash 29005f0b, cza1_bee config
Contents
- Summary
- l.i0: load without secondary indexes
- l.x: create secondary indexes
- l.i1: continue load after secondary indexes created with 50 inserts per transaction
- l.i2: continue load after secondary indexes created with 5 inserts per transaction
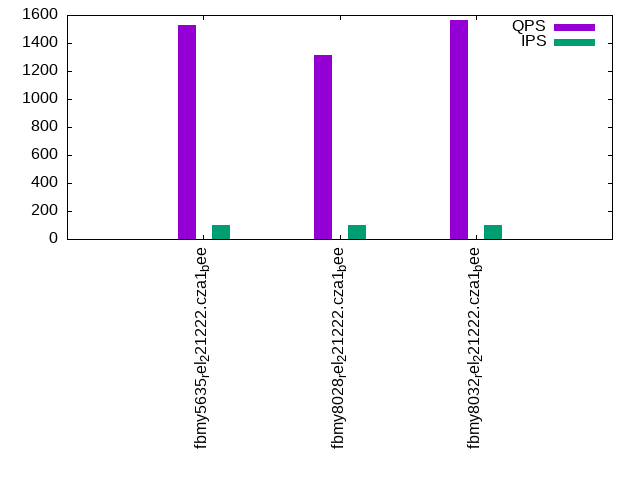
- qr100.L1: range queries with 100 insert/s per client
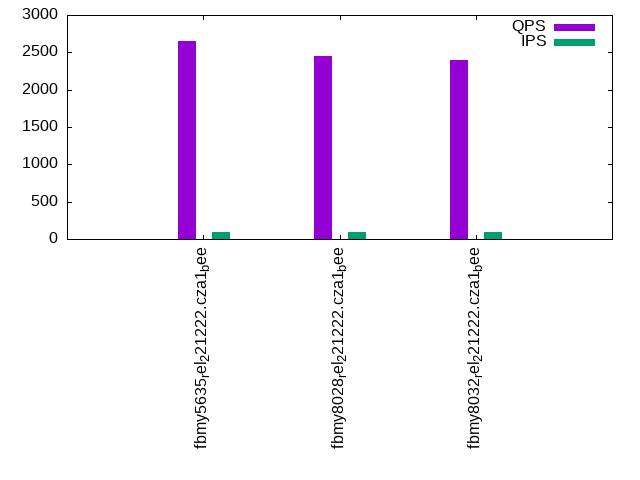
- qp100.L2: point queries with 100 insert/s per client
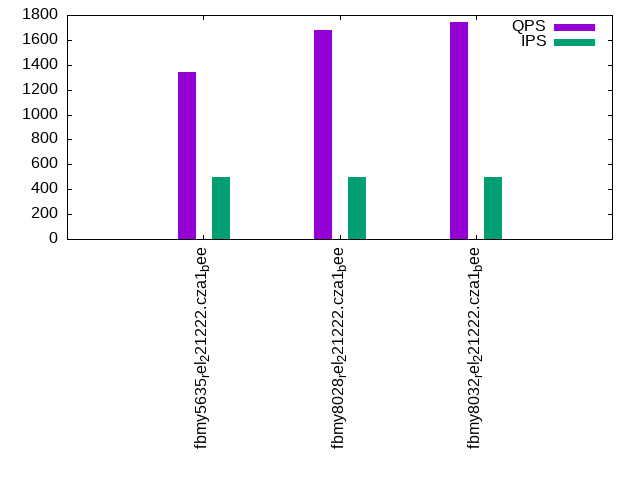
- qr500.L3: range queries with 500 insert/s per client
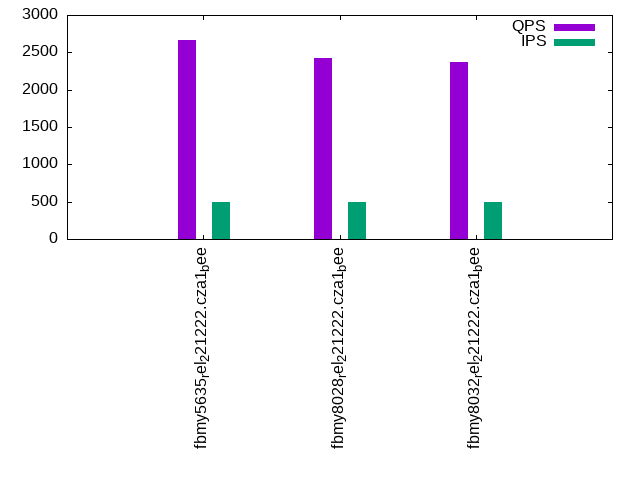
- qp500.L4: point queries with 500 insert/s per client
- qr1000.L5: range queries with 1000 insert/s per client
- qp1000.L6: point queries with 1000 insert/s per client
Summary
The numbers are inserts/s for l.i0, l.i1 and l.i2, indexed docs (or rows) /s for l.x and queries/s for qr100, qp100 thru qr1000, qp1000" The values are the average rate over the entire test for inserts (IPS) and queries (QPS). The range of values for IPS and QPS is split into 3 parts: bottom 25%, middle 50%, top 25%. Values in the bottom 25% have a red background, values in the top 25% have a green background and values in the middle have no color. A gray background is used for values that can be ignored because the DBMS did not sustain the target insert rate. Red backgrounds are not used when the minimum value is within 80% of the max value.
| dbms | l.i0 | l.x | l.i1 | l.i2 | qr100 | qp100 | qr500 | qp500 | qr1000 | qp1000 |
|---|---|---|---|---|---|---|---|---|---|---|
| fbmy5635_rel_221222.cza1_bee | 79156 | 87720 | 27045 | 9671 | 1525 | 2650 | 1338 | 2666 | 1479 | 2638 |
| fbmy8028_rel_221222.cza1_bee | 57803 | 77922 | 22612 | 7837 | 1314 | 2450 | 1681 | 2418 | 1505 | 2414 |
| fbmy8032_rel_221222.cza1_bee | 53957 | 77320 | 21954 | 7669 | 1562 | 2394 | 1746 | 2374 | 1333 | 2354 |
This table has relative throughput, throughput for the DBMS relative to the DBMS in the first line, using the absolute throughput from the previous table. Values less than 0.95 have a yellow background. Values greater than 1.05 have a blue background.
| dbms | l.i0 | l.x | l.i1 | l.i2 | qr100 | qp100 | qr500 | qp500 | qr1000 | qp1000 |
|---|---|---|---|---|---|---|---|---|---|---|
| fbmy5635_rel_221222.cza1_bee | 1.00 | 1.00 | 1.00 | 1.00 | 1.00 | 1.00 | 1.00 | 1.00 | 1.00 | 1.00 |
| fbmy8028_rel_221222.cza1_bee | 0.73 | 0.89 | 0.84 | 0.81 | 0.86 | 0.92 | 1.26 | 0.91 | 1.02 | 0.92 |
| fbmy8032_rel_221222.cza1_bee | 0.68 | 0.88 | 0.81 | 0.79 | 1.02 | 0.90 | 1.30 | 0.89 | 0.90 | 0.89 |
This lists the average rate of inserts/s for the tests that do inserts concurrent with queries. For such tests the query rate is listed in the table above. The read+write tests are setup so that the insert rate should match the target rate every second. Cells that are not at least 95% of the target have a red background to indicate a failure to satisfy the target.
| dbms | qr100.L1 | qp100.L2 | qr500.L3 | qp500.L4 | qr1000.L5 | qp1000.L6 |
|---|---|---|---|---|---|---|
| fbmy5635_rel_221222.cza1_bee | 100 | 100 | 499 | 499 | 998 | 998 |
| fbmy8028_rel_221222.cza1_bee | 100 | 100 | 499 | 499 | 998 | 998 |
| fbmy8032_rel_221222.cza1_bee | 100 | 100 | 499 | 499 | 998 | 998 |
| target | 100 | 100 | 500 | 500 | 1000 | 1000 |
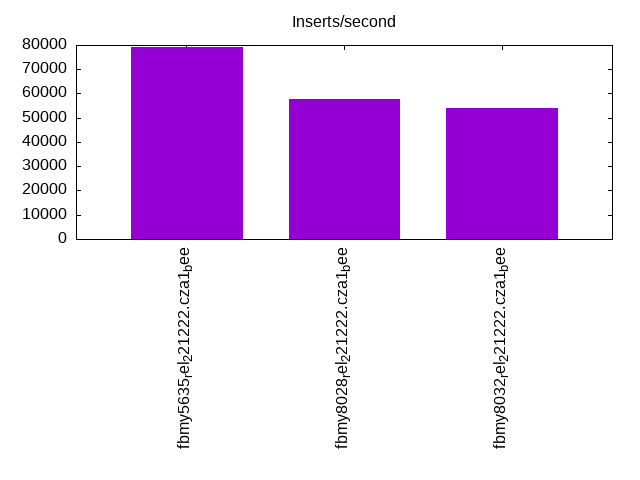
l.i0
l.i0: load without secondary indexes. Graphs for performance per 1-second interval are here.
Average throughput:
Insert response time histogram: each cell has the percentage of responses that take <= the time in the header and max is the max response time in seconds. For the max column values in the top 25% of the range have a red background and in the bottom 25% of the range have a green background. The red background is not used when the min value is within 80% of the max value.
| dbms | 256us | 1ms | 4ms | 16ms | 64ms | 256ms | 1s | 4s | 16s | gt | max |
|---|---|---|---|---|---|---|---|---|---|---|---|
| fbmy5635_rel_221222.cza1_bee | 99.871 | 0.125 | 0.004 | 0.057 | |||||||
| fbmy8028_rel_221222.cza1_bee | 99.723 | 0.203 | 0.071 | 0.003 | 0.082 | ||||||
| fbmy8032_rel_221222.cza1_bee | 99.712 | 0.208 | 0.078 | 0.002 | 0.070 |
Performance metrics for the DBMS listed above. Some are normalized by throughput, others are not. Legend for results is here.
ips	qps	rps	rmbps	wps	wmbps	rpq	rkbpq	wpi	wkbpi	csps	cpups	cspq	cpupq	dbgb1	dbgb2	rss	maxop	p50	p99	tag
79156	0	0	0.0	35.9	13.3	0.000	0.000	0.000	0.172	7778	22.9	0.098	23	1.0	2.5	0.3	0.057	79812	71308	fbmy5635_rel_221222.cza1_bee
57803	0	0	0.0	36.3	11.9	0.000	0.000	0.001	0.211	6068	22.6	0.105	31	0.9	2.7	0.6	0.082	58037	51263	fbmy8028_rel_221222.cza1_bee
53957	0	0	0.0	34.8	11.1	0.000	0.000	0.001	0.210	5839	21.7	0.108	32	0.9	2.7	0.6	0.070	54139	49644	fbmy8032_rel_221222.cza1_bee
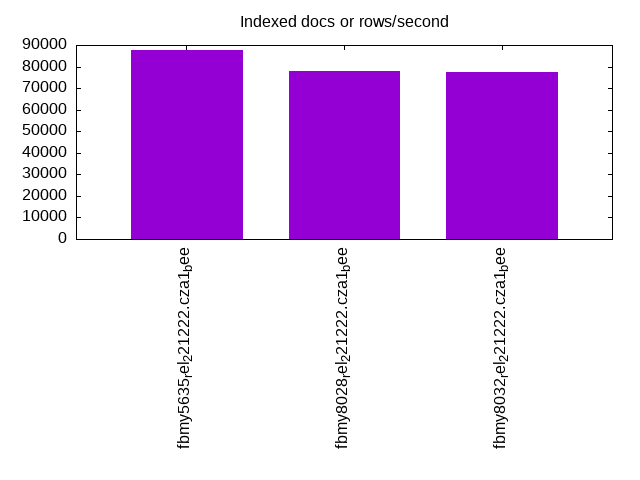
l.x
l.x: create secondary indexes.
Average throughput:
Performance metrics for the DBMS listed above. Some are normalized by throughput, others are not. Legend for results is here.
ips	qps	rps	rmbps	wps	wmbps	rpq	rkbpq	wpi	wkbpi	csps	cpups	cspq	cpupq	dbgb1	dbgb2	rss	maxop	p50	p99	tag
87720	0	0	0.0	36.1	14.3	0.000	0.000	0.000	0.167	217	11.8	0.002	11	2.0	3.6	2.4	0.002	NA	NA	fbmy5635_rel_221222.cza1_bee
77922	0	0	0.0	31.2	12.1	0.000	0.000	0.000	0.159	357	11.7	0.005	12	2.0	3.8	2.7	0.003	NA	NA	fbmy8028_rel_221222.cza1_bee
77320	0	0	0.0	30.9	11.9	0.000	0.000	0.000	0.158	582	11.8	0.008	12	2.0	3.8	2.7	0.003	NA	NA	fbmy8032_rel_221222.cza1_bee
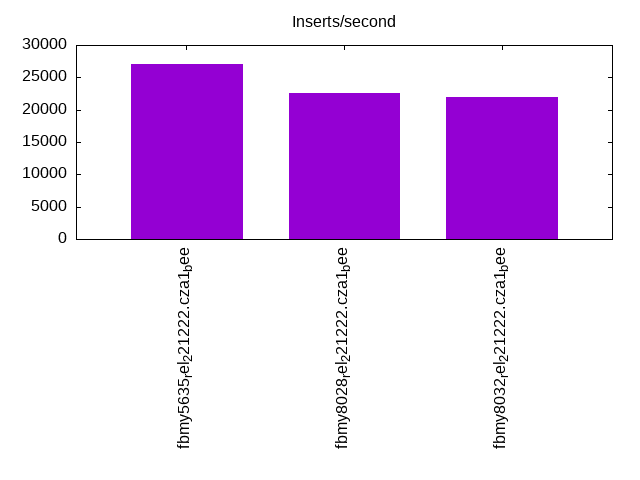
l.i1
l.i1: continue load after secondary indexes created with 50 inserts per transaction. Graphs for performance per 1-second interval are here.
Average throughput:
Insert response time histogram: each cell has the percentage of responses that take <= the time in the header and max is the max response time in seconds. For the max column values in the top 25% of the range have a red background and in the bottom 25% of the range have a green background. The red background is not used when the min value is within 80% of the max value.
| dbms | 256us | 1ms | 4ms | 16ms | 64ms | 256ms | 1s | 4s | 16s | gt | max |
|---|---|---|---|---|---|---|---|---|---|---|---|
| fbmy5635_rel_221222.cza1_bee | 99.810 | 0.184 | 0.005 | 0.001 | 0.073 | ||||||
| fbmy8028_rel_221222.cza1_bee | 99.669 | 0.267 | 0.060 | 0.003 | 0.087 | ||||||
| fbmy8032_rel_221222.cza1_bee | 99.660 | 0.272 | 0.067 | 0.002 | 0.079 |
Delete response time histogram: each cell has the percentage of responses that take <= the time in the header and max is the max response time in seconds. For the max column values in the top 25% of the range have a red background and in the bottom 25% of the range have a green background. The red background is not used when the min value is within 80% of the max value.
| dbms | 256us | 1ms | 4ms | 16ms | 64ms | 256ms | 1s | 4s | 16s | gt | max |
|---|---|---|---|---|---|---|---|---|---|---|---|
| fbmy5635_rel_221222.cza1_bee | 99.801 | 0.189 | 0.008 | 0.001 | 0.073 | ||||||
| fbmy8028_rel_221222.cza1_bee | 99.659 | 0.271 | 0.067 | 0.003 | 0.093 | ||||||
| fbmy8032_rel_221222.cza1_bee | 99.650 | 0.273 | 0.075 | 0.002 | 0.089 |
Performance metrics for the DBMS listed above. Some are normalized by throughput, others are not. Legend for results is here.
ips	qps	rps	rmbps	wps	wmbps	rpq	rkbpq	wpi	wkbpi	csps	cpups	cspq	cpupq	dbgb1	dbgb2	rss	maxop	p50	p99	tag
27045	0	151	0.8	120.5	48.0	0.006	0.032	0.004	1.817	11706	48.4	0.433	143	2.8	3.5	5.3	0.073	27021	24223	fbmy5635_rel_221222.cza1_bee
22612	0	139	0.8	107.7	41.3	0.006	0.035	0.005	1.868	10151	46.1	0.449	163	2.6	3.5	5.3	0.087	22575	20126	fbmy8028_rel_221222.cza1_bee
21954	0	122	0.7	103.9	39.5	0.006	0.032	0.005	1.841	10003	45.6	0.456	166	2.3	3.1	5.3	0.079	21925	19382	fbmy8032_rel_221222.cza1_bee
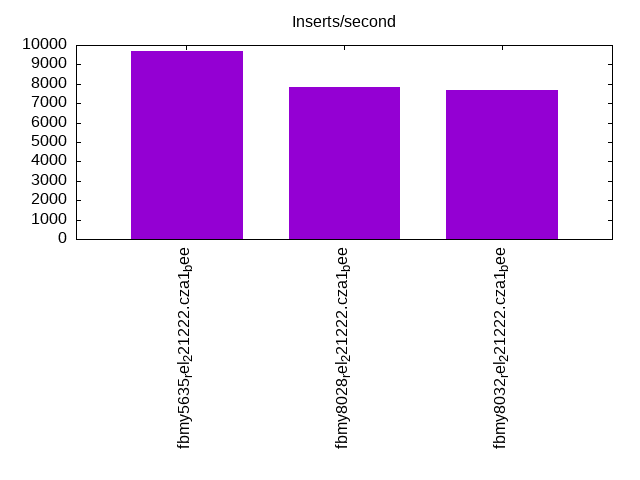
l.i2
l.i2: continue load after secondary indexes created with 5 inserts per transaction. Graphs for performance per 1-second interval are here.
Average throughput:
Insert response time histogram: each cell has the percentage of responses that take <= the time in the header and max is the max response time in seconds. For the max column values in the top 25% of the range have a red background and in the bottom 25% of the range have a green background. The red background is not used when the min value is within 80% of the max value.
| dbms | 256us | 1ms | 4ms | 16ms | 64ms | 256ms | 1s | 4s | 16s | gt | max |
|---|---|---|---|---|---|---|---|---|---|---|---|
| fbmy5635_rel_221222.cza1_bee | 0.020 | 99.913 | 0.015 | 0.051 | 0.001 | 0.059 | |||||
| fbmy8028_rel_221222.cza1_bee | 99.826 | 0.089 | 0.082 | 0.002 | 0.001 | 0.096 | |||||
| fbmy8032_rel_221222.cza1_bee | 99.808 | 0.106 | 0.083 | 0.003 | nonzero | 0.068 |
Delete response time histogram: each cell has the percentage of responses that take <= the time in the header and max is the max response time in seconds. For the max column values in the top 25% of the range have a red background and in the bottom 25% of the range have a green background. The red background is not used when the min value is within 80% of the max value.
| dbms | 256us | 1ms | 4ms | 16ms | 64ms | 256ms | 1s | 4s | 16s | gt | max |
|---|---|---|---|---|---|---|---|---|---|---|---|
| fbmy5635_rel_221222.cza1_bee | 99.933 | 0.014 | 0.052 | 0.002 | 0.059 | ||||||
| fbmy8028_rel_221222.cza1_bee | 99.780 | 0.133 | 0.084 | 0.003 | nonzero | 0.083 | |||||
| fbmy8032_rel_221222.cza1_bee | 99.751 | 0.162 | 0.084 | 0.003 | nonzero | 0.068 |
Performance metrics for the DBMS listed above. Some are normalized by throughput, others are not. Legend for results is here.
ips	qps	rps	rmbps	wps	wmbps	rpq	rkbpq	wpi	wkbpi	csps	cpups	cspq	cpupq	dbgb1	dbgb2	rss	maxop	p50	p99	tag
9671	0	29	0.2	106.2	39.6	0.003	0.017	0.011	4.193	39876	45.5	4.123	376	2.2	2.4	7.2	0.059	9554	8080	fbmy5635_rel_221222.cza1_bee
7837	0	26	0.1	96.1	34.8	0.003	0.019	0.012	4.553	32754	43.0	4.179	439	2.2	2.6	7.5	0.096	7826	6852	fbmy8028_rel_221222.cza1_bee
7669	0	14	0.1	92.5	33.9	0.002	0.010	0.012	4.525	32196	42.9	4.198	448	2.2	2.5	7.4	0.068	7626	6742	fbmy8032_rel_221222.cza1_bee
qr100.L1
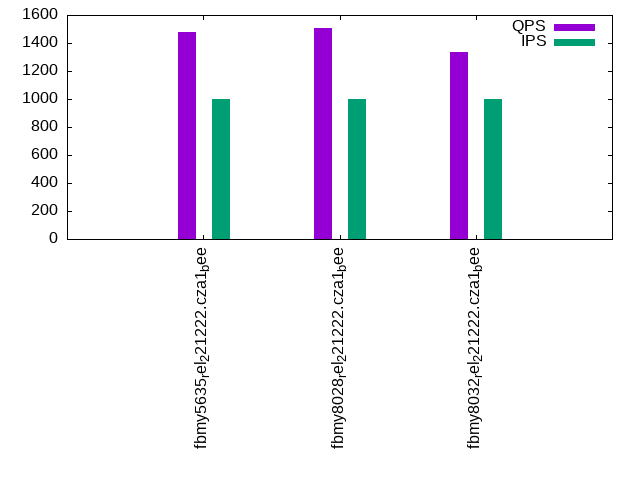
qr100.L1: range queries with 100 insert/s per client. Graphs for performance per 1-second interval are here.
Average throughput:
Query response time histogram: each cell has the percentage of responses that take <= the time in the header and max is the max response time in seconds. For max values in the top 25% of the range have a red background and in the bottom 25% of the range have a green background. The red background is not used when the min value is within 80% of the max value.
| dbms | 256us | 1ms | 4ms | 16ms | 64ms | 256ms | 1s | 4s | 16s | gt | max |
|---|---|---|---|---|---|---|---|---|---|---|---|
| fbmy5635_rel_221222.cza1_bee | 14.460 | 66.014 | 19.515 | 0.011 | nonzero | 0.026 | |||||
| fbmy8028_rel_221222.cza1_bee | 5.684 | 61.043 | 33.273 | nonzero | nonzero | 0.028 | |||||
| fbmy8032_rel_221222.cza1_bee | 8.397 | 72.433 | 19.170 | nonzero | nonzero | 0.024 |
Insert response time histogram: each cell has the percentage of responses that take <= the time in the header and max is the max response time in seconds. For max values in the top 25% of the range have a red background and in the bottom 25% of the range have a green background. The red background is not used when the min value is within 80% of the max value.
| dbms | 256us | 1ms | 4ms | 16ms | 64ms | 256ms | 1s | 4s | 16s | gt | max |
|---|---|---|---|---|---|---|---|---|---|---|---|
| fbmy5635_rel_221222.cza1_bee | 99.361 | 0.639 | 0.009 | ||||||||
| fbmy8028_rel_221222.cza1_bee | 99.083 | 0.889 | 0.028 | 0.017 | |||||||
| fbmy8032_rel_221222.cza1_bee | 99.417 | 0.556 | 0.028 | 0.018 |
Delete response time histogram: each cell has the percentage of responses that take <= the time in the header and max is the max response time in seconds. For max values in the top 25% of the range have a red background and in the bottom 25% of the range have a green background. The red background is not used when the min value is within 80% of the max value.
| dbms | 256us | 1ms | 4ms | 16ms | 64ms | 256ms | 1s | 4s | 16s | gt | max |
|---|---|---|---|---|---|---|---|---|---|---|---|
| fbmy5635_rel_221222.cza1_bee | 99.389 | 0.611 | 0.008 | ||||||||
| fbmy8028_rel_221222.cza1_bee | 99.306 | 0.667 | 0.028 | 0.017 | |||||||
| fbmy8032_rel_221222.cza1_bee | 99.556 | 0.417 | 0.028 | 0.018 |
Performance metrics for the DBMS listed above. Some are normalized by throughput, others are not. Legend for results is here.
ips	qps	rps	rmbps	wps	wmbps	rpq	rkbpq	wpi	wkbpi	csps	cpups	cspq	cpupq	dbgb1	dbgb2	rss	maxop	p50	p99	tag
100	1525	0	0.0	3.9	0.3	0.000	0.000	0.039	3.472	5977	11.9	3.919	624	2.1	2.2	7.5	0.026	1519	1392	fbmy5635_rel_221222.cza1_bee
100	1314	0	0.0	4.1	0.4	0.000	0.000	0.041	3.644	5306	12.6	4.038	767	2.1	2.3	7.8	0.028	1311	1215	fbmy8028_rel_221222.cza1_bee
100	1562	0	0.0	4.1	0.3	0.000	0.000	0.041	3.439	6445	12.5	4.126	640	2.1	2.3	7.7	0.024	1566	1440	fbmy8032_rel_221222.cza1_bee
qp100.L2
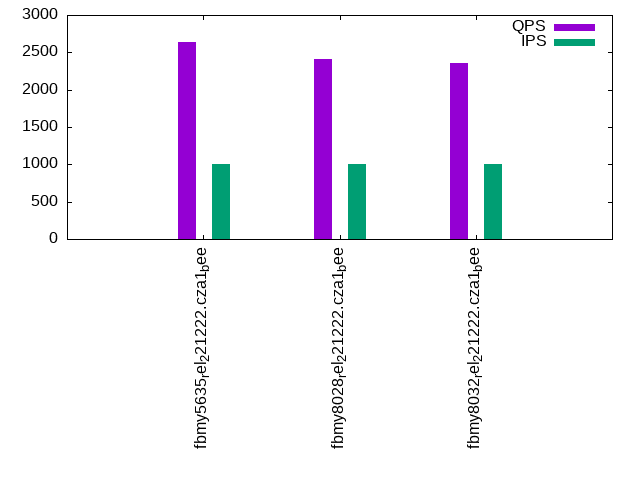
qp100.L2: point queries with 100 insert/s per client. Graphs for performance per 1-second interval are here.
Average throughput:
Query response time histogram: each cell has the percentage of responses that take <= the time in the header and max is the max response time in seconds. For max values in the top 25% of the range have a red background and in the bottom 25% of the range have a green background. The red background is not used when the min value is within 80% of the max value.
| dbms | 256us | 1ms | 4ms | 16ms | 64ms | 256ms | 1s | 4s | 16s | gt | max |
|---|---|---|---|---|---|---|---|---|---|---|---|
| fbmy5635_rel_221222.cza1_bee | 8.474 | 91.523 | 0.003 | 0.004 | |||||||
| fbmy8028_rel_221222.cza1_bee | nonzero | 99.984 | 0.014 | 0.001 | 0.010 | ||||||
| fbmy8032_rel_221222.cza1_bee | nonzero | 99.991 | 0.008 | 0.002 | 0.010 |
Insert response time histogram: each cell has the percentage of responses that take <= the time in the header and max is the max response time in seconds. For max values in the top 25% of the range have a red background and in the bottom 25% of the range have a green background. The red background is not used when the min value is within 80% of the max value.
| dbms | 256us | 1ms | 4ms | 16ms | 64ms | 256ms | 1s | 4s | 16s | gt | max |
|---|---|---|---|---|---|---|---|---|---|---|---|
| fbmy5635_rel_221222.cza1_bee | 99.472 | 0.528 | 0.010 | ||||||||
| fbmy8028_rel_221222.cza1_bee | 99.694 | 0.278 | 0.028 | 0.018 | |||||||
| fbmy8032_rel_221222.cza1_bee | 99.250 | 0.722 | 0.028 | 0.017 |
Delete response time histogram: each cell has the percentage of responses that take <= the time in the header and max is the max response time in seconds. For max values in the top 25% of the range have a red background and in the bottom 25% of the range have a green background. The red background is not used when the min value is within 80% of the max value.
| dbms | 256us | 1ms | 4ms | 16ms | 64ms | 256ms | 1s | 4s | 16s | gt | max |
|---|---|---|---|---|---|---|---|---|---|---|---|
| fbmy5635_rel_221222.cza1_bee | 99.556 | 0.444 | 0.009 | ||||||||
| fbmy8028_rel_221222.cza1_bee | 99.806 | 0.167 | 0.028 | 0.017 | |||||||
| fbmy8032_rel_221222.cza1_bee | 99.444 | 0.528 | 0.028 | 0.017 |
Performance metrics for the DBMS listed above. Some are normalized by throughput, others are not. Legend for results is here.
ips	qps	rps	rmbps	wps	wmbps	rpq	rkbpq	wpi	wkbpi	csps	cpups	cspq	cpupq	dbgb1	dbgb2	rss	maxop	p50	p99	tag
100	2650	0	0.0	4.0	0.4	0.000	0.000	0.040	3.776	10815	13.2	4.080	398	2.1	2.2	8.5	0.004	2574	2364	fbmy5635_rel_221222.cza1_bee
100	2450	34	0.2	4.2	0.4	0.014	0.087	0.042	4.437	10237	13.6	4.178	444	2.1	2.4	8.9	0.010	2429	1902	fbmy8028_rel_221222.cza1_bee
100	2394	17	0.1	4.0	0.4	0.007	0.044	0.040	3.733	10149	13.3	4.240	445	2.1	2.4	8.8	0.010	2366	1902	fbmy8032_rel_221222.cza1_bee
qr500.L3
qr500.L3: range queries with 500 insert/s per client. Graphs for performance per 1-second interval are here.
Average throughput:
Query response time histogram: each cell has the percentage of responses that take <= the time in the header and max is the max response time in seconds. For max values in the top 25% of the range have a red background and in the bottom 25% of the range have a green background. The red background is not used when the min value is within 80% of the max value.
| dbms | 256us | 1ms | 4ms | 16ms | 64ms | 256ms | 1s | 4s | 16s | gt | max |
|---|---|---|---|---|---|---|---|---|---|---|---|
| fbmy5635_rel_221222.cza1_bee | 12.987 | 61.255 | 25.747 | 0.010 | nonzero | 0.031 | |||||
| fbmy8028_rel_221222.cza1_bee | 6.299 | 82.901 | 10.800 | nonzero | nonzero | 0.031 | |||||
| fbmy8032_rel_221222.cza1_bee | 8.304 | 79.883 | 11.812 | nonzero | nonzero | 0.033 |
Insert response time histogram: each cell has the percentage of responses that take <= the time in the header and max is the max response time in seconds. For max values in the top 25% of the range have a red background and in the bottom 25% of the range have a green background. The red background is not used when the min value is within 80% of the max value.
| dbms | 256us | 1ms | 4ms | 16ms | 64ms | 256ms | 1s | 4s | 16s | gt | max |
|---|---|---|---|---|---|---|---|---|---|---|---|
| fbmy5635_rel_221222.cza1_bee | 99.717 | 0.283 | 0.009 | ||||||||
| fbmy8028_rel_221222.cza1_bee | 99.689 | 0.228 | 0.083 | 0.018 | |||||||
| fbmy8032_rel_221222.cza1_bee | 99.617 | 0.300 | 0.083 | 0.021 |
Delete response time histogram: each cell has the percentage of responses that take <= the time in the header and max is the max response time in seconds. For max values in the top 25% of the range have a red background and in the bottom 25% of the range have a green background. The red background is not used when the min value is within 80% of the max value.
| dbms | 256us | 1ms | 4ms | 16ms | 64ms | 256ms | 1s | 4s | 16s | gt | max |
|---|---|---|---|---|---|---|---|---|---|---|---|
| fbmy5635_rel_221222.cza1_bee | 99.761 | 0.239 | 0.009 | ||||||||
| fbmy8028_rel_221222.cza1_bee | 99.711 | 0.211 | 0.078 | 0.018 | |||||||
| fbmy8032_rel_221222.cza1_bee | 99.689 | 0.233 | 0.078 | 0.022 |
Performance metrics for the DBMS listed above. Some are normalized by throughput, others are not. Legend for results is here.
ips	qps	rps	rmbps	wps	wmbps	rpq	rkbpq	wpi	wkbpi	csps	cpups	cspq	cpupq	dbgb1	dbgb2	rss	maxop	p50	p99	tag
499	1338	0	0.0	8.4	2.3	0.000	0.000	0.017	4.702	5402	13.4	4.036	801	2.1	2.4	8.4	0.031	1327	1167	fbmy5635_rel_221222.cza1_bee
499	1681	0	0.0	8.5	2.3	0.000	0.000	0.017	4.763	6853	13.6	4.076	647	2.1	2.6	8.9	0.031	1742	1071	fbmy8028_rel_221222.cza1_bee
499	1746	0	0.0	8.7	2.4	0.000	0.000	0.017	4.845	7304	14.0	4.184	642	2.1	2.6	8.8	0.033	1806	1215	fbmy8032_rel_221222.cza1_bee
qp500.L4
qp500.L4: point queries with 500 insert/s per client. Graphs for performance per 1-second interval are here.
Average throughput:
Query response time histogram: each cell has the percentage of responses that take <= the time in the header and max is the max response time in seconds. For max values in the top 25% of the range have a red background and in the bottom 25% of the range have a green background. The red background is not used when the min value is within 80% of the max value.
| dbms | 256us | 1ms | 4ms | 16ms | 64ms | 256ms | 1s | 4s | 16s | gt | max |
|---|---|---|---|---|---|---|---|---|---|---|---|
| fbmy5635_rel_221222.cza1_bee | 6.788 | 93.208 | 0.004 | nonzero | 0.009 | ||||||
| fbmy8028_rel_221222.cza1_bee | 0.002 | 99.993 | 0.005 | nonzero | 0.010 | ||||||
| fbmy8032_rel_221222.cza1_bee | 99.993 | 0.007 | 0.003 |
Insert response time histogram: each cell has the percentage of responses that take <= the time in the header and max is the max response time in seconds. For max values in the top 25% of the range have a red background and in the bottom 25% of the range have a green background. The red background is not used when the min value is within 80% of the max value.
| dbms | 256us | 1ms | 4ms | 16ms | 64ms | 256ms | 1s | 4s | 16s | gt | max |
|---|---|---|---|---|---|---|---|---|---|---|---|
| fbmy5635_rel_221222.cza1_bee | 99.533 | 0.467 | 0.012 | ||||||||
| fbmy8028_rel_221222.cza1_bee | 99.661 | 0.250 | 0.089 | 0.019 | |||||||
| fbmy8032_rel_221222.cza1_bee | 99.500 | 0.411 | 0.089 | 0.018 |
Delete response time histogram: each cell has the percentage of responses that take <= the time in the header and max is the max response time in seconds. For max values in the top 25% of the range have a red background and in the bottom 25% of the range have a green background. The red background is not used when the min value is within 80% of the max value.
| dbms | 256us | 1ms | 4ms | 16ms | 64ms | 256ms | 1s | 4s | 16s | gt | max |
|---|---|---|---|---|---|---|---|---|---|---|---|
| fbmy5635_rel_221222.cza1_bee | 99.544 | 0.456 | 0.012 | ||||||||
| fbmy8028_rel_221222.cza1_bee | 99.717 | 0.200 | 0.083 | 0.019 | |||||||
| fbmy8032_rel_221222.cza1_bee | 99.528 | 0.389 | 0.083 | 0.018 |
Performance metrics for the DBMS listed above. Some are normalized by throughput, others are not. Legend for results is here.
ips	qps	rps	rmbps	wps	wmbps	rpq	rkbpq	wpi	wkbpi	csps	cpups	cspq	cpupq	dbgb1	dbgb2	rss	maxop	p50	p99	tag
499	2666	3	0.0	8.4	2.3	0.001	0.006	0.017	4.768	11022	14.7	4.135	441	2.1	2.6	8.6	0.009	2603	2399	fbmy5635_rel_221222.cza1_bee
499	2418	12	0.1	8.6	2.3	0.005	0.028	0.017	4.773	10194	15.1	4.216	500	2.1	2.8	9.0	0.010	2397	2009	fbmy8028_rel_221222.cza1_bee
499	2374	0	0.0	8.5	2.2	0.000	0.000	0.017	4.566	10163	15.0	4.282	506	2.1	2.8	8.9	0.003	2349	1932	fbmy8032_rel_221222.cza1_bee
qr1000.L5
qr1000.L5: range queries with 1000 insert/s per client. Graphs for performance per 1-second interval are here.
Average throughput:
Query response time histogram: each cell has the percentage of responses that take <= the time in the header and max is the max response time in seconds. For max values in the top 25% of the range have a red background and in the bottom 25% of the range have a green background. The red background is not used when the min value is within 80% of the max value.
| dbms | 256us | 1ms | 4ms | 16ms | 64ms | 256ms | 1s | 4s | 16s | gt | max |
|---|---|---|---|---|---|---|---|---|---|---|---|
| fbmy5635_rel_221222.cza1_bee | 13.394 | 60.797 | 25.808 | 0.001 | nonzero | 0.030 | |||||
| fbmy8028_rel_221222.cza1_bee | 6.434 | 75.407 | 18.158 | 0.001 | nonzero | 0.031 | |||||
| fbmy8032_rel_221222.cza1_bee | 7.520 | 70.915 | 21.558 | 0.007 | nonzero | 0.032 |
Insert response time histogram: each cell has the percentage of responses that take <= the time in the header and max is the max response time in seconds. For max values in the top 25% of the range have a red background and in the bottom 25% of the range have a green background. The red background is not used when the min value is within 80% of the max value.
| dbms | 256us | 1ms | 4ms | 16ms | 64ms | 256ms | 1s | 4s | 16s | gt | max |
|---|---|---|---|---|---|---|---|---|---|---|---|
| fbmy5635_rel_221222.cza1_bee | 99.803 | 0.192 | 0.006 | 0.040 | |||||||
| fbmy8028_rel_221222.cza1_bee | 99.436 | 0.497 | 0.067 | 0.050 | |||||||
| fbmy8032_rel_221222.cza1_bee | 99.544 | 0.378 | 0.078 | 0.050 |
Delete response time histogram: each cell has the percentage of responses that take <= the time in the header and max is the max response time in seconds. For max values in the top 25% of the range have a red background and in the bottom 25% of the range have a green background. The red background is not used when the min value is within 80% of the max value.
| dbms | 256us | 1ms | 4ms | 16ms | 64ms | 256ms | 1s | 4s | 16s | gt | max |
|---|---|---|---|---|---|---|---|---|---|---|---|
| fbmy5635_rel_221222.cza1_bee | 99.806 | 0.189 | 0.006 | 0.040 | |||||||
| fbmy8028_rel_221222.cza1_bee | 99.436 | 0.492 | 0.069 | 0.003 | 0.065 | ||||||
| fbmy8032_rel_221222.cza1_bee | 99.564 | 0.361 | 0.075 | 0.042 |
Performance metrics for the DBMS listed above. Some are normalized by throughput, others are not. Legend for results is here.
ips	qps	rps	rmbps	wps	wmbps	rpq	rkbpq	wpi	wkbpi	csps	cpups	cspq	cpupq	dbgb1	dbgb2	rss	maxop	p50	p99	tag
998	1479	7	0.0	14.2	4.7	0.005	0.027	0.014	4.800	6177	15.2	4.176	822	2.1	3.0	8.6	0.030	1486	1087	fbmy5635_rel_221222.cza1_bee
998	1505	52	0.3	14.2	4.5	0.034	0.199	0.014	4.659	6566	15.5	4.364	824	2.2	3.2	9.1	0.031	1359	1086	fbmy8028_rel_221222.cza1_bee
998	1333	16	0.1	14.4	4.7	0.012	0.075	0.014	4.821	5973	15.5	4.481	930	2.2	3.2	9.0	0.032	1295	1055	fbmy8032_rel_221222.cza1_bee
qp1000.L6
qp1000.L6: point queries with 1000 insert/s per client. Graphs for performance per 1-second interval are here.
Average throughput:
Query response time histogram: each cell has the percentage of responses that take <= the time in the header and max is the max response time in seconds. For max values in the top 25% of the range have a red background and in the bottom 25% of the range have a green background. The red background is not used when the min value is within 80% of the max value.
| dbms | 256us | 1ms | 4ms | 16ms | 64ms | 256ms | 1s | 4s | 16s | gt | max |
|---|---|---|---|---|---|---|---|---|---|---|---|
| fbmy5635_rel_221222.cza1_bee | 5.802 | 94.192 | 0.006 | nonzero | 0.013 | ||||||
| fbmy8028_rel_221222.cza1_bee | nonzero | 99.988 | 0.011 | 0.001 | 0.007 | ||||||
| fbmy8032_rel_221222.cza1_bee | nonzero | 99.990 | 0.010 | nonzero | 0.005 |
Insert response time histogram: each cell has the percentage of responses that take <= the time in the header and max is the max response time in seconds. For max values in the top 25% of the range have a red background and in the bottom 25% of the range have a green background. The red background is not used when the min value is within 80% of the max value.
| dbms | 256us | 1ms | 4ms | 16ms | 64ms | 256ms | 1s | 4s | 16s | gt | max |
|---|---|---|---|---|---|---|---|---|---|---|---|
| fbmy5635_rel_221222.cza1_bee | 99.647 | 0.350 | 0.003 | 0.048 | |||||||
| fbmy8028_rel_221222.cza1_bee | 99.558 | 0.356 | 0.083 | 0.003 | 0.067 | ||||||
| fbmy8032_rel_221222.cza1_bee | 99.531 | 0.392 | 0.078 | 0.056 |
Delete response time histogram: each cell has the percentage of responses that take <= the time in the header and max is the max response time in seconds. For max values in the top 25% of the range have a red background and in the bottom 25% of the range have a green background. The red background is not used when the min value is within 80% of the max value.
| dbms | 256us | 1ms | 4ms | 16ms | 64ms | 256ms | 1s | 4s | 16s | gt | max |
|---|---|---|---|---|---|---|---|---|---|---|---|
| fbmy5635_rel_221222.cza1_bee | 99.619 | 0.372 | 0.008 | 0.049 | |||||||
| fbmy8028_rel_221222.cza1_bee | 99.592 | 0.325 | 0.083 | 0.052 | |||||||
| fbmy8032_rel_221222.cza1_bee | 99.581 | 0.344 | 0.075 | 0.042 |
Performance metrics for the DBMS listed above. Some are normalized by throughput, others are not. Legend for results is here.
ips	qps	rps	rmbps	wps	wmbps	rpq	rkbpq	wpi	wkbpi	csps	cpups	cspq	cpupq	dbgb1	dbgb2	rss	maxop	p50	p99	tag
998	2638	38	0.2	14.0	4.6	0.015	0.086	0.014	4.707	11197	16.3	4.245	494	2.1	3.4	8.7	0.013	2573	2380	fbmy5635_rel_221222.cza1_bee
998	2414	67	0.4	14.3	4.7	0.028	0.161	0.014	4.783	10480	16.5	4.342	547	2.1	3.6	9.4	0.007	2397	1966	fbmy8028_rel_221222.cza1_bee
998	2354	47	0.3	14.5	4.7	0.020	0.119	0.015	4.781	10402	16.7	4.418	567	2.2	3.6	9.2	0.005	2333	1934	fbmy8032_rel_221222.cza1_bee
l.i0
l.i0: load without secondary indexes
Performance metrics for all DBMS, not just the ones listed above. Some are normalized by throughput, others are not. Legend for results is here.
ips	qps	rps	rmbps	wps	wmbps	rpq	rkbpq	wpi	wkbpi	csps	cpups	cspq	cpupq	dbgb1	dbgb2	rss	maxop	p50	p99	tag
79156	0	0	0.0	35.9	13.3	0.000	0.000	0.000	0.172	7778	22.9	0.098	23	1.0	2.5	0.3	0.057	79812	71308	fbmy5635_rel_221222.cza1_bee
57803	0	0	0.0	36.3	11.9	0.000	0.000	0.001	0.211	6068	22.6	0.105	31	0.9	2.7	0.6	0.082	58037	51263	fbmy8028_rel_221222.cza1_bee
53957	0	0	0.0	34.8	11.1	0.000	0.000	0.001	0.210	5839	21.7	0.108	32	0.9	2.7	0.6	0.070	54139	49644	fbmy8032_rel_221222.cza1_bee
l.x
l.x: create secondary indexes
Performance metrics for all DBMS, not just the ones listed above. Some are normalized by throughput, others are not. Legend for results is here.
ips	qps	rps	rmbps	wps	wmbps	rpq	rkbpq	wpi	wkbpi	csps	cpups	cspq	cpupq	dbgb1	dbgb2	rss	maxop	p50	p99	tag
87720	0	0	0.0	36.1	14.3	0.000	0.000	0.000	0.167	217	11.8	0.002	11	2.0	3.6	2.4	0.002	NA	NA	fbmy5635_rel_221222.cza1_bee
77922	0	0	0.0	31.2	12.1	0.000	0.000	0.000	0.159	357	11.7	0.005	12	2.0	3.8	2.7	0.003	NA	NA	fbmy8028_rel_221222.cza1_bee
77320	0	0	0.0	30.9	11.9	0.000	0.000	0.000	0.158	582	11.8	0.008	12	2.0	3.8	2.7	0.003	NA	NA	fbmy8032_rel_221222.cza1_bee
l.i1
l.i1: continue load after secondary indexes created with 50 inserts per transaction
Performance metrics for all DBMS, not just the ones listed above. Some are normalized by throughput, others are not. Legend for results is here.
ips	qps	rps	rmbps	wps	wmbps	rpq	rkbpq	wpi	wkbpi	csps	cpups	cspq	cpupq	dbgb1	dbgb2	rss	maxop	p50	p99	tag
27045	0	151	0.8	120.5	48.0	0.006	0.032	0.004	1.817	11706	48.4	0.433	143	2.8	3.5	5.3	0.073	27021	24223	fbmy5635_rel_221222.cza1_bee
22612	0	139	0.8	107.7	41.3	0.006	0.035	0.005	1.868	10151	46.1	0.449	163	2.6	3.5	5.3	0.087	22575	20126	fbmy8028_rel_221222.cza1_bee
21954	0	122	0.7	103.9	39.5	0.006	0.032	0.005	1.841	10003	45.6	0.456	166	2.3	3.1	5.3	0.079	21925	19382	fbmy8032_rel_221222.cza1_bee
l.i2
l.i2: continue load after secondary indexes created with 5 inserts per transaction
Performance metrics for all DBMS, not just the ones listed above. Some are normalized by throughput, others are not. Legend for results is here.
ips	qps	rps	rmbps	wps	wmbps	rpq	rkbpq	wpi	wkbpi	csps	cpups	cspq	cpupq	dbgb1	dbgb2	rss	maxop	p50	p99	tag
9671	0	29	0.2	106.2	39.6	0.003	0.017	0.011	4.193	39876	45.5	4.123	376	2.2	2.4	7.2	0.059	9554	8080	fbmy5635_rel_221222.cza1_bee
7837	0	26	0.1	96.1	34.8	0.003	0.019	0.012	4.553	32754	43.0	4.179	439	2.2	2.6	7.5	0.096	7826	6852	fbmy8028_rel_221222.cza1_bee
7669	0	14	0.1	92.5	33.9	0.002	0.010	0.012	4.525	32196	42.9	4.198	448	2.2	2.5	7.4	0.068	7626	6742	fbmy8032_rel_221222.cza1_bee
qr100.L1
qr100.L1: range queries with 100 insert/s per client
Performance metrics for all DBMS, not just the ones listed above. Some are normalized by throughput, others are not. Legend for results is here.
ips	qps	rps	rmbps	wps	wmbps	rpq	rkbpq	wpi	wkbpi	csps	cpups	cspq	cpupq	dbgb1	dbgb2	rss	maxop	p50	p99	tag
100	1525	0	0.0	3.9	0.3	0.000	0.000	0.039	3.472	5977	11.9	3.919	624	2.1	2.2	7.5	0.026	1519	1392	fbmy5635_rel_221222.cza1_bee
100	1314	0	0.0	4.1	0.4	0.000	0.000	0.041	3.644	5306	12.6	4.038	767	2.1	2.3	7.8	0.028	1311	1215	fbmy8028_rel_221222.cza1_bee
100	1562	0	0.0	4.1	0.3	0.000	0.000	0.041	3.439	6445	12.5	4.126	640	2.1	2.3	7.7	0.024	1566	1440	fbmy8032_rel_221222.cza1_bee
qp100.L2
qp100.L2: point queries with 100 insert/s per client
Performance metrics for all DBMS, not just the ones listed above. Some are normalized by throughput, others are not. Legend for results is here.
ips	qps	rps	rmbps	wps	wmbps	rpq	rkbpq	wpi	wkbpi	csps	cpups	cspq	cpupq	dbgb1	dbgb2	rss	maxop	p50	p99	tag
100	2650	0	0.0	4.0	0.4	0.000	0.000	0.040	3.776	10815	13.2	4.080	398	2.1	2.2	8.5	0.004	2574	2364	fbmy5635_rel_221222.cza1_bee
100	2450	34	0.2	4.2	0.4	0.014	0.087	0.042	4.437	10237	13.6	4.178	444	2.1	2.4	8.9	0.010	2429	1902	fbmy8028_rel_221222.cza1_bee
100	2394	17	0.1	4.0	0.4	0.007	0.044	0.040	3.733	10149	13.3	4.240	445	2.1	2.4	8.8	0.010	2366	1902	fbmy8032_rel_221222.cza1_bee
qr500.L3
qr500.L3: range queries with 500 insert/s per client
Performance metrics for all DBMS, not just the ones listed above. Some are normalized by throughput, others are not. Legend for results is here.
ips	qps	rps	rmbps	wps	wmbps	rpq	rkbpq	wpi	wkbpi	csps	cpups	cspq	cpupq	dbgb1	dbgb2	rss	maxop	p50	p99	tag
499	1338	0	0.0	8.4	2.3	0.000	0.000	0.017	4.702	5402	13.4	4.036	801	2.1	2.4	8.4	0.031	1327	1167	fbmy5635_rel_221222.cza1_bee
499	1681	0	0.0	8.5	2.3	0.000	0.000	0.017	4.763	6853	13.6	4.076	647	2.1	2.6	8.9	0.031	1742	1071	fbmy8028_rel_221222.cza1_bee
499	1746	0	0.0	8.7	2.4	0.000	0.000	0.017	4.845	7304	14.0	4.184	642	2.1	2.6	8.8	0.033	1806	1215	fbmy8032_rel_221222.cza1_bee
qp500.L4
qp500.L4: point queries with 500 insert/s per client
Performance metrics for all DBMS, not just the ones listed above. Some are normalized by throughput, others are not. Legend for results is here.
ips	qps	rps	rmbps	wps	wmbps	rpq	rkbpq	wpi	wkbpi	csps	cpups	cspq	cpupq	dbgb1	dbgb2	rss	maxop	p50	p99	tag
499	2666	3	0.0	8.4	2.3	0.001	0.006	0.017	4.768	11022	14.7	4.135	441	2.1	2.6	8.6	0.009	2603	2399	fbmy5635_rel_221222.cza1_bee
499	2418	12	0.1	8.6	2.3	0.005	0.028	0.017	4.773	10194	15.1	4.216	500	2.1	2.8	9.0	0.010	2397	2009	fbmy8028_rel_221222.cza1_bee
499	2374	0	0.0	8.5	2.2	0.000	0.000	0.017	4.566	10163	15.0	4.282	506	2.1	2.8	8.9	0.003	2349	1932	fbmy8032_rel_221222.cza1_bee
qr1000.L5
qr1000.L5: range queries with 1000 insert/s per client
Performance metrics for all DBMS, not just the ones listed above. Some are normalized by throughput, others are not. Legend for results is here.
ips	qps	rps	rmbps	wps	wmbps	rpq	rkbpq	wpi	wkbpi	csps	cpups	cspq	cpupq	dbgb1	dbgb2	rss	maxop	p50	p99	tag
998	1479	7	0.0	14.2	4.7	0.005	0.027	0.014	4.800	6177	15.2	4.176	822	2.1	3.0	8.6	0.030	1486	1087	fbmy5635_rel_221222.cza1_bee
998	1505	52	0.3	14.2	4.5	0.034	0.199	0.014	4.659	6566	15.5	4.364	824	2.2	3.2	9.1	0.031	1359	1086	fbmy8028_rel_221222.cza1_bee
998	1333	16	0.1	14.4	4.7	0.012	0.075	0.014	4.821	5973	15.5	4.481	930	2.2	3.2	9.0	0.032	1295	1055	fbmy8032_rel_221222.cza1_bee
qp1000.L6
qp1000.L6: point queries with 1000 insert/s per client
Performance metrics for all DBMS, not just the ones listed above. Some are normalized by throughput, others are not. Legend for results is here.
ips	qps	rps	rmbps	wps	wmbps	rpq	rkbpq	wpi	wkbpi	csps	cpups	cspq	cpupq	dbgb1	dbgb2	rss	maxop	p50	p99	tag
998	2638	38	0.2	14.0	4.6	0.015	0.086	0.014	4.707	11197	16.3	4.245	494	2.1	3.4	8.7	0.013	2573	2380	fbmy5635_rel_221222.cza1_bee
998	2414	67	0.4	14.3	4.7	0.028	0.161	0.014	4.783	10480	16.5	4.342	547	2.1	3.6	9.4	0.007	2397	1966	fbmy8028_rel_221222.cza1_bee
998	2354	47	0.3	14.5	4.7	0.020	0.119	0.015	4.781	10402	16.7	4.418	567	2.2	3.6	9.2	0.005	2333	1934	fbmy8032_rel_221222.cza1_bee
l.i0
- l.i0: load without secondary indexes
- Legend for results is here.
- Each entry lists the percentage of responses that fit in that bucket (slower than max time for previous bucket, faster than min time for next bucket).
Insert response time histogram
256us	1ms	4ms	16ms	64ms	256ms	1s	4s	16s	gt	max	tag
0.000	0.000	99.871	0.125	0.004	0.000	0.000	0.000	0.000	0.000	0.057	fbmy5635_rel_221222.cza1_bee
0.000	0.000	99.723	0.203	0.071	0.003	0.000	0.000	0.000	0.000	0.082	fbmy8028_rel_221222.cza1_bee
0.000	0.000	99.712	0.208	0.078	0.002	0.000	0.000	0.000	0.000	0.070	fbmy8032_rel_221222.cza1_bee
l.x
- l.x: create secondary indexes
- Legend for results is here.
- Each entry lists the percentage of responses that fit in that bucket (slower than max time for previous bucket, faster than min time for next bucket).
TODO - determine whether there is data for create index response time
l.i1
- l.i1: continue load after secondary indexes created with 50 inserts per transaction
- Legend for results is here.
- Each entry lists the percentage of responses that fit in that bucket (slower than max time for previous bucket, faster than min time for next bucket).
Insert response time histogram
256us	1ms	4ms	16ms	64ms	256ms	1s	4s	16s	gt	max	tag
0.000	0.000	99.810	0.184	0.005	0.001	0.000	0.000	0.000	0.000	0.073	fbmy5635_rel_221222.cza1_bee
0.000	0.000	99.669	0.267	0.060	0.003	0.000	0.000	0.000	0.000	0.087	fbmy8028_rel_221222.cza1_bee
0.000	0.000	99.660	0.272	0.067	0.002	0.000	0.000	0.000	0.000	0.079	fbmy8032_rel_221222.cza1_bee
Delete response time histogram
256us	1ms	4ms	16ms	64ms	256ms	1s	4s	16s	gt	max	tag
0.000	0.000	99.801	0.189	0.008	0.001	0.000	0.000	0.000	0.000	0.073	fbmy5635_rel_221222.cza1_bee
0.000	0.000	99.659	0.271	0.067	0.003	0.000	0.000	0.000	0.000	0.093	fbmy8028_rel_221222.cza1_bee
0.000	0.000	99.650	0.273	0.075	0.002	0.000	0.000	0.000	0.000	0.089	fbmy8032_rel_221222.cza1_bee
l.i2
- l.i2: continue load after secondary indexes created with 5 inserts per transaction
- Legend for results is here.
- Each entry lists the percentage of responses that fit in that bucket (slower than max time for previous bucket, faster than min time for next bucket).
Insert response time histogram
256us	1ms	4ms	16ms	64ms	256ms	1s	4s	16s	gt	max	tag
0.020	99.913	0.015	0.051	0.001	0.000	0.000	0.000	0.000	0.000	0.059	fbmy5635_rel_221222.cza1_bee
0.000	99.826	0.089	0.082	0.002	0.001	0.000	0.000	0.000	0.000	0.096	fbmy8028_rel_221222.cza1_bee
0.000	99.808	0.106	0.083	0.003	nonzero	0.000	0.000	0.000	0.000	0.068	fbmy8032_rel_221222.cza1_bee
Delete response time histogram
256us	1ms	4ms	16ms	64ms	256ms	1s	4s	16s	gt	max	tag
0.000	99.933	0.014	0.052	0.002	0.000	0.000	0.000	0.000	0.000	0.059	fbmy5635_rel_221222.cza1_bee
0.000	99.780	0.133	0.084	0.003	nonzero	0.000	0.000	0.000	0.000	0.083	fbmy8028_rel_221222.cza1_bee
0.000	99.751	0.162	0.084	0.003	nonzero	0.000	0.000	0.000	0.000	0.068	fbmy8032_rel_221222.cza1_bee
qr100.L1
- qr100.L1: range queries with 100 insert/s per client
- Legend for results is here.
- Each entry lists the percentage of responses that fit in that bucket (slower than max time for previous bucket, faster than min time for next bucket).
Query response time histogram
256us	1ms	4ms	16ms	64ms	256ms	1s	4s	16s	gt	max	tag
14.460	66.014	19.515	0.011	nonzero	0.000	0.000	0.000	0.000	0.000	0.026	fbmy5635_rel_221222.cza1_bee
5.684	61.043	33.273	nonzero	nonzero	0.000	0.000	0.000	0.000	0.000	0.028	fbmy8028_rel_221222.cza1_bee
8.397	72.433	19.170	nonzero	nonzero	0.000	0.000	0.000	0.000	0.000	0.024	fbmy8032_rel_221222.cza1_bee
Insert response time histogram
256us	1ms	4ms	16ms	64ms	256ms	1s	4s	16s	gt	max	tag
0.000	0.000	99.361	0.639	0.000	0.000	0.000	0.000	0.000	0.000	0.009	fbmy5635_rel_221222.cza1_bee
0.000	0.000	99.083	0.889	0.028	0.000	0.000	0.000	0.000	0.000	0.017	fbmy8028_rel_221222.cza1_bee
0.000	0.000	99.417	0.556	0.028	0.000	0.000	0.000	0.000	0.000	0.018	fbmy8032_rel_221222.cza1_bee
Delete response time histogram
256us	1ms	4ms	16ms	64ms	256ms	1s	4s	16s	gt	max	tag
0.000	0.000	99.389	0.611	0.000	0.000	0.000	0.000	0.000	0.000	0.008	fbmy5635_rel_221222.cza1_bee
0.000	0.000	99.306	0.667	0.028	0.000	0.000	0.000	0.000	0.000	0.017	fbmy8028_rel_221222.cza1_bee
0.000	0.000	99.556	0.417	0.028	0.000	0.000	0.000	0.000	0.000	0.018	fbmy8032_rel_221222.cza1_bee
qp100.L2
- qp100.L2: point queries with 100 insert/s per client
- Legend for results is here.
- Each entry lists the percentage of responses that fit in that bucket (slower than max time for previous bucket, faster than min time for next bucket).
Query response time histogram
256us	1ms	4ms	16ms	64ms	256ms	1s	4s	16s	gt	max	tag
8.474	91.523	0.003	0.000	0.000	0.000	0.000	0.000	0.000	0.000	0.004	fbmy5635_rel_221222.cza1_bee
nonzero	99.984	0.014	0.001	0.000	0.000	0.000	0.000	0.000	0.000	0.010	fbmy8028_rel_221222.cza1_bee
nonzero	99.991	0.008	0.002	0.000	0.000	0.000	0.000	0.000	0.000	0.010	fbmy8032_rel_221222.cza1_bee
Insert response time histogram
256us	1ms	4ms	16ms	64ms	256ms	1s	4s	16s	gt	max	tag
0.000	0.000	99.472	0.528	0.000	0.000	0.000	0.000	0.000	0.000	0.010	fbmy5635_rel_221222.cza1_bee
0.000	0.000	99.694	0.278	0.028	0.000	0.000	0.000	0.000	0.000	0.018	fbmy8028_rel_221222.cza1_bee
0.000	0.000	99.250	0.722	0.028	0.000	0.000	0.000	0.000	0.000	0.017	fbmy8032_rel_221222.cza1_bee
Delete response time histogram
256us	1ms	4ms	16ms	64ms	256ms	1s	4s	16s	gt	max	tag
0.000	0.000	99.556	0.444	0.000	0.000	0.000	0.000	0.000	0.000	0.009	fbmy5635_rel_221222.cza1_bee
0.000	0.000	99.806	0.167	0.028	0.000	0.000	0.000	0.000	0.000	0.017	fbmy8028_rel_221222.cza1_bee
0.000	0.000	99.444	0.528	0.028	0.000	0.000	0.000	0.000	0.000	0.017	fbmy8032_rel_221222.cza1_bee
qr500.L3
- qr500.L3: range queries with 500 insert/s per client
- Legend for results is here.
- Each entry lists the percentage of responses that fit in that bucket (slower than max time for previous bucket, faster than min time for next bucket).
Query response time histogram
256us	1ms	4ms	16ms	64ms	256ms	1s	4s	16s	gt	max	tag
12.987	61.255	25.747	0.010	nonzero	0.000	0.000	0.000	0.000	0.000	0.031	fbmy5635_rel_221222.cza1_bee
6.299	82.901	10.800	nonzero	nonzero	0.000	0.000	0.000	0.000	0.000	0.031	fbmy8028_rel_221222.cza1_bee
8.304	79.883	11.812	nonzero	nonzero	0.000	0.000	0.000	0.000	0.000	0.033	fbmy8032_rel_221222.cza1_bee
Insert response time histogram
256us	1ms	4ms	16ms	64ms	256ms	1s	4s	16s	gt	max	tag
0.000	0.000	99.717	0.283	0.000	0.000	0.000	0.000	0.000	0.000	0.009	fbmy5635_rel_221222.cza1_bee
0.000	0.000	99.689	0.228	0.083	0.000	0.000	0.000	0.000	0.000	0.018	fbmy8028_rel_221222.cza1_bee
0.000	0.000	99.617	0.300	0.083	0.000	0.000	0.000	0.000	0.000	0.021	fbmy8032_rel_221222.cza1_bee
Delete response time histogram
256us	1ms	4ms	16ms	64ms	256ms	1s	4s	16s	gt	max	tag
0.000	0.000	99.761	0.239	0.000	0.000	0.000	0.000	0.000	0.000	0.009	fbmy5635_rel_221222.cza1_bee
0.000	0.000	99.711	0.211	0.078	0.000	0.000	0.000	0.000	0.000	0.018	fbmy8028_rel_221222.cza1_bee
0.000	0.000	99.689	0.233	0.078	0.000	0.000	0.000	0.000	0.000	0.022	fbmy8032_rel_221222.cza1_bee
qp500.L4
- qp500.L4: point queries with 500 insert/s per client
- Legend for results is here.
- Each entry lists the percentage of responses that fit in that bucket (slower than max time for previous bucket, faster than min time for next bucket).
Query response time histogram
256us	1ms	4ms	16ms	64ms	256ms	1s	4s	16s	gt	max	tag
6.788	93.208	0.004	nonzero	0.000	0.000	0.000	0.000	0.000	0.000	0.009	fbmy5635_rel_221222.cza1_bee
0.002	99.993	0.005	nonzero	0.000	0.000	0.000	0.000	0.000	0.000	0.010	fbmy8028_rel_221222.cza1_bee
0.000	99.993	0.007	0.000	0.000	0.000	0.000	0.000	0.000	0.000	0.003	fbmy8032_rel_221222.cza1_bee
Insert response time histogram
256us	1ms	4ms	16ms	64ms	256ms	1s	4s	16s	gt	max	tag
0.000	0.000	99.533	0.467	0.000	0.000	0.000	0.000	0.000	0.000	0.012	fbmy5635_rel_221222.cza1_bee
0.000	0.000	99.661	0.250	0.089	0.000	0.000	0.000	0.000	0.000	0.019	fbmy8028_rel_221222.cza1_bee
0.000	0.000	99.500	0.411	0.089	0.000	0.000	0.000	0.000	0.000	0.018	fbmy8032_rel_221222.cza1_bee
Delete response time histogram
256us	1ms	4ms	16ms	64ms	256ms	1s	4s	16s	gt	max	tag
0.000	0.000	99.544	0.456	0.000	0.000	0.000	0.000	0.000	0.000	0.012	fbmy5635_rel_221222.cza1_bee
0.000	0.000	99.717	0.200	0.083	0.000	0.000	0.000	0.000	0.000	0.019	fbmy8028_rel_221222.cza1_bee
0.000	0.000	99.528	0.389	0.083	0.000	0.000	0.000	0.000	0.000	0.018	fbmy8032_rel_221222.cza1_bee
qr1000.L5
- qr1000.L5: range queries with 1000 insert/s per client
- Legend for results is here.
- Each entry lists the percentage of responses that fit in that bucket (slower than max time for previous bucket, faster than min time for next bucket).
Query response time histogram
256us	1ms	4ms	16ms	64ms	256ms	1s	4s	16s	gt	max	tag
13.394	60.797	25.808	0.001	nonzero	0.000	0.000	0.000	0.000	0.000	0.030	fbmy5635_rel_221222.cza1_bee
6.434	75.407	18.158	0.001	nonzero	0.000	0.000	0.000	0.000	0.000	0.031	fbmy8028_rel_221222.cza1_bee
7.520	70.915	21.558	0.007	nonzero	0.000	0.000	0.000	0.000	0.000	0.032	fbmy8032_rel_221222.cza1_bee
Insert response time histogram
256us	1ms	4ms	16ms	64ms	256ms	1s	4s	16s	gt	max	tag
0.000	0.000	99.803	0.192	0.006	0.000	0.000	0.000	0.000	0.000	0.040	fbmy5635_rel_221222.cza1_bee
0.000	0.000	99.436	0.497	0.067	0.000	0.000	0.000	0.000	0.000	0.050	fbmy8028_rel_221222.cza1_bee
0.000	0.000	99.544	0.378	0.078	0.000	0.000	0.000	0.000	0.000	0.050	fbmy8032_rel_221222.cza1_bee
Delete response time histogram
256us	1ms	4ms	16ms	64ms	256ms	1s	4s	16s	gt	max	tag
0.000	0.000	99.806	0.189	0.006	0.000	0.000	0.000	0.000	0.000	0.040	fbmy5635_rel_221222.cza1_bee
0.000	0.000	99.436	0.492	0.069	0.003	0.000	0.000	0.000	0.000	0.065	fbmy8028_rel_221222.cza1_bee
0.000	0.000	99.564	0.361	0.075	0.000	0.000	0.000	0.000	0.000	0.042	fbmy8032_rel_221222.cza1_bee
qp1000.L6
- qp1000.L6: point queries with 1000 insert/s per client
- Legend for results is here.
- Each entry lists the percentage of responses that fit in that bucket (slower than max time for previous bucket, faster than min time for next bucket).
Query response time histogram
256us	1ms	4ms	16ms	64ms	256ms	1s	4s	16s	gt	max	tag
5.802	94.192	0.006	nonzero	0.000	0.000	0.000	0.000	0.000	0.000	0.013	fbmy5635_rel_221222.cza1_bee
nonzero	99.988	0.011	0.001	0.000	0.000	0.000	0.000	0.000	0.000	0.007	fbmy8028_rel_221222.cza1_bee
nonzero	99.990	0.010	nonzero	0.000	0.000	0.000	0.000	0.000	0.000	0.005	fbmy8032_rel_221222.cza1_bee
Insert response time histogram
256us	1ms	4ms	16ms	64ms	256ms	1s	4s	16s	gt	max	tag
0.000	0.000	99.647	0.350	0.003	0.000	0.000	0.000	0.000	0.000	0.048	fbmy5635_rel_221222.cza1_bee
0.000	0.000	99.558	0.356	0.083	0.003	0.000	0.000	0.000	0.000	0.067	fbmy8028_rel_221222.cza1_bee
0.000	0.000	99.531	0.392	0.078	0.000	0.000	0.000	0.000	0.000	0.056	fbmy8032_rel_221222.cza1_bee
Delete response time histogram
256us	1ms	4ms	16ms	64ms	256ms	1s	4s	16s	gt	max	tag
0.000	0.000	99.619	0.372	0.008	0.000	0.000	0.000	0.000	0.000	0.049	fbmy5635_rel_221222.cza1_bee
0.000	0.000	99.592	0.325	0.083	0.000	0.000	0.000	0.000	0.000	0.052	fbmy8028_rel_221222.cza1_bee
0.000	0.000	99.581	0.344	0.075	0.000	0.000	0.000	0.000	0.000	0.042	fbmy8032_rel_221222.cza1_bee