Introduction
This is a report for the insert benchmark with 30M docs and 1 client(s). It is generated by scripts (bash, awk, sed) and Tufte might not be impressed. An overview of the insert benchmark is here and a short update is here. Below, by DBMS, I mean DBMS+version.config. An example is my8020.c10b40 where my means MySQL, 8020 is version 8.0.20 and c10b40 is the name for the configuration file.
The test server has a Beelink SER4 with 8 AMD cores, 16G RAM and an NVMe SSD. It is described here. The benchmark was run with 1 client and there were 1 or 3 connections per client (1 for queries or inserts without rate limits, 1+1 for rate limited inserts+deletes). It uses 1 table. It loads 30M rows per table without secondary indexes, creates 3 secondary indexes per table, then inserts 50m+50m rows per table with a delete per insert to avoid growing the table. It then does 6 read+write tests for 1800s each that do queries as fast as possible with 100,100,500,500,1000,1000 inserts/s and the same for deletes/s per client concurrent with the queries. The database is cached in memory. Clients and the DBMS share one server. The per-database configs are in the per-database subdirectories here. All builds were compiled with gcc 11.4.0 unless noted.
The tested DBMS are:
- fbmy8028_rel_221222.cza1_bee - MyRocks 8.0.28 from code as of 2023-12-22 at git hash 2ad105fc, RocksDB 8.7.0 at git hash 29005f0b, cza1_bee config
- fbmy8028_rel_221222.cza1ps0_bee - MyRocks 8.0.28 from code as of 2023-12-22 at git hash 2ad105fc, RocksDB 8.7.0 at git hash 29005f0b, cza1ps0_bee config that disables the perf schema
- fbmy8028_rel_clang14_221222.cza1_bee - MyRocks 8.0.28 from code as of 2023-12-22 at git hash 2ad105fc, RocksDB 8.7.0 at git hash 29005f0b, cza1_bee config, compiled with clang 14.0.0
- fbmy8028_rel_clang15_221222.cza1_bee - MyRocks 8.0.28 from code as of 2023-12-22 at git hash 2ad105fc, RocksDB 8.7.0 at git hash 29005f0b, cza1_bee config, compiled with clang 15.0.7
- fbmy8032_rel_221222.cza1_bee - MyRocks 8.0.32 from code as of 2023-12-22 at git hash 76707b44, RocksDB 8.7.0 at git hash 29005f0b, cza1_bee config
- fbmy8032_rel_221222.cza1ps0_bee - MyRocks 8.0.32 from code as of 2023-12-22 at git hash 76707b44, RocksDB 8.7.0 at git hash 29005f0b, cza1ps0_bee config that disables the perf schema
- fbmy8032_rel_clang14_221222.cza1_bee - MyRocks 8.0.32 from code as of 2023-12-22 at git hash 76707b44, RocksDB 8.7.0 at git hash 29005f0b, cza1_bee config, compiled with clang 14.0.0
- fbmy8032_rel_clang15_221222.cza1_bee - MyRocks 8.0.32 from code as of 2023-12-22 at git hash 76707b44, RocksDB 8.7.0 at git hash 29005f0b, cza1_bee config, compiled with clang 15.0.7
Contents
- Summary
- l.i0: load without secondary indexes
- l.x: create secondary indexes
- l.i1: continue load after secondary indexes created with 50 inserts per transaction
- l.i2: continue load after secondary indexes created with 5 inserts per transaction
- qr100.L1: range queries with 100 insert/s per client
- qp100.L2: point queries with 100 insert/s per client
- qr500.L3: range queries with 500 insert/s per client
- qp500.L4: point queries with 500 insert/s per client
- qr1000.L5: range queries with 1000 insert/s per client
- qp1000.L6: point queries with 1000 insert/s per client
Summary
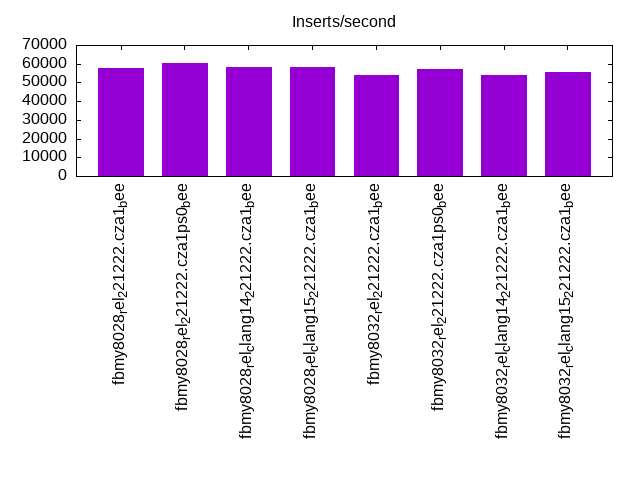
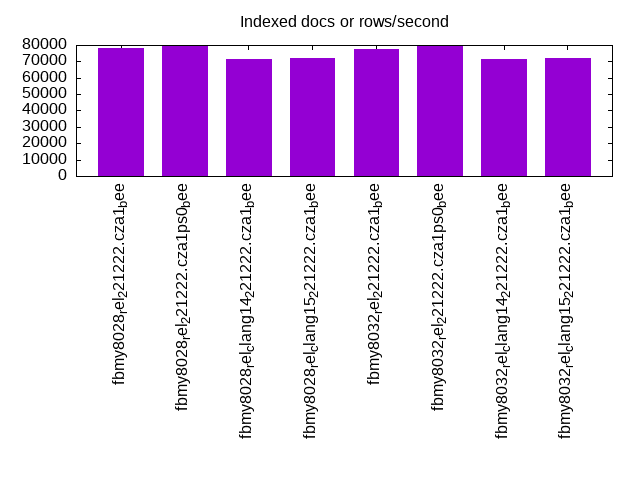
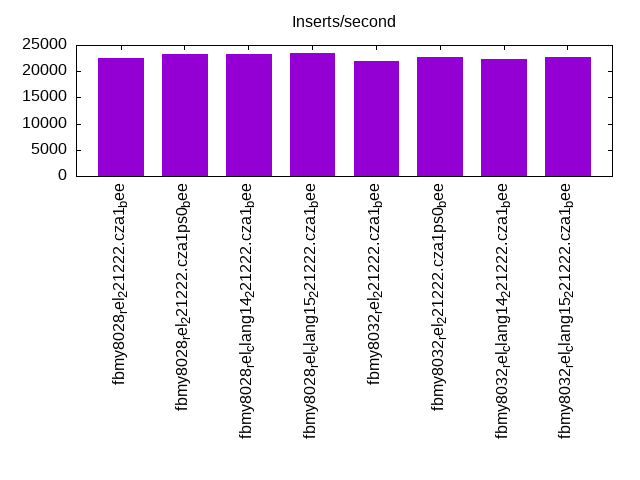
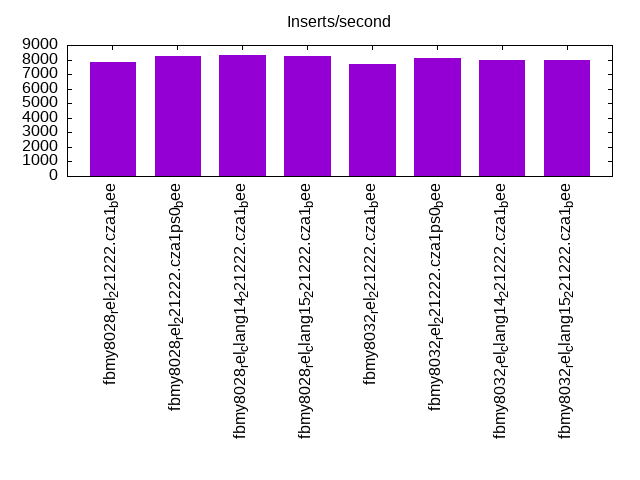
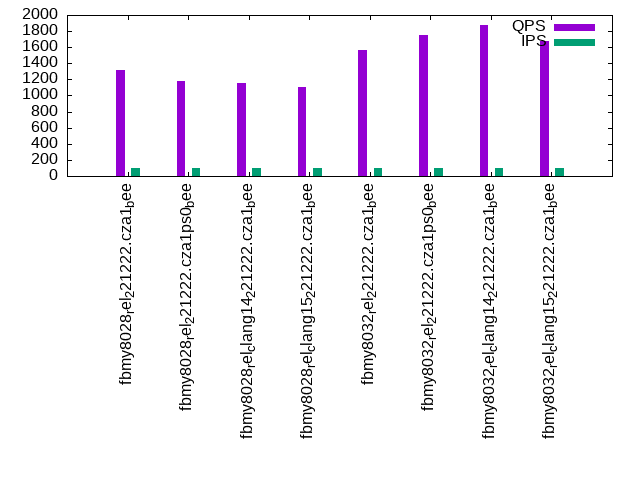
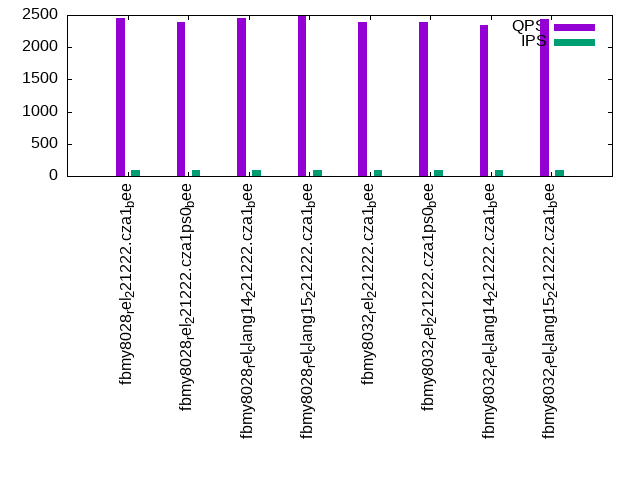
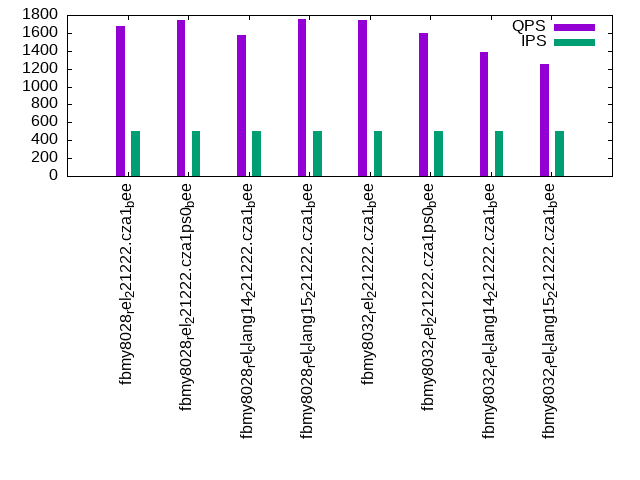
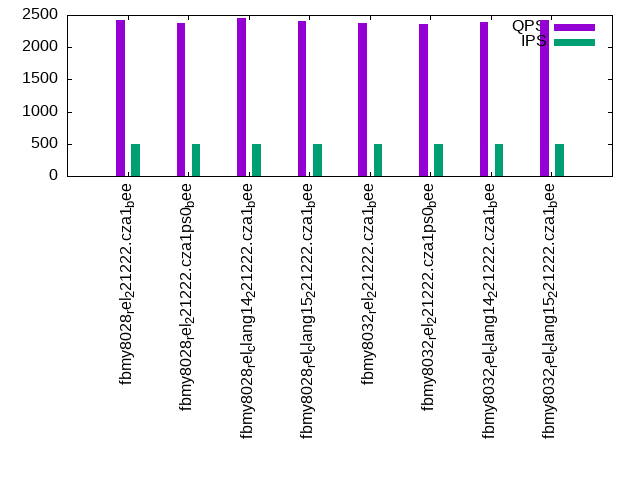
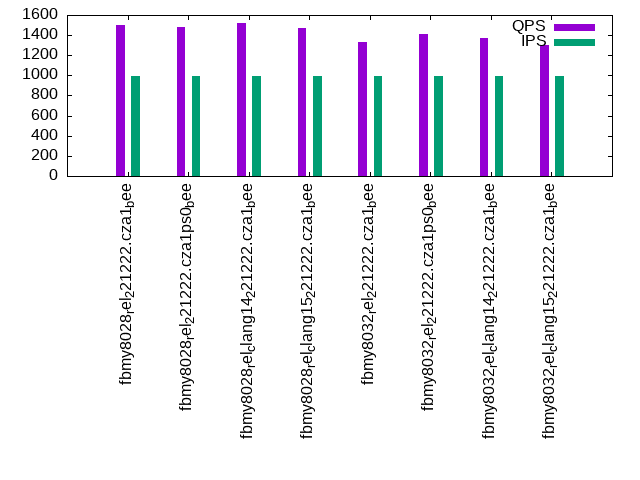
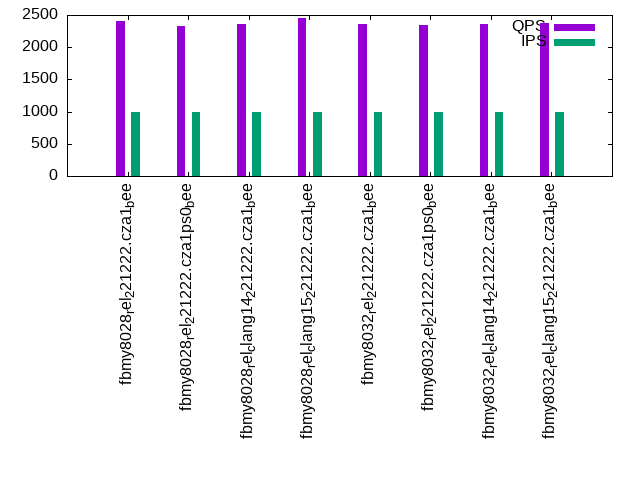
The numbers are inserts/s for l.i0, l.i1 and l.i2, indexed docs (or rows) /s for l.x and queries/s for qr100, qp100 thru qr1000, qp1000" The values are the average rate over the entire test for inserts (IPS) and queries (QPS). The range of values for IPS and QPS is split into 3 parts: bottom 25%, middle 50%, top 25%. Values in the bottom 25% have a red background, values in the top 25% have a green background and values in the middle have no color. A gray background is used for values that can be ignored because the DBMS did not sustain the target insert rate. Red backgrounds are not used when the minimum value is within 80% of the max value.
| dbms | l.i0 | l.x | l.i1 | l.i2 | qr100 | qp100 | qr500 | qp500 | qr1000 | qp1000 |
|---|---|---|---|---|---|---|---|---|---|---|
| fbmy8028_rel_221222.cza1_bee | 57803 | 77922 | 22612 | 7837 | 1314 | 2450 | 1681 | 2418 | 1505 | 2414 |
| fbmy8028_rel_221222.cza1ps0_bee | 60120 | 79576 | 23310 | 8244 | 1185 | 2395 | 1743 | 2373 | 1477 | 2333 |
| fbmy8028_rel_clang14_221222.cza1_bee | 58480 | 71429 | 23337 | 8285 | 1151 | 2454 | 1575 | 2453 | 1519 | 2356 |
| fbmy8028_rel_clang15_221222.cza1_bee | 58366 | 71943 | 23392 | 8264 | 1106 | 2495 | 1760 | 2410 | 1469 | 2460 |
| fbmy8032_rel_221222.cza1_bee | 53957 | 77320 | 21954 | 7669 | 1562 | 2394 | 1746 | 2374 | 1333 | 2354 |
| fbmy8032_rel_221222.cza1ps0_bee | 56926 | 79156 | 22779 | 8091 | 1748 | 2384 | 1601 | 2368 | 1410 | 2338 |
| fbmy8032_rel_clang14_221222.cza1_bee | 54054 | 71259 | 22321 | 7974 | 1870 | 2338 | 1382 | 2396 | 1369 | 2361 |
| fbmy8032_rel_clang15_221222.cza1_bee | 55350 | 71943 | 22740 | 7962 | 1671 | 2438 | 1250 | 2422 | 1299 | 2372 |
This table has relative throughput, throughput for the DBMS relative to the DBMS in the first line, using the absolute throughput from the previous table. Values less than 0.95 have a yellow background. Values greater than 1.05 have a blue background.
| dbms | l.i0 | l.x | l.i1 | l.i2 | qr100 | qp100 | qr500 | qp500 | qr1000 | qp1000 |
|---|---|---|---|---|---|---|---|---|---|---|
| fbmy8028_rel_221222.cza1_bee | 1.00 | 1.00 | 1.00 | 1.00 | 1.00 | 1.00 | 1.00 | 1.00 | 1.00 | 1.00 |
| fbmy8028_rel_221222.cza1ps0_bee | 1.04 | 1.02 | 1.03 | 1.05 | 0.90 | 0.98 | 1.04 | 0.98 | 0.98 | 0.97 |
| fbmy8028_rel_clang14_221222.cza1_bee | 1.01 | 0.92 | 1.03 | 1.06 | 0.88 | 1.00 | 0.94 | 1.01 | 1.01 | 0.98 |
| fbmy8028_rel_clang15_221222.cza1_bee | 1.01 | 0.92 | 1.03 | 1.05 | 0.84 | 1.02 | 1.05 | 1.00 | 0.98 | 1.02 |
| fbmy8032_rel_221222.cza1_bee | 0.93 | 0.99 | 0.97 | 0.98 | 1.19 | 0.98 | 1.04 | 0.98 | 0.89 | 0.98 |
| fbmy8032_rel_221222.cza1ps0_bee | 0.98 | 1.02 | 1.01 | 1.03 | 1.33 | 0.97 | 0.95 | 0.98 | 0.94 | 0.97 |
| fbmy8032_rel_clang14_221222.cza1_bee | 0.94 | 0.91 | 0.99 | 1.02 | 1.42 | 0.95 | 0.82 | 0.99 | 0.91 | 0.98 |
| fbmy8032_rel_clang15_221222.cza1_bee | 0.96 | 0.92 | 1.01 | 1.02 | 1.27 | 1.00 | 0.74 | 1.00 | 0.86 | 0.98 |
This lists the average rate of inserts/s for the tests that do inserts concurrent with queries. For such tests the query rate is listed in the table above. The read+write tests are setup so that the insert rate should match the target rate every second. Cells that are not at least 95% of the target have a red background to indicate a failure to satisfy the target.
| dbms | qr100.L1 | qp100.L2 | qr500.L3 | qp500.L4 | qr1000.L5 | qp1000.L6 |
|---|---|---|---|---|---|---|
| fbmy8028_rel_221222.cza1_bee | 100 | 100 | 499 | 499 | 998 | 998 |
| fbmy8028_rel_221222.cza1ps0_bee | 100 | 100 | 499 | 499 | 998 | 998 |
| fbmy8028_rel_clang14_221222.cza1_bee | 100 | 100 | 499 | 499 | 998 | 997 |
| fbmy8028_rel_clang15_221222.cza1_bee | 100 | 100 | 499 | 499 | 998 | 998 |
| fbmy8032_rel_221222.cza1_bee | 100 | 100 | 499 | 499 | 998 | 998 |
| fbmy8032_rel_221222.cza1ps0_bee | 100 | 100 | 499 | 499 | 998 | 998 |
| fbmy8032_rel_clang14_221222.cza1_bee | 100 | 100 | 499 | 499 | 998 | 998 |
| fbmy8032_rel_clang15_221222.cza1_bee | 100 | 100 | 499 | 499 | 998 | 998 |
| target | 100 | 100 | 500 | 500 | 1000 | 1000 |
l.i0
l.i0: load without secondary indexes. Graphs for performance per 1-second interval are here.
Average throughput:
Insert response time histogram: each cell has the percentage of responses that take <= the time in the header and max is the max response time in seconds. For the max column values in the top 25% of the range have a red background and in the bottom 25% of the range have a green background. The red background is not used when the min value is within 80% of the max value.
| dbms | 256us | 1ms | 4ms | 16ms | 64ms | 256ms | 1s | 4s | 16s | gt | max |
|---|---|---|---|---|---|---|---|---|---|---|---|
| fbmy8028_rel_221222.cza1_bee | 99.723 | 0.203 | 0.071 | 0.003 | 0.082 | ||||||
| fbmy8028_rel_221222.cza1ps0_bee | 99.730 | 0.196 | 0.071 | 0.003 | 0.073 | ||||||
| fbmy8028_rel_clang14_221222.cza1_bee | 99.726 | 0.195 | 0.076 | 0.003 | 0.082 | ||||||
| fbmy8028_rel_clang15_221222.cza1_bee | 99.726 | 0.196 | 0.074 | 0.003 | 0.080 | ||||||
| fbmy8032_rel_221222.cza1_bee | 99.712 | 0.208 | 0.078 | 0.002 | 0.070 | ||||||
| fbmy8032_rel_221222.cza1ps0_bee | 99.719 | 0.203 | 0.076 | 0.001 | 0.072 | ||||||
| fbmy8032_rel_clang14_221222.cza1_bee | 99.712 | 0.206 | 0.080 | 0.002 | 0.073 | ||||||
| fbmy8032_rel_clang15_221222.cza1_bee | 99.717 | 0.201 | 0.080 | 0.003 | 0.074 |
Performance metrics for the DBMS listed above. Some are normalized by throughput, others are not. Legend for results is here.
ips	qps	rps	rmbps	wps	wmbps	rpq	rkbpq	wpi	wkbpi	csps	cpups	cspq	cpupq	dbgb1	dbgb2	rss	maxop	p50	p99	tag
57803	0	0	0.0	36.3	11.9	0.000	0.000	0.001	0.211	6068	22.6	0.105	31	0.9	2.7	0.6	0.082	58037	51263	fbmy8028_rel_221222.cza1_bee
60120	0	0	0.0	37.6	12.3	0.000	0.000	0.001	0.210	6275	22.7	0.104	30	0.9	2.7	0.4	0.073	60503	54555	fbmy8028_rel_221222.cza1ps0_bee
58480	0	0	0.0	36.8	12.0	0.000	0.000	0.001	0.211	6138	22.6	0.105	31	0.9	2.7	0.6	0.082	58658	52969	fbmy8028_rel_clang14_221222.cza1_bee
58366	0	0	0.0	36.5	12.0	0.000	0.000	0.001	0.211	6116	22.5	0.105	31	0.9	2.7	0.6	0.080	58634	52940	fbmy8028_rel_clang15_221222.cza1_bee
53957	0	0	0.0	34.8	11.1	0.000	0.000	0.001	0.210	5839	21.7	0.108	32	0.9	2.7	0.6	0.070	54139	49644	fbmy8032_rel_221222.cza1_bee
56926	0	0	0.0	36.7	11.7	0.000	0.000	0.001	0.211	6112	22.0	0.107	31	0.9	2.7	0.4	0.072	57138	51942	fbmy8032_rel_221222.cza1ps0_bee
54054	0	0	0.0	34.9	11.1	0.000	0.000	0.001	0.210	5835	21.6	0.108	32	0.9	2.7	0.6	0.073	54180	49461	fbmy8032_rel_clang14_221222.cza1_bee
55350	0	0	0.0	35.6	11.4	0.000	0.000	0.001	0.210	5974	21.8	0.108	32	0.9	2.7	0.6	0.074	55535	50039	fbmy8032_rel_clang15_221222.cza1_bee
l.x
l.x: create secondary indexes.
Average throughput:
Performance metrics for the DBMS listed above. Some are normalized by throughput, others are not. Legend for results is here.
ips	qps	rps	rmbps	wps	wmbps	rpq	rkbpq	wpi	wkbpi	csps	cpups	cspq	cpupq	dbgb1	dbgb2	rss	maxop	p50	p99	tag
77922	0	0	0.0	31.2	12.1	0.000	0.000	0.000	0.159	357	11.7	0.005	12	2.0	3.8	2.7	0.003	NA	NA	fbmy8028_rel_221222.cza1_bee
79576	0	0	0.0	32.0	12.3	0.000	0.000	0.000	0.158	384	11.7	0.005	12	2.0	3.8	2.5	0.003	NA	NA	fbmy8028_rel_221222.cza1ps0_bee
71429	0	0	0.0	28.7	11.0	0.000	0.000	0.000	0.158	342	11.7	0.005	13	2.0	3.8	2.7	0.003	NA	NA	fbmy8028_rel_clang14_221222.cza1_bee
71943	0	0	0.0	28.9	11.1	0.000	0.000	0.000	0.158	350	11.8	0.005	13	2.0	3.8	2.7	0.003	NA	NA	fbmy8028_rel_clang15_221222.cza1_bee
77320	0	0	0.0	30.9	11.9	0.000	0.000	0.000	0.158	582	11.8	0.008	12	2.0	3.8	2.7	0.003	NA	NA	fbmy8032_rel_221222.cza1_bee
79156	0	0	0.0	31.5	12.2	0.000	0.000	0.000	0.158	584	11.7	0.007	12	2.0	3.8	2.5	0.003	NA	NA	fbmy8032_rel_221222.cza1ps0_bee
71259	0	0	0.0	28.6	11.0	0.000	0.000	0.000	0.159	566	11.7	0.008	13	2.0	3.8	2.7	0.003	NA	NA	fbmy8032_rel_clang14_221222.cza1_bee
71943	0	0	0.0	28.9	11.1	0.000	0.000	0.000	0.158	580	11.8	0.008	13	2.0	3.8	2.7	0.003	NA	NA	fbmy8032_rel_clang15_221222.cza1_bee
l.i1
l.i1: continue load after secondary indexes created with 50 inserts per transaction. Graphs for performance per 1-second interval are here.
Average throughput:
Insert response time histogram: each cell has the percentage of responses that take <= the time in the header and max is the max response time in seconds. For the max column values in the top 25% of the range have a red background and in the bottom 25% of the range have a green background. The red background is not used when the min value is within 80% of the max value.
| dbms | 256us | 1ms | 4ms | 16ms | 64ms | 256ms | 1s | 4s | 16s | gt | max |
|---|---|---|---|---|---|---|---|---|---|---|---|
| fbmy8028_rel_221222.cza1_bee | 99.669 | 0.267 | 0.060 | 0.003 | 0.087 | ||||||
| fbmy8028_rel_221222.cza1ps0_bee | 99.675 | 0.256 | 0.065 | 0.003 | 0.093 | ||||||
| fbmy8028_rel_clang14_221222.cza1_bee | 99.675 | 0.263 | 0.059 | 0.003 | 0.090 | ||||||
| fbmy8028_rel_clang15_221222.cza1_bee | 99.674 | 0.263 | 0.060 | 0.003 | 0.091 | ||||||
| fbmy8032_rel_221222.cza1_bee | 99.660 | 0.272 | 0.067 | 0.002 | 0.079 | ||||||
| fbmy8032_rel_221222.cza1ps0_bee | 99.668 | 0.265 | 0.065 | 0.001 | 0.076 | ||||||
| fbmy8032_rel_clang14_221222.cza1_bee | 99.665 | 0.266 | 0.067 | 0.002 | 0.077 | ||||||
| fbmy8032_rel_clang15_221222.cza1_bee | 99.669 | 0.261 | 0.068 | 0.002 | 0.090 |
Delete response time histogram: each cell has the percentage of responses that take <= the time in the header and max is the max response time in seconds. For the max column values in the top 25% of the range have a red background and in the bottom 25% of the range have a green background. The red background is not used when the min value is within 80% of the max value.
| dbms | 256us | 1ms | 4ms | 16ms | 64ms | 256ms | 1s | 4s | 16s | gt | max |
|---|---|---|---|---|---|---|---|---|---|---|---|
| fbmy8028_rel_221222.cza1_bee | 99.659 | 0.271 | 0.067 | 0.003 | 0.093 | ||||||
| fbmy8028_rel_221222.cza1ps0_bee | 99.664 | 0.260 | 0.072 | 0.003 | 0.088 | ||||||
| fbmy8028_rel_clang14_221222.cza1_bee | 99.668 | 0.264 | 0.065 | 0.003 | 0.088 | ||||||
| fbmy8028_rel_clang15_221222.cza1_bee | 99.666 | 0.264 | 0.068 | 0.003 | 0.089 | ||||||
| fbmy8032_rel_221222.cza1_bee | 99.650 | 0.273 | 0.075 | 0.002 | 0.089 | ||||||
| fbmy8032_rel_221222.cza1ps0_bee | 99.661 | 0.266 | 0.072 | 0.002 | 0.081 | ||||||
| fbmy8032_rel_clang14_221222.cza1_bee | 99.656 | 0.268 | 0.074 | 0.002 | 0.090 | ||||||
| fbmy8032_rel_clang15_221222.cza1_bee | 99.662 | 0.262 | 0.074 | 0.002 | 0.078 |
Performance metrics for the DBMS listed above. Some are normalized by throughput, others are not. Legend for results is here.
ips	qps	rps	rmbps	wps	wmbps	rpq	rkbpq	wpi	wkbpi	csps	cpups	cspq	cpupq	dbgb1	dbgb2	rss	maxop	p50	p99	tag
22612	0	139	0.8	107.7	41.3	0.006	0.035	0.005	1.868	10151	46.1	0.449	163	2.6	3.5	5.3	0.087	22575	20126	fbmy8028_rel_221222.cza1_bee
23310	0	129	0.7	110.0	41.9	0.006	0.031	0.005	1.840	10427	46.1	0.447	158	2.4	3.2	5.1	0.093	23272	20835	fbmy8028_rel_221222.cza1ps0_bee
23337	0	142	0.8	110.2	41.8	0.006	0.034	0.005	1.835	10425	46.6	0.447	160	3.0	3.8	5.4	0.090	23274	20575	fbmy8028_rel_clang14_221222.cza1_bee
23392	0	138	0.8	111.2	42.6	0.006	0.033	0.005	1.863	10458	46.5	0.447	159	2.4	3.2	5.4	0.091	23333	20927	fbmy8028_rel_clang15_221222.cza1_bee
21954	0	122	0.7	103.9	39.5	0.006	0.032	0.005	1.841	10003	45.6	0.456	166	2.3	3.1	5.3	0.079	21925	19382	fbmy8032_rel_221222.cza1_bee
22779	0	137	0.8	107.7	40.8	0.006	0.034	0.005	1.834	10387	46.1	0.456	162	2.3	3.1	5.1	0.076	22723	20577	fbmy8032_rel_221222.cza1ps0_bee
22321	0	126	0.7	105.5	39.9	0.006	0.032	0.005	1.833	10141	45.8	0.454	164	2.5	3.4	5.3	0.077	22275	19994	fbmy8032_rel_clang14_221222.cza1_bee
22740	0	130	0.7	106.3	40.3	0.006	0.033	0.005	1.816	10361	46.1	0.456	162	2.7	3.5	5.3	0.090	22675	20427	fbmy8032_rel_clang15_221222.cza1_bee
l.i2
l.i2: continue load after secondary indexes created with 5 inserts per transaction. Graphs for performance per 1-second interval are here.
Average throughput:
Insert response time histogram: each cell has the percentage of responses that take <= the time in the header and max is the max response time in seconds. For the max column values in the top 25% of the range have a red background and in the bottom 25% of the range have a green background. The red background is not used when the min value is within 80% of the max value.
| dbms | 256us | 1ms | 4ms | 16ms | 64ms | 256ms | 1s | 4s | 16s | gt | max |
|---|---|---|---|---|---|---|---|---|---|---|---|
| fbmy8028_rel_221222.cza1_bee | 99.826 | 0.089 | 0.082 | 0.002 | 0.001 | 0.096 | |||||
| fbmy8028_rel_221222.cza1ps0_bee | 99.847 | 0.072 | 0.078 | 0.002 | nonzero | 0.074 | |||||
| fbmy8028_rel_clang14_221222.cza1_bee | 99.866 | 0.053 | 0.078 | 0.003 | nonzero | 0.079 | |||||
| fbmy8028_rel_clang15_221222.cza1_bee | 99.845 | 0.073 | 0.079 | 0.002 | nonzero | 0.094 | |||||
| fbmy8032_rel_221222.cza1_bee | 99.808 | 0.106 | 0.083 | 0.003 | nonzero | 0.068 | |||||
| fbmy8032_rel_221222.cza1ps0_bee | 99.820 | 0.098 | 0.079 | 0.003 | nonzero | 0.068 | |||||
| fbmy8032_rel_clang14_221222.cza1_bee | 99.835 | 0.082 | 0.080 | 0.003 | nonzero | 0.081 | |||||
| fbmy8032_rel_clang15_221222.cza1_bee | 99.820 | 0.096 | 0.081 | 0.002 | nonzero | 0.071 |
Delete response time histogram: each cell has the percentage of responses that take <= the time in the header and max is the max response time in seconds. For the max column values in the top 25% of the range have a red background and in the bottom 25% of the range have a green background. The red background is not used when the min value is within 80% of the max value.
| dbms | 256us | 1ms | 4ms | 16ms | 64ms | 256ms | 1s | 4s | 16s | gt | max |
|---|---|---|---|---|---|---|---|---|---|---|---|
| fbmy8028_rel_221222.cza1_bee | 99.780 | 0.133 | 0.084 | 0.003 | nonzero | 0.083 | |||||
| fbmy8028_rel_221222.cza1ps0_bee | 99.828 | 0.089 | 0.080 | 0.003 | nonzero | 0.081 | |||||
| fbmy8028_rel_clang14_221222.cza1_bee | 99.836 | 0.080 | 0.080 | 0.003 | nonzero | 0.080 | |||||
| fbmy8028_rel_clang15_221222.cza1_bee | 99.815 | 0.102 | 0.081 | 0.002 | nonzero | 0.090 | |||||
| fbmy8032_rel_221222.cza1_bee | 99.751 | 0.162 | 0.084 | 0.003 | nonzero | 0.068 | |||||
| fbmy8032_rel_221222.cza1ps0_bee | 99.784 | 0.131 | 0.082 | 0.003 | nonzero | 0.065 | |||||
| fbmy8032_rel_clang14_221222.cza1_bee | 99.777 | 0.137 | 0.082 | 0.003 | nonzero | 0.073 | |||||
| fbmy8032_rel_clang15_221222.cza1_bee | 99.762 | 0.152 | 0.083 | 0.003 | nonzero | 0.084 |
Performance metrics for the DBMS listed above. Some are normalized by throughput, others are not. Legend for results is here.
ips	qps	rps	rmbps	wps	wmbps	rpq	rkbpq	wpi	wkbpi	csps	cpups	cspq	cpupq	dbgb1	dbgb2	rss	maxop	p50	p99	tag
7837	0	26	0.1	96.1	34.8	0.003	0.019	0.012	4.553	32754	43.0	4.179	439	2.2	2.6	7.5	0.096	7826	6852	fbmy8028_rel_221222.cza1_bee
8244	0	0	0.0	97.4	35.4	0.000	0.000	0.012	4.396	34125	43.4	4.139	421	2.3	2.7	7.2	0.074	8191	7262	fbmy8028_rel_221222.cza1ps0_bee
8285	0	26	0.1	93.7	34.3	0.003	0.017	0.011	4.242	34213	43.5	4.129	420	2.3	2.6	7.3	0.079	8246	7272	fbmy8028_rel_clang14_221222.cza1_bee
8264	0	27	0.2	98.2	35.4	0.003	0.019	0.012	4.390	34339	43.8	4.155	424	2.2	2.5	7.5	0.094	8246	7332	fbmy8028_rel_clang15_221222.cza1_bee
7669	0	14	0.1	92.5	33.9	0.002	0.010	0.012	4.525	32196	42.9	4.198	448	2.2	2.5	7.4	0.068	7626	6742	fbmy8032_rel_221222.cza1_bee
8091	0	21	0.1	99.8	36.2	0.003	0.015	0.012	4.586	33826	43.7	4.181	432	2.2	2.5	7.3	0.068	8086	7111	fbmy8032_rel_221222.cza1ps0_bee
7974	0	26	0.1	94.9	34.6	0.003	0.019	0.012	4.448	33304	43.6	4.176	437	2.2	2.5	7.4	0.081	7968	6864	fbmy8032_rel_clang14_221222.cza1_bee
7962	0	16	0.1	96.8	35.0	0.002	0.011	0.012	4.501	33354	43.7	4.189	439	2.2	2.5	7.4	0.071	7956	7007	fbmy8032_rel_clang15_221222.cza1_bee
qr100.L1
qr100.L1: range queries with 100 insert/s per client. Graphs for performance per 1-second interval are here.
Average throughput:
Query response time histogram: each cell has the percentage of responses that take <= the time in the header and max is the max response time in seconds. For max values in the top 25% of the range have a red background and in the bottom 25% of the range have a green background. The red background is not used when the min value is within 80% of the max value.
| dbms | 256us | 1ms | 4ms | 16ms | 64ms | 256ms | 1s | 4s | 16s | gt | max |
|---|---|---|---|---|---|---|---|---|---|---|---|
| fbmy8028_rel_221222.cza1_bee | 5.684 | 61.043 | 33.273 | nonzero | nonzero | 0.028 | |||||
| fbmy8028_rel_221222.cza1ps0_bee | 6.346 | 60.352 | 33.301 | 0.001 | nonzero | 0.029 | |||||
| fbmy8028_rel_clang14_221222.cza1_bee | 3.223 | 64.211 | 32.566 | nonzero | nonzero | 0.031 | |||||
| fbmy8028_rel_clang15_221222.cza1_bee | 4.463 | 63.100 | 32.437 | nonzero | nonzero | 0.029 | |||||
| fbmy8032_rel_221222.cza1_bee | 8.397 | 72.433 | 19.170 | nonzero | nonzero | 0.024 | |||||
| fbmy8032_rel_221222.cza1ps0_bee | 9.377 | 76.696 | 13.927 | nonzero | nonzero | 0.032 | |||||
| fbmy8032_rel_clang14_221222.cza1_bee | 8.886 | 78.192 | 12.921 | nonzero | nonzero | 0.028 | |||||
| fbmy8032_rel_clang15_221222.cza1_bee | 9.654 | 77.545 | 12.800 | nonzero | nonzero | 0.028 |
Insert response time histogram: each cell has the percentage of responses that take <= the time in the header and max is the max response time in seconds. For max values in the top 25% of the range have a red background and in the bottom 25% of the range have a green background. The red background is not used when the min value is within 80% of the max value.
| dbms | 256us | 1ms | 4ms | 16ms | 64ms | 256ms | 1s | 4s | 16s | gt | max |
|---|---|---|---|---|---|---|---|---|---|---|---|
| fbmy8028_rel_221222.cza1_bee | 99.083 | 0.889 | 0.028 | 0.017 | |||||||
| fbmy8028_rel_221222.cza1ps0_bee | 99.611 | 0.333 | 0.056 | 0.017 | |||||||
| fbmy8028_rel_clang14_221222.cza1_bee | 99.500 | 0.444 | 0.056 | 0.018 | |||||||
| fbmy8028_rel_clang15_221222.cza1_bee | 99.611 | 0.306 | 0.083 | 0.018 | |||||||
| fbmy8032_rel_221222.cza1_bee | 99.417 | 0.556 | 0.028 | 0.018 | |||||||
| fbmy8032_rel_221222.cza1ps0_bee | 99.444 | 0.500 | 0.056 | 0.018 | |||||||
| fbmy8032_rel_clang14_221222.cza1_bee | 99.306 | 0.667 | 0.028 | 0.017 | |||||||
| fbmy8032_rel_clang15_221222.cza1_bee | 99.667 | 0.278 | 0.056 | 0.018 |
Delete response time histogram: each cell has the percentage of responses that take <= the time in the header and max is the max response time in seconds. For max values in the top 25% of the range have a red background and in the bottom 25% of the range have a green background. The red background is not used when the min value is within 80% of the max value.
| dbms | 256us | 1ms | 4ms | 16ms | 64ms | 256ms | 1s | 4s | 16s | gt | max |
|---|---|---|---|---|---|---|---|---|---|---|---|
| fbmy8028_rel_221222.cza1_bee | 99.306 | 0.667 | 0.028 | 0.017 | |||||||
| fbmy8028_rel_221222.cza1ps0_bee | 99.667 | 0.306 | 0.028 | 0.017 | |||||||
| fbmy8028_rel_clang14_221222.cza1_bee | 99.556 | 0.389 | 0.056 | 0.017 | |||||||
| fbmy8028_rel_clang15_221222.cza1_bee | 99.722 | 0.222 | 0.056 | 0.018 | |||||||
| fbmy8032_rel_221222.cza1_bee | 99.556 | 0.417 | 0.028 | 0.018 | |||||||
| fbmy8032_rel_221222.cza1ps0_bee | 99.528 | 0.444 | 0.028 | 0.018 | |||||||
| fbmy8032_rel_clang14_221222.cza1_bee | 99.444 | 0.528 | 0.028 | 0.017 | |||||||
| fbmy8032_rel_clang15_221222.cza1_bee | 99.694 | 0.250 | 0.056 | 0.018 |
Performance metrics for the DBMS listed above. Some are normalized by throughput, others are not. Legend for results is here.
ips	qps	rps	rmbps	wps	wmbps	rpq	rkbpq	wpi	wkbpi	csps	cpups	cspq	cpupq	dbgb1	dbgb2	rss	maxop	p50	p99	tag
100	1314	0	0.0	4.1	0.4	0.000	0.000	0.041	3.644	5306	12.6	4.038	767	2.1	2.3	7.8	0.028	1311	1215	fbmy8028_rel_221222.cza1_bee
100	1185	0	0.0	4.2	0.5	0.000	0.000	0.042	4.726	4823	12.7	4.070	857	2.1	2.3	7.5	0.029	1183	1087	fbmy8028_rel_221222.cza1ps0_bee
100	1151	0	0.0	4.5	0.5	0.000	0.000	0.045	5.139	4689	12.7	4.074	883	2.1	2.3	7.6	0.031	1151	1039	fbmy8028_rel_clang14_221222.cza1_bee
100	1106	0	0.0	4.3	0.4	0.000	0.000	0.043	4.360	4507	12.6	4.074	911	2.1	2.4	7.8	0.029	1095	1006	fbmy8028_rel_clang15_221222.cza1_bee
100	1562	0	0.0	4.1	0.3	0.000	0.000	0.041	3.439	6445	12.5	4.126	640	2.1	2.3	7.7	0.024	1566	1440	fbmy8032_rel_221222.cza1_bee
100	1748	0	0.0	4.5	0.5	0.000	0.000	0.045	4.698	7141	12.5	4.084	572	2.1	2.4	7.5	0.032	1742	1390	fbmy8032_rel_221222.cza1ps0_bee
100	1870	0	0.0	4.1	0.4	0.000	0.000	0.041	3.697	7612	12.7	4.069	543	2.1	2.4	7.6	0.028	1870	1614	fbmy8032_rel_clang14_221222.cza1_bee
100	1671	0	0.0	4.1	0.4	0.000	0.000	0.041	3.850	6851	12.5	4.100	598	2.1	2.4	7.6	0.028	1663	1519	fbmy8032_rel_clang15_221222.cza1_bee
qp100.L2
qp100.L2: point queries with 100 insert/s per client. Graphs for performance per 1-second interval are here.
Average throughput:
Query response time histogram: each cell has the percentage of responses that take <= the time in the header and max is the max response time in seconds. For max values in the top 25% of the range have a red background and in the bottom 25% of the range have a green background. The red background is not used when the min value is within 80% of the max value.
| dbms | 256us | 1ms | 4ms | 16ms | 64ms | 256ms | 1s | 4s | 16s | gt | max |
|---|---|---|---|---|---|---|---|---|---|---|---|
| fbmy8028_rel_221222.cza1_bee | nonzero | 99.984 | 0.014 | 0.001 | 0.010 | ||||||
| fbmy8028_rel_221222.cza1ps0_bee | 0.003 | 99.994 | 0.003 | nonzero | 0.005 | ||||||
| fbmy8028_rel_clang14_221222.cza1_bee | 99.992 | 0.007 | 0.001 | 0.010 | |||||||
| fbmy8028_rel_clang15_221222.cza1_bee | nonzero | 99.991 | 0.008 | 0.001 | 0.010 | ||||||
| fbmy8032_rel_221222.cza1_bee | nonzero | 99.991 | 0.008 | 0.002 | 0.010 | ||||||
| fbmy8032_rel_221222.cza1ps0_bee | nonzero | 99.992 | 0.006 | 0.002 | 0.010 | ||||||
| fbmy8032_rel_clang14_221222.cza1_bee | 99.988 | 0.011 | 0.001 | 0.010 | |||||||
| fbmy8032_rel_clang15_221222.cza1_bee | 99.992 | 0.006 | 0.002 | 0.010 |
Insert response time histogram: each cell has the percentage of responses that take <= the time in the header and max is the max response time in seconds. For max values in the top 25% of the range have a red background and in the bottom 25% of the range have a green background. The red background is not used when the min value is within 80% of the max value.
| dbms | 256us | 1ms | 4ms | 16ms | 64ms | 256ms | 1s | 4s | 16s | gt | max |
|---|---|---|---|---|---|---|---|---|---|---|---|
| fbmy8028_rel_221222.cza1_bee | 99.694 | 0.278 | 0.028 | 0.018 | |||||||
| fbmy8028_rel_221222.cza1ps0_bee | 99.417 | 0.500 | 0.083 | 0.017 | |||||||
| fbmy8028_rel_clang14_221222.cza1_bee | 99.417 | 0.528 | 0.056 | 0.017 | |||||||
| fbmy8028_rel_clang15_221222.cza1_bee | 99.417 | 0.528 | 0.056 | 0.017 | |||||||
| fbmy8032_rel_221222.cza1_bee | 99.250 | 0.722 | 0.028 | 0.017 | |||||||
| fbmy8032_rel_221222.cza1ps0_bee | 99.472 | 0.500 | 0.028 | 0.018 | |||||||
| fbmy8032_rel_clang14_221222.cza1_bee | 99.583 | 0.333 | 0.083 | 0.017 | |||||||
| fbmy8032_rel_clang15_221222.cza1_bee | 99.361 | 0.583 | 0.056 | 0.017 |
Delete response time histogram: each cell has the percentage of responses that take <= the time in the header and max is the max response time in seconds. For max values in the top 25% of the range have a red background and in the bottom 25% of the range have a green background. The red background is not used when the min value is within 80% of the max value.
| dbms | 256us | 1ms | 4ms | 16ms | 64ms | 256ms | 1s | 4s | 16s | gt | max |
|---|---|---|---|---|---|---|---|---|---|---|---|
| fbmy8028_rel_221222.cza1_bee | 99.806 | 0.167 | 0.028 | 0.017 | |||||||
| fbmy8028_rel_221222.cza1ps0_bee | 99.556 | 0.389 | 0.056 | 0.017 | |||||||
| fbmy8028_rel_clang14_221222.cza1_bee | 99.528 | 0.444 | 0.028 | 0.017 | |||||||
| fbmy8028_rel_clang15_221222.cza1_bee | 99.528 | 0.417 | 0.056 | 0.017 | |||||||
| fbmy8032_rel_221222.cza1_bee | 99.444 | 0.528 | 0.028 | 0.017 | |||||||
| fbmy8032_rel_221222.cza1ps0_bee | 99.611 | 0.389 | 0.009 | ||||||||
| fbmy8032_rel_clang14_221222.cza1_bee | 99.667 | 0.250 | 0.083 | 0.017 | |||||||
| fbmy8032_rel_clang15_221222.cza1_bee | 99.472 | 0.472 | 0.056 | 0.017 |
Performance metrics for the DBMS listed above. Some are normalized by throughput, others are not. Legend for results is here.
ips	qps	rps	rmbps	wps	wmbps	rpq	rkbpq	wpi	wkbpi	csps	cpups	cspq	cpupq	dbgb1	dbgb2	rss	maxop	p50	p99	tag
100	2450	34	0.2	4.2	0.4	0.014	0.087	0.042	4.437	10237	13.6	4.178	444	2.1	2.4	8.9	0.010	2429	1902	fbmy8028_rel_221222.cza1_bee
100	2395	0	0.0	4.0	0.4	0.000	0.000	0.040	3.699	9969	13.1	4.163	438	2.1	2.4	8.6	0.005	2286	2047	fbmy8028_rel_221222.cza1ps0_bee
100	2454	24	0.1	3.9	0.4	0.010	0.060	0.039	3.653	10214	13.3	4.163	434	2.1	2.4	8.8	0.010	2413	1982	fbmy8028_rel_clang14_221222.cza1_bee
100	2495	25	0.2	4.2	0.4	0.010	0.063	0.042	4.329	10388	13.6	4.164	436	2.1	2.4	8.8	0.010	2461	2014	fbmy8028_rel_clang15_221222.cza1_bee
100	2394	17	0.1	4.0	0.4	0.007	0.044	0.040	3.733	10149	13.3	4.240	445	2.1	2.4	8.8	0.010	2366	1902	fbmy8032_rel_221222.cza1_bee
100	2384	26	0.2	4.4	0.5	0.011	0.069	0.044	4.964	10122	13.6	4.245	456	2.1	2.4	8.6	0.010	2237	2048	fbmy8032_rel_221222.cza1ps0_bee
100	2338	28	0.2	4.2	0.5	0.012	0.074	0.042	4.765	9949	13.5	4.255	462	2.1	2.4	8.8	0.010	2317	1918	fbmy8032_rel_clang14_221222.cza1_bee
100	2438	19	0.1	4.2	0.4	0.008	0.049	0.042	4.364	10333	13.7	4.238	449	2.1	2.4	8.8	0.010	2509	1870	fbmy8032_rel_clang15_221222.cza1_bee
qr500.L3
qr500.L3: range queries with 500 insert/s per client. Graphs for performance per 1-second interval are here.
Average throughput:
Query response time histogram: each cell has the percentage of responses that take <= the time in the header and max is the max response time in seconds. For max values in the top 25% of the range have a red background and in the bottom 25% of the range have a green background. The red background is not used when the min value is within 80% of the max value.
| dbms | 256us | 1ms | 4ms | 16ms | 64ms | 256ms | 1s | 4s | 16s | gt | max |
|---|---|---|---|---|---|---|---|---|---|---|---|
| fbmy8028_rel_221222.cza1_bee | 6.299 | 82.901 | 10.800 | nonzero | nonzero | 0.031 | |||||
| fbmy8028_rel_221222.cza1ps0_bee | 10.338 | 82.191 | 7.432 | 0.040 | nonzero | 0.030 | |||||
| fbmy8028_rel_clang14_221222.cza1_bee | 4.929 | 83.337 | 11.734 | nonzero | nonzero | 0.029 | |||||
| fbmy8028_rel_clang15_221222.cza1_bee | 8.201 | 82.772 | 9.016 | 0.011 | nonzero | 0.031 | |||||
| fbmy8032_rel_221222.cza1_bee | 8.304 | 79.883 | 11.812 | nonzero | nonzero | 0.033 | |||||
| fbmy8032_rel_221222.cza1ps0_bee | 13.296 | 65.527 | 21.177 | nonzero | nonzero | 0.028 | |||||
| fbmy8032_rel_clang14_221222.cza1_bee | 6.561 | 69.141 | 24.298 | nonzero | nonzero | 0.035 | |||||
| fbmy8032_rel_clang15_221222.cza1_bee | 6.663 | 68.226 | 25.110 | 0.001 | nonzero | 0.030 |
Insert response time histogram: each cell has the percentage of responses that take <= the time in the header and max is the max response time in seconds. For max values in the top 25% of the range have a red background and in the bottom 25% of the range have a green background. The red background is not used when the min value is within 80% of the max value.
| dbms | 256us | 1ms | 4ms | 16ms | 64ms | 256ms | 1s | 4s | 16s | gt | max |
|---|---|---|---|---|---|---|---|---|---|---|---|
| fbmy8028_rel_221222.cza1_bee | 99.689 | 0.228 | 0.083 | 0.018 | |||||||
| fbmy8028_rel_221222.cza1ps0_bee | 99.622 | 0.289 | 0.089 | 0.025 | |||||||
| fbmy8028_rel_clang14_221222.cza1_bee | 99.506 | 0.417 | 0.078 | 0.018 | |||||||
| fbmy8028_rel_clang15_221222.cza1_bee | 99.733 | 0.183 | 0.083 | 0.018 | |||||||
| fbmy8032_rel_221222.cza1_bee | 99.617 | 0.300 | 0.083 | 0.021 | |||||||
| fbmy8032_rel_221222.cza1ps0_bee | 99.567 | 0.350 | 0.083 | 0.018 | |||||||
| fbmy8032_rel_clang14_221222.cza1_bee | 99.511 | 0.417 | 0.072 | 0.018 | |||||||
| fbmy8032_rel_clang15_221222.cza1_bee | 99.706 | 0.206 | 0.089 | 0.018 |
Delete response time histogram: each cell has the percentage of responses that take <= the time in the header and max is the max response time in seconds. For max values in the top 25% of the range have a red background and in the bottom 25% of the range have a green background. The red background is not used when the min value is within 80% of the max value.
| dbms | 256us | 1ms | 4ms | 16ms | 64ms | 256ms | 1s | 4s | 16s | gt | max |
|---|---|---|---|---|---|---|---|---|---|---|---|
| fbmy8028_rel_221222.cza1_bee | 99.711 | 0.211 | 0.078 | 0.018 | |||||||
| fbmy8028_rel_221222.cza1ps0_bee | 99.650 | 0.267 | 0.083 | 0.025 | |||||||
| fbmy8028_rel_clang14_221222.cza1_bee | 99.567 | 0.356 | 0.078 | 0.018 | |||||||
| fbmy8028_rel_clang15_221222.cza1_bee | 99.767 | 0.161 | 0.072 | 0.018 | |||||||
| fbmy8032_rel_221222.cza1_bee | 99.689 | 0.233 | 0.078 | 0.022 | |||||||
| fbmy8032_rel_221222.cza1ps0_bee | 99.556 | 0.350 | 0.094 | 0.039 | |||||||
| fbmy8032_rel_clang14_221222.cza1_bee | 99.567 | 0.378 | 0.056 | 0.018 | |||||||
| fbmy8032_rel_clang15_221222.cza1_bee | 99.750 | 0.178 | 0.072 | 0.018 |
Performance metrics for the DBMS listed above. Some are normalized by throughput, others are not. Legend for results is here.
ips	qps	rps	rmbps	wps	wmbps	rpq	rkbpq	wpi	wkbpi	csps	cpups	cspq	cpupq	dbgb1	dbgb2	rss	maxop	p50	p99	tag
499	1681	0	0.0	8.5	2.3	0.000	0.000	0.017	4.763	6853	13.6	4.076	647	2.1	2.6	8.9	0.031	1742	1071	fbmy8028_rel_221222.cza1_bee
499	1743	4	0.0	8.5	2.4	0.003	0.015	0.017	4.895	7091	13.6	4.068	624	2.1	2.6	8.7	0.030	1742	1055	fbmy8028_rel_221222.cza1ps0_bee
499	1575	0	0.0	8.4	2.3	0.000	0.000	0.017	4.690	6449	13.5	4.094	686	2.1	2.6	8.9	0.029	1567	1070	fbmy8028_rel_clang14_221222.cza1_bee
499	1760	0	0.0	8.6	2.3	0.000	0.000	0.017	4.748	7141	13.7	4.057	623	2.2	2.6	8.8	0.031	1819	1055	fbmy8028_rel_clang15_221222.cza1_bee
499	1746	0	0.0	8.7	2.4	0.000	0.000	0.017	4.845	7304	14.0	4.184	642	2.1	2.6	8.8	0.033	1806	1215	fbmy8032_rel_221222.cza1_bee
499	1601	0	0.0	8.4	2.3	0.000	0.000	0.017	4.632	6730	13.5	4.203	674	2.1	2.6	8.6	0.028	1582	1295	fbmy8032_rel_221222.cza1ps0_bee
499	1382	0	0.0	8.7	2.3	0.000	0.000	0.017	4.813	5899	13.6	4.267	787	2.1	2.6	8.8	0.035	1374	1135	fbmy8032_rel_clang14_221222.cza1_bee
499	1250	0	0.0	8.7	2.4	0.000	0.000	0.018	4.896	5395	13.7	4.318	877	2.1	2.6	8.9	0.030	1246	1038	fbmy8032_rel_clang15_221222.cza1_bee
qp500.L4
qp500.L4: point queries with 500 insert/s per client. Graphs for performance per 1-second interval are here.
Average throughput:
Query response time histogram: each cell has the percentage of responses that take <= the time in the header and max is the max response time in seconds. For max values in the top 25% of the range have a red background and in the bottom 25% of the range have a green background. The red background is not used when the min value is within 80% of the max value.
| dbms | 256us | 1ms | 4ms | 16ms | 64ms | 256ms | 1s | 4s | 16s | gt | max |
|---|---|---|---|---|---|---|---|---|---|---|---|
| fbmy8028_rel_221222.cza1_bee | 0.002 | 99.993 | 0.005 | nonzero | 0.010 | ||||||
| fbmy8028_rel_221222.cza1ps0_bee | 0.003 | 99.992 | 0.005 | nonzero | 0.005 | ||||||
| fbmy8028_rel_clang14_221222.cza1_bee | 0.002 | 99.991 | 0.007 | 0.003 | |||||||
| fbmy8028_rel_clang15_221222.cza1_bee | 0.001 | 99.994 | 0.006 | 0.003 | |||||||
| fbmy8032_rel_221222.cza1_bee | 99.993 | 0.007 | 0.003 | ||||||||
| fbmy8032_rel_221222.cza1ps0_bee | nonzero | 99.994 | 0.006 | 0.003 | |||||||
| fbmy8032_rel_clang14_221222.cza1_bee | 99.995 | 0.005 | nonzero | 0.007 | |||||||
| fbmy8032_rel_clang15_221222.cza1_bee | 99.994 | 0.006 | 0.003 |
Insert response time histogram: each cell has the percentage of responses that take <= the time in the header and max is the max response time in seconds. For max values in the top 25% of the range have a red background and in the bottom 25% of the range have a green background. The red background is not used when the min value is within 80% of the max value.
| dbms | 256us | 1ms | 4ms | 16ms | 64ms | 256ms | 1s | 4s | 16s | gt | max |
|---|---|---|---|---|---|---|---|---|---|---|---|
| fbmy8028_rel_221222.cza1_bee | 99.661 | 0.250 | 0.089 | 0.019 | |||||||
| fbmy8028_rel_221222.cza1ps0_bee | 99.378 | 0.539 | 0.083 | 0.018 | |||||||
| fbmy8028_rel_clang14_221222.cza1_bee | 99.544 | 0.372 | 0.083 | 0.018 | |||||||
| fbmy8028_rel_clang15_221222.cza1_bee | 99.589 | 0.328 | 0.083 | 0.018 | |||||||
| fbmy8032_rel_221222.cza1_bee | 99.500 | 0.411 | 0.089 | 0.018 | |||||||
| fbmy8032_rel_221222.cza1ps0_bee | 99.500 | 0.411 | 0.089 | 0.018 | |||||||
| fbmy8032_rel_clang14_221222.cza1_bee | 99.478 | 0.433 | 0.089 | 0.018 | |||||||
| fbmy8032_rel_clang15_221222.cza1_bee | 99.439 | 0.483 | 0.078 | 0.018 |
Delete response time histogram: each cell has the percentage of responses that take <= the time in the header and max is the max response time in seconds. For max values in the top 25% of the range have a red background and in the bottom 25% of the range have a green background. The red background is not used when the min value is within 80% of the max value.
| dbms | 256us | 1ms | 4ms | 16ms | 64ms | 256ms | 1s | 4s | 16s | gt | max |
|---|---|---|---|---|---|---|---|---|---|---|---|
| fbmy8028_rel_221222.cza1_bee | 99.717 | 0.200 | 0.083 | 0.019 | |||||||
| fbmy8028_rel_221222.cza1ps0_bee | 99.444 | 0.483 | 0.072 | 0.018 | |||||||
| fbmy8028_rel_clang14_221222.cza1_bee | 99.606 | 0.311 | 0.083 | 0.018 | |||||||
| fbmy8028_rel_clang15_221222.cza1_bee | 99.600 | 0.322 | 0.078 | 0.018 | |||||||
| fbmy8032_rel_221222.cza1_bee | 99.528 | 0.389 | 0.083 | 0.018 | |||||||
| fbmy8032_rel_221222.cza1ps0_bee | 99.567 | 0.367 | 0.067 | 0.022 | |||||||
| fbmy8032_rel_clang14_221222.cza1_bee | 99.500 | 0.411 | 0.089 | 0.018 | |||||||
| fbmy8032_rel_clang15_221222.cza1_bee | 99.461 | 0.472 | 0.067 | 0.023 |
Performance metrics for the DBMS listed above. Some are normalized by throughput, others are not. Legend for results is here.
ips	qps	rps	rmbps	wps	wmbps	rpq	rkbpq	wpi	wkbpi	csps	cpups	cspq	cpupq	dbgb1	dbgb2	rss	maxop	p50	p99	tag
499	2418	12	0.1	8.6	2.3	0.005	0.028	0.017	4.773	10194	15.1	4.216	500	2.1	2.8	9.0	0.010	2397	2009	fbmy8028_rel_221222.cza1_bee
499	2373	9	0.1	8.3	2.3	0.004	0.022	0.017	4.632	9988	14.6	4.209	492	2.1	2.8	8.7	0.005	2269	2095	fbmy8028_rel_221222.cza1ps0_bee
499	2453	8	0.0	8.6	2.3	0.003	0.020	0.017	4.711	10304	14.7	4.201	479	2.1	2.8	9.1	0.003	2429	1983	fbmy8028_rel_clang14_221222.cza1_bee
499	2410	0	0.0	8.3	2.2	0.000	0.000	0.017	4.495	10116	14.7	4.198	488	2.1	2.8	9.0	0.003	2387	2013	fbmy8028_rel_clang15_221222.cza1_bee
499	2374	0	0.0	8.5	2.2	0.000	0.000	0.017	4.566	10163	15.0	4.282	506	2.1	2.8	8.9	0.003	2349	1932	fbmy8032_rel_221222.cza1_bee
499	2368	0	0.0	8.4	2.2	0.000	0.000	0.017	4.601	10137	14.8	4.281	500	2.2	2.8	8.6	0.003	2269	2062	fbmy8032_rel_221222.cza1ps0_bee
499	2396	1	0.0	8.5	2.2	0.000	0.002	0.017	4.535	10258	15.1	4.280	504	2.1	2.8	9.0	0.007	2397	1949	fbmy8032_rel_clang14_221222.cza1_bee
499	2422	0	0.0	8.4	2.2	0.000	0.000	0.017	4.604	10358	14.9	4.277	492	2.1	2.8	9.0	0.003	2429	1950	fbmy8032_rel_clang15_221222.cza1_bee
qr1000.L5
qr1000.L5: range queries with 1000 insert/s per client. Graphs for performance per 1-second interval are here.
Average throughput:
Query response time histogram: each cell has the percentage of responses that take <= the time in the header and max is the max response time in seconds. For max values in the top 25% of the range have a red background and in the bottom 25% of the range have a green background. The red background is not used when the min value is within 80% of the max value.
| dbms | 256us | 1ms | 4ms | 16ms | 64ms | 256ms | 1s | 4s | 16s | gt | max |
|---|---|---|---|---|---|---|---|---|---|---|---|
| fbmy8028_rel_221222.cza1_bee | 6.434 | 75.407 | 18.158 | 0.001 | nonzero | 0.031 | |||||
| fbmy8028_rel_221222.cza1ps0_bee | 8.888 | 70.183 | 20.923 | 0.006 | nonzero | 0.034 | |||||
| fbmy8028_rel_clang14_221222.cza1_bee | 4.849 | 77.392 | 17.748 | 0.011 | nonzero | 0.041 | |||||
| fbmy8028_rel_clang15_221222.cza1_bee | 6.380 | 74.081 | 19.538 | 0.001 | nonzero | 0.036 | |||||
| fbmy8032_rel_221222.cza1_bee | 7.520 | 70.915 | 21.558 | 0.007 | nonzero | 0.032 | |||||
| fbmy8032_rel_221222.cza1ps0_bee | 14.032 | 65.857 | 20.085 | 0.026 | nonzero | 0.032 | |||||
| fbmy8032_rel_clang14_221222.cza1_bee | 6.871 | 71.539 | 21.069 | 0.520 | 0.001 | 0.032 | |||||
| fbmy8032_rel_clang15_221222.cza1_bee | 7.410 | 67.796 | 24.774 | 0.019 | 0.001 | 0.035 |
Insert response time histogram: each cell has the percentage of responses that take <= the time in the header and max is the max response time in seconds. For max values in the top 25% of the range have a red background and in the bottom 25% of the range have a green background. The red background is not used when the min value is within 80% of the max value.
| dbms | 256us | 1ms | 4ms | 16ms | 64ms | 256ms | 1s | 4s | 16s | gt | max |
|---|---|---|---|---|---|---|---|---|---|---|---|
| fbmy8028_rel_221222.cza1_bee | 99.436 | 0.497 | 0.067 | 0.050 | |||||||
| fbmy8028_rel_221222.cza1ps0_bee | 99.575 | 0.350 | 0.075 | 0.048 | |||||||
| fbmy8028_rel_clang14_221222.cza1_bee | 99.583 | 0.342 | 0.075 | 0.049 | |||||||
| fbmy8028_rel_clang15_221222.cza1_bee | 99.606 | 0.308 | 0.086 | 0.049 | |||||||
| fbmy8032_rel_221222.cza1_bee | 99.544 | 0.378 | 0.078 | 0.050 | |||||||
| fbmy8032_rel_221222.cza1ps0_bee | 99.567 | 0.356 | 0.078 | 0.033 | |||||||
| fbmy8032_rel_clang14_221222.cza1_bee | 99.531 | 0.389 | 0.081 | 0.050 | |||||||
| fbmy8032_rel_clang15_221222.cza1_bee | 99.722 | 0.192 | 0.086 | 0.042 |
Delete response time histogram: each cell has the percentage of responses that take <= the time in the header and max is the max response time in seconds. For max values in the top 25% of the range have a red background and in the bottom 25% of the range have a green background. The red background is not used when the min value is within 80% of the max value.
| dbms | 256us | 1ms | 4ms | 16ms | 64ms | 256ms | 1s | 4s | 16s | gt | max |
|---|---|---|---|---|---|---|---|---|---|---|---|
| fbmy8028_rel_221222.cza1_bee | 99.436 | 0.492 | 0.069 | 0.003 | 0.065 | ||||||
| fbmy8028_rel_221222.cza1ps0_bee | 99.594 | 0.333 | 0.072 | 0.062 | |||||||
| fbmy8028_rel_clang14_221222.cza1_bee | 99.592 | 0.333 | 0.072 | 0.003 | 0.068 | ||||||
| fbmy8028_rel_clang15_221222.cza1_bee | 99.642 | 0.281 | 0.078 | 0.063 | |||||||
| fbmy8032_rel_221222.cza1_bee | 99.564 | 0.361 | 0.075 | 0.042 | |||||||
| fbmy8032_rel_221222.cza1ps0_bee | 99.592 | 0.336 | 0.072 | 0.047 | |||||||
| fbmy8032_rel_clang14_221222.cza1_bee | 99.586 | 0.336 | 0.078 | 0.041 | |||||||
| fbmy8032_rel_clang15_221222.cza1_bee | 99.728 | 0.186 | 0.086 | 0.034 |
Performance metrics for the DBMS listed above. Some are normalized by throughput, others are not. Legend for results is here.
ips	qps	rps	rmbps	wps	wmbps	rpq	rkbpq	wpi	wkbpi	csps	cpups	cspq	cpupq	dbgb1	dbgb2	rss	maxop	p50	p99	tag
998	1505	52	0.3	14.2	4.5	0.034	0.199	0.014	4.659	6566	15.5	4.364	824	2.2	3.2	9.1	0.031	1359	1086	fbmy8028_rel_221222.cza1_bee
998	1477	46	0.3	14.4	4.8	0.031	0.184	0.014	4.912	6386	15.5	4.324	840	2.1	3.2	8.8	0.034	1470	1087	fbmy8028_rel_221222.cza1ps0_bee
998	1519	68	0.4	14.5	4.7	0.045	0.260	0.015	4.787	6590	15.6	4.338	821	2.1	3.2	9.0	0.041	1502	910	fbmy8028_rel_clang14_221222.cza1_bee
998	1469	22	0.1	14.5	4.7	0.015	0.088	0.015	4.855	6307	15.5	4.293	844	2.2	3.2	9.1	0.036	1391	1022	fbmy8028_rel_clang15_221222.cza1_bee
998	1333	16	0.1	14.4	4.7	0.012	0.075	0.014	4.821	5973	15.5	4.481	930	2.2	3.2	9.0	0.032	1295	1055	fbmy8032_rel_221222.cza1_bee
998	1410	42	0.2	14.7	4.7	0.030	0.171	0.015	4.855	6298	15.6	4.467	885	2.1	3.2	8.8	0.032	1388	975	fbmy8032_rel_221222.cza1ps0_bee
998	1369	35	0.2	14.2	4.6	0.026	0.155	0.014	4.672	6148	15.4	4.489	900	2.1	3.2	9.0	0.032	1375	1023	fbmy8032_rel_clang14_221222.cza1_bee
998	1299	30	0.2	14.6	4.7	0.023	0.142	0.015	4.854	5867	15.5	4.517	955	2.1	3.2	9.0	0.035	1295	943	fbmy8032_rel_clang15_221222.cza1_bee
qp1000.L6
qp1000.L6: point queries with 1000 insert/s per client. Graphs for performance per 1-second interval are here.
Average throughput:
Query response time histogram: each cell has the percentage of responses that take <= the time in the header and max is the max response time in seconds. For max values in the top 25% of the range have a red background and in the bottom 25% of the range have a green background. The red background is not used when the min value is within 80% of the max value.
| dbms | 256us | 1ms | 4ms | 16ms | 64ms | 256ms | 1s | 4s | 16s | gt | max |
|---|---|---|---|---|---|---|---|---|---|---|---|
| fbmy8028_rel_221222.cza1_bee | nonzero | 99.988 | 0.011 | 0.001 | 0.007 | ||||||
| fbmy8028_rel_221222.cza1ps0_bee | 0.003 | 99.987 | 0.010 | 0.003 | |||||||
| fbmy8028_rel_clang14_221222.cza1_bee | 99.991 | 0.009 | nonzero | 0.006 | |||||||
| fbmy8028_rel_clang15_221222.cza1_bee | 99.991 | 0.009 | nonzero | 0.006 | |||||||
| fbmy8032_rel_221222.cza1_bee | nonzero | 99.990 | 0.010 | nonzero | 0.005 | ||||||
| fbmy8032_rel_221222.cza1ps0_bee | 0.002 | 99.991 | 0.008 | nonzero | 0.005 | ||||||
| fbmy8032_rel_clang14_221222.cza1_bee | 99.991 | 0.009 | nonzero | 0.005 | |||||||
| fbmy8032_rel_clang15_221222.cza1_bee | 99.991 | 0.009 | nonzero | 0.005 |
Insert response time histogram: each cell has the percentage of responses that take <= the time in the header and max is the max response time in seconds. For max values in the top 25% of the range have a red background and in the bottom 25% of the range have a green background. The red background is not used when the min value is within 80% of the max value.
| dbms | 256us | 1ms | 4ms | 16ms | 64ms | 256ms | 1s | 4s | 16s | gt | max |
|---|---|---|---|---|---|---|---|---|---|---|---|
| fbmy8028_rel_221222.cza1_bee | 99.558 | 0.356 | 0.083 | 0.003 | 0.067 | ||||||
| fbmy8028_rel_221222.cza1ps0_bee | 99.592 | 0.325 | 0.083 | 0.040 | |||||||
| fbmy8028_rel_clang14_221222.cza1_bee | 99.842 | 0.075 | 0.083 | 0.064 | |||||||
| fbmy8028_rel_clang15_221222.cza1_bee | 99.547 | 0.367 | 0.086 | 0.042 | |||||||
| fbmy8032_rel_221222.cza1_bee | 99.531 | 0.392 | 0.078 | 0.056 | |||||||
| fbmy8032_rel_221222.cza1ps0_bee | 99.447 | 0.481 | 0.072 | 0.051 | |||||||
| fbmy8032_rel_clang14_221222.cza1_bee | 99.706 | 0.208 | 0.086 | 0.041 | |||||||
| fbmy8032_rel_clang15_221222.cza1_bee | 99.575 | 0.339 | 0.086 | 0.033 |
Delete response time histogram: each cell has the percentage of responses that take <= the time in the header and max is the max response time in seconds. For max values in the top 25% of the range have a red background and in the bottom 25% of the range have a green background. The red background is not used when the min value is within 80% of the max value.
| dbms | 256us | 1ms | 4ms | 16ms | 64ms | 256ms | 1s | 4s | 16s | gt | max |
|---|---|---|---|---|---|---|---|---|---|---|---|
| fbmy8028_rel_221222.cza1_bee | 99.592 | 0.325 | 0.083 | 0.052 | |||||||
| fbmy8028_rel_221222.cza1ps0_bee | 99.633 | 0.283 | 0.083 | 0.053 | |||||||
| fbmy8028_rel_clang14_221222.cza1_bee | 99.858 | 0.064 | 0.078 | 0.050 | |||||||
| fbmy8028_rel_clang15_221222.cza1_bee | 99.594 | 0.322 | 0.083 | 0.056 | |||||||
| fbmy8032_rel_221222.cza1_bee | 99.581 | 0.344 | 0.075 | 0.042 | |||||||
| fbmy8032_rel_221222.cza1ps0_bee | 99.514 | 0.414 | 0.072 | 0.043 | |||||||
| fbmy8032_rel_clang14_221222.cza1_bee | 99.742 | 0.178 | 0.081 | 0.055 | |||||||
| fbmy8032_rel_clang15_221222.cza1_bee | 99.581 | 0.336 | 0.083 | 0.047 |
Performance metrics for the DBMS listed above. Some are normalized by throughput, others are not. Legend for results is here.
ips	qps	rps	rmbps	wps	wmbps	rpq	rkbpq	wpi	wkbpi	csps	cpups	cspq	cpupq	dbgb1	dbgb2	rss	maxop	p50	p99	tag
998	2414	67	0.4	14.3	4.7	0.028	0.161	0.014	4.783	10480	16.5	4.342	547	2.1	3.6	9.4	0.007	2397	1966	fbmy8028_rel_221222.cza1_bee
998	2333	35	0.2	14.4	4.7	0.015	0.088	0.014	4.823	10092	16.3	4.325	559	2.1	3.6	9.1	0.003	2238	2032	fbmy8028_rel_221222.cza1ps0_bee
997	2356	62	0.3	14.6	4.6	0.026	0.150	0.015	4.733	10238	16.4	4.347	557	2.2	3.6	9.3	0.006	2333	1934	fbmy8028_rel_clang14_221222.cza1_bee
998	2460	70	0.4	14.7	4.7	0.029	0.164	0.015	4.811	10673	16.6	4.338	540	2.1	3.6	9.3	0.006	2445	1999	fbmy8028_rel_clang15_221222.cza1_bee
998	2354	47	0.3	14.5	4.7	0.020	0.119	0.015	4.781	10402	16.7	4.418	567	2.2	3.6	9.2	0.005	2333	1934	fbmy8032_rel_221222.cza1_bee
998	2338	62	0.3	14.9	4.8	0.027	0.153	0.015	4.895	10369	16.5	4.435	565	2.1	3.6	9.1	0.005	2253	2030	fbmy8032_rel_221222.cza1ps0_bee
998	2361	55	0.3	14.5	4.7	0.023	0.134	0.015	4.797	10449	16.7	4.426	566	2.1	3.6	9.3	0.005	2349	1933	fbmy8032_rel_clang14_221222.cza1_bee
998	2372	43	0.2	14.5	4.6	0.018	0.103	0.014	4.762	10465	16.7	4.413	563	2.1	3.6	9.3	0.005	2366	1919	fbmy8032_rel_clang15_221222.cza1_bee
l.i0
l.i0: load without secondary indexes
Performance metrics for all DBMS, not just the ones listed above. Some are normalized by throughput, others are not. Legend for results is here.
ips	qps	rps	rmbps	wps	wmbps	rpq	rkbpq	wpi	wkbpi	csps	cpups	cspq	cpupq	dbgb1	dbgb2	rss	maxop	p50	p99	tag
57803	0	0	0.0	36.3	11.9	0.000	0.000	0.001	0.211	6068	22.6	0.105	31	0.9	2.7	0.6	0.082	58037	51263	fbmy8028_rel_221222.cza1_bee
60120	0	0	0.0	37.6	12.3	0.000	0.000	0.001	0.210	6275	22.7	0.104	30	0.9	2.7	0.4	0.073	60503	54555	fbmy8028_rel_221222.cza1ps0_bee
58480	0	0	0.0	36.8	12.0	0.000	0.000	0.001	0.211	6138	22.6	0.105	31	0.9	2.7	0.6	0.082	58658	52969	fbmy8028_rel_clang14_221222.cza1_bee
58366	0	0	0.0	36.5	12.0	0.000	0.000	0.001	0.211	6116	22.5	0.105	31	0.9	2.7	0.6	0.080	58634	52940	fbmy8028_rel_clang15_221222.cza1_bee
53957	0	0	0.0	34.8	11.1	0.000	0.000	0.001	0.210	5839	21.7	0.108	32	0.9	2.7	0.6	0.070	54139	49644	fbmy8032_rel_221222.cza1_bee
56926	0	0	0.0	36.7	11.7	0.000	0.000	0.001	0.211	6112	22.0	0.107	31	0.9	2.7	0.4	0.072	57138	51942	fbmy8032_rel_221222.cza1ps0_bee
54054	0	0	0.0	34.9	11.1	0.000	0.000	0.001	0.210	5835	21.6	0.108	32	0.9	2.7	0.6	0.073	54180	49461	fbmy8032_rel_clang14_221222.cza1_bee
55350	0	0	0.0	35.6	11.4	0.000	0.000	0.001	0.210	5974	21.8	0.108	32	0.9	2.7	0.6	0.074	55535	50039	fbmy8032_rel_clang15_221222.cza1_bee
l.x
l.x: create secondary indexes
Performance metrics for all DBMS, not just the ones listed above. Some are normalized by throughput, others are not. Legend for results is here.
ips	qps	rps	rmbps	wps	wmbps	rpq	rkbpq	wpi	wkbpi	csps	cpups	cspq	cpupq	dbgb1	dbgb2	rss	maxop	p50	p99	tag
77922	0	0	0.0	31.2	12.1	0.000	0.000	0.000	0.159	357	11.7	0.005	12	2.0	3.8	2.7	0.003	NA	NA	fbmy8028_rel_221222.cza1_bee
79576	0	0	0.0	32.0	12.3	0.000	0.000	0.000	0.158	384	11.7	0.005	12	2.0	3.8	2.5	0.003	NA	NA	fbmy8028_rel_221222.cza1ps0_bee
71429	0	0	0.0	28.7	11.0	0.000	0.000	0.000	0.158	342	11.7	0.005	13	2.0	3.8	2.7	0.003	NA	NA	fbmy8028_rel_clang14_221222.cza1_bee
71943	0	0	0.0	28.9	11.1	0.000	0.000	0.000	0.158	350	11.8	0.005	13	2.0	3.8	2.7	0.003	NA	NA	fbmy8028_rel_clang15_221222.cza1_bee
77320	0	0	0.0	30.9	11.9	0.000	0.000	0.000	0.158	582	11.8	0.008	12	2.0	3.8	2.7	0.003	NA	NA	fbmy8032_rel_221222.cza1_bee
79156	0	0	0.0	31.5	12.2	0.000	0.000	0.000	0.158	584	11.7	0.007	12	2.0	3.8	2.5	0.003	NA	NA	fbmy8032_rel_221222.cza1ps0_bee
71259	0	0	0.0	28.6	11.0	0.000	0.000	0.000	0.159	566	11.7	0.008	13	2.0	3.8	2.7	0.003	NA	NA	fbmy8032_rel_clang14_221222.cza1_bee
71943	0	0	0.0	28.9	11.1	0.000	0.000	0.000	0.158	580	11.8	0.008	13	2.0	3.8	2.7	0.003	NA	NA	fbmy8032_rel_clang15_221222.cza1_bee
l.i1
l.i1: continue load after secondary indexes created with 50 inserts per transaction
Performance metrics for all DBMS, not just the ones listed above. Some are normalized by throughput, others are not. Legend for results is here.
ips	qps	rps	rmbps	wps	wmbps	rpq	rkbpq	wpi	wkbpi	csps	cpups	cspq	cpupq	dbgb1	dbgb2	rss	maxop	p50	p99	tag
22612	0	139	0.8	107.7	41.3	0.006	0.035	0.005	1.868	10151	46.1	0.449	163	2.6	3.5	5.3	0.087	22575	20126	fbmy8028_rel_221222.cza1_bee
23310	0	129	0.7	110.0	41.9	0.006	0.031	0.005	1.840	10427	46.1	0.447	158	2.4	3.2	5.1	0.093	23272	20835	fbmy8028_rel_221222.cza1ps0_bee
23337	0	142	0.8	110.2	41.8	0.006	0.034	0.005	1.835	10425	46.6	0.447	160	3.0	3.8	5.4	0.090	23274	20575	fbmy8028_rel_clang14_221222.cza1_bee
23392	0	138	0.8	111.2	42.6	0.006	0.033	0.005	1.863	10458	46.5	0.447	159	2.4	3.2	5.4	0.091	23333	20927	fbmy8028_rel_clang15_221222.cza1_bee
21954	0	122	0.7	103.9	39.5	0.006	0.032	0.005	1.841	10003	45.6	0.456	166	2.3	3.1	5.3	0.079	21925	19382	fbmy8032_rel_221222.cza1_bee
22779	0	137	0.8	107.7	40.8	0.006	0.034	0.005	1.834	10387	46.1	0.456	162	2.3	3.1	5.1	0.076	22723	20577	fbmy8032_rel_221222.cza1ps0_bee
22321	0	126	0.7	105.5	39.9	0.006	0.032	0.005	1.833	10141	45.8	0.454	164	2.5	3.4	5.3	0.077	22275	19994	fbmy8032_rel_clang14_221222.cza1_bee
22740	0	130	0.7	106.3	40.3	0.006	0.033	0.005	1.816	10361	46.1	0.456	162	2.7	3.5	5.3	0.090	22675	20427	fbmy8032_rel_clang15_221222.cza1_bee
l.i2
l.i2: continue load after secondary indexes created with 5 inserts per transaction
Performance metrics for all DBMS, not just the ones listed above. Some are normalized by throughput, others are not. Legend for results is here.
ips	qps	rps	rmbps	wps	wmbps	rpq	rkbpq	wpi	wkbpi	csps	cpups	cspq	cpupq	dbgb1	dbgb2	rss	maxop	p50	p99	tag
7837	0	26	0.1	96.1	34.8	0.003	0.019	0.012	4.553	32754	43.0	4.179	439	2.2	2.6	7.5	0.096	7826	6852	fbmy8028_rel_221222.cza1_bee
8244	0	0	0.0	97.4	35.4	0.000	0.000	0.012	4.396	34125	43.4	4.139	421	2.3	2.7	7.2	0.074	8191	7262	fbmy8028_rel_221222.cza1ps0_bee
8285	0	26	0.1	93.7	34.3	0.003	0.017	0.011	4.242	34213	43.5	4.129	420	2.3	2.6	7.3	0.079	8246	7272	fbmy8028_rel_clang14_221222.cza1_bee
8264	0	27	0.2	98.2	35.4	0.003	0.019	0.012	4.390	34339	43.8	4.155	424	2.2	2.5	7.5	0.094	8246	7332	fbmy8028_rel_clang15_221222.cza1_bee
7669	0	14	0.1	92.5	33.9	0.002	0.010	0.012	4.525	32196	42.9	4.198	448	2.2	2.5	7.4	0.068	7626	6742	fbmy8032_rel_221222.cza1_bee
8091	0	21	0.1	99.8	36.2	0.003	0.015	0.012	4.586	33826	43.7	4.181	432	2.2	2.5	7.3	0.068	8086	7111	fbmy8032_rel_221222.cza1ps0_bee
7974	0	26	0.1	94.9	34.6	0.003	0.019	0.012	4.448	33304	43.6	4.176	437	2.2	2.5	7.4	0.081	7968	6864	fbmy8032_rel_clang14_221222.cza1_bee
7962	0	16	0.1	96.8	35.0	0.002	0.011	0.012	4.501	33354	43.7	4.189	439	2.2	2.5	7.4	0.071	7956	7007	fbmy8032_rel_clang15_221222.cza1_bee
qr100.L1
qr100.L1: range queries with 100 insert/s per client
Performance metrics for all DBMS, not just the ones listed above. Some are normalized by throughput, others are not. Legend for results is here.
ips	qps	rps	rmbps	wps	wmbps	rpq	rkbpq	wpi	wkbpi	csps	cpups	cspq	cpupq	dbgb1	dbgb2	rss	maxop	p50	p99	tag
100	1314	0	0.0	4.1	0.4	0.000	0.000	0.041	3.644	5306	12.6	4.038	767	2.1	2.3	7.8	0.028	1311	1215	fbmy8028_rel_221222.cza1_bee
100	1185	0	0.0	4.2	0.5	0.000	0.000	0.042	4.726	4823	12.7	4.070	857	2.1	2.3	7.5	0.029	1183	1087	fbmy8028_rel_221222.cza1ps0_bee
100	1151	0	0.0	4.5	0.5	0.000	0.000	0.045	5.139	4689	12.7	4.074	883	2.1	2.3	7.6	0.031	1151	1039	fbmy8028_rel_clang14_221222.cza1_bee
100	1106	0	0.0	4.3	0.4	0.000	0.000	0.043	4.360	4507	12.6	4.074	911	2.1	2.4	7.8	0.029	1095	1006	fbmy8028_rel_clang15_221222.cza1_bee
100	1562	0	0.0	4.1	0.3	0.000	0.000	0.041	3.439	6445	12.5	4.126	640	2.1	2.3	7.7	0.024	1566	1440	fbmy8032_rel_221222.cza1_bee
100	1748	0	0.0	4.5	0.5	0.000	0.000	0.045	4.698	7141	12.5	4.084	572	2.1	2.4	7.5	0.032	1742	1390	fbmy8032_rel_221222.cza1ps0_bee
100	1870	0	0.0	4.1	0.4	0.000	0.000	0.041	3.697	7612	12.7	4.069	543	2.1	2.4	7.6	0.028	1870	1614	fbmy8032_rel_clang14_221222.cza1_bee
100	1671	0	0.0	4.1	0.4	0.000	0.000	0.041	3.850	6851	12.5	4.100	598	2.1	2.4	7.6	0.028	1663	1519	fbmy8032_rel_clang15_221222.cza1_bee
qp100.L2
qp100.L2: point queries with 100 insert/s per client
Performance metrics for all DBMS, not just the ones listed above. Some are normalized by throughput, others are not. Legend for results is here.
ips	qps	rps	rmbps	wps	wmbps	rpq	rkbpq	wpi	wkbpi	csps	cpups	cspq	cpupq	dbgb1	dbgb2	rss	maxop	p50	p99	tag
100	2450	34	0.2	4.2	0.4	0.014	0.087	0.042	4.437	10237	13.6	4.178	444	2.1	2.4	8.9	0.010	2429	1902	fbmy8028_rel_221222.cza1_bee
100	2395	0	0.0	4.0	0.4	0.000	0.000	0.040	3.699	9969	13.1	4.163	438	2.1	2.4	8.6	0.005	2286	2047	fbmy8028_rel_221222.cza1ps0_bee
100	2454	24	0.1	3.9	0.4	0.010	0.060	0.039	3.653	10214	13.3	4.163	434	2.1	2.4	8.8	0.010	2413	1982	fbmy8028_rel_clang14_221222.cza1_bee
100	2495	25	0.2	4.2	0.4	0.010	0.063	0.042	4.329	10388	13.6	4.164	436	2.1	2.4	8.8	0.010	2461	2014	fbmy8028_rel_clang15_221222.cza1_bee
100	2394	17	0.1	4.0	0.4	0.007	0.044	0.040	3.733	10149	13.3	4.240	445	2.1	2.4	8.8	0.010	2366	1902	fbmy8032_rel_221222.cza1_bee
100	2384	26	0.2	4.4	0.5	0.011	0.069	0.044	4.964	10122	13.6	4.245	456	2.1	2.4	8.6	0.010	2237	2048	fbmy8032_rel_221222.cza1ps0_bee
100	2338	28	0.2	4.2	0.5	0.012	0.074	0.042	4.765	9949	13.5	4.255	462	2.1	2.4	8.8	0.010	2317	1918	fbmy8032_rel_clang14_221222.cza1_bee
100	2438	19	0.1	4.2	0.4	0.008	0.049	0.042	4.364	10333	13.7	4.238	449	2.1	2.4	8.8	0.010	2509	1870	fbmy8032_rel_clang15_221222.cza1_bee
qr500.L3
qr500.L3: range queries with 500 insert/s per client
Performance metrics for all DBMS, not just the ones listed above. Some are normalized by throughput, others are not. Legend for results is here.
ips	qps	rps	rmbps	wps	wmbps	rpq	rkbpq	wpi	wkbpi	csps	cpups	cspq	cpupq	dbgb1	dbgb2	rss	maxop	p50	p99	tag
499	1681	0	0.0	8.5	2.3	0.000	0.000	0.017	4.763	6853	13.6	4.076	647	2.1	2.6	8.9	0.031	1742	1071	fbmy8028_rel_221222.cza1_bee
499	1743	4	0.0	8.5	2.4	0.003	0.015	0.017	4.895	7091	13.6	4.068	624	2.1	2.6	8.7	0.030	1742	1055	fbmy8028_rel_221222.cza1ps0_bee
499	1575	0	0.0	8.4	2.3	0.000	0.000	0.017	4.690	6449	13.5	4.094	686	2.1	2.6	8.9	0.029	1567	1070	fbmy8028_rel_clang14_221222.cza1_bee
499	1760	0	0.0	8.6	2.3	0.000	0.000	0.017	4.748	7141	13.7	4.057	623	2.2	2.6	8.8	0.031	1819	1055	fbmy8028_rel_clang15_221222.cza1_bee
499	1746	0	0.0	8.7	2.4	0.000	0.000	0.017	4.845	7304	14.0	4.184	642	2.1	2.6	8.8	0.033	1806	1215	fbmy8032_rel_221222.cza1_bee
499	1601	0	0.0	8.4	2.3	0.000	0.000	0.017	4.632	6730	13.5	4.203	674	2.1	2.6	8.6	0.028	1582	1295	fbmy8032_rel_221222.cza1ps0_bee
499	1382	0	0.0	8.7	2.3	0.000	0.000	0.017	4.813	5899	13.6	4.267	787	2.1	2.6	8.8	0.035	1374	1135	fbmy8032_rel_clang14_221222.cza1_bee
499	1250	0	0.0	8.7	2.4	0.000	0.000	0.018	4.896	5395	13.7	4.318	877	2.1	2.6	8.9	0.030	1246	1038	fbmy8032_rel_clang15_221222.cza1_bee
qp500.L4
qp500.L4: point queries with 500 insert/s per client
Performance metrics for all DBMS, not just the ones listed above. Some are normalized by throughput, others are not. Legend for results is here.
ips	qps	rps	rmbps	wps	wmbps	rpq	rkbpq	wpi	wkbpi	csps	cpups	cspq	cpupq	dbgb1	dbgb2	rss	maxop	p50	p99	tag
499	2418	12	0.1	8.6	2.3	0.005	0.028	0.017	4.773	10194	15.1	4.216	500	2.1	2.8	9.0	0.010	2397	2009	fbmy8028_rel_221222.cza1_bee
499	2373	9	0.1	8.3	2.3	0.004	0.022	0.017	4.632	9988	14.6	4.209	492	2.1	2.8	8.7	0.005	2269	2095	fbmy8028_rel_221222.cza1ps0_bee
499	2453	8	0.0	8.6	2.3	0.003	0.020	0.017	4.711	10304	14.7	4.201	479	2.1	2.8	9.1	0.003	2429	1983	fbmy8028_rel_clang14_221222.cza1_bee
499	2410	0	0.0	8.3	2.2	0.000	0.000	0.017	4.495	10116	14.7	4.198	488	2.1	2.8	9.0	0.003	2387	2013	fbmy8028_rel_clang15_221222.cza1_bee
499	2374	0	0.0	8.5	2.2	0.000	0.000	0.017	4.566	10163	15.0	4.282	506	2.1	2.8	8.9	0.003	2349	1932	fbmy8032_rel_221222.cza1_bee
499	2368	0	0.0	8.4	2.2	0.000	0.000	0.017	4.601	10137	14.8	4.281	500	2.2	2.8	8.6	0.003	2269	2062	fbmy8032_rel_221222.cza1ps0_bee
499	2396	1	0.0	8.5	2.2	0.000	0.002	0.017	4.535	10258	15.1	4.280	504	2.1	2.8	9.0	0.007	2397	1949	fbmy8032_rel_clang14_221222.cza1_bee
499	2422	0	0.0	8.4	2.2	0.000	0.000	0.017	4.604	10358	14.9	4.277	492	2.1	2.8	9.0	0.003	2429	1950	fbmy8032_rel_clang15_221222.cza1_bee
qr1000.L5
qr1000.L5: range queries with 1000 insert/s per client
Performance metrics for all DBMS, not just the ones listed above. Some are normalized by throughput, others are not. Legend for results is here.
ips	qps	rps	rmbps	wps	wmbps	rpq	rkbpq	wpi	wkbpi	csps	cpups	cspq	cpupq	dbgb1	dbgb2	rss	maxop	p50	p99	tag
998	1505	52	0.3	14.2	4.5	0.034	0.199	0.014	4.659	6566	15.5	4.364	824	2.2	3.2	9.1	0.031	1359	1086	fbmy8028_rel_221222.cza1_bee
998	1477	46	0.3	14.4	4.8	0.031	0.184	0.014	4.912	6386	15.5	4.324	840	2.1	3.2	8.8	0.034	1470	1087	fbmy8028_rel_221222.cza1ps0_bee
998	1519	68	0.4	14.5	4.7	0.045	0.260	0.015	4.787	6590	15.6	4.338	821	2.1	3.2	9.0	0.041	1502	910	fbmy8028_rel_clang14_221222.cza1_bee
998	1469	22	0.1	14.5	4.7	0.015	0.088	0.015	4.855	6307	15.5	4.293	844	2.2	3.2	9.1	0.036	1391	1022	fbmy8028_rel_clang15_221222.cza1_bee
998	1333	16	0.1	14.4	4.7	0.012	0.075	0.014	4.821	5973	15.5	4.481	930	2.2	3.2	9.0	0.032	1295	1055	fbmy8032_rel_221222.cza1_bee
998	1410	42	0.2	14.7	4.7	0.030	0.171	0.015	4.855	6298	15.6	4.467	885	2.1	3.2	8.8	0.032	1388	975	fbmy8032_rel_221222.cza1ps0_bee
998	1369	35	0.2	14.2	4.6	0.026	0.155	0.014	4.672	6148	15.4	4.489	900	2.1	3.2	9.0	0.032	1375	1023	fbmy8032_rel_clang14_221222.cza1_bee
998	1299	30	0.2	14.6	4.7	0.023	0.142	0.015	4.854	5867	15.5	4.517	955	2.1	3.2	9.0	0.035	1295	943	fbmy8032_rel_clang15_221222.cza1_bee
qp1000.L6
qp1000.L6: point queries with 1000 insert/s per client
Performance metrics for all DBMS, not just the ones listed above. Some are normalized by throughput, others are not. Legend for results is here.
ips	qps	rps	rmbps	wps	wmbps	rpq	rkbpq	wpi	wkbpi	csps	cpups	cspq	cpupq	dbgb1	dbgb2	rss	maxop	p50	p99	tag
998	2414	67	0.4	14.3	4.7	0.028	0.161	0.014	4.783	10480	16.5	4.342	547	2.1	3.6	9.4	0.007	2397	1966	fbmy8028_rel_221222.cza1_bee
998	2333	35	0.2	14.4	4.7	0.015	0.088	0.014	4.823	10092	16.3	4.325	559	2.1	3.6	9.1	0.003	2238	2032	fbmy8028_rel_221222.cza1ps0_bee
997	2356	62	0.3	14.6	4.6	0.026	0.150	0.015	4.733	10238	16.4	4.347	557	2.2	3.6	9.3	0.006	2333	1934	fbmy8028_rel_clang14_221222.cza1_bee
998	2460	70	0.4	14.7	4.7	0.029	0.164	0.015	4.811	10673	16.6	4.338	540	2.1	3.6	9.3	0.006	2445	1999	fbmy8028_rel_clang15_221222.cza1_bee
998	2354	47	0.3	14.5	4.7	0.020	0.119	0.015	4.781	10402	16.7	4.418	567	2.2	3.6	9.2	0.005	2333	1934	fbmy8032_rel_221222.cza1_bee
998	2338	62	0.3	14.9	4.8	0.027	0.153	0.015	4.895	10369	16.5	4.435	565	2.1	3.6	9.1	0.005	2253	2030	fbmy8032_rel_221222.cza1ps0_bee
998	2361	55	0.3	14.5	4.7	0.023	0.134	0.015	4.797	10449	16.7	4.426	566	2.1	3.6	9.3	0.005	2349	1933	fbmy8032_rel_clang14_221222.cza1_bee
998	2372	43	0.2	14.5	4.6	0.018	0.103	0.014	4.762	10465	16.7	4.413	563	2.1	3.6	9.3	0.005	2366	1919	fbmy8032_rel_clang15_221222.cza1_bee
l.i0
- l.i0: load without secondary indexes
- Legend for results is here.
- Each entry lists the percentage of responses that fit in that bucket (slower than max time for previous bucket, faster than min time for next bucket).
Insert response time histogram
256us	1ms	4ms	16ms	64ms	256ms	1s	4s	16s	gt	max	tag
0.000	0.000	99.723	0.203	0.071	0.003	0.000	0.000	0.000	0.000	0.082	fbmy8028_rel_221222.cza1_bee
0.000	0.000	99.730	0.196	0.071	0.003	0.000	0.000	0.000	0.000	0.073	fbmy8028_rel_221222.cza1ps0_bee
0.000	0.000	99.726	0.195	0.076	0.003	0.000	0.000	0.000	0.000	0.082	fbmy8028_rel_clang14_221222.cza1_bee
0.000	0.000	99.726	0.196	0.074	0.003	0.000	0.000	0.000	0.000	0.080	fbmy8028_rel_clang15_221222.cza1_bee
0.000	0.000	99.712	0.208	0.078	0.002	0.000	0.000	0.000	0.000	0.070	fbmy8032_rel_221222.cza1_bee
0.000	0.000	99.719	0.203	0.076	0.001	0.000	0.000	0.000	0.000	0.072	fbmy8032_rel_221222.cza1ps0_bee
0.000	0.000	99.712	0.206	0.080	0.002	0.000	0.000	0.000	0.000	0.073	fbmy8032_rel_clang14_221222.cza1_bee
0.000	0.000	99.717	0.201	0.080	0.003	0.000	0.000	0.000	0.000	0.074	fbmy8032_rel_clang15_221222.cza1_bee
l.x
- l.x: create secondary indexes
- Legend for results is here.
- Each entry lists the percentage of responses that fit in that bucket (slower than max time for previous bucket, faster than min time for next bucket).
TODO - determine whether there is data for create index response time
l.i1
- l.i1: continue load after secondary indexes created with 50 inserts per transaction
- Legend for results is here.
- Each entry lists the percentage of responses that fit in that bucket (slower than max time for previous bucket, faster than min time for next bucket).
Insert response time histogram
256us	1ms	4ms	16ms	64ms	256ms	1s	4s	16s	gt	max	tag
0.000	0.000	99.669	0.267	0.060	0.003	0.000	0.000	0.000	0.000	0.087	fbmy8028_rel_221222.cza1_bee
0.000	0.000	99.675	0.256	0.065	0.003	0.000	0.000	0.000	0.000	0.093	fbmy8028_rel_221222.cza1ps0_bee
0.000	0.000	99.675	0.263	0.059	0.003	0.000	0.000	0.000	0.000	0.090	fbmy8028_rel_clang14_221222.cza1_bee
0.000	0.000	99.674	0.263	0.060	0.003	0.000	0.000	0.000	0.000	0.091	fbmy8028_rel_clang15_221222.cza1_bee
0.000	0.000	99.660	0.272	0.067	0.002	0.000	0.000	0.000	0.000	0.079	fbmy8032_rel_221222.cza1_bee
0.000	0.000	99.668	0.265	0.065	0.001	0.000	0.000	0.000	0.000	0.076	fbmy8032_rel_221222.cza1ps0_bee
0.000	0.000	99.665	0.266	0.067	0.002	0.000	0.000	0.000	0.000	0.077	fbmy8032_rel_clang14_221222.cza1_bee
0.000	0.000	99.669	0.261	0.068	0.002	0.000	0.000	0.000	0.000	0.090	fbmy8032_rel_clang15_221222.cza1_bee
Delete response time histogram
256us	1ms	4ms	16ms	64ms	256ms	1s	4s	16s	gt	max	tag
0.000	0.000	99.659	0.271	0.067	0.003	0.000	0.000	0.000	0.000	0.093	fbmy8028_rel_221222.cza1_bee
0.000	0.000	99.664	0.260	0.072	0.003	0.000	0.000	0.000	0.000	0.088	fbmy8028_rel_221222.cza1ps0_bee
0.000	0.000	99.668	0.264	0.065	0.003	0.000	0.000	0.000	0.000	0.088	fbmy8028_rel_clang14_221222.cza1_bee
0.000	0.000	99.666	0.264	0.068	0.003	0.000	0.000	0.000	0.000	0.089	fbmy8028_rel_clang15_221222.cza1_bee
0.000	0.000	99.650	0.273	0.075	0.002	0.000	0.000	0.000	0.000	0.089	fbmy8032_rel_221222.cza1_bee
0.000	0.000	99.661	0.266	0.072	0.002	0.000	0.000	0.000	0.000	0.081	fbmy8032_rel_221222.cza1ps0_bee
0.000	0.000	99.656	0.268	0.074	0.002	0.000	0.000	0.000	0.000	0.090	fbmy8032_rel_clang14_221222.cza1_bee
0.000	0.000	99.662	0.262	0.074	0.002	0.000	0.000	0.000	0.000	0.078	fbmy8032_rel_clang15_221222.cza1_bee
l.i2
- l.i2: continue load after secondary indexes created with 5 inserts per transaction
- Legend for results is here.
- Each entry lists the percentage of responses that fit in that bucket (slower than max time for previous bucket, faster than min time for next bucket).
Insert response time histogram
256us	1ms	4ms	16ms	64ms	256ms	1s	4s	16s	gt	max	tag
0.000	99.826	0.089	0.082	0.002	0.001	0.000	0.000	0.000	0.000	0.096	fbmy8028_rel_221222.cza1_bee
0.000	99.847	0.072	0.078	0.002	nonzero	0.000	0.000	0.000	0.000	0.074	fbmy8028_rel_221222.cza1ps0_bee
0.000	99.866	0.053	0.078	0.003	nonzero	0.000	0.000	0.000	0.000	0.079	fbmy8028_rel_clang14_221222.cza1_bee
0.000	99.845	0.073	0.079	0.002	nonzero	0.000	0.000	0.000	0.000	0.094	fbmy8028_rel_clang15_221222.cza1_bee
0.000	99.808	0.106	0.083	0.003	nonzero	0.000	0.000	0.000	0.000	0.068	fbmy8032_rel_221222.cza1_bee
0.000	99.820	0.098	0.079	0.003	nonzero	0.000	0.000	0.000	0.000	0.068	fbmy8032_rel_221222.cza1ps0_bee
0.000	99.835	0.082	0.080	0.003	nonzero	0.000	0.000	0.000	0.000	0.081	fbmy8032_rel_clang14_221222.cza1_bee
0.000	99.820	0.096	0.081	0.002	nonzero	0.000	0.000	0.000	0.000	0.071	fbmy8032_rel_clang15_221222.cza1_bee
Delete response time histogram
256us	1ms	4ms	16ms	64ms	256ms	1s	4s	16s	gt	max	tag
0.000	99.780	0.133	0.084	0.003	nonzero	0.000	0.000	0.000	0.000	0.083	fbmy8028_rel_221222.cza1_bee
0.000	99.828	0.089	0.080	0.003	nonzero	0.000	0.000	0.000	0.000	0.081	fbmy8028_rel_221222.cza1ps0_bee
0.000	99.836	0.080	0.080	0.003	nonzero	0.000	0.000	0.000	0.000	0.080	fbmy8028_rel_clang14_221222.cza1_bee
0.000	99.815	0.102	0.081	0.002	nonzero	0.000	0.000	0.000	0.000	0.090	fbmy8028_rel_clang15_221222.cza1_bee
0.000	99.751	0.162	0.084	0.003	nonzero	0.000	0.000	0.000	0.000	0.068	fbmy8032_rel_221222.cza1_bee
0.000	99.784	0.131	0.082	0.003	nonzero	0.000	0.000	0.000	0.000	0.065	fbmy8032_rel_221222.cza1ps0_bee
0.000	99.777	0.137	0.082	0.003	nonzero	0.000	0.000	0.000	0.000	0.073	fbmy8032_rel_clang14_221222.cza1_bee
0.000	99.762	0.152	0.083	0.003	nonzero	0.000	0.000	0.000	0.000	0.084	fbmy8032_rel_clang15_221222.cza1_bee
qr100.L1
- qr100.L1: range queries with 100 insert/s per client
- Legend for results is here.
- Each entry lists the percentage of responses that fit in that bucket (slower than max time for previous bucket, faster than min time for next bucket).
Query response time histogram
256us	1ms	4ms	16ms	64ms	256ms	1s	4s	16s	gt	max	tag
5.684	61.043	33.273	nonzero	nonzero	0.000	0.000	0.000	0.000	0.000	0.028	fbmy8028_rel_221222.cza1_bee
6.346	60.352	33.301	0.001	nonzero	0.000	0.000	0.000	0.000	0.000	0.029	fbmy8028_rel_221222.cza1ps0_bee
3.223	64.211	32.566	nonzero	nonzero	0.000	0.000	0.000	0.000	0.000	0.031	fbmy8028_rel_clang14_221222.cza1_bee
4.463	63.100	32.437	nonzero	nonzero	0.000	0.000	0.000	0.000	0.000	0.029	fbmy8028_rel_clang15_221222.cza1_bee
8.397	72.433	19.170	nonzero	nonzero	0.000	0.000	0.000	0.000	0.000	0.024	fbmy8032_rel_221222.cza1_bee
9.377	76.696	13.927	nonzero	nonzero	0.000	0.000	0.000	0.000	0.000	0.032	fbmy8032_rel_221222.cza1ps0_bee
8.886	78.192	12.921	nonzero	nonzero	0.000	0.000	0.000	0.000	0.000	0.028	fbmy8032_rel_clang14_221222.cza1_bee
9.654	77.545	12.800	nonzero	nonzero	0.000	0.000	0.000	0.000	0.000	0.028	fbmy8032_rel_clang15_221222.cza1_bee
Insert response time histogram
256us	1ms	4ms	16ms	64ms	256ms	1s	4s	16s	gt	max	tag
0.000	0.000	99.083	0.889	0.028	0.000	0.000	0.000	0.000	0.000	0.017	fbmy8028_rel_221222.cza1_bee
0.000	0.000	99.611	0.333	0.056	0.000	0.000	0.000	0.000	0.000	0.017	fbmy8028_rel_221222.cza1ps0_bee
0.000	0.000	99.500	0.444	0.056	0.000	0.000	0.000	0.000	0.000	0.018	fbmy8028_rel_clang14_221222.cza1_bee
0.000	0.000	99.611	0.306	0.083	0.000	0.000	0.000	0.000	0.000	0.018	fbmy8028_rel_clang15_221222.cza1_bee
0.000	0.000	99.417	0.556	0.028	0.000	0.000	0.000	0.000	0.000	0.018	fbmy8032_rel_221222.cza1_bee
0.000	0.000	99.444	0.500	0.056	0.000	0.000	0.000	0.000	0.000	0.018	fbmy8032_rel_221222.cza1ps0_bee
0.000	0.000	99.306	0.667	0.028	0.000	0.000	0.000	0.000	0.000	0.017	fbmy8032_rel_clang14_221222.cza1_bee
0.000	0.000	99.667	0.278	0.056	0.000	0.000	0.000	0.000	0.000	0.018	fbmy8032_rel_clang15_221222.cza1_bee
Delete response time histogram
256us	1ms	4ms	16ms	64ms	256ms	1s	4s	16s	gt	max	tag
0.000	0.000	99.306	0.667	0.028	0.000	0.000	0.000	0.000	0.000	0.017	fbmy8028_rel_221222.cza1_bee
0.000	0.000	99.667	0.306	0.028	0.000	0.000	0.000	0.000	0.000	0.017	fbmy8028_rel_221222.cza1ps0_bee
0.000	0.000	99.556	0.389	0.056	0.000	0.000	0.000	0.000	0.000	0.017	fbmy8028_rel_clang14_221222.cza1_bee
0.000	0.000	99.722	0.222	0.056	0.000	0.000	0.000	0.000	0.000	0.018	fbmy8028_rel_clang15_221222.cza1_bee
0.000	0.000	99.556	0.417	0.028	0.000	0.000	0.000	0.000	0.000	0.018	fbmy8032_rel_221222.cza1_bee
0.000	0.000	99.528	0.444	0.028	0.000	0.000	0.000	0.000	0.000	0.018	fbmy8032_rel_221222.cza1ps0_bee
0.000	0.000	99.444	0.528	0.028	0.000	0.000	0.000	0.000	0.000	0.017	fbmy8032_rel_clang14_221222.cza1_bee
0.000	0.000	99.694	0.250	0.056	0.000	0.000	0.000	0.000	0.000	0.018	fbmy8032_rel_clang15_221222.cza1_bee
qp100.L2
- qp100.L2: point queries with 100 insert/s per client
- Legend for results is here.
- Each entry lists the percentage of responses that fit in that bucket (slower than max time for previous bucket, faster than min time for next bucket).
Query response time histogram
256us	1ms	4ms	16ms	64ms	256ms	1s	4s	16s	gt	max	tag
nonzero	99.984	0.014	0.001	0.000	0.000	0.000	0.000	0.000	0.000	0.010	fbmy8028_rel_221222.cza1_bee
0.003	99.994	0.003	nonzero	0.000	0.000	0.000	0.000	0.000	0.000	0.005	fbmy8028_rel_221222.cza1ps0_bee
0.000	99.992	0.007	0.001	0.000	0.000	0.000	0.000	0.000	0.000	0.010	fbmy8028_rel_clang14_221222.cza1_bee
nonzero	99.991	0.008	0.001	0.000	0.000	0.000	0.000	0.000	0.000	0.010	fbmy8028_rel_clang15_221222.cza1_bee
nonzero	99.991	0.008	0.002	0.000	0.000	0.000	0.000	0.000	0.000	0.010	fbmy8032_rel_221222.cza1_bee
nonzero	99.992	0.006	0.002	0.000	0.000	0.000	0.000	0.000	0.000	0.010	fbmy8032_rel_221222.cza1ps0_bee
0.000	99.988	0.011	0.001	0.000	0.000	0.000	0.000	0.000	0.000	0.010	fbmy8032_rel_clang14_221222.cza1_bee
0.000	99.992	0.006	0.002	0.000	0.000	0.000	0.000	0.000	0.000	0.010	fbmy8032_rel_clang15_221222.cza1_bee
Insert response time histogram
256us	1ms	4ms	16ms	64ms	256ms	1s	4s	16s	gt	max	tag
0.000	0.000	99.694	0.278	0.028	0.000	0.000	0.000	0.000	0.000	0.018	fbmy8028_rel_221222.cza1_bee
0.000	0.000	99.417	0.500	0.083	0.000	0.000	0.000	0.000	0.000	0.017	fbmy8028_rel_221222.cza1ps0_bee
0.000	0.000	99.417	0.528	0.056	0.000	0.000	0.000	0.000	0.000	0.017	fbmy8028_rel_clang14_221222.cza1_bee
0.000	0.000	99.417	0.528	0.056	0.000	0.000	0.000	0.000	0.000	0.017	fbmy8028_rel_clang15_221222.cza1_bee
0.000	0.000	99.250	0.722	0.028	0.000	0.000	0.000	0.000	0.000	0.017	fbmy8032_rel_221222.cza1_bee
0.000	0.000	99.472	0.500	0.028	0.000	0.000	0.000	0.000	0.000	0.018	fbmy8032_rel_221222.cza1ps0_bee
0.000	0.000	99.583	0.333	0.083	0.000	0.000	0.000	0.000	0.000	0.017	fbmy8032_rel_clang14_221222.cza1_bee
0.000	0.000	99.361	0.583	0.056	0.000	0.000	0.000	0.000	0.000	0.017	fbmy8032_rel_clang15_221222.cza1_bee
Delete response time histogram
256us	1ms	4ms	16ms	64ms	256ms	1s	4s	16s	gt	max	tag
0.000	0.000	99.806	0.167	0.028	0.000	0.000	0.000	0.000	0.000	0.017	fbmy8028_rel_221222.cza1_bee
0.000	0.000	99.556	0.389	0.056	0.000	0.000	0.000	0.000	0.000	0.017	fbmy8028_rel_221222.cza1ps0_bee
0.000	0.000	99.528	0.444	0.028	0.000	0.000	0.000	0.000	0.000	0.017	fbmy8028_rel_clang14_221222.cza1_bee
0.000	0.000	99.528	0.417	0.056	0.000	0.000	0.000	0.000	0.000	0.017	fbmy8028_rel_clang15_221222.cza1_bee
0.000	0.000	99.444	0.528	0.028	0.000	0.000	0.000	0.000	0.000	0.017	fbmy8032_rel_221222.cza1_bee
0.000	0.000	99.611	0.389	0.000	0.000	0.000	0.000	0.000	0.000	0.009	fbmy8032_rel_221222.cza1ps0_bee
0.000	0.000	99.667	0.250	0.083	0.000	0.000	0.000	0.000	0.000	0.017	fbmy8032_rel_clang14_221222.cza1_bee
0.000	0.000	99.472	0.472	0.056	0.000	0.000	0.000	0.000	0.000	0.017	fbmy8032_rel_clang15_221222.cza1_bee
qr500.L3
- qr500.L3: range queries with 500 insert/s per client
- Legend for results is here.
- Each entry lists the percentage of responses that fit in that bucket (slower than max time for previous bucket, faster than min time for next bucket).
Query response time histogram
256us	1ms	4ms	16ms	64ms	256ms	1s	4s	16s	gt	max	tag
6.299	82.901	10.800	nonzero	nonzero	0.000	0.000	0.000	0.000	0.000	0.031	fbmy8028_rel_221222.cza1_bee
10.338	82.191	7.432	0.040	nonzero	0.000	0.000	0.000	0.000	0.000	0.030	fbmy8028_rel_221222.cza1ps0_bee
4.929	83.337	11.734	nonzero	nonzero	0.000	0.000	0.000	0.000	0.000	0.029	fbmy8028_rel_clang14_221222.cza1_bee
8.201	82.772	9.016	0.011	nonzero	0.000	0.000	0.000	0.000	0.000	0.031	fbmy8028_rel_clang15_221222.cza1_bee
8.304	79.883	11.812	nonzero	nonzero	0.000	0.000	0.000	0.000	0.000	0.033	fbmy8032_rel_221222.cza1_bee
13.296	65.527	21.177	nonzero	nonzero	0.000	0.000	0.000	0.000	0.000	0.028	fbmy8032_rel_221222.cza1ps0_bee
6.561	69.141	24.298	nonzero	nonzero	0.000	0.000	0.000	0.000	0.000	0.035	fbmy8032_rel_clang14_221222.cza1_bee
6.663	68.226	25.110	0.001	nonzero	0.000	0.000	0.000	0.000	0.000	0.030	fbmy8032_rel_clang15_221222.cza1_bee
Insert response time histogram
256us	1ms	4ms	16ms	64ms	256ms	1s	4s	16s	gt	max	tag
0.000	0.000	99.689	0.228	0.083	0.000	0.000	0.000	0.000	0.000	0.018	fbmy8028_rel_221222.cza1_bee
0.000	0.000	99.622	0.289	0.089	0.000	0.000	0.000	0.000	0.000	0.025	fbmy8028_rel_221222.cza1ps0_bee
0.000	0.000	99.506	0.417	0.078	0.000	0.000	0.000	0.000	0.000	0.018	fbmy8028_rel_clang14_221222.cza1_bee
0.000	0.000	99.733	0.183	0.083	0.000	0.000	0.000	0.000	0.000	0.018	fbmy8028_rel_clang15_221222.cza1_bee
0.000	0.000	99.617	0.300	0.083	0.000	0.000	0.000	0.000	0.000	0.021	fbmy8032_rel_221222.cza1_bee
0.000	0.000	99.567	0.350	0.083	0.000	0.000	0.000	0.000	0.000	0.018	fbmy8032_rel_221222.cza1ps0_bee
0.000	0.000	99.511	0.417	0.072	0.000	0.000	0.000	0.000	0.000	0.018	fbmy8032_rel_clang14_221222.cza1_bee
0.000	0.000	99.706	0.206	0.089	0.000	0.000	0.000	0.000	0.000	0.018	fbmy8032_rel_clang15_221222.cza1_bee
Delete response time histogram
256us	1ms	4ms	16ms	64ms	256ms	1s	4s	16s	gt	max	tag
0.000	0.000	99.711	0.211	0.078	0.000	0.000	0.000	0.000	0.000	0.018	fbmy8028_rel_221222.cza1_bee
0.000	0.000	99.650	0.267	0.083	0.000	0.000	0.000	0.000	0.000	0.025	fbmy8028_rel_221222.cza1ps0_bee
0.000	0.000	99.567	0.356	0.078	0.000	0.000	0.000	0.000	0.000	0.018	fbmy8028_rel_clang14_221222.cza1_bee
0.000	0.000	99.767	0.161	0.072	0.000	0.000	0.000	0.000	0.000	0.018	fbmy8028_rel_clang15_221222.cza1_bee
0.000	0.000	99.689	0.233	0.078	0.000	0.000	0.000	0.000	0.000	0.022	fbmy8032_rel_221222.cza1_bee
0.000	0.000	99.556	0.350	0.094	0.000	0.000	0.000	0.000	0.000	0.039	fbmy8032_rel_221222.cza1ps0_bee
0.000	0.000	99.567	0.378	0.056	0.000	0.000	0.000	0.000	0.000	0.018	fbmy8032_rel_clang14_221222.cza1_bee
0.000	0.000	99.750	0.178	0.072	0.000	0.000	0.000	0.000	0.000	0.018	fbmy8032_rel_clang15_221222.cza1_bee
qp500.L4
- qp500.L4: point queries with 500 insert/s per client
- Legend for results is here.
- Each entry lists the percentage of responses that fit in that bucket (slower than max time for previous bucket, faster than min time for next bucket).
Query response time histogram
256us	1ms	4ms	16ms	64ms	256ms	1s	4s	16s	gt	max	tag
0.002	99.993	0.005	nonzero	0.000	0.000	0.000	0.000	0.000	0.000	0.010	fbmy8028_rel_221222.cza1_bee
0.003	99.992	0.005	nonzero	0.000	0.000	0.000	0.000	0.000	0.000	0.005	fbmy8028_rel_221222.cza1ps0_bee
0.002	99.991	0.007	0.000	0.000	0.000	0.000	0.000	0.000	0.000	0.003	fbmy8028_rel_clang14_221222.cza1_bee
0.001	99.994	0.006	0.000	0.000	0.000	0.000	0.000	0.000	0.000	0.003	fbmy8028_rel_clang15_221222.cza1_bee
0.000	99.993	0.007	0.000	0.000	0.000	0.000	0.000	0.000	0.000	0.003	fbmy8032_rel_221222.cza1_bee
nonzero	99.994	0.006	0.000	0.000	0.000	0.000	0.000	0.000	0.000	0.003	fbmy8032_rel_221222.cza1ps0_bee
0.000	99.995	0.005	nonzero	0.000	0.000	0.000	0.000	0.000	0.000	0.007	fbmy8032_rel_clang14_221222.cza1_bee
0.000	99.994	0.006	0.000	0.000	0.000	0.000	0.000	0.000	0.000	0.003	fbmy8032_rel_clang15_221222.cza1_bee
Insert response time histogram
256us	1ms	4ms	16ms	64ms	256ms	1s	4s	16s	gt	max	tag
0.000	0.000	99.661	0.250	0.089	0.000	0.000	0.000	0.000	0.000	0.019	fbmy8028_rel_221222.cza1_bee
0.000	0.000	99.378	0.539	0.083	0.000	0.000	0.000	0.000	0.000	0.018	fbmy8028_rel_221222.cza1ps0_bee
0.000	0.000	99.544	0.372	0.083	0.000	0.000	0.000	0.000	0.000	0.018	fbmy8028_rel_clang14_221222.cza1_bee
0.000	0.000	99.589	0.328	0.083	0.000	0.000	0.000	0.000	0.000	0.018	fbmy8028_rel_clang15_221222.cza1_bee
0.000	0.000	99.500	0.411	0.089	0.000	0.000	0.000	0.000	0.000	0.018	fbmy8032_rel_221222.cza1_bee
0.000	0.000	99.500	0.411	0.089	0.000	0.000	0.000	0.000	0.000	0.018	fbmy8032_rel_221222.cza1ps0_bee
0.000	0.000	99.478	0.433	0.089	0.000	0.000	0.000	0.000	0.000	0.018	fbmy8032_rel_clang14_221222.cza1_bee
0.000	0.000	99.439	0.483	0.078	0.000	0.000	0.000	0.000	0.000	0.018	fbmy8032_rel_clang15_221222.cza1_bee
Delete response time histogram
256us	1ms	4ms	16ms	64ms	256ms	1s	4s	16s	gt	max	tag
0.000	0.000	99.717	0.200	0.083	0.000	0.000	0.000	0.000	0.000	0.019	fbmy8028_rel_221222.cza1_bee
0.000	0.000	99.444	0.483	0.072	0.000	0.000	0.000	0.000	0.000	0.018	fbmy8028_rel_221222.cza1ps0_bee
0.000	0.000	99.606	0.311	0.083	0.000	0.000	0.000	0.000	0.000	0.018	fbmy8028_rel_clang14_221222.cza1_bee
0.000	0.000	99.600	0.322	0.078	0.000	0.000	0.000	0.000	0.000	0.018	fbmy8028_rel_clang15_221222.cza1_bee
0.000	0.000	99.528	0.389	0.083	0.000	0.000	0.000	0.000	0.000	0.018	fbmy8032_rel_221222.cza1_bee
0.000	0.000	99.567	0.367	0.067	0.000	0.000	0.000	0.000	0.000	0.022	fbmy8032_rel_221222.cza1ps0_bee
0.000	0.000	99.500	0.411	0.089	0.000	0.000	0.000	0.000	0.000	0.018	fbmy8032_rel_clang14_221222.cza1_bee
0.000	0.000	99.461	0.472	0.067	0.000	0.000	0.000	0.000	0.000	0.023	fbmy8032_rel_clang15_221222.cza1_bee
qr1000.L5
- qr1000.L5: range queries with 1000 insert/s per client
- Legend for results is here.
- Each entry lists the percentage of responses that fit in that bucket (slower than max time for previous bucket, faster than min time for next bucket).
Query response time histogram
256us	1ms	4ms	16ms	64ms	256ms	1s	4s	16s	gt	max	tag
6.434	75.407	18.158	0.001	nonzero	0.000	0.000	0.000	0.000	0.000	0.031	fbmy8028_rel_221222.cza1_bee
8.888	70.183	20.923	0.006	nonzero	0.000	0.000	0.000	0.000	0.000	0.034	fbmy8028_rel_221222.cza1ps0_bee
4.849	77.392	17.748	0.011	nonzero	0.000	0.000	0.000	0.000	0.000	0.041	fbmy8028_rel_clang14_221222.cza1_bee
6.380	74.081	19.538	0.001	nonzero	0.000	0.000	0.000	0.000	0.000	0.036	fbmy8028_rel_clang15_221222.cza1_bee
7.520	70.915	21.558	0.007	nonzero	0.000	0.000	0.000	0.000	0.000	0.032	fbmy8032_rel_221222.cza1_bee
14.032	65.857	20.085	0.026	nonzero	0.000	0.000	0.000	0.000	0.000	0.032	fbmy8032_rel_221222.cza1ps0_bee
6.871	71.539	21.069	0.520	0.001	0.000	0.000	0.000	0.000	0.000	0.032	fbmy8032_rel_clang14_221222.cza1_bee
7.410	67.796	24.774	0.019	0.001	0.000	0.000	0.000	0.000	0.000	0.035	fbmy8032_rel_clang15_221222.cza1_bee
Insert response time histogram
256us	1ms	4ms	16ms	64ms	256ms	1s	4s	16s	gt	max	tag
0.000	0.000	99.436	0.497	0.067	0.000	0.000	0.000	0.000	0.000	0.050	fbmy8028_rel_221222.cza1_bee
0.000	0.000	99.575	0.350	0.075	0.000	0.000	0.000	0.000	0.000	0.048	fbmy8028_rel_221222.cza1ps0_bee
0.000	0.000	99.583	0.342	0.075	0.000	0.000	0.000	0.000	0.000	0.049	fbmy8028_rel_clang14_221222.cza1_bee
0.000	0.000	99.606	0.308	0.086	0.000	0.000	0.000	0.000	0.000	0.049	fbmy8028_rel_clang15_221222.cza1_bee
0.000	0.000	99.544	0.378	0.078	0.000	0.000	0.000	0.000	0.000	0.050	fbmy8032_rel_221222.cza1_bee
0.000	0.000	99.567	0.356	0.078	0.000	0.000	0.000	0.000	0.000	0.033	fbmy8032_rel_221222.cza1ps0_bee
0.000	0.000	99.531	0.389	0.081	0.000	0.000	0.000	0.000	0.000	0.050	fbmy8032_rel_clang14_221222.cza1_bee
0.000	0.000	99.722	0.192	0.086	0.000	0.000	0.000	0.000	0.000	0.042	fbmy8032_rel_clang15_221222.cza1_bee
Delete response time histogram
256us	1ms	4ms	16ms	64ms	256ms	1s	4s	16s	gt	max	tag
0.000	0.000	99.436	0.492	0.069	0.003	0.000	0.000	0.000	0.000	0.065	fbmy8028_rel_221222.cza1_bee
0.000	0.000	99.594	0.333	0.072	0.000	0.000	0.000	0.000	0.000	0.062	fbmy8028_rel_221222.cza1ps0_bee
0.000	0.000	99.592	0.333	0.072	0.003	0.000	0.000	0.000	0.000	0.068	fbmy8028_rel_clang14_221222.cza1_bee
0.000	0.000	99.642	0.281	0.078	0.000	0.000	0.000	0.000	0.000	0.063	fbmy8028_rel_clang15_221222.cza1_bee
0.000	0.000	99.564	0.361	0.075	0.000	0.000	0.000	0.000	0.000	0.042	fbmy8032_rel_221222.cza1_bee
0.000	0.000	99.592	0.336	0.072	0.000	0.000	0.000	0.000	0.000	0.047	fbmy8032_rel_221222.cza1ps0_bee
0.000	0.000	99.586	0.336	0.078	0.000	0.000	0.000	0.000	0.000	0.041	fbmy8032_rel_clang14_221222.cza1_bee
0.000	0.000	99.728	0.186	0.086	0.000	0.000	0.000	0.000	0.000	0.034	fbmy8032_rel_clang15_221222.cza1_bee
qp1000.L6
- qp1000.L6: point queries with 1000 insert/s per client
- Legend for results is here.
- Each entry lists the percentage of responses that fit in that bucket (slower than max time for previous bucket, faster than min time for next bucket).
Query response time histogram
256us	1ms	4ms	16ms	64ms	256ms	1s	4s	16s	gt	max	tag
nonzero	99.988	0.011	0.001	0.000	0.000	0.000	0.000	0.000	0.000	0.007	fbmy8028_rel_221222.cza1_bee
0.003	99.987	0.010	0.000	0.000	0.000	0.000	0.000	0.000	0.000	0.003	fbmy8028_rel_221222.cza1ps0_bee
0.000	99.991	0.009	nonzero	0.000	0.000	0.000	0.000	0.000	0.000	0.006	fbmy8028_rel_clang14_221222.cza1_bee
0.000	99.991	0.009	nonzero	0.000	0.000	0.000	0.000	0.000	0.000	0.006	fbmy8028_rel_clang15_221222.cza1_bee
nonzero	99.990	0.010	nonzero	0.000	0.000	0.000	0.000	0.000	0.000	0.005	fbmy8032_rel_221222.cza1_bee
0.002	99.991	0.008	nonzero	0.000	0.000	0.000	0.000	0.000	0.000	0.005	fbmy8032_rel_221222.cza1ps0_bee
0.000	99.991	0.009	nonzero	0.000	0.000	0.000	0.000	0.000	0.000	0.005	fbmy8032_rel_clang14_221222.cza1_bee
0.000	99.991	0.009	nonzero	0.000	0.000	0.000	0.000	0.000	0.000	0.005	fbmy8032_rel_clang15_221222.cza1_bee
Insert response time histogram
256us	1ms	4ms	16ms	64ms	256ms	1s	4s	16s	gt	max	tag
0.000	0.000	99.558	0.356	0.083	0.003	0.000	0.000	0.000	0.000	0.067	fbmy8028_rel_221222.cza1_bee
0.000	0.000	99.592	0.325	0.083	0.000	0.000	0.000	0.000	0.000	0.040	fbmy8028_rel_221222.cza1ps0_bee
0.000	0.000	99.842	0.075	0.083	0.000	0.000	0.000	0.000	0.000	0.064	fbmy8028_rel_clang14_221222.cza1_bee
0.000	0.000	99.547	0.367	0.086	0.000	0.000	0.000	0.000	0.000	0.042	fbmy8028_rel_clang15_221222.cza1_bee
0.000	0.000	99.531	0.392	0.078	0.000	0.000	0.000	0.000	0.000	0.056	fbmy8032_rel_221222.cza1_bee
0.000	0.000	99.447	0.481	0.072	0.000	0.000	0.000	0.000	0.000	0.051	fbmy8032_rel_221222.cza1ps0_bee
0.000	0.000	99.706	0.208	0.086	0.000	0.000	0.000	0.000	0.000	0.041	fbmy8032_rel_clang14_221222.cza1_bee
0.000	0.000	99.575	0.339	0.086	0.000	0.000	0.000	0.000	0.000	0.033	fbmy8032_rel_clang15_221222.cza1_bee
Delete response time histogram
256us	1ms	4ms	16ms	64ms	256ms	1s	4s	16s	gt	max	tag
0.000	0.000	99.592	0.325	0.083	0.000	0.000	0.000	0.000	0.000	0.052	fbmy8028_rel_221222.cza1_bee
0.000	0.000	99.633	0.283	0.083	0.000	0.000	0.000	0.000	0.000	0.053	fbmy8028_rel_221222.cza1ps0_bee
0.000	0.000	99.858	0.064	0.078	0.000	0.000	0.000	0.000	0.000	0.050	fbmy8028_rel_clang14_221222.cza1_bee
0.000	0.000	99.594	0.322	0.083	0.000	0.000	0.000	0.000	0.000	0.056	fbmy8028_rel_clang15_221222.cza1_bee
0.000	0.000	99.581	0.344	0.075	0.000	0.000	0.000	0.000	0.000	0.042	fbmy8032_rel_221222.cza1_bee
0.000	0.000	99.514	0.414	0.072	0.000	0.000	0.000	0.000	0.000	0.043	fbmy8032_rel_221222.cza1ps0_bee
0.000	0.000	99.742	0.178	0.081	0.000	0.000	0.000	0.000	0.000	0.055	fbmy8032_rel_clang14_221222.cza1_bee
0.000	0.000	99.581	0.336	0.083	0.000	0.000	0.000	0.000	0.000	0.047	fbmy8032_rel_clang15_221222.cza1_bee