Introduction
This is a report for the insert benchmark with 60M docs and 1 client(s). It is generated by scripts (bash, awk, sed) and Tufte might not be impressed. An overview of the insert benchmark is here and a short update is here. Below, by DBMS, I mean DBMS+version.config. An example is my8020.c10b40 where my means MySQL, 8020 is version 8.0.20 and c10b40 is the name for the configuration file.
The test server has a Beelink SER7 with 8 AMD cores, 32G RAM and an NVMe SSD. It is described here. The benchmark was run with 1 client and there were 1 or 3 connections per client (1 for queries or inserts without rate limits, 1+1 for rate limited inserts+deletes). It uses 1 table. It loads 60M rows per table without secondary indexes, creates 3 secondary indexes per table, then inserts 50m+50m rows per table with a delete per insert to avoid growing the table. It then does 6 read+write tests for 1800s each that do queries as fast as possible with 100,100,500,500,1000,1000 inserts/s and the same for deletes/s per client concurrent with the queries. The database is cached in memory. Clients and the DBMS share one server. The per-database configs are in the per-database subdirectories here.
The tested DBMS are:
- fbmy8028_rel_20220829_752.cza1_ser7 - MyRocks 8.0.28 from code as of 2022-08-29 at git hash a35c8dfeab, RocksDB 7.5.2, cza1_ser7 config
- fbmy8028_rel_20230129_754.cza1_ser7 - MyRocks 8.0.28 from code as of 2023-01-29 at git hash 4d3d44a0459, RocksDB 7.5.4, cza1_ser7 config
- fbmy8028_rel_20230502_810.cza1_ser7 - MyRocks 8.0.28 from code as of 2023-05-02 at git hash d1ca8b276d, RocksDB 8.1.0, cza1_ser7 config
- fbmy8028_rel_20230523_821.cza1_ser7 - MyRocks 8.0.28 from code as of 2023-05-23 at git hash b08cc536f1, RocksDB 8.2.1, cza1_ser7 config
- fbmy8028_rel_20230619_831.cza1_ser7 - MyRocks 8.0.28 from code as of 2023-06-19 at git hash 6164cf0274, RocksDB 8.3.1, cza1_ser7 config
- fbmy8028_rel_20230629_831.cza1_ser7 - MyRocks 8.0.28 from code as of 2023-06-29 at git hash ab522f6df7c, RocksDB 8.3.1, cza1_ser7 config
- fbmy8028_rel_221222.cza1_ser7 - MyRocks 8.0.28 from code as of 2023-12-22 at git hash 2ad105fc, RocksDB 8.7.0 at git hash 29005f0b, cza1_ser7 config
- fbmy8032_rel_221222.cza1_ser7 - MyRocks 8.0.32 from code as of 2023-12-22 at git hash 76707b44, RocksDB 8.7.0 at git hash 29005f0b, cza1_ser7 config
Contents
- Summary
- l.i0: load without secondary indexes
- l.x: create secondary indexes
- l.i1: continue load after secondary indexes created with 50 inserts per transaction
- l.i2: continue load after secondary indexes created with 5 inserts per transaction
- qr100.L1: range queries with 100 insert/s per client
- qp100.L2: point queries with 100 insert/s per client
- qr500.L3: range queries with 500 insert/s per client
- qp500.L4: point queries with 500 insert/s per client
- qr1000.L5: range queries with 1000 insert/s per client
- qp1000.L6: point queries with 1000 insert/s per client
Summary
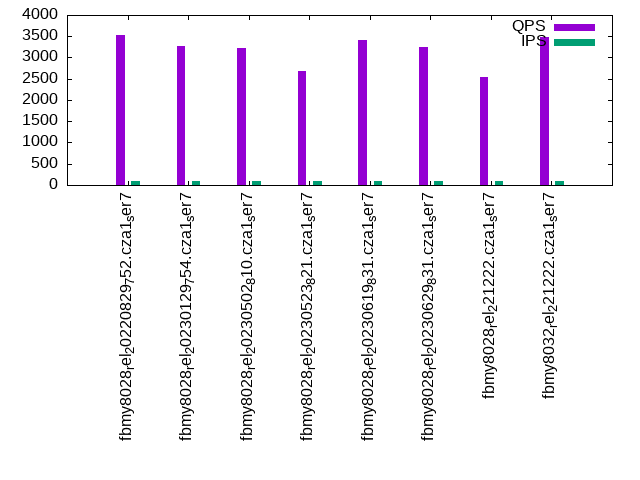
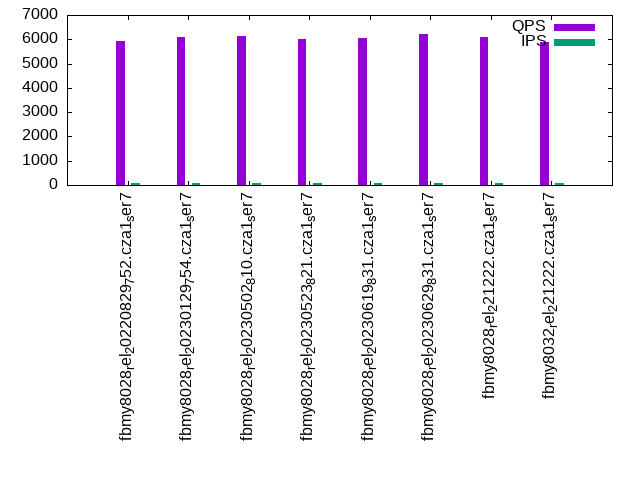
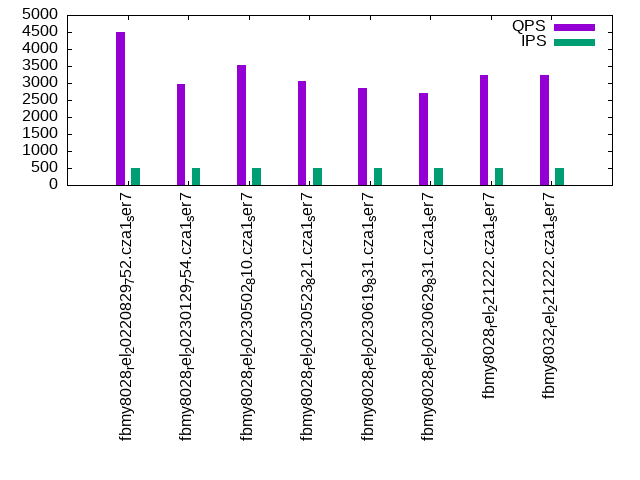
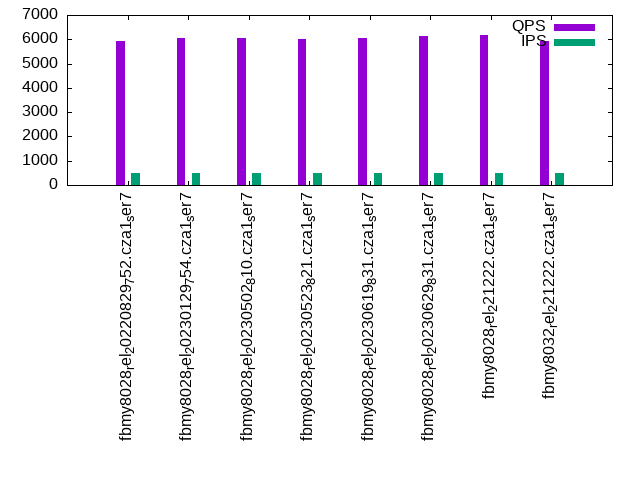
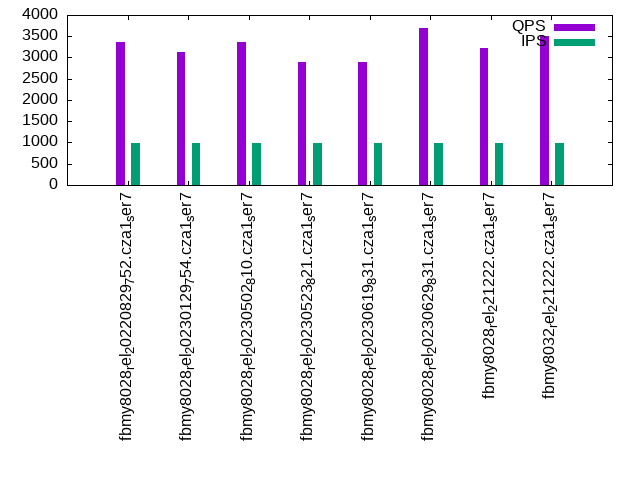
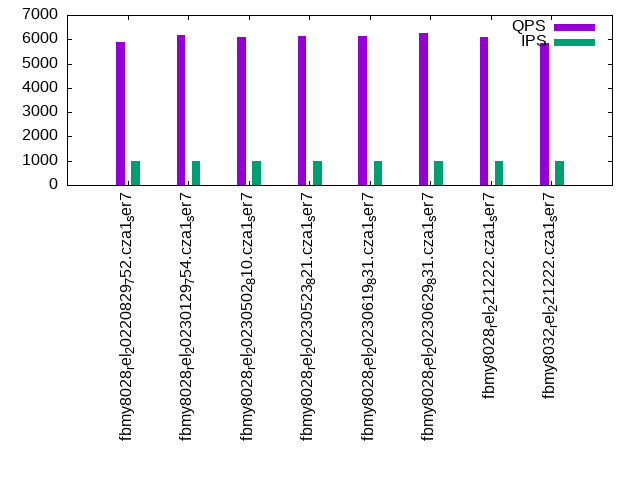
The numbers are inserts/s for l.i0, l.i1 and l.i2, indexed docs (or rows) /s for l.x and queries/s for qr100, qp100 thru qr1000, qp1000" The values are the average rate over the entire test for inserts (IPS) and queries (QPS). The range of values for IPS and QPS is split into 3 parts: bottom 25%, middle 50%, top 25%. Values in the bottom 25% have a red background, values in the top 25% have a green background and values in the middle have no color. A gray background is used for values that can be ignored because the DBMS did not sustain the target insert rate. Red backgrounds are not used when the minimum value is within 80% of the max value.
| dbms | l.i0 | l.x | l.i1 | l.i2 | qr100 | qp100 | qr500 | qp500 | qr1000 | qp1000 |
|---|---|---|---|---|---|---|---|---|---|---|
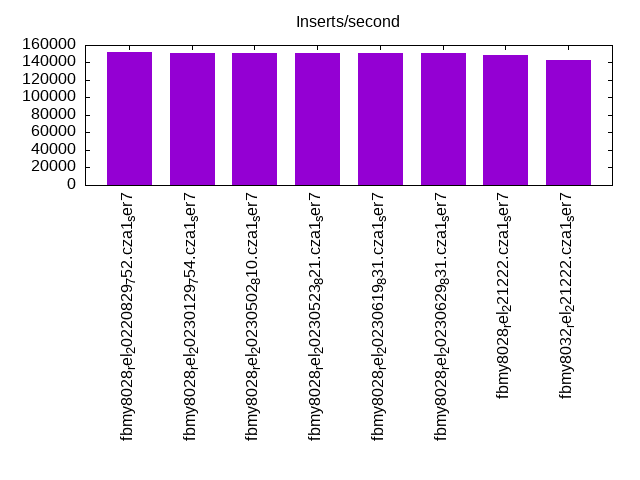
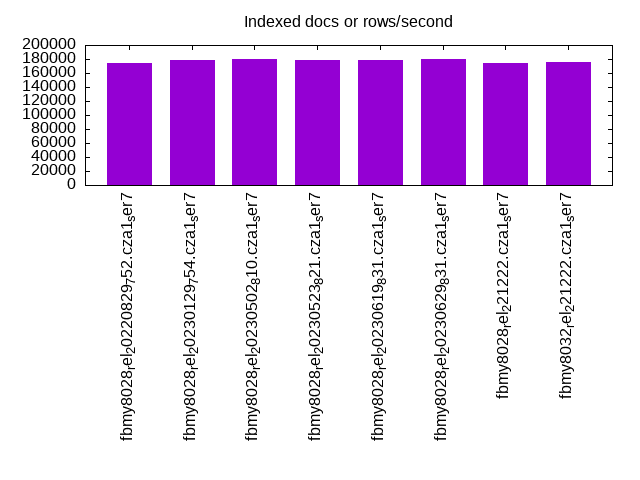
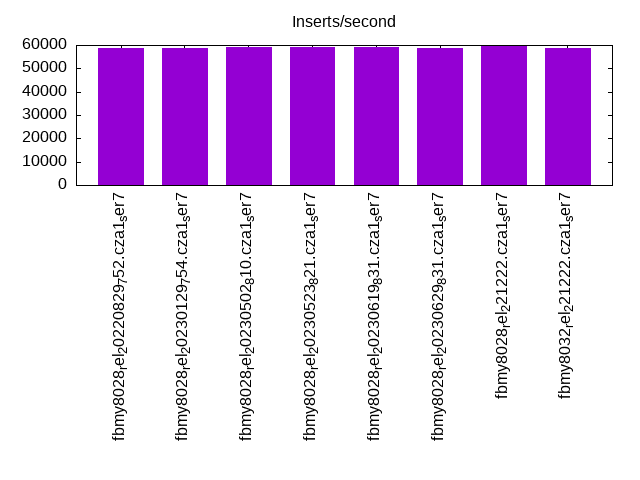
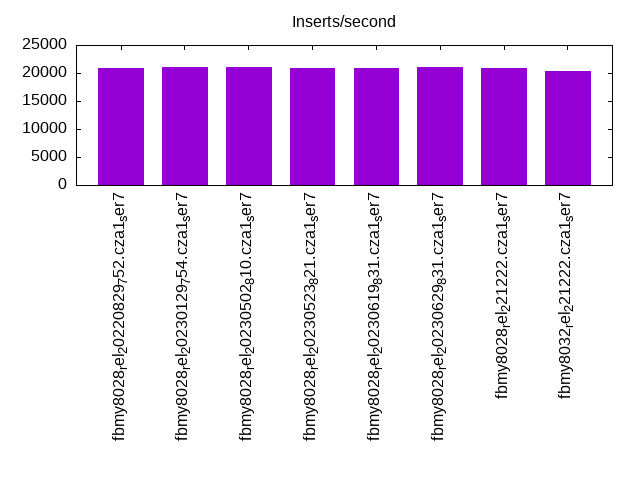
| fbmy8028_rel_20220829_752.cza1_ser7 | 151515 | 174419 | 58651 | 20964 | 3541 | 5945 | 4506 | 5937 | 3368 | 5898 |
| fbmy8028_rel_20230129_754.cza1_ser7 | 151134 | 178572 | 58737 | 21053 | 3268 | 6113 | 2960 | 6061 | 3131 | 6162 |
| fbmy8028_rel_20230502_810.cza1_ser7 | 150754 | 179641 | 59259 | 21097 | 3225 | 6118 | 3536 | 6047 | 3375 | 6103 |
| fbmy8028_rel_20230523_821.cza1_ser7 | 151134 | 178042 | 59172 | 20920 | 2683 | 6030 | 3059 | 6002 | 2888 | 6137 |
| fbmy8028_rel_20230619_831.cza1_ser7 | 150754 | 178042 | 59084 | 20964 | 3408 | 6064 | 2852 | 6035 | 2890 | 6124 |
| fbmy8028_rel_20230629_831.cza1_ser7 | 150376 | 180180 | 58737 | 21142 | 3244 | 6201 | 2696 | 6151 | 3693 | 6254 |
| fbmy8028_rel_221222.cza1_ser7 | 148148 | 174927 | 59524 | 20877 | 2536 | 6086 | 3229 | 6158 | 3225 | 6101 |
| fbmy8032_rel_221222.cza1_ser7 | 143198 | 175953 | 58824 | 20284 | 3485 | 5903 | 3227 | 5909 | 3499 | 5865 |
This table has relative throughput, throughput for the DBMS relative to the DBMS in the first line, using the absolute throughput from the previous table. Values less than 0.95 have a yellow background. Values greater than 1.05 have a blue background.
| dbms | l.i0 | l.x | l.i1 | l.i2 | qr100 | qp100 | qr500 | qp500 | qr1000 | qp1000 |
|---|---|---|---|---|---|---|---|---|---|---|
| fbmy8028_rel_20220829_752.cza1_ser7 | 1.00 | 1.00 | 1.00 | 1.00 | 1.00 | 1.00 | 1.00 | 1.00 | 1.00 | 1.00 |
| fbmy8028_rel_20230129_754.cza1_ser7 | 1.00 | 1.02 | 1.00 | 1.00 | 0.92 | 1.03 | 0.66 | 1.02 | 0.93 | 1.04 |
| fbmy8028_rel_20230502_810.cza1_ser7 | 0.99 | 1.03 | 1.01 | 1.01 | 0.91 | 1.03 | 0.78 | 1.02 | 1.00 | 1.03 |
| fbmy8028_rel_20230523_821.cza1_ser7 | 1.00 | 1.02 | 1.01 | 1.00 | 0.76 | 1.01 | 0.68 | 1.01 | 0.86 | 1.04 |
| fbmy8028_rel_20230619_831.cza1_ser7 | 0.99 | 1.02 | 1.01 | 1.00 | 0.96 | 1.02 | 0.63 | 1.02 | 0.86 | 1.04 |
| fbmy8028_rel_20230629_831.cza1_ser7 | 0.99 | 1.03 | 1.00 | 1.01 | 0.92 | 1.04 | 0.60 | 1.04 | 1.10 | 1.06 |
| fbmy8028_rel_221222.cza1_ser7 | 0.98 | 1.00 | 1.01 | 1.00 | 0.72 | 1.02 | 0.72 | 1.04 | 0.96 | 1.03 |
| fbmy8032_rel_221222.cza1_ser7 | 0.95 | 1.01 | 1.00 | 0.97 | 0.98 | 0.99 | 0.72 | 1.00 | 1.04 | 0.99 |
This lists the average rate of inserts/s for the tests that do inserts concurrent with queries. For such tests the query rate is listed in the table above. The read+write tests are setup so that the insert rate should match the target rate every second. Cells that are not at least 95% of the target have a red background to indicate a failure to satisfy the target.
| dbms | qr100.L1 | qp100.L2 | qr500.L3 | qp500.L4 | qr1000.L5 | qp1000.L6 |
|---|---|---|---|---|---|---|
| fbmy8028_rel_20220829_752.cza1_ser7 | 100 | 100 | 499 | 499 | 998 | 998 |
| fbmy8028_rel_20230129_754.cza1_ser7 | 100 | 100 | 499 | 499 | 998 | 998 |
| fbmy8028_rel_20230502_810.cza1_ser7 | 100 | 100 | 499 | 499 | 998 | 998 |
| fbmy8028_rel_20230523_821.cza1_ser7 | 100 | 100 | 499 | 499 | 998 | 998 |
| fbmy8028_rel_20230619_831.cza1_ser7 | 100 | 100 | 499 | 499 | 998 | 998 |
| fbmy8028_rel_20230629_831.cza1_ser7 | 100 | 100 | 499 | 499 | 998 | 998 |
| fbmy8028_rel_221222.cza1_ser7 | 100 | 100 | 499 | 499 | 998 | 998 |
| fbmy8032_rel_221222.cza1_ser7 | 100 | 100 | 499 | 499 | 998 | 998 |
| target | 100 | 100 | 500 | 500 | 1000 | 1000 |
l.i0
l.i0: load without secondary indexes. Graphs for performance per 1-second interval are here.
Average throughput:
Insert response time histogram: each cell has the percentage of responses that take <= the time in the header and max is the max response time in seconds. For the max column values in the top 25% of the range have a red background and in the bottom 25% of the range have a green background. The red background is not used when the min value is within 80% of the max value.
| dbms | 256us | 1ms | 4ms | 16ms | 64ms | 256ms | 1s | 4s | 16s | gt | max |
|---|---|---|---|---|---|---|---|---|---|---|---|
| fbmy8028_rel_20220829_752.cza1_ser7 | 99.490 | 0.339 | 0.129 | 0.038 | 0.004 | 0.110 | |||||
| fbmy8028_rel_20230129_754.cza1_ser7 | 99.487 | 0.342 | 0.128 | 0.039 | 0.004 | 0.135 | |||||
| fbmy8028_rel_20230502_810.cza1_ser7 | 99.480 | 0.348 | 0.135 | 0.033 | 0.004 | 0.111 | |||||
| fbmy8028_rel_20230523_821.cza1_ser7 | 99.492 | 0.338 | 0.130 | 0.036 | 0.004 | 0.112 | |||||
| fbmy8028_rel_20230619_831.cza1_ser7 | 99.501 | 0.328 | 0.126 | 0.041 | 0.004 | 0.107 | |||||
| fbmy8028_rel_20230629_831.cza1_ser7 | 99.444 | 0.385 | 0.133 | 0.035 | 0.004 | 0.107 | |||||
| fbmy8028_rel_221222.cza1_ser7 | 99.444 | 0.385 | 0.129 | 0.039 | 0.004 | 0.120 | |||||
| fbmy8032_rel_221222.cza1_ser7 | 99.299 | 0.529 | 0.130 | 0.038 | 0.004 | 0.096 |
Performance metrics for the DBMS listed above. Some are normalized by throughput, others are not. Legend for results is here.
ips	qps	rps	rmbps	wps	wmbps	rpq	rkbpq	wpi	wkbpi	csps	cpups	cspq	cpupq	dbgb1	dbgb2	rss	maxop	p50	p99	tag
151515	0	0	0.0	95.4	32.9	0.000	0.000	0.001	0.222	16798	9.8	0.111	5	1.8	3.4	0.7	0.110	151738	130666	fbmy8028_rel_20220829_752.cza1_ser7
151134	0	0	0.0	94.7	32.8	0.000	0.000	0.001	0.223	16771	9.8	0.111	5	1.8	3.4	0.7	0.135	151436	130558	fbmy8028_rel_20230129_754.cza1_ser7
150754	0	0	0.0	94.8	32.9	0.000	0.000	0.001	0.223	16789	9.9	0.111	5	1.8	3.4	0.7	0.111	151734	129060	fbmy8028_rel_20230502_810.cza1_ser7
151134	0	0	0.0	94.6	32.9	0.000	0.000	0.001	0.223	16786	9.9	0.111	5	1.8	3.4	0.7	0.112	151828	128855	fbmy8028_rel_20230523_821.cza1_ser7
150754	0	0	0.0	94.4	32.7	0.000	0.000	0.001	0.222	16707	9.9	0.111	5	1.8	3.4	0.7	0.107	151136	130053	fbmy8028_rel_20230619_831.cza1_ser7
150376	0	0	0.0	95.4	32.7	0.000	0.000	0.001	0.223	16603	9.8	0.110	5	1.8	3.4	0.7	0.107	150835	128564	fbmy8028_rel_20230629_831.cza1_ser7
148148	0	0	0.0	94.1	32.3	0.000	0.000	0.001	0.223	16494	10.1	0.111	5	1.8	3.4	0.7	0.120	148839	128264	fbmy8028_rel_221222.cza1_ser7
143198	0	0	0.0	91.3	31.2	0.000	0.000	0.001	0.223	16232	10.6	0.113	6	1.8	3.4	0.7	0.096	144338	115223	fbmy8032_rel_221222.cza1_ser7
l.x
l.x: create secondary indexes.
Average throughput:
Performance metrics for the DBMS listed above. Some are normalized by throughput, others are not. Legend for results is here.
ips	qps	rps	rmbps	wps	wmbps	rpq	rkbpq	wpi	wkbpi	csps	cpups	cspq	cpupq	dbgb1	dbgb2	rss	maxop	p50	p99	tag
174419	0	0	0.0	69.0	26.9	0.000	0.000	0.000	0.158	385	5.8	0.002	3	4.0	5.6	4.6	0.002	NA	NA	fbmy8028_rel_20220829_752.cza1_ser7
178572	0	0	0.0	69.1	27.7	0.000	0.000	0.000	0.159	375	5.8	0.002	3	4.0	5.6	4.6	0.009	NA	NA	fbmy8028_rel_20230129_754.cza1_ser7
179641	0	0	0.0	69.2	27.7	0.000	0.000	0.000	0.158	368	5.8	0.002	3	4.0	5.6	4.6	0.008	NA	NA	fbmy8028_rel_20230502_810.cza1_ser7
178042	0	0	0.0	69.1	27.6	0.000	0.000	0.000	0.159	369	5.8	0.002	3	4.0	5.6	4.6	0.009	NA	NA	fbmy8028_rel_20230523_821.cza1_ser7
178042	0	0	0.0	69.1	27.6	0.000	0.000	0.000	0.159	381	5.8	0.002	3	4.0	5.6	4.6	0.002	NA	NA	fbmy8028_rel_20230619_831.cza1_ser7
180180	0	0	0.0	69.4	27.8	0.000	0.000	0.000	0.158	360	5.8	0.002	3	4.0	5.6	4.6	0.002	NA	NA	fbmy8028_rel_20230629_831.cza1_ser7
174927	0	0	0.0	67.4	27.0	0.000	0.000	0.000	0.158	352	5.8	0.002	3	4.0	5.6	4.6	0.002	NA	NA	fbmy8028_rel_221222.cza1_ser7
175953	0	0	0.0	68.0	27.2	0.000	0.000	0.000	0.158	565	5.8	0.003	3	4.0	5.6	4.6	0.008	NA	NA	fbmy8032_rel_221222.cza1_ser7
l.i1
l.i1: continue load after secondary indexes created with 50 inserts per transaction. Graphs for performance per 1-second interval are here.
Average throughput:
Insert response time histogram: each cell has the percentage of responses that take <= the time in the header and max is the max response time in seconds. For the max column values in the top 25% of the range have a red background and in the bottom 25% of the range have a green background. The red background is not used when the min value is within 80% of the max value.
| dbms | 256us | 1ms | 4ms | 16ms | 64ms | 256ms | 1s | 4s | 16s | gt | max |
|---|---|---|---|---|---|---|---|---|---|---|---|
| fbmy8028_rel_20220829_752.cza1_ser7 | 96.677 | 3.129 | 0.168 | 0.021 | 0.004 | 0.123 | |||||
| fbmy8028_rel_20230129_754.cza1_ser7 | 96.949 | 2.859 | 0.168 | 0.020 | 0.004 | 0.107 | |||||
| fbmy8028_rel_20230502_810.cza1_ser7 | 97.836 | 1.970 | 0.167 | 0.024 | 0.004 | 0.127 | |||||
| fbmy8028_rel_20230523_821.cza1_ser7 | 97.457 | 2.348 | 0.166 | 0.025 | 0.004 | 0.125 | |||||
| fbmy8028_rel_20230619_831.cza1_ser7 | 97.484 | 2.321 | 0.166 | 0.025 | 0.004 | 0.128 | |||||
| fbmy8028_rel_20230629_831.cza1_ser7 | 97.596 | 2.210 | 0.165 | 0.025 | 0.004 | 0.115 | |||||
| fbmy8028_rel_221222.cza1_ser7 | 97.193 | 2.614 | 0.167 | 0.023 | 0.004 | 0.108 | |||||
| fbmy8032_rel_221222.cza1_ser7 | 97.305 | 2.501 | 0.169 | 0.021 | 0.004 | 0.101 |
Delete response time histogram: each cell has the percentage of responses that take <= the time in the header and max is the max response time in seconds. For the max column values in the top 25% of the range have a red background and in the bottom 25% of the range have a green background. The red background is not used when the min value is within 80% of the max value.
| dbms | 256us | 1ms | 4ms | 16ms | 64ms | 256ms | 1s | 4s | 16s | gt | max |
|---|---|---|---|---|---|---|---|---|---|---|---|
| fbmy8028_rel_20220829_752.cza1_ser7 | 97.172 | 2.626 | 0.168 | 0.030 | 0.004 | 0.121 | |||||
| fbmy8028_rel_20230129_754.cza1_ser7 | 97.560 | 2.243 | 0.166 | 0.028 | 0.004 | 0.119 | |||||
| fbmy8028_rel_20230502_810.cza1_ser7 | 98.266 | 1.535 | 0.163 | 0.032 | 0.004 | 0.115 | |||||
| fbmy8028_rel_20230523_821.cza1_ser7 | 97.944 | 1.856 | 0.163 | 0.033 | 0.004 | 0.114 | |||||
| fbmy8028_rel_20230619_831.cza1_ser7 | 97.921 | 1.880 | 0.161 | 0.034 | 0.004 | 0.119 | |||||
| fbmy8028_rel_20230629_831.cza1_ser7 | 97.805 | 1.993 | 0.162 | 0.035 | 0.004 | 0.110 | |||||
| fbmy8028_rel_221222.cza1_ser7 | 97.655 | 2.143 | 0.162 | 0.036 | 0.004 | 0.114 | |||||
| fbmy8032_rel_221222.cza1_ser7 | 97.799 | 2.000 | 0.165 | 0.032 | 0.004 | 0.094 |
Performance metrics for the DBMS listed above. Some are normalized by throughput, others are not. Legend for results is here.
ips	qps	rps	rmbps	wps	wmbps	rpq	rkbpq	wpi	wkbpi	csps	cpups	cspq	cpupq	dbgb1	dbgb2	rss	maxop	p50	p99	tag
58651	0	26	3.3	352.1	139.3	0.000	0.057	0.006	2.432	29002	24.3	0.494	33	5.4	6.0	8.7	0.123	58935	48946	fbmy8028_rel_20220829_752.cza1_ser7
58737	0	26	3.3	350.3	138.9	0.000	0.057	0.006	2.421	29068	24.6	0.495	34	5.6	6.2	8.7	0.107	59086	49596	fbmy8028_rel_20230129_754.cza1_ser7
59259	0	27	3.3	295.3	114.0	0.000	0.058	0.005	1.969	28417	23.0	0.480	31	4.7	5.3	6.5	0.127	59535	49984	fbmy8028_rel_20230502_810.cza1_ser7
59172	0	27	3.3	299.2	115.7	0.000	0.057	0.005	2.002	28405	23.0	0.480	31	4.8	5.4	6.6	0.125	59361	50195	fbmy8028_rel_20230523_821.cza1_ser7
59084	0	27	3.3	294.1	114.0	0.000	0.057	0.005	1.976	28277	23.6	0.479	32	4.9	5.5	6.7	0.128	59386	48498	fbmy8028_rel_20230619_831.cza1_ser7
58737	0	26	3.3	288.7	112.2	0.000	0.057	0.005	1.956	28404	23.2	0.484	32	4.7	5.3	6.7	0.115	59183	48437	fbmy8028_rel_20230629_831.cza1_ser7
59524	0	587	3.3	324.4	127.3	0.010	0.057	0.005	2.190	30116	23.9	0.506	32	4.6	5.2	6.9	0.108	59886	49346	fbmy8028_rel_221222.cza1_ser7
58824	0	583	3.3	314.6	123.2	0.010	0.058	0.005	2.145	30005	23.6	0.510	32	5.0	5.6	6.8	0.101	59035	49946	fbmy8032_rel_221222.cza1_ser7
l.i2
l.i2: continue load after secondary indexes created with 5 inserts per transaction. Graphs for performance per 1-second interval are here.
Average throughput:
Insert response time histogram: each cell has the percentage of responses that take <= the time in the header and max is the max response time in seconds. For the max column values in the top 25% of the range have a red background and in the bottom 25% of the range have a green background. The red background is not used when the min value is within 80% of the max value.
| dbms | 256us | 1ms | 4ms | 16ms | 64ms | 256ms | 1s | 4s | 16s | gt | max |
|---|---|---|---|---|---|---|---|---|---|---|---|
| fbmy8028_rel_20220829_752.cza1_ser7 | 99.253 | 0.703 | nonzero | 0.042 | 0.001 | 0.001 | 0.120 | ||||
| fbmy8028_rel_20230129_754.cza1_ser7 | 99.300 | 0.656 | 0.001 | 0.041 | 0.001 | nonzero | 0.104 | ||||
| fbmy8028_rel_20230502_810.cza1_ser7 | 99.303 | 0.652 | 0.001 | 0.042 | 0.002 | nonzero | 0.111 | ||||
| fbmy8028_rel_20230523_821.cza1_ser7 | 99.213 | 0.743 | 0.001 | 0.042 | 0.001 | 0.001 | 0.109 | ||||
| fbmy8028_rel_20230619_831.cza1_ser7 | 99.345 | 0.610 | nonzero | 0.042 | 0.001 | 0.001 | 0.112 | ||||
| fbmy8028_rel_20230629_831.cza1_ser7 | 99.235 | 0.720 | 0.001 | 0.042 | 0.002 | nonzero | 0.104 | ||||
| fbmy8028_rel_221222.cza1_ser7 | 99.200 | 0.755 | nonzero | 0.042 | 0.001 | 0.001 | 0.112 | ||||
| fbmy8032_rel_221222.cza1_ser7 | 99.001 | 0.954 | 0.001 | 0.042 | 0.002 | nonzero | 0.097 |
Delete response time histogram: each cell has the percentage of responses that take <= the time in the header and max is the max response time in seconds. For the max column values in the top 25% of the range have a red background and in the bottom 25% of the range have a green background. The red background is not used when the min value is within 80% of the max value.
| dbms | 256us | 1ms | 4ms | 16ms | 64ms | 256ms | 1s | 4s | 16s | gt | max |
|---|---|---|---|---|---|---|---|---|---|---|---|
| fbmy8028_rel_20220829_752.cza1_ser7 | 97.153 | 2.802 | nonzero | 0.043 | 0.001 | 0.001 | 0.107 | ||||
| fbmy8028_rel_20230129_754.cza1_ser7 | 97.247 | 2.708 | 0.001 | 0.043 | 0.002 | nonzero | 0.094 | ||||
| fbmy8028_rel_20230502_810.cza1_ser7 | 97.366 | 2.589 | 0.001 | 0.043 | 0.002 | nonzero | 0.104 | ||||
| fbmy8028_rel_20230523_821.cza1_ser7 | 96.607 | 3.347 | 0.001 | 0.044 | 0.001 | 0.001 | 0.100 | ||||
| fbmy8028_rel_20230619_831.cza1_ser7 | 97.246 | 2.708 | 0.001 | 0.044 | 0.001 | 0.001 | 0.099 | ||||
| fbmy8028_rel_20230629_831.cza1_ser7 | 97.144 | 2.811 | 0.001 | 0.043 | 0.002 | nonzero | 0.095 | ||||
| fbmy8028_rel_221222.cza1_ser7 | 97.138 | 2.817 | 0.001 | 0.043 | 0.001 | 0.001 | 0.111 | ||||
| fbmy8032_rel_221222.cza1_ser7 | 96.013 | 3.940 | 0.001 | 0.044 | 0.002 | nonzero | 0.086 |
Performance metrics for the DBMS listed above. Some are normalized by throughput, others are not. Legend for results is here.
ips	qps	rps	rmbps	wps	wmbps	rpq	rkbpq	wpi	wkbpi	csps	cpups	cspq	cpupq	dbgb1	dbgb2	rss	maxop	p50	p99	tag
20964	0	0	0.0	252.6	89.7	0.000	0.000	0.012	4.379	86803	20.5	4.141	78	4.3	4.6	10.7	0.120	21018	18528	fbmy8028_rel_20220829_752.cza1_ser7
21053	0	0	0.0	248.7	88.8	0.000	0.000	0.012	4.321	86461	20.6	4.107	78	4.3	4.6	10.8	0.104	21121	18796	fbmy8028_rel_20230129_754.cza1_ser7
21097	0	0	0.0	229.1	82.2	0.000	0.000	0.011	3.992	86944	20.3	4.121	77	4.2	4.5	7.9	0.111	21182	18836	fbmy8028_rel_20230502_810.cza1_ser7
20920	0	0	0.0	232.7	83.8	0.000	0.000	0.011	4.104	86187	20.4	4.120	78	4.5	4.8	8.0	0.109	20996	18030	fbmy8028_rel_20230523_821.cza1_ser7
20964	0	0	0.0	210.9	75.8	0.000	0.000	0.010	3.704	86351	20.3	4.119	77	4.4	4.7	7.8	0.112	21070	18274	fbmy8028_rel_20230619_831.cza1_ser7
21142	0	0	0.0	220.5	78.8	0.000	0.000	0.010	3.817	86493	20.4	4.091	77	4.4	4.7	7.8	0.104	21117	18929	fbmy8028_rel_20230629_831.cza1_ser7
20877	0	0	0.0	238.4	85.1	0.000	0.000	0.011	4.175	85922	20.3	4.116	78	4.2	4.6	8.4	0.112	20922	18115	fbmy8028_rel_221222.cza1_ser7
20284	0	0	0.0	238.9	86.2	0.000	0.000	0.012	4.352	84031	20.7	4.143	82	4.3	4.6	8.5	0.097	20339	17825	fbmy8032_rel_221222.cza1_ser7
qr100.L1
qr100.L1: range queries with 100 insert/s per client. Graphs for performance per 1-second interval are here.
Average throughput:
Query response time histogram: each cell has the percentage of responses that take <= the time in the header and max is the max response time in seconds. For max values in the top 25% of the range have a red background and in the bottom 25% of the range have a green background. The red background is not used when the min value is within 80% of the max value.
| dbms | 256us | 1ms | 4ms | 16ms | 64ms | 256ms | 1s | 4s | 16s | gt | max |
|---|---|---|---|---|---|---|---|---|---|---|---|
| fbmy8028_rel_20220829_752.cza1_ser7 | 77.087 | 16.793 | 6.120 | nonzero | 0.007 | ||||||
| fbmy8028_rel_20230129_754.cza1_ser7 | 66.505 | 33.471 | 0.024 | nonzero | 0.006 | ||||||
| fbmy8028_rel_20230502_810.cza1_ser7 | 66.420 | 26.432 | 7.147 | 0.004 | |||||||
| fbmy8028_rel_20230523_821.cza1_ser7 | 66.319 | 20.223 | 13.458 | nonzero | 0.039 | ||||||
| fbmy8028_rel_20230619_831.cza1_ser7 | 77.510 | 17.669 | 4.821 | 0.003 | |||||||
| fbmy8028_rel_20230629_831.cza1_ser7 | 74.696 | 24.934 | 0.370 | nonzero | 0.039 | ||||||
| fbmy8028_rel_221222.cza1_ser7 | 69.046 | 16.602 | 14.352 | nonzero | 0.040 | ||||||
| fbmy8032_rel_221222.cza1_ser7 | 72.896 | 20.157 | 6.948 | nonzero | 0.036 |
Insert response time histogram: each cell has the percentage of responses that take <= the time in the header and max is the max response time in seconds. For max values in the top 25% of the range have a red background and in the bottom 25% of the range have a green background. The red background is not used when the min value is within 80% of the max value.
| dbms | 256us | 1ms | 4ms | 16ms | 64ms | 256ms | 1s | 4s | 16s | gt | max |
|---|---|---|---|---|---|---|---|---|---|---|---|
| fbmy8028_rel_20220829_752.cza1_ser7 | 9.333 | 90.333 | 0.306 | 0.028 | 0.016 | ||||||
| fbmy8028_rel_20230129_754.cza1_ser7 | 1.083 | 98.444 | 0.444 | 0.028 | 0.017 | ||||||
| fbmy8028_rel_20230502_810.cza1_ser7 | 1.417 | 97.972 | 0.556 | 0.056 | 0.018 | ||||||
| fbmy8028_rel_20230523_821.cza1_ser7 | 0.889 | 98.667 | 0.417 | 0.028 | 0.016 | ||||||
| fbmy8028_rel_20230619_831.cza1_ser7 | 1.167 | 98.306 | 0.472 | 0.056 | 0.017 | ||||||
| fbmy8028_rel_20230629_831.cza1_ser7 | 0.722 | 98.861 | 0.361 | 0.056 | 0.020 | ||||||
| fbmy8028_rel_221222.cza1_ser7 | 0.667 | 98.833 | 0.444 | 0.056 | 0.017 | ||||||
| fbmy8032_rel_221222.cza1_ser7 | 0.361 | 99.139 | 0.444 | 0.056 | 0.017 |
Delete response time histogram: each cell has the percentage of responses that take <= the time in the header and max is the max response time in seconds. For max values in the top 25% of the range have a red background and in the bottom 25% of the range have a green background. The red background is not used when the min value is within 80% of the max value.
| dbms | 256us | 1ms | 4ms | 16ms | 64ms | 256ms | 1s | 4s | 16s | gt | max |
|---|---|---|---|---|---|---|---|---|---|---|---|
| fbmy8028_rel_20220829_752.cza1_ser7 | 0.306 | 99.361 | 0.306 | 0.028 | 0.016 | ||||||
| fbmy8028_rel_20230129_754.cza1_ser7 | 4.139 | 95.444 | 0.389 | 0.028 | 0.016 | ||||||
| fbmy8028_rel_20230502_810.cza1_ser7 | 4.333 | 95.222 | 0.417 | 0.028 | 0.017 | ||||||
| fbmy8028_rel_20230523_821.cza1_ser7 | 4.083 | 95.611 | 0.278 | 0.028 | 0.016 | ||||||
| fbmy8028_rel_20230619_831.cza1_ser7 | 3.028 | 96.556 | 0.389 | 0.028 | 0.017 | ||||||
| fbmy8028_rel_20230629_831.cza1_ser7 | 0.944 | 98.694 | 0.306 | 0.056 | 0.020 | ||||||
| fbmy8028_rel_221222.cza1_ser7 | 1.167 | 98.472 | 0.333 | 0.028 | 0.017 | ||||||
| fbmy8032_rel_221222.cza1_ser7 | 0.333 | 99.278 | 0.361 | 0.028 | 0.017 |
Performance metrics for the DBMS listed above. Some are normalized by throughput, others are not. Legend for results is here.
ips	qps	rps	rmbps	wps	wmbps	rpq	rkbpq	wpi	wkbpi	csps	cpups	cspq	cpupq	dbgb1	dbgb2	rss	maxop	p50	p99	tag
100	3541	0	0.0	4.7	0.5	0.000	0.000	0.047	5.346	13803	6.6	3.898	149	4.2	4.4	11.2	0.007	3548	3291	fbmy8028_rel_20220829_752.cza1_ser7
100	3268	0	0.0	4.7	0.5	0.000	0.000	0.047	5.201	12780	6.6	3.910	162	4.2	4.4	11.3	0.006	3276	3069	fbmy8028_rel_20230129_754.cza1_ser7
100	3225	0	0.0	5.0	0.6	0.000	0.000	0.050	6.176	12625	6.7	3.915	166	4.2	4.4	8.3	0.004	3213	3021	fbmy8028_rel_20230502_810.cza1_ser7
100	2683	0	0.0	4.6	0.5	0.000	0.000	0.046	4.955	10538	6.5	3.927	194	4.2	4.4	8.5	0.039	2685	2494	fbmy8028_rel_20230523_821.cza1_ser7
100	3408	0	0.0	4.7	0.5	0.000	0.000	0.047	5.254	13289	6.6	3.899	155	4.2	4.4	8.2	0.003	3419	3148	fbmy8028_rel_20230619_831.cza1_ser7
100	3244	0	0.0	4.8	0.5	0.000	0.000	0.048	5.455	12676	6.7	3.908	165	4.2	4.4	8.2	0.039	3245	3052	fbmy8028_rel_20230629_831.cza1_ser7
100	2536	0	0.0	5.2	0.7	0.000	0.000	0.052	7.036	9987	6.4	3.937	202	4.1	4.4	9.0	0.040	2381	2238	fbmy8028_rel_221222.cza1_ser7
100	3485	0	0.0	5.0	0.6	0.000	0.000	0.050	6.092	13786	6.4	3.956	147	4.2	4.4	9.0	0.036	3900	2685	fbmy8032_rel_221222.cza1_ser7
qp100.L2
qp100.L2: point queries with 100 insert/s per client. Graphs for performance per 1-second interval are here.
Average throughput:
Query response time histogram: each cell has the percentage of responses that take <= the time in the header and max is the max response time in seconds. For max values in the top 25% of the range have a red background and in the bottom 25% of the range have a green background. The red background is not used when the min value is within 80% of the max value.
| dbms | 256us | 1ms | 4ms | 16ms | 64ms | 256ms | 1s | 4s | 16s | gt | max |
|---|---|---|---|---|---|---|---|---|---|---|---|
| fbmy8028_rel_20220829_752.cza1_ser7 | 99.671 | 0.329 | nonzero | 0.002 | |||||||
| fbmy8028_rel_20230129_754.cza1_ser7 | 99.634 | 0.366 | nonzero | 0.001 | |||||||
| fbmy8028_rel_20230502_810.cza1_ser7 | 99.621 | 0.379 | 0.001 | ||||||||
| fbmy8028_rel_20230523_821.cza1_ser7 | 99.480 | 0.520 | nonzero | 0.001 | |||||||
| fbmy8028_rel_20230619_831.cza1_ser7 | 99.637 | 0.363 | nonzero | 0.001 | |||||||
| fbmy8028_rel_20230629_831.cza1_ser7 | 99.579 | 0.421 | nonzero | 0.001 | |||||||
| fbmy8028_rel_221222.cza1_ser7 | 99.627 | 0.373 | nonzero | 0.001 | |||||||
| fbmy8032_rel_221222.cza1_ser7 | 99.575 | 0.425 | nonzero | 0.001 |
Insert response time histogram: each cell has the percentage of responses that take <= the time in the header and max is the max response time in seconds. For max values in the top 25% of the range have a red background and in the bottom 25% of the range have a green background. The red background is not used when the min value is within 80% of the max value.
| dbms | 256us | 1ms | 4ms | 16ms | 64ms | 256ms | 1s | 4s | 16s | gt | max |
|---|---|---|---|---|---|---|---|---|---|---|---|
| fbmy8028_rel_20220829_752.cza1_ser7 | 3.444 | 96.139 | 0.361 | 0.056 | 0.017 | ||||||
| fbmy8028_rel_20230129_754.cza1_ser7 | 1.583 | 97.944 | 0.417 | 0.056 | 0.022 | ||||||
| fbmy8028_rel_20230502_810.cza1_ser7 | 0.861 | 98.444 | 0.583 | 0.111 | 0.017 | ||||||
| fbmy8028_rel_20230523_821.cza1_ser7 | 0.833 | 98.750 | 0.361 | 0.056 | 0.017 | ||||||
| fbmy8028_rel_20230619_831.cza1_ser7 | 1.861 | 97.528 | 0.556 | 0.056 | 0.017 | ||||||
| fbmy8028_rel_20230629_831.cza1_ser7 | 1.444 | 98.111 | 0.389 | 0.056 | 0.017 | ||||||
| fbmy8028_rel_221222.cza1_ser7 | 1.111 | 98.472 | 0.361 | 0.056 | 0.017 | ||||||
| fbmy8032_rel_221222.cza1_ser7 | 1.111 | 98.417 | 0.417 | 0.056 | 0.017 |
Delete response time histogram: each cell has the percentage of responses that take <= the time in the header and max is the max response time in seconds. For max values in the top 25% of the range have a red background and in the bottom 25% of the range have a green background. The red background is not used when the min value is within 80% of the max value.
| dbms | 256us | 1ms | 4ms | 16ms | 64ms | 256ms | 1s | 4s | 16s | gt | max |
|---|---|---|---|---|---|---|---|---|---|---|---|
| fbmy8028_rel_20220829_752.cza1_ser7 | 1.528 | 98.056 | 0.361 | 0.056 | 0.017 | ||||||
| fbmy8028_rel_20230129_754.cza1_ser7 | 2.389 | 97.167 | 0.389 | 0.056 | 0.022 | ||||||
| fbmy8028_rel_20230502_810.cza1_ser7 | 2.806 | 96.583 | 0.528 | 0.083 | 0.017 | ||||||
| fbmy8028_rel_20230523_821.cza1_ser7 | 1.167 | 98.444 | 0.361 | 0.028 | 0.017 | ||||||
| fbmy8028_rel_20230619_831.cza1_ser7 | 4.472 | 95.083 | 0.389 | 0.056 | 0.017 | ||||||
| fbmy8028_rel_20230629_831.cza1_ser7 | 3.444 | 96.250 | 0.278 | 0.028 | 0.017 | ||||||
| fbmy8028_rel_221222.cza1_ser7 | 3.639 | 96.028 | 0.306 | 0.028 | 0.016 | ||||||
| fbmy8032_rel_221222.cza1_ser7 | 0.806 | 98.778 | 0.389 | 0.028 | 0.017 |
Performance metrics for the DBMS listed above. Some are normalized by throughput, others are not. Legend for results is here.
ips	qps	rps	rmbps	wps	wmbps	rpq	rkbpq	wpi	wkbpi	csps	cpups	cspq	cpupq	dbgb1	dbgb2	rss	maxop	p50	p99	tag
100	5945	0	0.0	6.8	1.7	0.000	0.000	0.068	17.035	24195	6.9	4.070	93	4.1	4.3	17.5	0.002	5848	4714	fbmy8028_rel_20220829_752.cza1_ser7
100	6113	0	0.0	4.8	0.7	0.000	0.000	0.048	7.097	24773	6.8	4.053	89	4.1	4.4	14.6	0.001	5961	5338	fbmy8028_rel_20230129_754.cza1_ser7
100	6118	0	0.0	4.3	0.5	0.000	0.000	0.043	4.740	24780	6.5	4.050	85	4.2	4.4	11.4	0.001	5882	5338	fbmy8028_rel_20230502_810.cza1_ser7
100	6030	0	0.0	4.7	0.6	0.000	0.000	0.047	6.046	24458	6.3	4.056	84	4.2	4.4	11.5	0.001	5865	5306	fbmy8028_rel_20230523_821.cza1_ser7
100	6064	0	0.0	4.7	0.6	0.000	0.000	0.047	6.521	24571	6.4	4.052	84	4.1	4.4	11.2	0.001	5879	5371	fbmy8028_rel_20230619_831.cza1_ser7
100	6201	0	0.0	4.4	0.5	0.000	0.000	0.044	4.963	25099	6.6	4.047	85	4.2	4.5	11.2	0.001	5918	5418	fbmy8028_rel_20230629_831.cza1_ser7
100	6086	0	0.0	4.3	0.4	0.000	0.000	0.043	4.601	24662	6.5	4.052	85	4.2	4.4	12.0	0.001	5881	5418	fbmy8028_rel_221222.cza1_ser7
100	5903	0	0.0	4.3	0.5	0.000	0.000	0.043	4.981	24110	6.3	4.084	85	4.2	4.4	12.1	0.001	5723	5546	fbmy8032_rel_221222.cza1_ser7
qr500.L3
qr500.L3: range queries with 500 insert/s per client. Graphs for performance per 1-second interval are here.
Average throughput:
Query response time histogram: each cell has the percentage of responses that take <= the time in the header and max is the max response time in seconds. For max values in the top 25% of the range have a red background and in the bottom 25% of the range have a green background. The red background is not used when the min value is within 80% of the max value.
| dbms | 256us | 1ms | 4ms | 16ms | 64ms | 256ms | 1s | 4s | 16s | gt | max |
|---|---|---|---|---|---|---|---|---|---|---|---|
| fbmy8028_rel_20220829_752.cza1_ser7 | 76.090 | 22.219 | 1.691 | nonzero | nonzero | 0.035 | |||||
| fbmy8028_rel_20230129_754.cza1_ser7 | 71.030 | 28.811 | 0.159 | nonzero | nonzero | 0.037 | |||||
| fbmy8028_rel_20230502_810.cza1_ser7 | 70.203 | 26.960 | 2.837 | nonzero | 0.035 | ||||||
| fbmy8028_rel_20230523_821.cza1_ser7 | 70.421 | 22.833 | 6.745 | nonzero | nonzero | 0.036 | |||||
| fbmy8028_rel_20230619_831.cza1_ser7 | 67.497 | 24.878 | 7.624 | nonzero | 0.037 | ||||||
| fbmy8028_rel_20230629_831.cza1_ser7 | 66.668 | 21.321 | 12.011 | nonzero | nonzero | 0.035 | |||||
| fbmy8028_rel_221222.cza1_ser7 | 72.863 | 21.889 | 5.247 | nonzero | 0.036 | ||||||
| fbmy8032_rel_221222.cza1_ser7 | 68.580 | 25.963 | 5.457 | nonzero | 0.036 |
Insert response time histogram: each cell has the percentage of responses that take <= the time in the header and max is the max response time in seconds. For max values in the top 25% of the range have a red background and in the bottom 25% of the range have a green background. The red background is not used when the min value is within 80% of the max value.
| dbms | 256us | 1ms | 4ms | 16ms | 64ms | 256ms | 1s | 4s | 16s | gt | max |
|---|---|---|---|---|---|---|---|---|---|---|---|
| fbmy8028_rel_20220829_752.cza1_ser7 | 1.339 | 98.344 | 0.239 | 0.078 | 0.018 | ||||||
| fbmy8028_rel_20230129_754.cza1_ser7 | 2.300 | 97.378 | 0.233 | 0.089 | 0.017 | ||||||
| fbmy8028_rel_20230502_810.cza1_ser7 | 0.917 | 98.633 | 0.378 | 0.072 | 0.017 | ||||||
| fbmy8028_rel_20230523_821.cza1_ser7 | 1.589 | 98.089 | 0.244 | 0.078 | 0.023 | ||||||
| fbmy8028_rel_20230619_831.cza1_ser7 | 3.400 | 96.206 | 0.328 | 0.067 | 0.017 | ||||||
| fbmy8028_rel_20230629_831.cza1_ser7 | 1.867 | 97.817 | 0.233 | 0.083 | 0.017 | ||||||
| fbmy8028_rel_221222.cza1_ser7 | 1.483 | 98.206 | 0.244 | 0.067 | 0.017 | ||||||
| fbmy8032_rel_221222.cza1_ser7 | 1.378 | 98.289 | 0.256 | 0.078 | 0.017 |
Delete response time histogram: each cell has the percentage of responses that take <= the time in the header and max is the max response time in seconds. For max values in the top 25% of the range have a red background and in the bottom 25% of the range have a green background. The red background is not used when the min value is within 80% of the max value.
| dbms | 256us | 1ms | 4ms | 16ms | 64ms | 256ms | 1s | 4s | 16s | gt | max |
|---|---|---|---|---|---|---|---|---|---|---|---|
| fbmy8028_rel_20220829_752.cza1_ser7 | 5.439 | 94.267 | 0.217 | 0.078 | 0.017 | ||||||
| fbmy8028_rel_20230129_754.cza1_ser7 | 3.772 | 95.933 | 0.211 | 0.083 | 0.018 | ||||||
| fbmy8028_rel_20230502_810.cza1_ser7 | 8.378 | 91.172 | 0.378 | 0.072 | 0.054 | ||||||
| fbmy8028_rel_20230523_821.cza1_ser7 | 3.511 | 96.183 | 0.228 | 0.078 | 0.023 | ||||||
| fbmy8028_rel_20230619_831.cza1_ser7 | 6.778 | 92.839 | 0.322 | 0.061 | 0.017 | ||||||
| fbmy8028_rel_20230629_831.cza1_ser7 | 1.606 | 98.122 | 0.194 | 0.078 | 0.017 | ||||||
| fbmy8028_rel_221222.cza1_ser7 | 5.311 | 94.400 | 0.222 | 0.067 | 0.022 | ||||||
| fbmy8032_rel_221222.cza1_ser7 | 3.361 | 96.311 | 0.261 | 0.067 | 0.017 |
Performance metrics for the DBMS listed above. Some are normalized by throughput, others are not. Legend for results is here.
ips	qps	rps	rmbps	wps	wmbps	rpq	rkbpq	wpi	wkbpi	csps	cpups	cspq	cpupq	dbgb1	dbgb2	rss	maxop	p50	p99	tag
499	4506	1	0.1	10.1	3.1	0.000	0.024	0.020	6.379	17788	6.7	3.947	119	4.2	4.6	18.4	0.035	4443	3740	fbmy8028_rel_20220829_752.cza1_ser7
499	2960	0	0.0	10.1	3.2	0.000	0.000	0.020	6.592	11898	6.9	4.020	187	4.2	4.6	15.9	0.037	2829	2461	fbmy8028_rel_20230129_754.cza1_ser7
499	3536	0	0.0	9.7	3.1	0.000	0.000	0.019	6.306	14103	6.9	3.988	156	4.2	4.7	12.5	0.035	3548	2877	fbmy8028_rel_20230502_810.cza1_ser7
499	3059	0	0.0	9.9	3.1	0.000	0.000	0.020	6.419	12295	6.8	4.019	178	4.2	4.6	12.7	0.036	3053	2637	fbmy8028_rel_20230523_821.cza1_ser7
499	2852	0	0.0	9.9	3.1	0.000	0.000	0.020	6.260	11801	6.9	4.138	194	4.2	4.6	12.5	0.037	2814	2556	fbmy8028_rel_20230619_831.cza1_ser7
499	2696	0	0.0	10.1	3.2	0.000	0.000	0.020	6.522	10899	6.7	4.043	199	4.2	4.6	12.6	0.035	2701	2349	fbmy8028_rel_20230629_831.cza1_ser7
499	3229	0	0.0	9.7	3.1	0.000	0.000	0.019	6.266	12918	6.8	4.001	168	4.2	4.6	13.2	0.036	3133	2685	fbmy8028_rel_221222.cza1_ser7
499	3227	0	0.0	10.2	3.3	0.000	0.000	0.020	6.672	13112	6.9	4.063	171	4.2	4.6	13.3	0.036	3212	2749	fbmy8032_rel_221222.cza1_ser7
qp500.L4
qp500.L4: point queries with 500 insert/s per client. Graphs for performance per 1-second interval are here.
Average throughput:
Query response time histogram: each cell has the percentage of responses that take <= the time in the header and max is the max response time in seconds. For max values in the top 25% of the range have a red background and in the bottom 25% of the range have a green background. The red background is not used when the min value is within 80% of the max value.
| dbms | 256us | 1ms | 4ms | 16ms | 64ms | 256ms | 1s | 4s | 16s | gt | max |
|---|---|---|---|---|---|---|---|---|---|---|---|
| fbmy8028_rel_20220829_752.cza1_ser7 | 99.527 | 0.473 | nonzero | 0.001 | |||||||
| fbmy8028_rel_20230129_754.cza1_ser7 | 99.600 | 0.400 | nonzero | 0.001 | |||||||
| fbmy8028_rel_20230502_810.cza1_ser7 | 99.619 | 0.381 | nonzero | 0.002 | |||||||
| fbmy8028_rel_20230523_821.cza1_ser7 | 99.494 | 0.506 | nonzero | 0.001 | |||||||
| fbmy8028_rel_20230619_831.cza1_ser7 | 99.625 | 0.375 | nonzero | 0.001 | |||||||
| fbmy8028_rel_20230629_831.cza1_ser7 | 99.567 | 0.433 | nonzero | nonzero | 0.004 | ||||||
| fbmy8028_rel_221222.cza1_ser7 | 99.538 | 0.462 | nonzero | nonzero | 0.005 | ||||||
| fbmy8032_rel_221222.cza1_ser7 | 99.487 | 0.513 | nonzero | 0.004 |
Insert response time histogram: each cell has the percentage of responses that take <= the time in the header and max is the max response time in seconds. For max values in the top 25% of the range have a red background and in the bottom 25% of the range have a green background. The red background is not used when the min value is within 80% of the max value.
| dbms | 256us | 1ms | 4ms | 16ms | 64ms | 256ms | 1s | 4s | 16s | gt | max |
|---|---|---|---|---|---|---|---|---|---|---|---|
| fbmy8028_rel_20220829_752.cza1_ser7 | 6.717 | 92.989 | 0.217 | 0.078 | 0.017 | ||||||
| fbmy8028_rel_20230129_754.cza1_ser7 | 1.683 | 98.017 | 0.217 | 0.083 | 0.017 | ||||||
| fbmy8028_rel_20230502_810.cza1_ser7 | 3.250 | 96.333 | 0.344 | 0.072 | 0.017 | ||||||
| fbmy8028_rel_20230523_821.cza1_ser7 | 4.561 | 95.117 | 0.250 | 0.072 | 0.017 | ||||||
| fbmy8028_rel_20230619_831.cza1_ser7 | 4.106 | 95.567 | 0.256 | 0.072 | 0.018 | ||||||
| fbmy8028_rel_20230629_831.cza1_ser7 | 4.906 | 94.794 | 0.233 | 0.067 | 0.017 | ||||||
| fbmy8028_rel_221222.cza1_ser7 | 4.289 | 95.350 | 0.289 | 0.072 | 0.018 | ||||||
| fbmy8032_rel_221222.cza1_ser7 | 5.044 | 94.633 | 0.233 | 0.089 | 0.017 |
Delete response time histogram: each cell has the percentage of responses that take <= the time in the header and max is the max response time in seconds. For max values in the top 25% of the range have a red background and in the bottom 25% of the range have a green background. The red background is not used when the min value is within 80% of the max value.
| dbms | 256us | 1ms | 4ms | 16ms | 64ms | 256ms | 1s | 4s | 16s | gt | max |
|---|---|---|---|---|---|---|---|---|---|---|---|
| fbmy8028_rel_20220829_752.cza1_ser7 | 4.561 | 95.150 | 0.206 | 0.083 | 0.017 | ||||||
| fbmy8028_rel_20230129_754.cza1_ser7 | 6.606 | 93.111 | 0.200 | 0.083 | 0.017 | ||||||
| fbmy8028_rel_20230502_810.cza1_ser7 | 8.328 | 91.267 | 0.350 | 0.056 | 0.017 | ||||||
| fbmy8028_rel_20230523_821.cza1_ser7 | 5.883 | 93.800 | 0.244 | 0.072 | 0.017 | ||||||
| fbmy8028_rel_20230619_831.cza1_ser7 | 4.706 | 94.972 | 0.250 | 0.072 | 0.053 | ||||||
| fbmy8028_rel_20230629_831.cza1_ser7 | 5.522 | 94.211 | 0.206 | 0.061 | 0.017 | ||||||
| fbmy8028_rel_221222.cza1_ser7 | 4.472 | 95.194 | 0.267 | 0.067 | 0.018 | ||||||
| fbmy8032_rel_221222.cza1_ser7 | 8.533 | 91.139 | 0.244 | 0.083 | 0.017 |
Performance metrics for the DBMS listed above. Some are normalized by throughput, others are not. Legend for results is here.
ips	qps	rps	rmbps	wps	wmbps	rpq	rkbpq	wpi	wkbpi	csps	cpups	cspq	cpupq	dbgb1	dbgb2	rss	maxop	p50	p99	tag
499	5937	3	0.3	10.3	3.1	0.000	0.044	0.021	6.378	24337	6.8	4.099	92	4.2	4.8	19.6	0.001	5754	5530	fbmy8028_rel_20220829_752.cza1_ser7
499	6061	0	0.0	10.0	3.3	0.000	0.000	0.020	6.672	24882	7.1	4.105	94	4.1	4.8	17.2	0.001	5913	5690	fbmy8028_rel_20230129_754.cza1_ser7
499	6047	0	0.0	9.5	3.0	0.000	0.000	0.019	6.250	24788	6.8	4.100	90	4.1	4.8	13.3	0.002	5849	5642	fbmy8028_rel_20230502_810.cza1_ser7
499	6002	0	0.0	9.4	2.9	0.000	0.000	0.019	6.019	24677	6.9	4.112	92	4.1	4.8	13.6	0.001	5786	5482	fbmy8028_rel_20230523_821.cza1_ser7
499	6035	0	0.0	9.4	3.0	0.000	0.000	0.019	6.077	24736	6.8	4.099	90	4.1	4.8	13.3	0.001	5834	5658	fbmy8028_rel_20230619_831.cza1_ser7
499	6151	0	0.0	9.3	2.9	0.000	0.000	0.019	5.907	25190	7.1	4.095	92	4.2	4.8	13.5	0.004	5945	5721	fbmy8028_rel_20230629_831.cza1_ser7
499	6158	0	0.0	9.2	2.9	0.000	0.000	0.018	5.915	25212	6.8	4.094	88	4.2	4.8	14.0	0.005	5865	5644	fbmy8028_rel_221222.cza1_ser7
499	5909	0	0.0	9.8	3.0	0.000	0.000	0.020	6.083	24413	6.6	4.131	89	4.2	4.8	14.1	0.004	5689	5482	fbmy8032_rel_221222.cza1_ser7
qr1000.L5
qr1000.L5: range queries with 1000 insert/s per client. Graphs for performance per 1-second interval are here.
Average throughput:
Query response time histogram: each cell has the percentage of responses that take <= the time in the header and max is the max response time in seconds. For max values in the top 25% of the range have a red background and in the bottom 25% of the range have a green background. The red background is not used when the min value is within 80% of the max value.
| dbms | 256us | 1ms | 4ms | 16ms | 64ms | 256ms | 1s | 4s | 16s | gt | max |
|---|---|---|---|---|---|---|---|---|---|---|---|
| fbmy8028_rel_20220829_752.cza1_ser7 | 73.393 | 22.005 | 4.601 | 0.001 | nonzero | nonzero | 0.115 | ||||
| fbmy8028_rel_20230129_754.cza1_ser7 | 70.359 | 22.766 | 6.874 | nonzero | nonzero | 0.037 | |||||
| fbmy8028_rel_20230502_810.cza1_ser7 | 73.231 | 20.050 | 6.719 | nonzero | nonzero | 0.035 | |||||
| fbmy8028_rel_20230523_821.cza1_ser7 | 68.214 | 22.497 | 9.288 | nonzero | nonzero | 0.044 | |||||
| fbmy8028_rel_20230619_831.cza1_ser7 | 70.540 | 19.358 | 10.101 | nonzero | nonzero | 0.040 | |||||
| fbmy8028_rel_20230629_831.cza1_ser7 | 73.181 | 22.804 | 4.015 | nonzero | nonzero | 0.035 | |||||
| fbmy8028_rel_221222.cza1_ser7 | 68.019 | 29.783 | 2.197 | nonzero | 0.043 | ||||||
| fbmy8032_rel_221222.cza1_ser7 | 71.004 | 24.821 | 4.174 | nonzero | nonzero | 0.049 |
Insert response time histogram: each cell has the percentage of responses that take <= the time in the header and max is the max response time in seconds. For max values in the top 25% of the range have a red background and in the bottom 25% of the range have a green background. The red background is not used when the min value is within 80% of the max value.
| dbms | 256us | 1ms | 4ms | 16ms | 64ms | 256ms | 1s | 4s | 16s | gt | max |
|---|---|---|---|---|---|---|---|---|---|---|---|
| fbmy8028_rel_20220829_752.cza1_ser7 | 3.556 | 96.167 | 0.197 | 0.081 | 0.050 | ||||||
| fbmy8028_rel_20230129_754.cza1_ser7 | 5.381 | 94.336 | 0.214 | 0.069 | 0.058 | ||||||
| fbmy8028_rel_20230502_810.cza1_ser7 | 5.369 | 94.250 | 0.308 | 0.072 | 0.049 | ||||||
| fbmy8028_rel_20230523_821.cza1_ser7 | 4.042 | 95.700 | 0.183 | 0.075 | 0.056 | ||||||
| fbmy8028_rel_20230619_831.cza1_ser7 | 3.825 | 95.872 | 0.233 | 0.067 | 0.003 | 0.066 | |||||
| fbmy8028_rel_20230629_831.cza1_ser7 | 2.822 | 96.872 | 0.225 | 0.078 | 0.003 | 0.069 | |||||
| fbmy8028_rel_221222.cza1_ser7 | 2.239 | 97.478 | 0.211 | 0.072 | 0.056 | ||||||
| fbmy8032_rel_221222.cza1_ser7 | 4.886 | 94.825 | 0.214 | 0.075 | 0.041 |
Delete response time histogram: each cell has the percentage of responses that take <= the time in the header and max is the max response time in seconds. For max values in the top 25% of the range have a red background and in the bottom 25% of the range have a green background. The red background is not used when the min value is within 80% of the max value.
| dbms | 256us | 1ms | 4ms | 16ms | 64ms | 256ms | 1s | 4s | 16s | gt | max |
|---|---|---|---|---|---|---|---|---|---|---|---|
| fbmy8028_rel_20220829_752.cza1_ser7 | 4.675 | 95.058 | 0.192 | 0.075 | 0.063 | ||||||
| fbmy8028_rel_20230129_754.cza1_ser7 | 6.439 | 93.275 | 0.214 | 0.072 | 0.053 | ||||||
| fbmy8028_rel_20230502_810.cza1_ser7 | 6.469 | 93.158 | 0.300 | 0.069 | 0.003 | 0.068 | |||||
| fbmy8028_rel_20230523_821.cza1_ser7 | 4.653 | 95.064 | 0.214 | 0.069 | 0.057 | ||||||
| fbmy8028_rel_20230619_831.cza1_ser7 | 4.611 | 95.094 | 0.225 | 0.069 | 0.056 | ||||||
| fbmy8028_rel_20230629_831.cza1_ser7 | 4.614 | 95.075 | 0.222 | 0.089 | 0.058 | ||||||
| fbmy8028_rel_221222.cza1_ser7 | 3.567 | 96.164 | 0.194 | 0.075 | 0.056 | ||||||
| fbmy8032_rel_221222.cza1_ser7 | 3.164 | 96.567 | 0.197 | 0.072 | 0.055 |
Performance metrics for the DBMS listed above. Some are normalized by throughput, others are not. Legend for results is here.
ips	qps	rps	rmbps	wps	wmbps	rpq	rkbpq	wpi	wkbpi	csps	cpups	cspq	cpupq	dbgb1	dbgb2	rss	maxop	p50	p99	tag
998	3368	8	0.8	20.6	7.5	0.002	0.242	0.021	7.742	13810	7.1	4.100	169	4.2	5.2	20.8	0.115	3372	2653	fbmy8028_rel_20220829_752.cza1_ser7
998	3131	2	0.2	17.5	6.6	0.001	0.049	0.018	6.749	12944	7.1	4.134	181	4.2	5.2	19.5	0.037	3101	2461	fbmy8028_rel_20230129_754.cza1_ser7
998	3375	0	0.0	16.4	6.2	0.000	0.000	0.016	6.390	13884	7.1	4.113	168	4.2	5.2	15.6	0.035	3420	2349	fbmy8028_rel_20230502_810.cza1_ser7
998	2888	0	0.0	16.9	6.4	0.000	0.000	0.017	6.605	12004	7.1	4.156	197	4.1	5.2	16.1	0.044	2876	2397	fbmy8028_rel_20230523_821.cza1_ser7
998	2890	0	0.0	16.3	6.3	0.000	0.000	0.016	6.442	12048	7.1	4.169	197	4.2	5.2	15.9	0.040	2797	2270	fbmy8028_rel_20230619_831.cza1_ser7
998	3693	0	0.0	16.5	6.3	0.000	0.000	0.017	6.466	15088	7.2	4.085	156	4.2	5.2	15.6	0.035	3692	2509	fbmy8028_rel_20230629_831.cza1_ser7
998	3225	0	0.0	16.5	6.4	0.000	0.000	0.017	6.527	13338	7.1	4.135	176	4.1	5.2	16.3	0.043	3164	2429	fbmy8028_rel_221222.cza1_ser7
998	3499	0	0.0	16.5	6.2	0.000	0.000	0.016	6.382	14571	7.1	4.164	162	4.2	5.2	16.1	0.049	3612	2589	fbmy8032_rel_221222.cza1_ser7
qp1000.L6
qp1000.L6: point queries with 1000 insert/s per client. Graphs for performance per 1-second interval are here.
Average throughput:
Query response time histogram: each cell has the percentage of responses that take <= the time in the header and max is the max response time in seconds. For max values in the top 25% of the range have a red background and in the bottom 25% of the range have a green background. The red background is not used when the min value is within 80% of the max value.
| dbms | 256us | 1ms | 4ms | 16ms | 64ms | 256ms | 1s | 4s | 16s | gt | max |
|---|---|---|---|---|---|---|---|---|---|---|---|
| fbmy8028_rel_20220829_752.cza1_ser7 | 98.763 | 1.236 | 0.001 | 0.001 | 0.010 | ||||||
| fbmy8028_rel_20230129_754.cza1_ser7 | 99.458 | 0.542 | nonzero | nonzero | 0.008 | ||||||
| fbmy8028_rel_20230502_810.cza1_ser7 | 99.495 | 0.505 | nonzero | nonzero | 0.007 | ||||||
| fbmy8028_rel_20230523_821.cza1_ser7 | 99.476 | 0.524 | nonzero | nonzero | 0.006 | ||||||
| fbmy8028_rel_20230619_831.cza1_ser7 | 99.508 | 0.492 | nonzero | 0.002 | |||||||
| fbmy8028_rel_20230629_831.cza1_ser7 | 99.474 | 0.526 | nonzero | nonzero | 0.007 | ||||||
| fbmy8028_rel_221222.cza1_ser7 | 99.481 | 0.519 | nonzero | nonzero | 0.005 | ||||||
| fbmy8032_rel_221222.cza1_ser7 | 99.453 | 0.547 | nonzero | 0.002 |
Insert response time histogram: each cell has the percentage of responses that take <= the time in the header and max is the max response time in seconds. For max values in the top 25% of the range have a red background and in the bottom 25% of the range have a green background. The red background is not used when the min value is within 80% of the max value.
| dbms | 256us | 1ms | 4ms | 16ms | 64ms | 256ms | 1s | 4s | 16s | gt | max |
|---|---|---|---|---|---|---|---|---|---|---|---|
| fbmy8028_rel_20220829_752.cza1_ser7 | 4.725 | 94.964 | 0.233 | 0.075 | 0.003 | 0.075 | |||||
| fbmy8028_rel_20230129_754.cza1_ser7 | 4.900 | 94.800 | 0.236 | 0.064 | 0.047 | ||||||
| fbmy8028_rel_20230502_810.cza1_ser7 | 6.339 | 93.367 | 0.219 | 0.075 | 0.063 | ||||||
| fbmy8028_rel_20230523_821.cza1_ser7 | 11.572 | 88.144 | 0.208 | 0.075 | 0.050 | ||||||
| fbmy8028_rel_20230619_831.cza1_ser7 | 5.242 | 94.464 | 0.214 | 0.081 | 0.063 | ||||||
| fbmy8028_rel_20230629_831.cza1_ser7 | 3.978 | 95.733 | 0.208 | 0.081 | 0.040 | ||||||
| fbmy8028_rel_221222.cza1_ser7 | 3.867 | 95.836 | 0.219 | 0.078 | 0.050 | ||||||
| fbmy8032_rel_221222.cza1_ser7 | 4.928 | 94.778 | 0.225 | 0.069 | 0.033 |
Delete response time histogram: each cell has the percentage of responses that take <= the time in the header and max is the max response time in seconds. For max values in the top 25% of the range have a red background and in the bottom 25% of the range have a green background. The red background is not used when the min value is within 80% of the max value.
| dbms | 256us | 1ms | 4ms | 16ms | 64ms | 256ms | 1s | 4s | 16s | gt | max |
|---|---|---|---|---|---|---|---|---|---|---|---|
| fbmy8028_rel_20220829_752.cza1_ser7 | 6.414 | 93.283 | 0.233 | 0.067 | 0.003 | 0.073 | |||||
| fbmy8028_rel_20230129_754.cza1_ser7 | 8.772 | 90.922 | 0.239 | 0.067 | 0.060 | ||||||
| fbmy8028_rel_20230502_810.cza1_ser7 | 8.903 | 90.819 | 0.208 | 0.069 | 0.049 | ||||||
| fbmy8028_rel_20230523_821.cza1_ser7 | 7.989 | 91.722 | 0.214 | 0.072 | 0.003 | 0.069 | |||||
| fbmy8028_rel_20230619_831.cza1_ser7 | 6.425 | 93.289 | 0.208 | 0.078 | 0.049 | ||||||
| fbmy8028_rel_20230629_831.cza1_ser7 | 5.136 | 94.572 | 0.214 | 0.078 | 0.054 | ||||||
| fbmy8028_rel_221222.cza1_ser7 | 4.875 | 94.839 | 0.211 | 0.072 | 0.003 | 0.064 | |||||
| fbmy8032_rel_221222.cza1_ser7 | 7.256 | 92.444 | 0.231 | 0.069 | 0.047 |
Performance metrics for the DBMS listed above. Some are normalized by throughput, others are not. Legend for results is here.
ips	qps	rps	rmbps	wps	wmbps	rpq	rkbpq	wpi	wkbpi	csps	cpups	cspq	cpupq	dbgb1	dbgb2	rss	maxop	p50	p99	tag
998	5898	113	1.4	17.9	6.3	0.019	0.249	0.018	6.491	24756	7.3	4.197	99	4.2	5.6	21.4	0.010	5754	2844	fbmy8028_rel_20220829_752.cza1_ser7
998	6162	8	0.9	18.7	6.7	0.001	0.148	0.019	6.896	25640	7.2	4.161	93	4.1	5.6	20.9	0.008	5897	5576	fbmy8028_rel_20230129_754.cza1_ser7
998	6103	0	0.0	15.8	6.0	0.000	0.000	0.016	6.176	25382	7.3	4.159	96	4.2	5.6	17.2	0.007	5864	5578	fbmy8028_rel_20230502_810.cza1_ser7
998	6137	1	0.1	15.9	5.8	0.000	0.012	0.016	5.990	25493	7.4	4.154	96	4.2	5.6	17.8	0.006	5866	5560	fbmy8028_rel_20230523_821.cza1_ser7
998	6124	2	0.2	16.4	6.0	0.000	0.029	0.016	6.165	25497	7.3	4.164	95	4.2	5.6	17.5	0.002	5866	5594	fbmy8028_rel_20230619_831.cza1_ser7
998	6254	1	0.1	16.4	6.1	0.000	0.012	0.016	6.228	25983	7.2	4.154	92	4.2	5.6	17.2	0.007	5978	5626	fbmy8028_rel_20230629_831.cza1_ser7
998	6101	34	0.2	16.5	6.0	0.006	0.032	0.017	6.104	25411	7.2	4.165	94	4.2	5.6	17.9	0.005	5837	5546	fbmy8028_rel_221222.cza1_ser7
998	5865	36	0.2	16.6	6.1	0.006	0.036	0.017	6.251	24738	7.7	4.218	105	4.1	5.6	17.9	0.002	5656	5454	fbmy8032_rel_221222.cza1_ser7
l.i0
l.i0: load without secondary indexes
Performance metrics for all DBMS, not just the ones listed above. Some are normalized by throughput, others are not. Legend for results is here.
ips	qps	rps	rmbps	wps	wmbps	rpq	rkbpq	wpi	wkbpi	csps	cpups	cspq	cpupq	dbgb1	dbgb2	rss	maxop	p50	p99	tag
151515	0	0	0.0	95.4	32.9	0.000	0.000	0.001	0.222	16798	9.8	0.111	5	1.8	3.4	0.7	0.110	151738	130666	fbmy8028_rel_20220829_752.cza1_ser7
151134	0	0	0.0	94.7	32.8	0.000	0.000	0.001	0.223	16771	9.8	0.111	5	1.8	3.4	0.7	0.135	151436	130558	fbmy8028_rel_20230129_754.cza1_ser7
150754	0	0	0.0	94.8	32.9	0.000	0.000	0.001	0.223	16789	9.9	0.111	5	1.8	3.4	0.7	0.111	151734	129060	fbmy8028_rel_20230502_810.cza1_ser7
151134	0	0	0.0	94.6	32.9	0.000	0.000	0.001	0.223	16786	9.9	0.111	5	1.8	3.4	0.7	0.112	151828	128855	fbmy8028_rel_20230523_821.cza1_ser7
150754	0	0	0.0	94.4	32.7	0.000	0.000	0.001	0.222	16707	9.9	0.111	5	1.8	3.4	0.7	0.107	151136	130053	fbmy8028_rel_20230619_831.cza1_ser7
150376	0	0	0.0	95.4	32.7	0.000	0.000	0.001	0.223	16603	9.8	0.110	5	1.8	3.4	0.7	0.107	150835	128564	fbmy8028_rel_20230629_831.cza1_ser7
148148	0	0	0.0	94.1	32.3	0.000	0.000	0.001	0.223	16494	10.1	0.111	5	1.8	3.4	0.7	0.120	148839	128264	fbmy8028_rel_221222.cza1_ser7
143198	0	0	0.0	91.3	31.2	0.000	0.000	0.001	0.223	16232	10.6	0.113	6	1.8	3.4	0.7	0.096	144338	115223	fbmy8032_rel_221222.cza1_ser7
l.x
l.x: create secondary indexes
Performance metrics for all DBMS, not just the ones listed above. Some are normalized by throughput, others are not. Legend for results is here.
ips	qps	rps	rmbps	wps	wmbps	rpq	rkbpq	wpi	wkbpi	csps	cpups	cspq	cpupq	dbgb1	dbgb2	rss	maxop	p50	p99	tag
174419	0	0	0.0	69.0	26.9	0.000	0.000	0.000	0.158	385	5.8	0.002	3	4.0	5.6	4.6	0.002	NA	NA	fbmy8028_rel_20220829_752.cza1_ser7
178572	0	0	0.0	69.1	27.7	0.000	0.000	0.000	0.159	375	5.8	0.002	3	4.0	5.6	4.6	0.009	NA	NA	fbmy8028_rel_20230129_754.cza1_ser7
179641	0	0	0.0	69.2	27.7	0.000	0.000	0.000	0.158	368	5.8	0.002	3	4.0	5.6	4.6	0.008	NA	NA	fbmy8028_rel_20230502_810.cza1_ser7
178042	0	0	0.0	69.1	27.6	0.000	0.000	0.000	0.159	369	5.8	0.002	3	4.0	5.6	4.6	0.009	NA	NA	fbmy8028_rel_20230523_821.cza1_ser7
178042	0	0	0.0	69.1	27.6	0.000	0.000	0.000	0.159	381	5.8	0.002	3	4.0	5.6	4.6	0.002	NA	NA	fbmy8028_rel_20230619_831.cza1_ser7
180180	0	0	0.0	69.4	27.8	0.000	0.000	0.000	0.158	360	5.8	0.002	3	4.0	5.6	4.6	0.002	NA	NA	fbmy8028_rel_20230629_831.cza1_ser7
174927	0	0	0.0	67.4	27.0	0.000	0.000	0.000	0.158	352	5.8	0.002	3	4.0	5.6	4.6	0.002	NA	NA	fbmy8028_rel_221222.cza1_ser7
175953	0	0	0.0	68.0	27.2	0.000	0.000	0.000	0.158	565	5.8	0.003	3	4.0	5.6	4.6	0.008	NA	NA	fbmy8032_rel_221222.cza1_ser7
l.i1
l.i1: continue load after secondary indexes created with 50 inserts per transaction
Performance metrics for all DBMS, not just the ones listed above. Some are normalized by throughput, others are not. Legend for results is here.
ips	qps	rps	rmbps	wps	wmbps	rpq	rkbpq	wpi	wkbpi	csps	cpups	cspq	cpupq	dbgb1	dbgb2	rss	maxop	p50	p99	tag
58651	0	26	3.3	352.1	139.3	0.000	0.057	0.006	2.432	29002	24.3	0.494	33	5.4	6.0	8.7	0.123	58935	48946	fbmy8028_rel_20220829_752.cza1_ser7
58737	0	26	3.3	350.3	138.9	0.000	0.057	0.006	2.421	29068	24.6	0.495	34	5.6	6.2	8.7	0.107	59086	49596	fbmy8028_rel_20230129_754.cza1_ser7
59259	0	27	3.3	295.3	114.0	0.000	0.058	0.005	1.969	28417	23.0	0.480	31	4.7	5.3	6.5	0.127	59535	49984	fbmy8028_rel_20230502_810.cza1_ser7
59172	0	27	3.3	299.2	115.7	0.000	0.057	0.005	2.002	28405	23.0	0.480	31	4.8	5.4	6.6	0.125	59361	50195	fbmy8028_rel_20230523_821.cza1_ser7
59084	0	27	3.3	294.1	114.0	0.000	0.057	0.005	1.976	28277	23.6	0.479	32	4.9	5.5	6.7	0.128	59386	48498	fbmy8028_rel_20230619_831.cza1_ser7
58737	0	26	3.3	288.7	112.2	0.000	0.057	0.005	1.956	28404	23.2	0.484	32	4.7	5.3	6.7	0.115	59183	48437	fbmy8028_rel_20230629_831.cza1_ser7
59524	0	587	3.3	324.4	127.3	0.010	0.057	0.005	2.190	30116	23.9	0.506	32	4.6	5.2	6.9	0.108	59886	49346	fbmy8028_rel_221222.cza1_ser7
58824	0	583	3.3	314.6	123.2	0.010	0.058	0.005	2.145	30005	23.6	0.510	32	5.0	5.6	6.8	0.101	59035	49946	fbmy8032_rel_221222.cza1_ser7
l.i2
l.i2: continue load after secondary indexes created with 5 inserts per transaction
Performance metrics for all DBMS, not just the ones listed above. Some are normalized by throughput, others are not. Legend for results is here.
ips	qps	rps	rmbps	wps	wmbps	rpq	rkbpq	wpi	wkbpi	csps	cpups	cspq	cpupq	dbgb1	dbgb2	rss	maxop	p50	p99	tag
20964	0	0	0.0	252.6	89.7	0.000	0.000	0.012	4.379	86803	20.5	4.141	78	4.3	4.6	10.7	0.120	21018	18528	fbmy8028_rel_20220829_752.cza1_ser7
21053	0	0	0.0	248.7	88.8	0.000	0.000	0.012	4.321	86461	20.6	4.107	78	4.3	4.6	10.8	0.104	21121	18796	fbmy8028_rel_20230129_754.cza1_ser7
21097	0	0	0.0	229.1	82.2	0.000	0.000	0.011	3.992	86944	20.3	4.121	77	4.2	4.5	7.9	0.111	21182	18836	fbmy8028_rel_20230502_810.cza1_ser7
20920	0	0	0.0	232.7	83.8	0.000	0.000	0.011	4.104	86187	20.4	4.120	78	4.5	4.8	8.0	0.109	20996	18030	fbmy8028_rel_20230523_821.cza1_ser7
20964	0	0	0.0	210.9	75.8	0.000	0.000	0.010	3.704	86351	20.3	4.119	77	4.4	4.7	7.8	0.112	21070	18274	fbmy8028_rel_20230619_831.cza1_ser7
21142	0	0	0.0	220.5	78.8	0.000	0.000	0.010	3.817	86493	20.4	4.091	77	4.4	4.7	7.8	0.104	21117	18929	fbmy8028_rel_20230629_831.cza1_ser7
20877	0	0	0.0	238.4	85.1	0.000	0.000	0.011	4.175	85922	20.3	4.116	78	4.2	4.6	8.4	0.112	20922	18115	fbmy8028_rel_221222.cza1_ser7
20284	0	0	0.0	238.9	86.2	0.000	0.000	0.012	4.352	84031	20.7	4.143	82	4.3	4.6	8.5	0.097	20339	17825	fbmy8032_rel_221222.cza1_ser7
qr100.L1
qr100.L1: range queries with 100 insert/s per client
Performance metrics for all DBMS, not just the ones listed above. Some are normalized by throughput, others are not. Legend for results is here.
ips	qps	rps	rmbps	wps	wmbps	rpq	rkbpq	wpi	wkbpi	csps	cpups	cspq	cpupq	dbgb1	dbgb2	rss	maxop	p50	p99	tag
100	3541	0	0.0	4.7	0.5	0.000	0.000	0.047	5.346	13803	6.6	3.898	149	4.2	4.4	11.2	0.007	3548	3291	fbmy8028_rel_20220829_752.cza1_ser7
100	3268	0	0.0	4.7	0.5	0.000	0.000	0.047	5.201	12780	6.6	3.910	162	4.2	4.4	11.3	0.006	3276	3069	fbmy8028_rel_20230129_754.cza1_ser7
100	3225	0	0.0	5.0	0.6	0.000	0.000	0.050	6.176	12625	6.7	3.915	166	4.2	4.4	8.3	0.004	3213	3021	fbmy8028_rel_20230502_810.cza1_ser7
100	2683	0	0.0	4.6	0.5	0.000	0.000	0.046	4.955	10538	6.5	3.927	194	4.2	4.4	8.5	0.039	2685	2494	fbmy8028_rel_20230523_821.cza1_ser7
100	3408	0	0.0	4.7	0.5	0.000	0.000	0.047	5.254	13289	6.6	3.899	155	4.2	4.4	8.2	0.003	3419	3148	fbmy8028_rel_20230619_831.cza1_ser7
100	3244	0	0.0	4.8	0.5	0.000	0.000	0.048	5.455	12676	6.7	3.908	165	4.2	4.4	8.2	0.039	3245	3052	fbmy8028_rel_20230629_831.cza1_ser7
100	2536	0	0.0	5.2	0.7	0.000	0.000	0.052	7.036	9987	6.4	3.937	202	4.1	4.4	9.0	0.040	2381	2238	fbmy8028_rel_221222.cza1_ser7
100	3485	0	0.0	5.0	0.6	0.000	0.000	0.050	6.092	13786	6.4	3.956	147	4.2	4.4	9.0	0.036	3900	2685	fbmy8032_rel_221222.cza1_ser7
qp100.L2
qp100.L2: point queries with 100 insert/s per client
Performance metrics for all DBMS, not just the ones listed above. Some are normalized by throughput, others are not. Legend for results is here.
ips	qps	rps	rmbps	wps	wmbps	rpq	rkbpq	wpi	wkbpi	csps	cpups	cspq	cpupq	dbgb1	dbgb2	rss	maxop	p50	p99	tag
100	5945	0	0.0	6.8	1.7	0.000	0.000	0.068	17.035	24195	6.9	4.070	93	4.1	4.3	17.5	0.002	5848	4714	fbmy8028_rel_20220829_752.cza1_ser7
100	6113	0	0.0	4.8	0.7	0.000	0.000	0.048	7.097	24773	6.8	4.053	89	4.1	4.4	14.6	0.001	5961	5338	fbmy8028_rel_20230129_754.cza1_ser7
100	6118	0	0.0	4.3	0.5	0.000	0.000	0.043	4.740	24780	6.5	4.050	85	4.2	4.4	11.4	0.001	5882	5338	fbmy8028_rel_20230502_810.cza1_ser7
100	6030	0	0.0	4.7	0.6	0.000	0.000	0.047	6.046	24458	6.3	4.056	84	4.2	4.4	11.5	0.001	5865	5306	fbmy8028_rel_20230523_821.cza1_ser7
100	6064	0	0.0	4.7	0.6	0.000	0.000	0.047	6.521	24571	6.4	4.052	84	4.1	4.4	11.2	0.001	5879	5371	fbmy8028_rel_20230619_831.cza1_ser7
100	6201	0	0.0	4.4	0.5	0.000	0.000	0.044	4.963	25099	6.6	4.047	85	4.2	4.5	11.2	0.001	5918	5418	fbmy8028_rel_20230629_831.cza1_ser7
100	6086	0	0.0	4.3	0.4	0.000	0.000	0.043	4.601	24662	6.5	4.052	85	4.2	4.4	12.0	0.001	5881	5418	fbmy8028_rel_221222.cza1_ser7
100	5903	0	0.0	4.3	0.5	0.000	0.000	0.043	4.981	24110	6.3	4.084	85	4.2	4.4	12.1	0.001	5723	5546	fbmy8032_rel_221222.cza1_ser7
qr500.L3
qr500.L3: range queries with 500 insert/s per client
Performance metrics for all DBMS, not just the ones listed above. Some are normalized by throughput, others are not. Legend for results is here.
ips	qps	rps	rmbps	wps	wmbps	rpq	rkbpq	wpi	wkbpi	csps	cpups	cspq	cpupq	dbgb1	dbgb2	rss	maxop	p50	p99	tag
499	4506	1	0.1	10.1	3.1	0.000	0.024	0.020	6.379	17788	6.7	3.947	119	4.2	4.6	18.4	0.035	4443	3740	fbmy8028_rel_20220829_752.cza1_ser7
499	2960	0	0.0	10.1	3.2	0.000	0.000	0.020	6.592	11898	6.9	4.020	187	4.2	4.6	15.9	0.037	2829	2461	fbmy8028_rel_20230129_754.cza1_ser7
499	3536	0	0.0	9.7	3.1	0.000	0.000	0.019	6.306	14103	6.9	3.988	156	4.2	4.7	12.5	0.035	3548	2877	fbmy8028_rel_20230502_810.cza1_ser7
499	3059	0	0.0	9.9	3.1	0.000	0.000	0.020	6.419	12295	6.8	4.019	178	4.2	4.6	12.7	0.036	3053	2637	fbmy8028_rel_20230523_821.cza1_ser7
499	2852	0	0.0	9.9	3.1	0.000	0.000	0.020	6.260	11801	6.9	4.138	194	4.2	4.6	12.5	0.037	2814	2556	fbmy8028_rel_20230619_831.cza1_ser7
499	2696	0	0.0	10.1	3.2	0.000	0.000	0.020	6.522	10899	6.7	4.043	199	4.2	4.6	12.6	0.035	2701	2349	fbmy8028_rel_20230629_831.cza1_ser7
499	3229	0	0.0	9.7	3.1	0.000	0.000	0.019	6.266	12918	6.8	4.001	168	4.2	4.6	13.2	0.036	3133	2685	fbmy8028_rel_221222.cza1_ser7
499	3227	0	0.0	10.2	3.3	0.000	0.000	0.020	6.672	13112	6.9	4.063	171	4.2	4.6	13.3	0.036	3212	2749	fbmy8032_rel_221222.cza1_ser7
qp500.L4
qp500.L4: point queries with 500 insert/s per client
Performance metrics for all DBMS, not just the ones listed above. Some are normalized by throughput, others are not. Legend for results is here.
ips	qps	rps	rmbps	wps	wmbps	rpq	rkbpq	wpi	wkbpi	csps	cpups	cspq	cpupq	dbgb1	dbgb2	rss	maxop	p50	p99	tag
499	5937	3	0.3	10.3	3.1	0.000	0.044	0.021	6.378	24337	6.8	4.099	92	4.2	4.8	19.6	0.001	5754	5530	fbmy8028_rel_20220829_752.cza1_ser7
499	6061	0	0.0	10.0	3.3	0.000	0.000	0.020	6.672	24882	7.1	4.105	94	4.1	4.8	17.2	0.001	5913	5690	fbmy8028_rel_20230129_754.cza1_ser7
499	6047	0	0.0	9.5	3.0	0.000	0.000	0.019	6.250	24788	6.8	4.100	90	4.1	4.8	13.3	0.002	5849	5642	fbmy8028_rel_20230502_810.cza1_ser7
499	6002	0	0.0	9.4	2.9	0.000	0.000	0.019	6.019	24677	6.9	4.112	92	4.1	4.8	13.6	0.001	5786	5482	fbmy8028_rel_20230523_821.cza1_ser7
499	6035	0	0.0	9.4	3.0	0.000	0.000	0.019	6.077	24736	6.8	4.099	90	4.1	4.8	13.3	0.001	5834	5658	fbmy8028_rel_20230619_831.cza1_ser7
499	6151	0	0.0	9.3	2.9	0.000	0.000	0.019	5.907	25190	7.1	4.095	92	4.2	4.8	13.5	0.004	5945	5721	fbmy8028_rel_20230629_831.cza1_ser7
499	6158	0	0.0	9.2	2.9	0.000	0.000	0.018	5.915	25212	6.8	4.094	88	4.2	4.8	14.0	0.005	5865	5644	fbmy8028_rel_221222.cza1_ser7
499	5909	0	0.0	9.8	3.0	0.000	0.000	0.020	6.083	24413	6.6	4.131	89	4.2	4.8	14.1	0.004	5689	5482	fbmy8032_rel_221222.cza1_ser7
qr1000.L5
qr1000.L5: range queries with 1000 insert/s per client
Performance metrics for all DBMS, not just the ones listed above. Some are normalized by throughput, others are not. Legend for results is here.
ips	qps	rps	rmbps	wps	wmbps	rpq	rkbpq	wpi	wkbpi	csps	cpups	cspq	cpupq	dbgb1	dbgb2	rss	maxop	p50	p99	tag
998	3368	8	0.8	20.6	7.5	0.002	0.242	0.021	7.742	13810	7.1	4.100	169	4.2	5.2	20.8	0.115	3372	2653	fbmy8028_rel_20220829_752.cza1_ser7
998	3131	2	0.2	17.5	6.6	0.001	0.049	0.018	6.749	12944	7.1	4.134	181	4.2	5.2	19.5	0.037	3101	2461	fbmy8028_rel_20230129_754.cza1_ser7
998	3375	0	0.0	16.4	6.2	0.000	0.000	0.016	6.390	13884	7.1	4.113	168	4.2	5.2	15.6	0.035	3420	2349	fbmy8028_rel_20230502_810.cza1_ser7
998	2888	0	0.0	16.9	6.4	0.000	0.000	0.017	6.605	12004	7.1	4.156	197	4.1	5.2	16.1	0.044	2876	2397	fbmy8028_rel_20230523_821.cza1_ser7
998	2890	0	0.0	16.3	6.3	0.000	0.000	0.016	6.442	12048	7.1	4.169	197	4.2	5.2	15.9	0.040	2797	2270	fbmy8028_rel_20230619_831.cza1_ser7
998	3693	0	0.0	16.5	6.3	0.000	0.000	0.017	6.466	15088	7.2	4.085	156	4.2	5.2	15.6	0.035	3692	2509	fbmy8028_rel_20230629_831.cza1_ser7
998	3225	0	0.0	16.5	6.4	0.000	0.000	0.017	6.527	13338	7.1	4.135	176	4.1	5.2	16.3	0.043	3164	2429	fbmy8028_rel_221222.cza1_ser7
998	3499	0	0.0	16.5	6.2	0.000	0.000	0.016	6.382	14571	7.1	4.164	162	4.2	5.2	16.1	0.049	3612	2589	fbmy8032_rel_221222.cza1_ser7
qp1000.L6
qp1000.L6: point queries with 1000 insert/s per client
Performance metrics for all DBMS, not just the ones listed above. Some are normalized by throughput, others are not. Legend for results is here.
ips	qps	rps	rmbps	wps	wmbps	rpq	rkbpq	wpi	wkbpi	csps	cpups	cspq	cpupq	dbgb1	dbgb2	rss	maxop	p50	p99	tag
998	5898	113	1.4	17.9	6.3	0.019	0.249	0.018	6.491	24756	7.3	4.197	99	4.2	5.6	21.4	0.010	5754	2844	fbmy8028_rel_20220829_752.cza1_ser7
998	6162	8	0.9	18.7	6.7	0.001	0.148	0.019	6.896	25640	7.2	4.161	93	4.1	5.6	20.9	0.008	5897	5576	fbmy8028_rel_20230129_754.cza1_ser7
998	6103	0	0.0	15.8	6.0	0.000	0.000	0.016	6.176	25382	7.3	4.159	96	4.2	5.6	17.2	0.007	5864	5578	fbmy8028_rel_20230502_810.cza1_ser7
998	6137	1	0.1	15.9	5.8	0.000	0.012	0.016	5.990	25493	7.4	4.154	96	4.2	5.6	17.8	0.006	5866	5560	fbmy8028_rel_20230523_821.cza1_ser7
998	6124	2	0.2	16.4	6.0	0.000	0.029	0.016	6.165	25497	7.3	4.164	95	4.2	5.6	17.5	0.002	5866	5594	fbmy8028_rel_20230619_831.cza1_ser7
998	6254	1	0.1	16.4	6.1	0.000	0.012	0.016	6.228	25983	7.2	4.154	92	4.2	5.6	17.2	0.007	5978	5626	fbmy8028_rel_20230629_831.cza1_ser7
998	6101	34	0.2	16.5	6.0	0.006	0.032	0.017	6.104	25411	7.2	4.165	94	4.2	5.6	17.9	0.005	5837	5546	fbmy8028_rel_221222.cza1_ser7
998	5865	36	0.2	16.6	6.1	0.006	0.036	0.017	6.251	24738	7.7	4.218	105	4.1	5.6	17.9	0.002	5656	5454	fbmy8032_rel_221222.cza1_ser7
l.i0
- l.i0: load without secondary indexes
- Legend for results is here.
- Each entry lists the percentage of responses that fit in that bucket (slower than max time for previous bucket, faster than min time for next bucket).
Insert response time histogram
256us	1ms	4ms	16ms	64ms	256ms	1s	4s	16s	gt	max	tag
0.000	99.490	0.339	0.129	0.038	0.004	0.000	0.000	0.000	0.000	0.110	fbmy8028_rel_20220829_752.cza1_ser7
0.000	99.487	0.342	0.128	0.039	0.004	0.000	0.000	0.000	0.000	0.135	fbmy8028_rel_20230129_754.cza1_ser7
0.000	99.480	0.348	0.135	0.033	0.004	0.000	0.000	0.000	0.000	0.111	fbmy8028_rel_20230502_810.cza1_ser7
0.000	99.492	0.338	0.130	0.036	0.004	0.000	0.000	0.000	0.000	0.112	fbmy8028_rel_20230523_821.cza1_ser7
0.000	99.501	0.328	0.126	0.041	0.004	0.000	0.000	0.000	0.000	0.107	fbmy8028_rel_20230619_831.cza1_ser7
0.000	99.444	0.385	0.133	0.035	0.004	0.000	0.000	0.000	0.000	0.107	fbmy8028_rel_20230629_831.cza1_ser7
0.000	99.444	0.385	0.129	0.039	0.004	0.000	0.000	0.000	0.000	0.120	fbmy8028_rel_221222.cza1_ser7
0.000	99.299	0.529	0.130	0.038	0.004	0.000	0.000	0.000	0.000	0.096	fbmy8032_rel_221222.cza1_ser7
l.x
- l.x: create secondary indexes
- Legend for results is here.
- Each entry lists the percentage of responses that fit in that bucket (slower than max time for previous bucket, faster than min time for next bucket).
TODO - determine whether there is data for create index response time
l.i1
- l.i1: continue load after secondary indexes created with 50 inserts per transaction
- Legend for results is here.
- Each entry lists the percentage of responses that fit in that bucket (slower than max time for previous bucket, faster than min time for next bucket).
Insert response time histogram
256us	1ms	4ms	16ms	64ms	256ms	1s	4s	16s	gt	max	tag
0.000	96.677	3.129	0.168	0.021	0.004	0.000	0.000	0.000	0.000	0.123	fbmy8028_rel_20220829_752.cza1_ser7
0.000	96.949	2.859	0.168	0.020	0.004	0.000	0.000	0.000	0.000	0.107	fbmy8028_rel_20230129_754.cza1_ser7
0.000	97.836	1.970	0.167	0.024	0.004	0.000	0.000	0.000	0.000	0.127	fbmy8028_rel_20230502_810.cza1_ser7
0.000	97.457	2.348	0.166	0.025	0.004	0.000	0.000	0.000	0.000	0.125	fbmy8028_rel_20230523_821.cza1_ser7
0.000	97.484	2.321	0.166	0.025	0.004	0.000	0.000	0.000	0.000	0.128	fbmy8028_rel_20230619_831.cza1_ser7
0.000	97.596	2.210	0.165	0.025	0.004	0.000	0.000	0.000	0.000	0.115	fbmy8028_rel_20230629_831.cza1_ser7
0.000	97.193	2.614	0.167	0.023	0.004	0.000	0.000	0.000	0.000	0.108	fbmy8028_rel_221222.cza1_ser7
0.000	97.305	2.501	0.169	0.021	0.004	0.000	0.000	0.000	0.000	0.101	fbmy8032_rel_221222.cza1_ser7
Delete response time histogram
256us	1ms	4ms	16ms	64ms	256ms	1s	4s	16s	gt	max	tag
0.000	97.172	2.626	0.168	0.030	0.004	0.000	0.000	0.000	0.000	0.121	fbmy8028_rel_20220829_752.cza1_ser7
0.000	97.560	2.243	0.166	0.028	0.004	0.000	0.000	0.000	0.000	0.119	fbmy8028_rel_20230129_754.cza1_ser7
0.000	98.266	1.535	0.163	0.032	0.004	0.000	0.000	0.000	0.000	0.115	fbmy8028_rel_20230502_810.cza1_ser7
0.000	97.944	1.856	0.163	0.033	0.004	0.000	0.000	0.000	0.000	0.114	fbmy8028_rel_20230523_821.cza1_ser7
0.000	97.921	1.880	0.161	0.034	0.004	0.000	0.000	0.000	0.000	0.119	fbmy8028_rel_20230619_831.cza1_ser7
0.000	97.805	1.993	0.162	0.035	0.004	0.000	0.000	0.000	0.000	0.110	fbmy8028_rel_20230629_831.cza1_ser7
0.000	97.655	2.143	0.162	0.036	0.004	0.000	0.000	0.000	0.000	0.114	fbmy8028_rel_221222.cza1_ser7
0.000	97.799	2.000	0.165	0.032	0.004	0.000	0.000	0.000	0.000	0.094	fbmy8032_rel_221222.cza1_ser7
l.i2
- l.i2: continue load after secondary indexes created with 5 inserts per transaction
- Legend for results is here.
- Each entry lists the percentage of responses that fit in that bucket (slower than max time for previous bucket, faster than min time for next bucket).
Insert response time histogram
256us	1ms	4ms	16ms	64ms	256ms	1s	4s	16s	gt	max	tag
99.253	0.703	nonzero	0.042	0.001	0.001	0.000	0.000	0.000	0.000	0.120	fbmy8028_rel_20220829_752.cza1_ser7
99.300	0.656	0.001	0.041	0.001	nonzero	0.000	0.000	0.000	0.000	0.104	fbmy8028_rel_20230129_754.cza1_ser7
99.303	0.652	0.001	0.042	0.002	nonzero	0.000	0.000	0.000	0.000	0.111	fbmy8028_rel_20230502_810.cza1_ser7
99.213	0.743	0.001	0.042	0.001	0.001	0.000	0.000	0.000	0.000	0.109	fbmy8028_rel_20230523_821.cza1_ser7
99.345	0.610	nonzero	0.042	0.001	0.001	0.000	0.000	0.000	0.000	0.112	fbmy8028_rel_20230619_831.cza1_ser7
99.235	0.720	0.001	0.042	0.002	nonzero	0.000	0.000	0.000	0.000	0.104	fbmy8028_rel_20230629_831.cza1_ser7
99.200	0.755	nonzero	0.042	0.001	0.001	0.000	0.000	0.000	0.000	0.112	fbmy8028_rel_221222.cza1_ser7
99.001	0.954	0.001	0.042	0.002	nonzero	0.000	0.000	0.000	0.000	0.097	fbmy8032_rel_221222.cza1_ser7
Delete response time histogram
256us	1ms	4ms	16ms	64ms	256ms	1s	4s	16s	gt	max	tag
97.153	2.802	nonzero	0.043	0.001	0.001	0.000	0.000	0.000	0.000	0.107	fbmy8028_rel_20220829_752.cza1_ser7
97.247	2.708	0.001	0.043	0.002	nonzero	0.000	0.000	0.000	0.000	0.094	fbmy8028_rel_20230129_754.cza1_ser7
97.366	2.589	0.001	0.043	0.002	nonzero	0.000	0.000	0.000	0.000	0.104	fbmy8028_rel_20230502_810.cza1_ser7
96.607	3.347	0.001	0.044	0.001	0.001	0.000	0.000	0.000	0.000	0.100	fbmy8028_rel_20230523_821.cza1_ser7
97.246	2.708	0.001	0.044	0.001	0.001	0.000	0.000	0.000	0.000	0.099	fbmy8028_rel_20230619_831.cza1_ser7
97.144	2.811	0.001	0.043	0.002	nonzero	0.000	0.000	0.000	0.000	0.095	fbmy8028_rel_20230629_831.cza1_ser7
97.138	2.817	0.001	0.043	0.001	0.001	0.000	0.000	0.000	0.000	0.111	fbmy8028_rel_221222.cza1_ser7
96.013	3.940	0.001	0.044	0.002	nonzero	0.000	0.000	0.000	0.000	0.086	fbmy8032_rel_221222.cza1_ser7
qr100.L1
- qr100.L1: range queries with 100 insert/s per client
- Legend for results is here.
- Each entry lists the percentage of responses that fit in that bucket (slower than max time for previous bucket, faster than min time for next bucket).
Query response time histogram
256us	1ms	4ms	16ms	64ms	256ms	1s	4s	16s	gt	max	tag
77.087	16.793	6.120	nonzero	0.000	0.000	0.000	0.000	0.000	0.000	0.007	fbmy8028_rel_20220829_752.cza1_ser7
66.505	33.471	0.024	nonzero	0.000	0.000	0.000	0.000	0.000	0.000	0.006	fbmy8028_rel_20230129_754.cza1_ser7
66.420	26.432	7.147	0.000	0.000	0.000	0.000	0.000	0.000	0.000	0.004	fbmy8028_rel_20230502_810.cza1_ser7
66.319	20.223	13.458	0.000	nonzero	0.000	0.000	0.000	0.000	0.000	0.039	fbmy8028_rel_20230523_821.cza1_ser7
77.510	17.669	4.821	0.000	0.000	0.000	0.000	0.000	0.000	0.000	0.003	fbmy8028_rel_20230619_831.cza1_ser7
74.696	24.934	0.370	0.000	nonzero	0.000	0.000	0.000	0.000	0.000	0.039	fbmy8028_rel_20230629_831.cza1_ser7
69.046	16.602	14.352	0.000	nonzero	0.000	0.000	0.000	0.000	0.000	0.040	fbmy8028_rel_221222.cza1_ser7
72.896	20.157	6.948	0.000	nonzero	0.000	0.000	0.000	0.000	0.000	0.036	fbmy8032_rel_221222.cza1_ser7
Insert response time histogram
256us	1ms	4ms	16ms	64ms	256ms	1s	4s	16s	gt	max	tag
0.000	9.333	90.333	0.306	0.028	0.000	0.000	0.000	0.000	0.000	0.016	fbmy8028_rel_20220829_752.cza1_ser7
0.000	1.083	98.444	0.444	0.028	0.000	0.000	0.000	0.000	0.000	0.017	fbmy8028_rel_20230129_754.cza1_ser7
0.000	1.417	97.972	0.556	0.056	0.000	0.000	0.000	0.000	0.000	0.018	fbmy8028_rel_20230502_810.cza1_ser7
0.000	0.889	98.667	0.417	0.028	0.000	0.000	0.000	0.000	0.000	0.016	fbmy8028_rel_20230523_821.cza1_ser7
0.000	1.167	98.306	0.472	0.056	0.000	0.000	0.000	0.000	0.000	0.017	fbmy8028_rel_20230619_831.cza1_ser7
0.000	0.722	98.861	0.361	0.056	0.000	0.000	0.000	0.000	0.000	0.020	fbmy8028_rel_20230629_831.cza1_ser7
0.000	0.667	98.833	0.444	0.056	0.000	0.000	0.000	0.000	0.000	0.017	fbmy8028_rel_221222.cza1_ser7
0.000	0.361	99.139	0.444	0.056	0.000	0.000	0.000	0.000	0.000	0.017	fbmy8032_rel_221222.cza1_ser7
Delete response time histogram
256us	1ms	4ms	16ms	64ms	256ms	1s	4s	16s	gt	max	tag
0.000	0.306	99.361	0.306	0.028	0.000	0.000	0.000	0.000	0.000	0.016	fbmy8028_rel_20220829_752.cza1_ser7
0.000	4.139	95.444	0.389	0.028	0.000	0.000	0.000	0.000	0.000	0.016	fbmy8028_rel_20230129_754.cza1_ser7
0.000	4.333	95.222	0.417	0.028	0.000	0.000	0.000	0.000	0.000	0.017	fbmy8028_rel_20230502_810.cza1_ser7
0.000	4.083	95.611	0.278	0.028	0.000	0.000	0.000	0.000	0.000	0.016	fbmy8028_rel_20230523_821.cza1_ser7
0.000	3.028	96.556	0.389	0.028	0.000	0.000	0.000	0.000	0.000	0.017	fbmy8028_rel_20230619_831.cza1_ser7
0.000	0.944	98.694	0.306	0.056	0.000	0.000	0.000	0.000	0.000	0.020	fbmy8028_rel_20230629_831.cza1_ser7
0.000	1.167	98.472	0.333	0.028	0.000	0.000	0.000	0.000	0.000	0.017	fbmy8028_rel_221222.cza1_ser7
0.000	0.333	99.278	0.361	0.028	0.000	0.000	0.000	0.000	0.000	0.017	fbmy8032_rel_221222.cza1_ser7
qp100.L2
- qp100.L2: point queries with 100 insert/s per client
- Legend for results is here.
- Each entry lists the percentage of responses that fit in that bucket (slower than max time for previous bucket, faster than min time for next bucket).
Query response time histogram
256us	1ms	4ms	16ms	64ms	256ms	1s	4s	16s	gt	max	tag
99.671	0.329	nonzero	0.000	0.000	0.000	0.000	0.000	0.000	0.000	0.002	fbmy8028_rel_20220829_752.cza1_ser7
99.634	0.366	nonzero	0.000	0.000	0.000	0.000	0.000	0.000	0.000	0.001	fbmy8028_rel_20230129_754.cza1_ser7
99.621	0.379	0.000	0.000	0.000	0.000	0.000	0.000	0.000	0.000	0.001	fbmy8028_rel_20230502_810.cza1_ser7
99.480	0.520	nonzero	0.000	0.000	0.000	0.000	0.000	0.000	0.000	0.001	fbmy8028_rel_20230523_821.cza1_ser7
99.637	0.363	nonzero	0.000	0.000	0.000	0.000	0.000	0.000	0.000	0.001	fbmy8028_rel_20230619_831.cza1_ser7
99.579	0.421	nonzero	0.000	0.000	0.000	0.000	0.000	0.000	0.000	0.001	fbmy8028_rel_20230629_831.cza1_ser7
99.627	0.373	nonzero	0.000	0.000	0.000	0.000	0.000	0.000	0.000	0.001	fbmy8028_rel_221222.cza1_ser7
99.575	0.425	nonzero	0.000	0.000	0.000	0.000	0.000	0.000	0.000	0.001	fbmy8032_rel_221222.cza1_ser7
Insert response time histogram
256us	1ms	4ms	16ms	64ms	256ms	1s	4s	16s	gt	max	tag
0.000	3.444	96.139	0.361	0.056	0.000	0.000	0.000	0.000	0.000	0.017	fbmy8028_rel_20220829_752.cza1_ser7
0.000	1.583	97.944	0.417	0.056	0.000	0.000	0.000	0.000	0.000	0.022	fbmy8028_rel_20230129_754.cza1_ser7
0.000	0.861	98.444	0.583	0.111	0.000	0.000	0.000	0.000	0.000	0.017	fbmy8028_rel_20230502_810.cza1_ser7
0.000	0.833	98.750	0.361	0.056	0.000	0.000	0.000	0.000	0.000	0.017	fbmy8028_rel_20230523_821.cza1_ser7
0.000	1.861	97.528	0.556	0.056	0.000	0.000	0.000	0.000	0.000	0.017	fbmy8028_rel_20230619_831.cza1_ser7
0.000	1.444	98.111	0.389	0.056	0.000	0.000	0.000	0.000	0.000	0.017	fbmy8028_rel_20230629_831.cza1_ser7
0.000	1.111	98.472	0.361	0.056	0.000	0.000	0.000	0.000	0.000	0.017	fbmy8028_rel_221222.cza1_ser7
0.000	1.111	98.417	0.417	0.056	0.000	0.000	0.000	0.000	0.000	0.017	fbmy8032_rel_221222.cza1_ser7
Delete response time histogram
256us	1ms	4ms	16ms	64ms	256ms	1s	4s	16s	gt	max	tag
0.000	1.528	98.056	0.361	0.056	0.000	0.000	0.000	0.000	0.000	0.017	fbmy8028_rel_20220829_752.cza1_ser7
0.000	2.389	97.167	0.389	0.056	0.000	0.000	0.000	0.000	0.000	0.022	fbmy8028_rel_20230129_754.cza1_ser7
0.000	2.806	96.583	0.528	0.083	0.000	0.000	0.000	0.000	0.000	0.017	fbmy8028_rel_20230502_810.cza1_ser7
0.000	1.167	98.444	0.361	0.028	0.000	0.000	0.000	0.000	0.000	0.017	fbmy8028_rel_20230523_821.cza1_ser7
0.000	4.472	95.083	0.389	0.056	0.000	0.000	0.000	0.000	0.000	0.017	fbmy8028_rel_20230619_831.cza1_ser7
0.000	3.444	96.250	0.278	0.028	0.000	0.000	0.000	0.000	0.000	0.017	fbmy8028_rel_20230629_831.cza1_ser7
0.000	3.639	96.028	0.306	0.028	0.000	0.000	0.000	0.000	0.000	0.016	fbmy8028_rel_221222.cza1_ser7
0.000	0.806	98.778	0.389	0.028	0.000	0.000	0.000	0.000	0.000	0.017	fbmy8032_rel_221222.cza1_ser7
qr500.L3
- qr500.L3: range queries with 500 insert/s per client
- Legend for results is here.
- Each entry lists the percentage of responses that fit in that bucket (slower than max time for previous bucket, faster than min time for next bucket).
Query response time histogram
256us	1ms	4ms	16ms	64ms	256ms	1s	4s	16s	gt	max	tag
76.090	22.219	1.691	nonzero	nonzero	0.000	0.000	0.000	0.000	0.000	0.035	fbmy8028_rel_20220829_752.cza1_ser7
71.030	28.811	0.159	nonzero	nonzero	0.000	0.000	0.000	0.000	0.000	0.037	fbmy8028_rel_20230129_754.cza1_ser7
70.203	26.960	2.837	0.000	nonzero	0.000	0.000	0.000	0.000	0.000	0.035	fbmy8028_rel_20230502_810.cza1_ser7
70.421	22.833	6.745	nonzero	nonzero	0.000	0.000	0.000	0.000	0.000	0.036	fbmy8028_rel_20230523_821.cza1_ser7
67.497	24.878	7.624	0.000	nonzero	0.000	0.000	0.000	0.000	0.000	0.037	fbmy8028_rel_20230619_831.cza1_ser7
66.668	21.321	12.011	nonzero	nonzero	0.000	0.000	0.000	0.000	0.000	0.035	fbmy8028_rel_20230629_831.cza1_ser7
72.863	21.889	5.247	0.000	nonzero	0.000	0.000	0.000	0.000	0.000	0.036	fbmy8028_rel_221222.cza1_ser7
68.580	25.963	5.457	0.000	nonzero	0.000	0.000	0.000	0.000	0.000	0.036	fbmy8032_rel_221222.cza1_ser7
Insert response time histogram
256us	1ms	4ms	16ms	64ms	256ms	1s	4s	16s	gt	max	tag
0.000	1.339	98.344	0.239	0.078	0.000	0.000	0.000	0.000	0.000	0.018	fbmy8028_rel_20220829_752.cza1_ser7
0.000	2.300	97.378	0.233	0.089	0.000	0.000	0.000	0.000	0.000	0.017	fbmy8028_rel_20230129_754.cza1_ser7
0.000	0.917	98.633	0.378	0.072	0.000	0.000	0.000	0.000	0.000	0.017	fbmy8028_rel_20230502_810.cza1_ser7
0.000	1.589	98.089	0.244	0.078	0.000	0.000	0.000	0.000	0.000	0.023	fbmy8028_rel_20230523_821.cza1_ser7
0.000	3.400	96.206	0.328	0.067	0.000	0.000	0.000	0.000	0.000	0.017	fbmy8028_rel_20230619_831.cza1_ser7
0.000	1.867	97.817	0.233	0.083	0.000	0.000	0.000	0.000	0.000	0.017	fbmy8028_rel_20230629_831.cza1_ser7
0.000	1.483	98.206	0.244	0.067	0.000	0.000	0.000	0.000	0.000	0.017	fbmy8028_rel_221222.cza1_ser7
0.000	1.378	98.289	0.256	0.078	0.000	0.000	0.000	0.000	0.000	0.017	fbmy8032_rel_221222.cza1_ser7
Delete response time histogram
256us	1ms	4ms	16ms	64ms	256ms	1s	4s	16s	gt	max	tag
0.000	5.439	94.267	0.217	0.078	0.000	0.000	0.000	0.000	0.000	0.017	fbmy8028_rel_20220829_752.cza1_ser7
0.000	3.772	95.933	0.211	0.083	0.000	0.000	0.000	0.000	0.000	0.018	fbmy8028_rel_20230129_754.cza1_ser7
0.000	8.378	91.172	0.378	0.072	0.000	0.000	0.000	0.000	0.000	0.054	fbmy8028_rel_20230502_810.cza1_ser7
0.000	3.511	96.183	0.228	0.078	0.000	0.000	0.000	0.000	0.000	0.023	fbmy8028_rel_20230523_821.cza1_ser7
0.000	6.778	92.839	0.322	0.061	0.000	0.000	0.000	0.000	0.000	0.017	fbmy8028_rel_20230619_831.cza1_ser7
0.000	1.606	98.122	0.194	0.078	0.000	0.000	0.000	0.000	0.000	0.017	fbmy8028_rel_20230629_831.cza1_ser7
0.000	5.311	94.400	0.222	0.067	0.000	0.000	0.000	0.000	0.000	0.022	fbmy8028_rel_221222.cza1_ser7
0.000	3.361	96.311	0.261	0.067	0.000	0.000	0.000	0.000	0.000	0.017	fbmy8032_rel_221222.cza1_ser7
qp500.L4
- qp500.L4: point queries with 500 insert/s per client
- Legend for results is here.
- Each entry lists the percentage of responses that fit in that bucket (slower than max time for previous bucket, faster than min time for next bucket).
Query response time histogram
256us	1ms	4ms	16ms	64ms	256ms	1s	4s	16s	gt	max	tag
99.527	0.473	nonzero	0.000	0.000	0.000	0.000	0.000	0.000	0.000	0.001	fbmy8028_rel_20220829_752.cza1_ser7
99.600	0.400	nonzero	0.000	0.000	0.000	0.000	0.000	0.000	0.000	0.001	fbmy8028_rel_20230129_754.cza1_ser7
99.619	0.381	nonzero	0.000	0.000	0.000	0.000	0.000	0.000	0.000	0.002	fbmy8028_rel_20230502_810.cza1_ser7
99.494	0.506	nonzero	0.000	0.000	0.000	0.000	0.000	0.000	0.000	0.001	fbmy8028_rel_20230523_821.cza1_ser7
99.625	0.375	nonzero	0.000	0.000	0.000	0.000	0.000	0.000	0.000	0.001	fbmy8028_rel_20230619_831.cza1_ser7
99.567	0.433	nonzero	nonzero	0.000	0.000	0.000	0.000	0.000	0.000	0.004	fbmy8028_rel_20230629_831.cza1_ser7
99.538	0.462	nonzero	nonzero	0.000	0.000	0.000	0.000	0.000	0.000	0.005	fbmy8028_rel_221222.cza1_ser7
99.487	0.513	nonzero	0.000	0.000	0.000	0.000	0.000	0.000	0.000	0.004	fbmy8032_rel_221222.cza1_ser7
Insert response time histogram
256us	1ms	4ms	16ms	64ms	256ms	1s	4s	16s	gt	max	tag
0.000	6.717	92.989	0.217	0.078	0.000	0.000	0.000	0.000	0.000	0.017	fbmy8028_rel_20220829_752.cza1_ser7
0.000	1.683	98.017	0.217	0.083	0.000	0.000	0.000	0.000	0.000	0.017	fbmy8028_rel_20230129_754.cza1_ser7
0.000	3.250	96.333	0.344	0.072	0.000	0.000	0.000	0.000	0.000	0.017	fbmy8028_rel_20230502_810.cza1_ser7
0.000	4.561	95.117	0.250	0.072	0.000	0.000	0.000	0.000	0.000	0.017	fbmy8028_rel_20230523_821.cza1_ser7
0.000	4.106	95.567	0.256	0.072	0.000	0.000	0.000	0.000	0.000	0.018	fbmy8028_rel_20230619_831.cza1_ser7
0.000	4.906	94.794	0.233	0.067	0.000	0.000	0.000	0.000	0.000	0.017	fbmy8028_rel_20230629_831.cza1_ser7
0.000	4.289	95.350	0.289	0.072	0.000	0.000	0.000	0.000	0.000	0.018	fbmy8028_rel_221222.cza1_ser7
0.000	5.044	94.633	0.233	0.089	0.000	0.000	0.000	0.000	0.000	0.017	fbmy8032_rel_221222.cza1_ser7
Delete response time histogram
256us	1ms	4ms	16ms	64ms	256ms	1s	4s	16s	gt	max	tag
0.000	4.561	95.150	0.206	0.083	0.000	0.000	0.000	0.000	0.000	0.017	fbmy8028_rel_20220829_752.cza1_ser7
0.000	6.606	93.111	0.200	0.083	0.000	0.000	0.000	0.000	0.000	0.017	fbmy8028_rel_20230129_754.cza1_ser7
0.000	8.328	91.267	0.350	0.056	0.000	0.000	0.000	0.000	0.000	0.017	fbmy8028_rel_20230502_810.cza1_ser7
0.000	5.883	93.800	0.244	0.072	0.000	0.000	0.000	0.000	0.000	0.017	fbmy8028_rel_20230523_821.cza1_ser7
0.000	4.706	94.972	0.250	0.072	0.000	0.000	0.000	0.000	0.000	0.053	fbmy8028_rel_20230619_831.cza1_ser7
0.000	5.522	94.211	0.206	0.061	0.000	0.000	0.000	0.000	0.000	0.017	fbmy8028_rel_20230629_831.cza1_ser7
0.000	4.472	95.194	0.267	0.067	0.000	0.000	0.000	0.000	0.000	0.018	fbmy8028_rel_221222.cza1_ser7
0.000	8.533	91.139	0.244	0.083	0.000	0.000	0.000	0.000	0.000	0.017	fbmy8032_rel_221222.cza1_ser7
qr1000.L5
- qr1000.L5: range queries with 1000 insert/s per client
- Legend for results is here.
- Each entry lists the percentage of responses that fit in that bucket (slower than max time for previous bucket, faster than min time for next bucket).
Query response time histogram
256us	1ms	4ms	16ms	64ms	256ms	1s	4s	16s	gt	max	tag
73.393	22.005	4.601	0.001	nonzero	nonzero	0.000	0.000	0.000	0.000	0.115	fbmy8028_rel_20220829_752.cza1_ser7
70.359	22.766	6.874	nonzero	nonzero	0.000	0.000	0.000	0.000	0.000	0.037	fbmy8028_rel_20230129_754.cza1_ser7
73.231	20.050	6.719	nonzero	nonzero	0.000	0.000	0.000	0.000	0.000	0.035	fbmy8028_rel_20230502_810.cza1_ser7
68.214	22.497	9.288	nonzero	nonzero	0.000	0.000	0.000	0.000	0.000	0.044	fbmy8028_rel_20230523_821.cza1_ser7
70.540	19.358	10.101	nonzero	nonzero	0.000	0.000	0.000	0.000	0.000	0.040	fbmy8028_rel_20230619_831.cza1_ser7
73.181	22.804	4.015	nonzero	nonzero	0.000	0.000	0.000	0.000	0.000	0.035	fbmy8028_rel_20230629_831.cza1_ser7
68.019	29.783	2.197	0.000	nonzero	0.000	0.000	0.000	0.000	0.000	0.043	fbmy8028_rel_221222.cza1_ser7
71.004	24.821	4.174	nonzero	nonzero	0.000	0.000	0.000	0.000	0.000	0.049	fbmy8032_rel_221222.cza1_ser7
Insert response time histogram
256us	1ms	4ms	16ms	64ms	256ms	1s	4s	16s	gt	max	tag
0.000	3.556	96.167	0.197	0.081	0.000	0.000	0.000	0.000	0.000	0.050	fbmy8028_rel_20220829_752.cza1_ser7
0.000	5.381	94.336	0.214	0.069	0.000	0.000	0.000	0.000	0.000	0.058	fbmy8028_rel_20230129_754.cza1_ser7
0.000	5.369	94.250	0.308	0.072	0.000	0.000	0.000	0.000	0.000	0.049	fbmy8028_rel_20230502_810.cza1_ser7
0.000	4.042	95.700	0.183	0.075	0.000	0.000	0.000	0.000	0.000	0.056	fbmy8028_rel_20230523_821.cza1_ser7
0.000	3.825	95.872	0.233	0.067	0.003	0.000	0.000	0.000	0.000	0.066	fbmy8028_rel_20230619_831.cza1_ser7
0.000	2.822	96.872	0.225	0.078	0.003	0.000	0.000	0.000	0.000	0.069	fbmy8028_rel_20230629_831.cza1_ser7
0.000	2.239	97.478	0.211	0.072	0.000	0.000	0.000	0.000	0.000	0.056	fbmy8028_rel_221222.cza1_ser7
0.000	4.886	94.825	0.214	0.075	0.000	0.000	0.000	0.000	0.000	0.041	fbmy8032_rel_221222.cza1_ser7
Delete response time histogram
256us	1ms	4ms	16ms	64ms	256ms	1s	4s	16s	gt	max	tag
0.000	4.675	95.058	0.192	0.075	0.000	0.000	0.000	0.000	0.000	0.063	fbmy8028_rel_20220829_752.cza1_ser7
0.000	6.439	93.275	0.214	0.072	0.000	0.000	0.000	0.000	0.000	0.053	fbmy8028_rel_20230129_754.cza1_ser7
0.000	6.469	93.158	0.300	0.069	0.003	0.000	0.000	0.000	0.000	0.068	fbmy8028_rel_20230502_810.cza1_ser7
0.000	4.653	95.064	0.214	0.069	0.000	0.000	0.000	0.000	0.000	0.057	fbmy8028_rel_20230523_821.cza1_ser7
0.000	4.611	95.094	0.225	0.069	0.000	0.000	0.000	0.000	0.000	0.056	fbmy8028_rel_20230619_831.cza1_ser7
0.000	4.614	95.075	0.222	0.089	0.000	0.000	0.000	0.000	0.000	0.058	fbmy8028_rel_20230629_831.cza1_ser7
0.000	3.567	96.164	0.194	0.075	0.000	0.000	0.000	0.000	0.000	0.056	fbmy8028_rel_221222.cza1_ser7
0.000	3.164	96.567	0.197	0.072	0.000	0.000	0.000	0.000	0.000	0.055	fbmy8032_rel_221222.cza1_ser7
qp1000.L6
- qp1000.L6: point queries with 1000 insert/s per client
- Legend for results is here.
- Each entry lists the percentage of responses that fit in that bucket (slower than max time for previous bucket, faster than min time for next bucket).
Query response time histogram
256us	1ms	4ms	16ms	64ms	256ms	1s	4s	16s	gt	max	tag
98.763	1.236	0.001	0.001	0.000	0.000	0.000	0.000	0.000	0.000	0.010	fbmy8028_rel_20220829_752.cza1_ser7
99.458	0.542	nonzero	nonzero	0.000	0.000	0.000	0.000	0.000	0.000	0.008	fbmy8028_rel_20230129_754.cza1_ser7
99.495	0.505	nonzero	nonzero	0.000	0.000	0.000	0.000	0.000	0.000	0.007	fbmy8028_rel_20230502_810.cza1_ser7
99.476	0.524	nonzero	nonzero	0.000	0.000	0.000	0.000	0.000	0.000	0.006	fbmy8028_rel_20230523_821.cza1_ser7
99.508	0.492	nonzero	0.000	0.000	0.000	0.000	0.000	0.000	0.000	0.002	fbmy8028_rel_20230619_831.cza1_ser7
99.474	0.526	nonzero	nonzero	0.000	0.000	0.000	0.000	0.000	0.000	0.007	fbmy8028_rel_20230629_831.cza1_ser7
99.481	0.519	nonzero	nonzero	0.000	0.000	0.000	0.000	0.000	0.000	0.005	fbmy8028_rel_221222.cza1_ser7
99.453	0.547	nonzero	0.000	0.000	0.000	0.000	0.000	0.000	0.000	0.002	fbmy8032_rel_221222.cza1_ser7
Insert response time histogram
256us	1ms	4ms	16ms	64ms	256ms	1s	4s	16s	gt	max	tag
0.000	4.725	94.964	0.233	0.075	0.003	0.000	0.000	0.000	0.000	0.075	fbmy8028_rel_20220829_752.cza1_ser7
0.000	4.900	94.800	0.236	0.064	0.000	0.000	0.000	0.000	0.000	0.047	fbmy8028_rel_20230129_754.cza1_ser7
0.000	6.339	93.367	0.219	0.075	0.000	0.000	0.000	0.000	0.000	0.063	fbmy8028_rel_20230502_810.cza1_ser7
0.000	11.572	88.144	0.208	0.075	0.000	0.000	0.000	0.000	0.000	0.050	fbmy8028_rel_20230523_821.cza1_ser7
0.000	5.242	94.464	0.214	0.081	0.000	0.000	0.000	0.000	0.000	0.063	fbmy8028_rel_20230619_831.cza1_ser7
0.000	3.978	95.733	0.208	0.081	0.000	0.000	0.000	0.000	0.000	0.040	fbmy8028_rel_20230629_831.cza1_ser7
0.000	3.867	95.836	0.219	0.078	0.000	0.000	0.000	0.000	0.000	0.050	fbmy8028_rel_221222.cza1_ser7
0.000	4.928	94.778	0.225	0.069	0.000	0.000	0.000	0.000	0.000	0.033	fbmy8032_rel_221222.cza1_ser7
Delete response time histogram
256us	1ms	4ms	16ms	64ms	256ms	1s	4s	16s	gt	max	tag
0.000	6.414	93.283	0.233	0.067	0.003	0.000	0.000	0.000	0.000	0.073	fbmy8028_rel_20220829_752.cza1_ser7
0.000	8.772	90.922	0.239	0.067	0.000	0.000	0.000	0.000	0.000	0.060	fbmy8028_rel_20230129_754.cza1_ser7
0.000	8.903	90.819	0.208	0.069	0.000	0.000	0.000	0.000	0.000	0.049	fbmy8028_rel_20230502_810.cza1_ser7
0.000	7.989	91.722	0.214	0.072	0.003	0.000	0.000	0.000	0.000	0.069	fbmy8028_rel_20230523_821.cza1_ser7
0.000	6.425	93.289	0.208	0.078	0.000	0.000	0.000	0.000	0.000	0.049	fbmy8028_rel_20230619_831.cza1_ser7
0.000	5.136	94.572	0.214	0.078	0.000	0.000	0.000	0.000	0.000	0.054	fbmy8028_rel_20230629_831.cza1_ser7
0.000	4.875	94.839	0.211	0.072	0.003	0.000	0.000	0.000	0.000	0.064	fbmy8028_rel_221222.cza1_ser7
0.000	7.256	92.444	0.231	0.069	0.000	0.000	0.000	0.000	0.000	0.047	fbmy8032_rel_221222.cza1_ser7