Introduction
This is a report for the insert benchmark with 480M docs and 24 client(s). It is generated by scripts (bash, awk, sed) and Tufte might not be impressed. An overview of the insert benchmark is here and a short update is here. Below, by DBMS, I mean DBMS+version.config. An example is my8020.c10b40 where my means MySQL, 8020 is version 8.0.20 and c10b40 is the name for the configuration file.
The test server has 40 cores, 80 HW threads (hyperthreads enabled), 256G RAM and many TB of fast NVMe SSD with XFS and SW RAID 0. The benchmark was run with 24 clients and there were 1 or 3 connections per client (1 for queries or inserts without rate limits, 1+1 for rate limited inserts+deletes). It uses 1 table per client. It loads 20M rows per table without secondary indexes, creates 3 secondary indexes per table, then inserts 50m+50m rows per table with a delete per insert to avoid growing the table. It then does 6 read+write tests for 3600s each that do queries as fast as possible with 100,100,500,500,1000,1000 inserts/s and the same for deletes/s per client concurrent with the queries. The database is cached in memory. Clients and the DBMS share one server. The per-database configs are in the per-database subdirectories here.
The tested DBMS are:
- my5651_rel_native_lto.cz10a_u - MySQL 5.6.51 with InnoDB, Release build with -march=native -mtune=native, cz10a_u config
- my5740_rel_native_lto.cz10a_u - MySQL 5.7.40 with InnoDB, Release build with -march=native -mtune=native, cz10a_u config
- my5740_rel_native_lto.cz10aps0_u - MySQL 5.7.40 with InnoDB, Release build with -march=native -mtune=native, cz10aps0_u config that disables the perf schema
- my8033_rel_native_lto.cz10a_u - MySQL 8.0.33 with InnoDB, Release build with -march=native -mtune=native -DWITH_LTO, cz10a_u config
- my8033_rel_native_lto.cz10aps0_u - MySQL 8.0.33 with InnoDB, Release build with -march=native -mtune=native -DWITH_LTO, cz10aps0_u config that disables the perf schema
Contents
- Summary
- l.i0: load without secondary indexes
- l.x: create secondary indexes
- l.i1: continue load after secondary indexes created with 50 inserts per transaction
- l.i2: continue load after secondary indexes created with 5 inserts per transaction
- qr100.L1: range queries with 100 insert/s per client
- qp100.L2: point queries with 100 insert/s per client
- qr500.L3: range queries with 500 insert/s per client
- qp500.L4: point queries with 500 insert/s per client
- qr1000.L5: range queries with 1000 insert/s per client
- qp1000.L6: point queries with 1000 insert/s per client
Summary
The numbers are inserts/s for l.i0, l.i1 and l.i2, indexed docs (or rows) /s for l.x and queries/s for qr100, qp100 thru qr1000, qp1000" The values are the average rate over the entire test for inserts (IPS) and queries (QPS). The range of values for IPS and QPS is split into 3 parts: bottom 25%, middle 50%, top 25%. Values in the bottom 25% have a red background, values in the top 25% have a green background and values in the middle have no color. A gray background is used for values that can be ignored because the DBMS did not sustain the target insert rate. Red backgrounds are not used when the minimum value is within 80% of the max value.
| dbms | l.i0 | l.x | l.i1 | l.i2 | qr100 | qp100 | qr500 | qp500 | qr1000 | qp1000 |
|---|---|---|---|---|---|---|---|---|---|---|
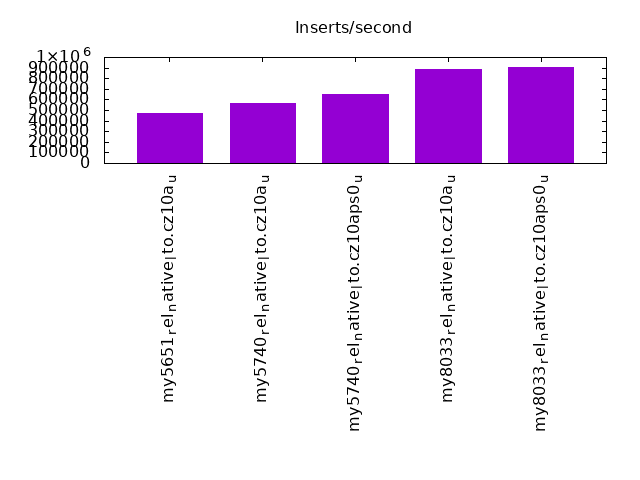
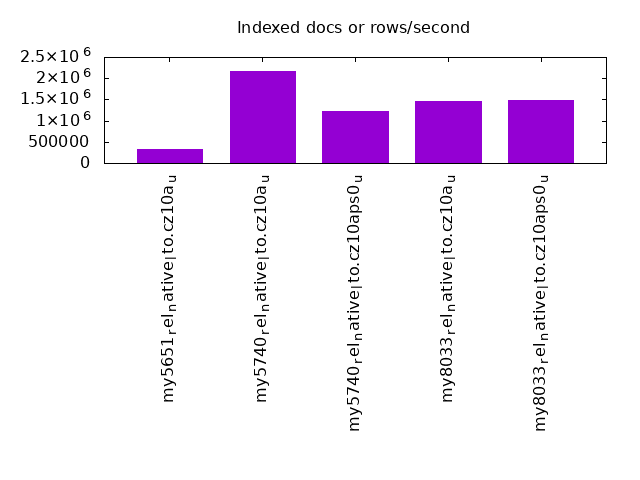
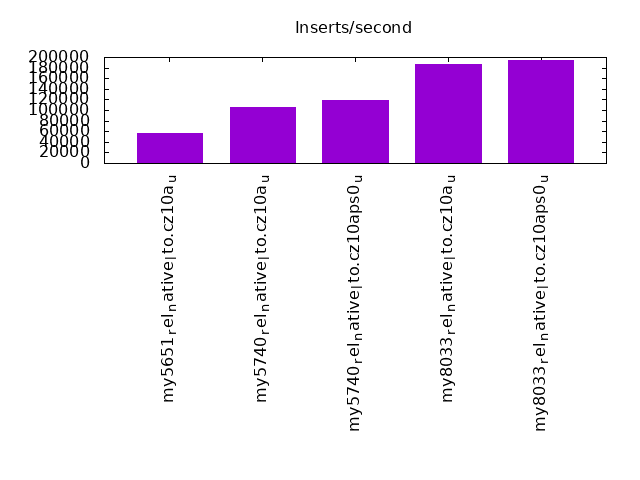
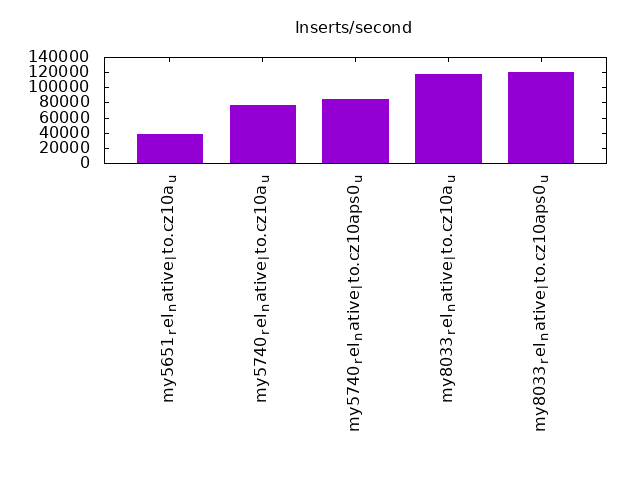
| my5651_rel_native_lto.cz10a_u | 473840 | 335196 | 57341 | 38505 | 142018 | 106114 | 130264 | 98950 | 112780 | 88731 |
| my5740_rel_native_lto.cz10a_u | 567376 | 2162163 | 105506 | 77046 | 126370 | 97232 | 121975 | 94520 | 113349 | 88875 |
| my5740_rel_native_lto.cz10aps0_u | 654843 | 1221374 | 119195 | 84240 | 131022 | 99977 | 127440 | 97270 | 118943 | 92584 |
| my8033_rel_native_lto.cz10a_u | 883978 | 1467890 | 187171 | 117302 | 104266 | 80693 | 101703 | 79173 | 97896 | 76283 |
| my8033_rel_native_lto.cz10aps0_u | 907372 | 1486068 | 194489 | 120603 | 110077 | 84315 | 107335 | 82730 | 103571 | 79769 |
This table has relative throughput, throughput for the DBMS relative to the DBMS in the first line, using the absolute throughput from the previous table. Values less than 0.95 have a yellow background. Values greater than 1.05 have a blue background.
| dbms | l.i0 | l.x | l.i1 | l.i2 | qr100 | qp100 | qr500 | qp500 | qr1000 | qp1000 |
|---|---|---|---|---|---|---|---|---|---|---|
| my5651_rel_native_lto.cz10a_u | 1.00 | 1.00 | 1.00 | 1.00 | 1.00 | 1.00 | 1.00 | 1.00 | 1.00 | 1.00 |
| my5740_rel_native_lto.cz10a_u | 1.20 | 6.45 | 1.84 | 2.00 | 0.89 | 0.92 | 0.94 | 0.96 | 1.01 | 1.00 |
| my5740_rel_native_lto.cz10aps0_u | 1.38 | 3.64 | 2.08 | 2.19 | 0.92 | 0.94 | 0.98 | 0.98 | 1.05 | 1.04 |
| my8033_rel_native_lto.cz10a_u | 1.87 | 4.38 | 3.26 | 3.05 | 0.73 | 0.76 | 0.78 | 0.80 | 0.87 | 0.86 |
| my8033_rel_native_lto.cz10aps0_u | 1.91 | 4.43 | 3.39 | 3.13 | 0.78 | 0.79 | 0.82 | 0.84 | 0.92 | 0.90 |
This lists the average rate of inserts/s for the tests that do inserts concurrent with queries. For such tests the query rate is listed in the table above. The read+write tests are setup so that the insert rate should match the target rate every second. Cells that are not at least 95% of the target have a red background to indicate a failure to satisfy the target.
| dbms | qr100.L1 | qp100.L2 | qr500.L3 | qp500.L4 | qr1000.L5 | qp1000.L6 |
|---|---|---|---|---|---|---|
| my5651_rel_native_lto.cz10a_u | 2381 | 2381 | 11907 | 11907 | 23828 | 23834 |
| my5740_rel_native_lto.cz10a_u | 2381 | 2381 | 11907 | 11907 | 23828 | 23828 |
| my5740_rel_native_lto.cz10aps0_u | 2381 | 2381 | 11907 | 11907 | 23828 | 23834 |
| my8033_rel_native_lto.cz10a_u | 2381 | 2382 | 11907 | 11907 | 23828 | 23828 |
| my8033_rel_native_lto.cz10aps0_u | 2382 | 2381 | 11907 | 11907 | 23828 | 23828 |
| target | 2400 | 2400 | 12000 | 12000 | 24000 | 24000 |
l.i0
l.i0: load without secondary indexes. Graphs for performance per 1-second interval are here.
Average throughput:
Insert response time histogram: each cell has the percentage of responses that take <= the time in the header and max is the max response time in seconds. For the max column values in the top 25% of the range have a red background and in the bottom 25% of the range have a green background. The red background is not used when the min value is within 80% of the max value.
| dbms | 256us | 1ms | 4ms | 16ms | 64ms | 256ms | 1s | 4s | 16s | gt | max |
|---|---|---|---|---|---|---|---|---|---|---|---|
| my5651_rel_native_lto.cz10a_u | 0.292 | 9.555 | 89.820 | 0.295 | 0.038 | 0.091 | |||||
| my5740_rel_native_lto.cz10a_u | 0.196 | 47.544 | 52.214 | 0.002 | 0.043 | 0.091 | |||||
| my5740_rel_native_lto.cz10aps0_u | 0.199 | 90.834 | 8.920 | 0.004 | 0.043 | 0.114 | |||||
| my8033_rel_native_lto.cz10a_u | 99.925 | 0.030 | 0.014 | 0.032 | 0.118 | ||||||
| my8033_rel_native_lto.cz10aps0_u | 99.933 | 0.020 | 0.021 | 0.026 | 0.117 |
Performance metrics for the DBMS listed above. Some are normalized by throughput, others are not. Legend for results is here.
ips	qps	rps	rmbps	wps	wmbps	rpq	rkbpq	wpi	wkbpi	csps	cpups	cspq	cpupq	dbgb1	dbgb2	rss	maxop	p50	p99	tag
473840	0	0	0.0	2352.3	114.5	0.000	0.000	0.005	0.247	68922	38.4	0.145	65	31.8	160.3	45.7	0.091	19590	17482	my5651_rel_native_lto.cz10a_u
567376	0	0	0.0	2823.8	134.9	0.000	0.000	0.005	0.244	80138	40.4	0.141	57	31.8	160.3	47.2	0.091	24176	21579	my5740_rel_native_lto.cz10a_u
654843	0	0	0.0	3208.3	154.4	0.000	0.000	0.005	0.241	91120	42.5	0.139	52	31.8	160.3	46.8	0.114	28072	24979	my5740_rel_native_lto.cz10aps0_u
883978	0	0	0.0	4191.9	224.0	0.000	0.000	0.005	0.259	198816	51.4	0.225	47	31.7	160.3	47.2	0.118	38761	32568	my8033_rel_native_lto.cz10a_u
907372	0	0	0.0	4306.1	230.2	0.000	0.000	0.005	0.260	179242	49.8	0.198	44	31.7	160.3	46.2	0.117	39061	31369	my8033_rel_native_lto.cz10aps0_u
l.x
l.x: create secondary indexes.
Average throughput:
Performance metrics for the DBMS listed above. Some are normalized by throughput, others are not. Legend for results is here.
ips	qps	rps	rmbps	wps	wmbps	rpq	rkbpq	wpi	wkbpi	csps	cpups	cspq	cpupq	dbgb1	dbgb2	rss	maxop	p50	p99	tag
335196	0	383	1.5	18793.4	649.4	0.001	0.005	0.056	1.984	68891	30.6	0.206	73	66.9	195.4	81.9	0.002	NA	NA	my5651_rel_native_lto.cz10a_u
2162163	0	0	0.0	36162.6	1956.4	0.000	0.000	0.017	0.927	150135	30.9	0.069	11	72.8	201.4	82.1	0.003	NA	NA	my5740_rel_native_lto.cz10a_u
1221374	0	0	0.0	20542.5	1107.5	0.000	0.000	0.017	0.929	119098	29.6	0.098	19	72.8	201.4	83.3	0.002	NA	NA	my5740_rel_native_lto.cz10aps0_u
1467890	0	8177	388.0	32472.9	1202.6	0.006	0.271	0.022	0.839	174909	73.9	0.119	40	72.7	201.2	69.3	0.005	NA	NA	my8033_rel_native_lto.cz10a_u
1486068	0	8344	396.0	32830.3	1217.9	0.006	0.273	0.022	0.839	220709	71.1	0.149	38	72.7	201.2	75.2	0.010	NA	NA	my8033_rel_native_lto.cz10aps0_u
l.i1
l.i1: continue load after secondary indexes created with 50 inserts per transaction. Graphs for performance per 1-second interval are here.
Average throughput:
Insert response time histogram: each cell has the percentage of responses that take <= the time in the header and max is the max response time in seconds. For the max column values in the top 25% of the range have a red background and in the bottom 25% of the range have a green background. The red background is not used when the min value is within 80% of the max value.
| dbms | 256us | 1ms | 4ms | 16ms | 64ms | 256ms | 1s | 4s | 16s | gt | max |
|---|---|---|---|---|---|---|---|---|---|---|---|
| my5651_rel_native_lto.cz10a_u | 0.012 | 5.503 | 94.473 | 0.012 | 0.254 | ||||||
| my5740_rel_native_lto.cz10a_u | 0.020 | 99.795 | 0.150 | 0.034 | nonzero | nonzero | 3.793 | ||||
| my5740_rel_native_lto.cz10aps0_u | 0.029 | 99.796 | 0.147 | 0.028 | nonzero | nonzero | 1.200 | ||||
| my8033_rel_native_lto.cz10a_u | 25.715 | 73.769 | 0.355 | 0.140 | 0.021 | 0.540 | |||||
| my8033_rel_native_lto.cz10aps0_u | 26.253 | 73.240 | 0.325 | 0.164 | 0.018 | 0.539 |
Delete response time histogram: each cell has the percentage of responses that take <= the time in the header and max is the max response time in seconds. For the max column values in the top 25% of the range have a red background and in the bottom 25% of the range have a green background. The red background is not used when the min value is within 80% of the max value.
| dbms | 256us | 1ms | 4ms | 16ms | 64ms | 256ms | 1s | 4s | 16s | gt | max |
|---|---|---|---|---|---|---|---|---|---|---|---|
| my5651_rel_native_lto.cz10a_u | 0.017 | 8.896 | 91.078 | 0.008 | 0.149 | ||||||
| my5740_rel_native_lto.cz10a_u | 0.046 | 99.803 | 0.118 | 0.032 | nonzero | nonzero | 3.848 | ||||
| my5740_rel_native_lto.cz10aps0_u | 0.073 | 99.770 | 0.130 | 0.027 | nonzero | nonzero | 1.178 | ||||
| my8033_rel_native_lto.cz10a_u | 52.513 | 46.189 | 0.598 | 0.570 | 0.130 | 0.574 | |||||
| my8033_rel_native_lto.cz10aps0_u | 55.173 | 43.440 | 0.578 | 0.657 | 0.153 | 0.730 |
Performance metrics for the DBMS listed above. Some are normalized by throughput, others are not. Legend for results is here.
ips	qps	rps	rmbps	wps	wmbps	rpq	rkbpq	wpi	wkbpi	csps	cpups	cspq	cpupq	dbgb1	dbgb2	rss	maxop	p50	p99	tag
57341	0	1642	7.0	5644.5	179.3	0.029	0.124	0.098	3.202	131582	65.3	2.295	911	226.9	403.1	215.8	0.254	2398	1998	my5651_rel_native_lto.cz10a_u
105506	0	124	1.9	9392.1	300.8	0.001	0.019	0.089	2.919	112699	69.3	1.068	525	235.6	415.0	216.8	3.793	4396	3996	my5740_rel_native_lto.cz10a_u
119195	0	140	2.2	10283.0	330.7	0.001	0.018	0.086	2.841	129341	69.5	1.085	466	235.8	414.6	216.7	1.200	4995	4495	my5740_rel_native_lto.cz10aps0_u
187171	0	1229	19.2	16435.2	540.7	0.007	0.105	0.088	2.958	865898	57.0	4.626	244	247.7	437.8	216.2	0.540	7892	3496	my8033_rel_native_lto.cz10a_u
194489	0	1225	19.1	16855.3	555.6	0.006	0.101	0.087	2.925	825354	58.7	4.244	241	246.9	438.0	216.0	0.539	8541	3846	my8033_rel_native_lto.cz10aps0_u
l.i2
l.i2: continue load after secondary indexes created with 5 inserts per transaction. Graphs for performance per 1-second interval are here.
Average throughput:
Insert response time histogram: each cell has the percentage of responses that take <= the time in the header and max is the max response time in seconds. For the max column values in the top 25% of the range have a red background and in the bottom 25% of the range have a green background. The red background is not used when the min value is within 80% of the max value.
| dbms | 256us | 1ms | 4ms | 16ms | 64ms | 256ms | 1s | 4s | 16s | gt | max |
|---|---|---|---|---|---|---|---|---|---|---|---|
| my5651_rel_native_lto.cz10a_u | nonzero | 0.437 | 82.597 | 16.960 | 0.006 | nonzero | 0.130 | ||||
| my5740_rel_native_lto.cz10a_u | nonzero | 6.323 | 93.598 | 0.067 | 0.005 | 0.007 | 0.118 | ||||
| my5740_rel_native_lto.cz10aps0_u | nonzero | 12.606 | 87.318 | 0.064 | 0.006 | 0.005 | 0.109 | ||||
| my8033_rel_native_lto.cz10a_u | 69.926 | 29.932 | 0.133 | 0.003 | 0.007 | 0.142 | |||||
| my8033_rel_native_lto.cz10aps0_u | 72.601 | 27.247 | 0.143 | 0.004 | 0.005 | 0.119 |
Delete response time histogram: each cell has the percentage of responses that take <= the time in the header and max is the max response time in seconds. For the max column values in the top 25% of the range have a red background and in the bottom 25% of the range have a green background. The red background is not used when the min value is within 80% of the max value.
| dbms | 256us | 1ms | 4ms | 16ms | 64ms | 256ms | 1s | 4s | 16s | gt | max |
|---|---|---|---|---|---|---|---|---|---|---|---|
| my5651_rel_native_lto.cz10a_u | nonzero | 0.523 | 83.640 | 15.829 | 0.008 | nonzero | 0.132 | ||||
| my5740_rel_native_lto.cz10a_u | nonzero | 5.884 | 94.036 | 0.067 | 0.006 | 0.007 | 0.118 | ||||
| my5740_rel_native_lto.cz10aps0_u | nonzero | 11.735 | 88.187 | 0.065 | 0.007 | 0.005 | 0.109 | ||||
| my8033_rel_native_lto.cz10a_u | 75.394 | 24.447 | 0.150 | 0.003 | 0.007 | 0.120 | |||||
| my8033_rel_native_lto.cz10aps0_u | 77.052 | 22.779 | 0.160 | 0.004 | 0.005 | 0.117 |
Performance metrics for the DBMS listed above. Some are normalized by throughput, others are not. Legend for results is here.
ips	qps	rps	rmbps	wps	wmbps	rpq	rkbpq	wpi	wkbpi	csps	cpups	cspq	cpupq	dbgb1	dbgb2	rss	maxop	p50	p99	tag
38505	0	5508	30.4	6180.2	185.2	0.143	0.808	0.161	4.925	340195	54.3	8.835	1128	237.3	433.8	215.9	0.130	1603	1484	my5651_rel_native_lto.cz10a_u
77046	0	1516	23.7	10452.3	317.3	0.020	0.315	0.136	4.217	552664	57.4	7.173	596	248.1	447.7	216.8	0.118	3242	2962	my5740_rel_native_lto.cz10a_u
84240	0	1676	26.2	11178.0	339.6	0.020	0.318	0.133	4.129	596326	57.0	7.079	541	247.7	446.2	216.7	0.109	3536	3257	my5740_rel_native_lto.cz10aps0_u
117302	0	2740	42.8	14961.9	466.3	0.023	0.374	0.128	4.070	1194482	62.7	10.183	428	258.8	486.2	216.2	0.142	5035	4495	my8033_rel_native_lto.cz10a_u
120603	0	2831	44.2	15320.3	478.2	0.023	0.376	0.127	4.060	1218526	62.8	10.104	417	260.3	488.6	216.0	0.119	4965	4470	my8033_rel_native_lto.cz10aps0_u
qr100.L1
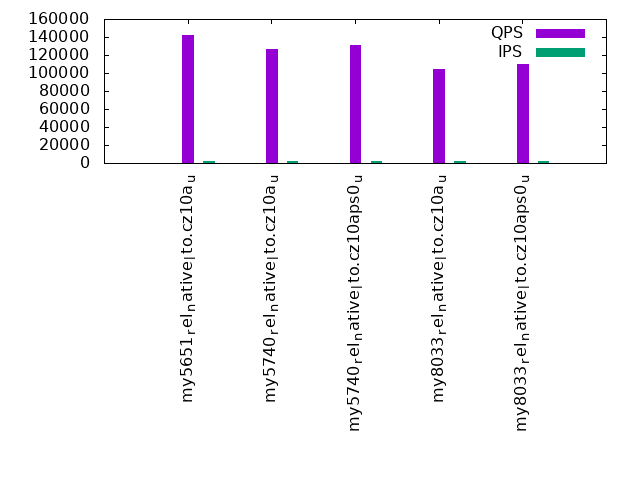
qr100.L1: range queries with 100 insert/s per client. Graphs for performance per 1-second interval are here.
Average throughput:
Query response time histogram: each cell has the percentage of responses that take <= the time in the header and max is the max response time in seconds. For max values in the top 25% of the range have a red background and in the bottom 25% of the range have a green background. The red background is not used when the min value is within 80% of the max value.
| dbms | 256us | 1ms | 4ms | 16ms | 64ms | 256ms | 1s | 4s | 16s | gt | max |
|---|---|---|---|---|---|---|---|---|---|---|---|
| my5651_rel_native_lto.cz10a_u | 99.342 | 0.647 | 0.011 | 0.001 | nonzero | 0.041 | |||||
| my5740_rel_native_lto.cz10a_u | 96.840 | 3.157 | 0.003 | nonzero | nonzero | 0.022 | |||||
| my5740_rel_native_lto.cz10aps0_u | 98.207 | 1.790 | 0.003 | nonzero | nonzero | 0.043 | |||||
| my8033_rel_native_lto.cz10a_u | 84.667 | 15.328 | 0.005 | nonzero | nonzero | 0.048 | |||||
| my8033_rel_native_lto.cz10aps0_u | 90.978 | 9.017 | 0.004 | nonzero | nonzero | 0.023 |
Insert response time histogram: each cell has the percentage of responses that take <= the time in the header and max is the max response time in seconds. For max values in the top 25% of the range have a red background and in the bottom 25% of the range have a green background. The red background is not used when the min value is within 80% of the max value.
| dbms | 256us | 1ms | 4ms | 16ms | 64ms | 256ms | 1s | 4s | 16s | gt | max |
|---|---|---|---|---|---|---|---|---|---|---|---|
| my5651_rel_native_lto.cz10a_u | 14.258 | 82.945 | 2.797 | 0.053 | |||||||
| my5740_rel_native_lto.cz10a_u | 63.479 | 36.344 | 0.177 | 0.028 | |||||||
| my5740_rel_native_lto.cz10aps0_u | 90.848 | 8.612 | 0.541 | 0.048 | |||||||
| my8033_rel_native_lto.cz10a_u | 88.641 | 11.355 | 0.003 | 0.056 | |||||||
| my8033_rel_native_lto.cz10aps0_u | 92.509 | 7.491 | 0.010 |
Delete response time histogram: each cell has the percentage of responses that take <= the time in the header and max is the max response time in seconds. For max values in the top 25% of the range have a red background and in the bottom 25% of the range have a green background. The red background is not used when the min value is within 80% of the max value.
| dbms | 256us | 1ms | 4ms | 16ms | 64ms | 256ms | 1s | 4s | 16s | gt | max |
|---|---|---|---|---|---|---|---|---|---|---|---|
| my5651_rel_native_lto.cz10a_u | 25.455 | 72.844 | 1.701 | 0.053 | |||||||
| my5740_rel_native_lto.cz10a_u | 85.462 | 14.428 | 0.110 | 0.028 | |||||||
| my5740_rel_native_lto.cz10aps0_u | 96.278 | 3.259 | 0.464 | 0.045 | |||||||
| my8033_rel_native_lto.cz10a_u | 99.953 | 0.046 | 0.001 | 0.051 | |||||||
| my8033_rel_native_lto.cz10aps0_u | 99.957 | 0.043 | 0.010 |
Performance metrics for the DBMS listed above. Some are normalized by throughput, others are not. Legend for results is here.
ips	qps	rps	rmbps	wps	wmbps	rpq	rkbpq	wpi	wkbpi	csps	cpups	cspq	cpupq	dbgb1	dbgb2	rss	maxop	p50	p99	tag
2381	142018	136	1.2	649.3	18.7	0.001	0.009	0.273	8.046	562441	33.5	3.960	189	237.3	433.8	215.9	0.041	5914	5402	my5651_rel_native_lto.cz10a_u
2381	126370	54	0.8	1324.3	37.3	0.000	0.007	0.556	16.042	502063	32.8	3.973	208	248.1	447.7	216.9	0.022	5322	4859	my5740_rel_native_lto.cz10a_u
2381	131022	54	0.8	1295.6	36.5	0.000	0.007	0.544	15.711	520018	32.1	3.969	196	247.7	446.2	216.7	0.043	5498	5002	my5740_rel_native_lto.cz10aps0_u
2381	104266	53	0.8	856.7	24.6	0.001	0.008	0.360	10.566	431686	32.1	4.140	246	258.8	387.4	216.2	0.048	4365	3997	my8033_rel_native_lto.cz10a_u
2382	110077	53	0.8	795.8	22.9	0.000	0.008	0.334	9.827	461820	31.8	4.195	231	260.3	388.9	216.0	0.023	4619	4220	my8033_rel_native_lto.cz10aps0_u
qp100.L2
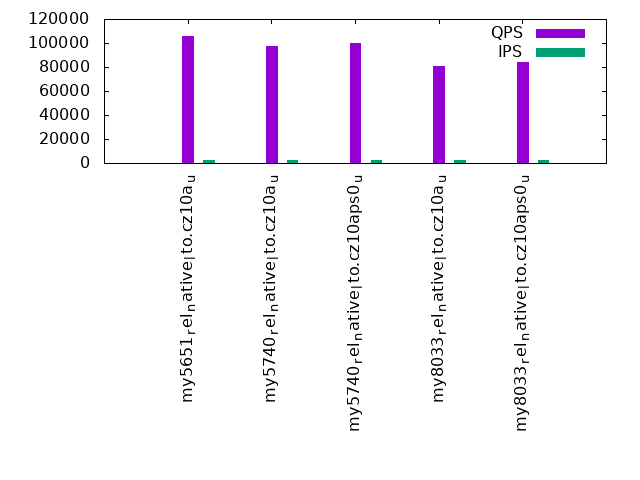
qp100.L2: point queries with 100 insert/s per client. Graphs for performance per 1-second interval are here.
Average throughput:
Query response time histogram: each cell has the percentage of responses that take <= the time in the header and max is the max response time in seconds. For max values in the top 25% of the range have a red background and in the bottom 25% of the range have a green background. The red background is not used when the min value is within 80% of the max value.
| dbms | 256us | 1ms | 4ms | 16ms | 64ms | 256ms | 1s | 4s | 16s | gt | max |
|---|---|---|---|---|---|---|---|---|---|---|---|
| my5651_rel_native_lto.cz10a_u | 91.572 | 8.399 | 0.028 | nonzero | nonzero | 0.022 | |||||
| my5740_rel_native_lto.cz10a_u | 76.224 | 23.751 | 0.025 | nonzero | nonzero | 0.022 | |||||
| my5740_rel_native_lto.cz10aps0_u | 80.974 | 19.002 | 0.024 | nonzero | nonzero | 0.021 | |||||
| my8033_rel_native_lto.cz10a_u | 36.986 | 62.981 | 0.034 | nonzero | 0.007 | ||||||
| my8033_rel_native_lto.cz10aps0_u | 46.478 | 53.491 | 0.031 | nonzero | nonzero | 0.023 |
Insert response time histogram: each cell has the percentage of responses that take <= the time in the header and max is the max response time in seconds. For max values in the top 25% of the range have a red background and in the bottom 25% of the range have a green background. The red background is not used when the min value is within 80% of the max value.
| dbms | 256us | 1ms | 4ms | 16ms | 64ms | 256ms | 1s | 4s | 16s | gt | max |
|---|---|---|---|---|---|---|---|---|---|---|---|
| my5651_rel_native_lto.cz10a_u | 14.054 | 85.921 | 0.025 | 0.048 | |||||||
| my5740_rel_native_lto.cz10a_u | 67.053 | 32.947 | 0.012 | ||||||||
| my5740_rel_native_lto.cz10aps0_u | 97.633 | 2.367 | 0.010 | ||||||||
| my8033_rel_native_lto.cz10a_u | 94.876 | 5.122 | 0.003 | 0.037 | |||||||
| my8033_rel_native_lto.cz10aps0_u | 94.952 | 5.048 | 0.009 |
Delete response time histogram: each cell has the percentage of responses that take <= the time in the header and max is the max response time in seconds. For max values in the top 25% of the range have a red background and in the bottom 25% of the range have a green background. The red background is not used when the min value is within 80% of the max value.
| dbms | 256us | 1ms | 4ms | 16ms | 64ms | 256ms | 1s | 4s | 16s | gt | max |
|---|---|---|---|---|---|---|---|---|---|---|---|
| my5651_rel_native_lto.cz10a_u | 21.830 | 78.153 | 0.017 | 0.048 | |||||||
| my5740_rel_native_lto.cz10a_u | 84.488 | 15.512 | 0.009 | ||||||||
| my5740_rel_native_lto.cz10aps0_u | 99.834 | 0.166 | 0.006 | ||||||||
| my8033_rel_native_lto.cz10a_u | 99.975 | 0.022 | 0.003 | 0.029 | |||||||
| my8033_rel_native_lto.cz10aps0_u | 99.975 | 0.025 | 0.007 |
Performance metrics for the DBMS listed above. Some are normalized by throughput, others are not. Legend for results is here.
ips	qps	rps	rmbps	wps	wmbps	rpq	rkbpq	wpi	wkbpi	csps	cpups	cspq	cpupq	dbgb1	dbgb2	rss	maxop	p50	p99	tag
2381	106114	612	8.7	829.1	23.6	0.006	0.084	0.348	10.142	448587	32.9	4.227	248	237.3	433.8	215.9	0.022	4460	4220	my5651_rel_native_lto.cz10a_u
2381	97232	544	8.5	368.8	10.7	0.006	0.089	0.155	4.588	409417	31.9	4.211	262	248.1	447.7	216.9	0.022	4077	3836	my5740_rel_native_lto.cz10a_u
2381	99977	545	8.5	386.3	11.2	0.005	0.087	0.162	4.798	420648	31.7	4.207	254	247.7	446.2	216.7	0.021	4188	3963	my5740_rel_native_lto.cz10aps0_u
2382	80693	546	8.5	709.5	20.3	0.007	0.108	0.298	8.741	361793	31.9	4.484	316	258.8	387.4	216.2	0.007	3373	3181	my8033_rel_native_lto.cz10a_u
2381	84315	546	8.5	721.6	20.7	0.006	0.104	0.303	8.883	379444	31.8	4.500	302	260.3	388.9	216.0	0.023	3596	3373	my8033_rel_native_lto.cz10aps0_u
qr500.L3
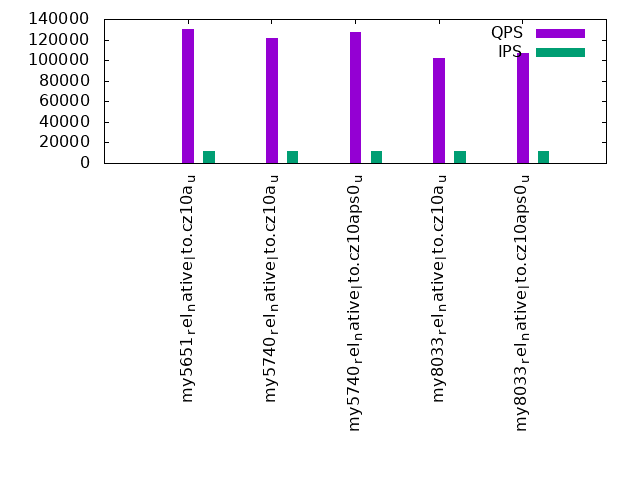
qr500.L3: range queries with 500 insert/s per client. Graphs for performance per 1-second interval are here.
Average throughput:
Query response time histogram: each cell has the percentage of responses that take <= the time in the header and max is the max response time in seconds. For max values in the top 25% of the range have a red background and in the bottom 25% of the range have a green background. The red background is not used when the min value is within 80% of the max value.
| dbms | 256us | 1ms | 4ms | 16ms | 64ms | 256ms | 1s | 4s | 16s | gt | max |
|---|---|---|---|---|---|---|---|---|---|---|---|
| my5651_rel_native_lto.cz10a_u | 95.343 | 4.563 | 0.072 | 0.023 | nonzero | 0.032 | |||||
| my5740_rel_native_lto.cz10a_u | 94.512 | 5.480 | 0.006 | 0.002 | nonzero | 0.025 | |||||
| my5740_rel_native_lto.cz10aps0_u | 96.798 | 3.196 | 0.005 | 0.001 | nonzero | 0.026 | |||||
| my8033_rel_native_lto.cz10a_u | 80.763 | 19.229 | 0.007 | nonzero | nonzero | 0.018 | |||||
| my8033_rel_native_lto.cz10aps0_u | 87.750 | 12.242 | 0.009 | nonzero | nonzero | 0.030 |
Insert response time histogram: each cell has the percentage of responses that take <= the time in the header and max is the max response time in seconds. For max values in the top 25% of the range have a red background and in the bottom 25% of the range have a green background. The red background is not used when the min value is within 80% of the max value.
| dbms | 256us | 1ms | 4ms | 16ms | 64ms | 256ms | 1s | 4s | 16s | gt | max |
|---|---|---|---|---|---|---|---|---|---|---|---|
| my5651_rel_native_lto.cz10a_u | 1.786 | 39.030 | 59.183 | 0.001 | 0.078 | ||||||
| my5740_rel_native_lto.cz10a_u | 11.958 | 87.756 | 0.286 | 0.039 | |||||||
| my5740_rel_native_lto.cz10aps0_u | 20.839 | 79.050 | 0.110 | 0.034 | |||||||
| my8033_rel_native_lto.cz10a_u | 50.802 | 49.185 | 0.014 | 0.041 | |||||||
| my8033_rel_native_lto.cz10aps0_u | 46.590 | 53.402 | 0.008 | 0.034 |
Delete response time histogram: each cell has the percentage of responses that take <= the time in the header and max is the max response time in seconds. For max values in the top 25% of the range have a red background and in the bottom 25% of the range have a green background. The red background is not used when the min value is within 80% of the max value.
| dbms | 256us | 1ms | 4ms | 16ms | 64ms | 256ms | 1s | 4s | 16s | gt | max |
|---|---|---|---|---|---|---|---|---|---|---|---|
| my5651_rel_native_lto.cz10a_u | 2.659 | 43.403 | 53.936 | 0.002 | 0.084 | ||||||
| my5740_rel_native_lto.cz10a_u | 17.610 | 82.168 | 0.222 | 0.037 | |||||||
| my5740_rel_native_lto.cz10aps0_u | 30.209 | 69.706 | 0.084 | 0.031 | |||||||
| my8033_rel_native_lto.cz10a_u | 95.217 | 4.777 | 0.006 | 0.046 | |||||||
| my8033_rel_native_lto.cz10aps0_u | 93.746 | 6.249 | 0.005 | 0.034 |
Performance metrics for the DBMS listed above. Some are normalized by throughput, others are not. Legend for results is here.
ips	qps	rps	rmbps	wps	wmbps	rpq	rkbpq	wpi	wkbpi	csps	cpups	cspq	cpupq	dbgb1	dbgb2	rss	maxop	p50	p99	tag
11907	130264	347	1.8	1751.4	51.7	0.003	0.014	0.147	4.446	525668	42.4	4.035	260	237.3	433.8	215.9	0.032	5418	4956	my5651_rel_native_lto.cz10a_u
11907	121975	39	0.6	1546.2	45.9	0.000	0.005	0.130	3.950	489534	37.5	4.013	246	248.1	447.7	216.9	0.025	5115	4667	my5740_rel_native_lto.cz10a_u
11907	127440	40	0.6	1546.7	46.0	0.000	0.005	0.130	3.956	510822	36.1	4.008	227	247.7	446.2	216.7	0.026	5354	4907	my5740_rel_native_lto.cz10aps0_u
11907	101703	42	0.7	1638.6	49.2	0.000	0.007	0.138	4.232	469960	35.2	4.621	277	258.8	387.4	216.2	0.018	4300	3931	my8033_rel_native_lto.cz10a_u
11907	107335	42	0.6	1636.9	49.2	0.000	0.006	0.137	4.227	501327	34.8	4.671	259	260.3	388.9	216.0	0.030	4444	4091	my8033_rel_native_lto.cz10aps0_u
qp500.L4
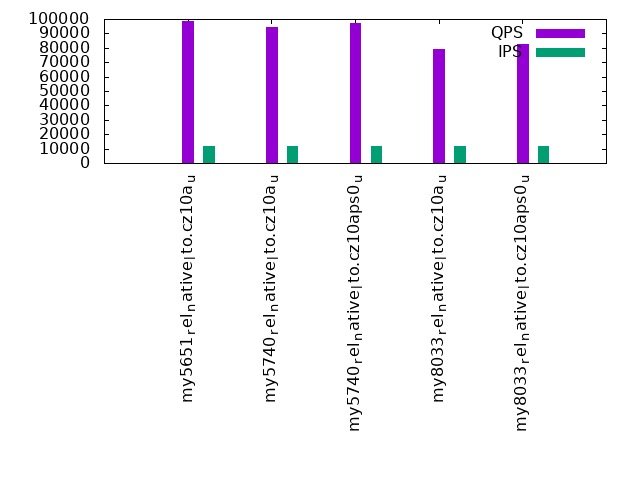
qp500.L4: point queries with 500 insert/s per client. Graphs for performance per 1-second interval are here.
Average throughput:
Query response time histogram: each cell has the percentage of responses that take <= the time in the header and max is the max response time in seconds. For max values in the top 25% of the range have a red background and in the bottom 25% of the range have a green background. The red background is not used when the min value is within 80% of the max value.
| dbms | 256us | 1ms | 4ms | 16ms | 64ms | 256ms | 1s | 4s | 16s | gt | max |
|---|---|---|---|---|---|---|---|---|---|---|---|
| my5651_rel_native_lto.cz10a_u | 82.202 | 17.674 | 0.099 | 0.026 | nonzero | 0.025 | |||||
| my5740_rel_native_lto.cz10a_u | 70.933 | 29.057 | 0.008 | 0.002 | nonzero | 0.024 | |||||
| my5740_rel_native_lto.cz10aps0_u | 76.017 | 23.974 | 0.007 | 0.002 | nonzero | 0.026 | |||||
| my8033_rel_native_lto.cz10a_u | 34.579 | 65.409 | 0.012 | nonzero | nonzero | 0.023 | |||||
| my8033_rel_native_lto.cz10aps0_u | 43.250 | 56.741 | 0.008 | nonzero | 0.016 |
Insert response time histogram: each cell has the percentage of responses that take <= the time in the header and max is the max response time in seconds. For max values in the top 25% of the range have a red background and in the bottom 25% of the range have a green background. The red background is not used when the min value is within 80% of the max value.
| dbms | 256us | 1ms | 4ms | 16ms | 64ms | 256ms | 1s | 4s | 16s | gt | max |
|---|---|---|---|---|---|---|---|---|---|---|---|
| my5651_rel_native_lto.cz10a_u | 1.529 | 43.479 | 54.992 | 0.058 | |||||||
| my5740_rel_native_lto.cz10a_u | 10.555 | 89.243 | 0.202 | 0.035 | |||||||
| my5740_rel_native_lto.cz10aps0_u | 15.090 | 84.757 | 0.153 | 0.035 | |||||||
| my8033_rel_native_lto.cz10a_u | 42.543 | 57.451 | 0.006 | 0.027 | |||||||
| my8033_rel_native_lto.cz10aps0_u | 55.732 | 44.265 | 0.003 | 0.050 |
Delete response time histogram: each cell has the percentage of responses that take <= the time in the header and max is the max response time in seconds. For max values in the top 25% of the range have a red background and in the bottom 25% of the range have a green background. The red background is not used when the min value is within 80% of the max value.
| dbms | 256us | 1ms | 4ms | 16ms | 64ms | 256ms | 1s | 4s | 16s | gt | max |
|---|---|---|---|---|---|---|---|---|---|---|---|
| my5651_rel_native_lto.cz10a_u | 2.058 | 48.742 | 49.200 | 0.058 | |||||||
| my5740_rel_native_lto.cz10a_u | 16.151 | 83.697 | 0.152 | 0.035 | |||||||
| my5740_rel_native_lto.cz10aps0_u | 22.986 | 76.899 | 0.115 | 0.033 | |||||||
| my8033_rel_native_lto.cz10a_u | 90.412 | 9.584 | 0.004 | 0.026 | |||||||
| my8033_rel_native_lto.cz10aps0_u | 96.581 | 3.417 | 0.002 | 0.048 |
Performance metrics for the DBMS listed above. Some are normalized by throughput, others are not. Legend for results is here.
ips	qps	rps	rmbps	wps	wmbps	rpq	rkbpq	wpi	wkbpi	csps	cpups	cspq	cpupq	dbgb1	dbgb2	rss	maxop	p50	p99	tag
11907	98950	305	1.2	2578.4	74.6	0.003	0.013	0.217	6.414	431406	41.3	4.360	334	237.3	433.8	215.9	0.025	4108	3900	my5651_rel_native_lto.cz10a_u
11907	94520	5	0.1	1618.5	48.0	0.000	0.001	0.136	4.131	405339	36.7	4.288	311	248.1	447.7	216.9	0.024	3964	3756	my5740_rel_native_lto.cz10a_u
11907	97270	6	0.1	1620.4	48.1	0.000	0.001	0.136	4.139	419427	35.9	4.312	295	247.7	446.2	216.7	0.026	4076	3852	my5740_rel_native_lto.cz10aps0_u
11907	79173	7	0.1	1795.0	53.5	0.000	0.001	0.151	4.603	402867	34.8	5.088	352	258.8	387.4	216.2	0.023	3325	3149	my8033_rel_native_lto.cz10a_u
11907	82730	7	0.1	1812.5	54.1	0.000	0.001	0.152	4.648	423343	34.5	5.117	334	260.3	388.9	216.0	0.016	3469	3293	my8033_rel_native_lto.cz10aps0_u
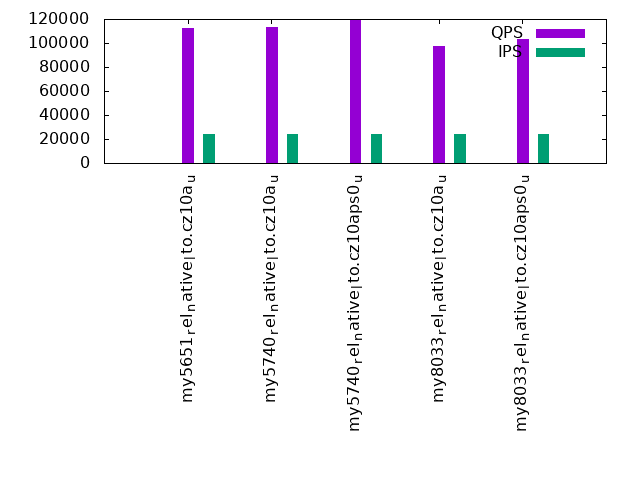
qr1000.L5
qr1000.L5: range queries with 1000 insert/s per client. Graphs for performance per 1-second interval are here.
Average throughput:
Query response time histogram: each cell has the percentage of responses that take <= the time in the header and max is the max response time in seconds. For max values in the top 25% of the range have a red background and in the bottom 25% of the range have a green background. The red background is not used when the min value is within 80% of the max value.
| dbms | 256us | 1ms | 4ms | 16ms | 64ms | 256ms | 1s | 4s | 16s | gt | max |
|---|---|---|---|---|---|---|---|---|---|---|---|
| my5651_rel_native_lto.cz10a_u | 87.559 | 12.089 | 0.310 | 0.040 | 0.002 | 0.064 | |||||
| my5740_rel_native_lto.cz10a_u | 88.264 | 11.662 | 0.056 | 0.018 | nonzero | nonzero | 0.064 | ||||
| my5740_rel_native_lto.cz10aps0_u | 92.030 | 7.904 | 0.049 | 0.017 | nonzero | 0.031 | |||||
| my8033_rel_native_lto.cz10a_u | 76.386 | 23.561 | 0.053 | 0.001 | nonzero | 0.044 | |||||
| my8033_rel_native_lto.cz10aps0_u | 84.012 | 15.924 | 0.063 | 0.001 | nonzero | 0.058 |
Insert response time histogram: each cell has the percentage of responses that take <= the time in the header and max is the max response time in seconds. For max values in the top 25% of the range have a red background and in the bottom 25% of the range have a green background. The red background is not used when the min value is within 80% of the max value.
| dbms | 256us | 1ms | 4ms | 16ms | 64ms | 256ms | 1s | 4s | 16s | gt | max |
|---|---|---|---|---|---|---|---|---|---|---|---|
| my5651_rel_native_lto.cz10a_u | 0.464 | 14.191 | 85.345 | 0.062 | |||||||
| my5740_rel_native_lto.cz10a_u | 1.915 | 94.320 | 3.765 | nonzero | 0.076 | ||||||
| my5740_rel_native_lto.cz10aps0_u | 2.855 | 94.820 | 2.325 | 0.047 | |||||||
| my8033_rel_native_lto.cz10a_u | 18.916 | 81.042 | 0.042 | 0.055 | |||||||
| my8033_rel_native_lto.cz10aps0_u | 11.634 | 88.309 | 0.055 | 0.002 | 0.105 |
Delete response time histogram: each cell has the percentage of responses that take <= the time in the header and max is the max response time in seconds. For max values in the top 25% of the range have a red background and in the bottom 25% of the range have a green background. The red background is not used when the min value is within 80% of the max value.
| dbms | 256us | 1ms | 4ms | 16ms | 64ms | 256ms | 1s | 4s | 16s | gt | max |
|---|---|---|---|---|---|---|---|---|---|---|---|
| my5651_rel_native_lto.cz10a_u | 0.480 | 15.361 | 84.159 | 0.063 | |||||||
| my5740_rel_native_lto.cz10a_u | 1.517 | 95.751 | 2.732 | nonzero | 0.079 | ||||||
| my5740_rel_native_lto.cz10aps0_u | 2.069 | 96.281 | 1.650 | 0.044 | |||||||
| my8033_rel_native_lto.cz10a_u | 55.427 | 44.549 | 0.024 | 0.052 | |||||||
| my8033_rel_native_lto.cz10aps0_u | 47.393 | 52.576 | 0.030 | 0.001 | 0.100 |
Performance metrics for the DBMS listed above. Some are normalized by throughput, others are not. Legend for results is here.
ips	qps	rps	rmbps	wps	wmbps	rpq	rkbpq	wpi	wkbpi	csps	cpups	cspq	cpupq	dbgb1	dbgb2	rss	maxop	p50	p99	tag
23828	112780	642	3.5	2826.3	84.7	0.006	0.032	0.119	3.640	467639	54.5	4.146	387	237.3	433.8	215.9	0.064	4683	4316	my5651_rel_native_lto.cz10a_u
23828	113349	92	1.4	2882.3	86.4	0.001	0.013	0.121	3.713	450750	46.4	3.977	327	248.1	447.7	216.9	0.064	4731	4332	my5740_rel_native_lto.cz10a_u
23828	118943	94	1.5	2892.9	86.7	0.001	0.013	0.121	3.727	477600	44.2	4.015	297	247.7	446.2	216.8	0.031	4987	4555	my5740_rel_native_lto.cz10aps0_u
23828	97896	98	1.5	3374.7	101.5	0.001	0.016	0.142	4.360	524430	39.2	5.357	320	258.8	387.4	216.2	0.044	4108	3788	my8033_rel_native_lto.cz10a_u
23828	103571	97	1.5	3380.4	101.7	0.001	0.015	0.142	4.371	546290	38.8	5.275	300	260.3	388.9	216.0	0.058	4316	3948	my8033_rel_native_lto.cz10aps0_u
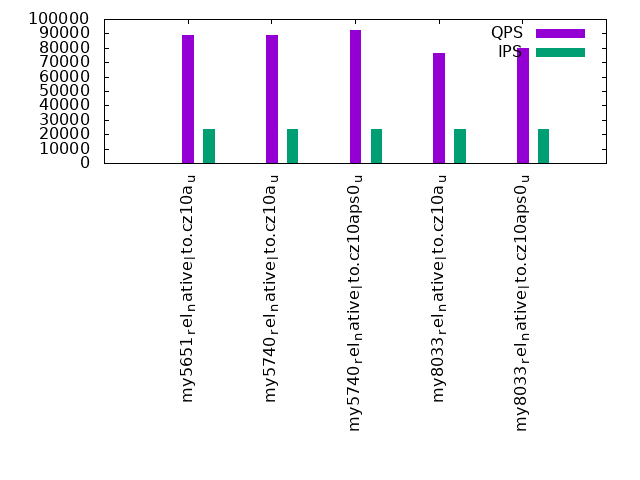
qp1000.L6
qp1000.L6: point queries with 1000 insert/s per client. Graphs for performance per 1-second interval are here.
Average throughput:
Query response time histogram: each cell has the percentage of responses that take <= the time in the header and max is the max response time in seconds. For max values in the top 25% of the range have a red background and in the bottom 25% of the range have a green background. The red background is not used when the min value is within 80% of the max value.
| dbms | 256us | 1ms | 4ms | 16ms | 64ms | 256ms | 1s | 4s | 16s | gt | max |
|---|---|---|---|---|---|---|---|---|---|---|---|
| my5651_rel_native_lto.cz10a_u | 67.536 | 32.111 | 0.309 | 0.042 | 0.002 | nonzero | 0.087 | ||||
| my5740_rel_native_lto.cz10a_u | 62.138 | 37.782 | 0.061 | 0.019 | nonzero | 0.030 | |||||
| my5740_rel_native_lto.cz10aps0_u | 68.808 | 31.128 | 0.048 | 0.016 | nonzero | 0.030 | |||||
| my8033_rel_native_lto.cz10a_u | 30.623 | 69.308 | 0.068 | 0.001 | nonzero | 0.024 | |||||
| my8033_rel_native_lto.cz10aps0_u | 39.206 | 60.728 | 0.064 | 0.001 | nonzero | 0.048 |
Insert response time histogram: each cell has the percentage of responses that take <= the time in the header and max is the max response time in seconds. For max values in the top 25% of the range have a red background and in the bottom 25% of the range have a green background. The red background is not used when the min value is within 80% of the max value.
| dbms | 256us | 1ms | 4ms | 16ms | 64ms | 256ms | 1s | 4s | 16s | gt | max |
|---|---|---|---|---|---|---|---|---|---|---|---|
| my5651_rel_native_lto.cz10a_u | 0.516 | 22.897 | 76.584 | 0.003 | 0.128 | ||||||
| my5740_rel_native_lto.cz10a_u | 2.825 | 94.106 | 3.069 | 0.047 | |||||||
| my5740_rel_native_lto.cz10aps0_u | 5.031 | 93.483 | 1.486 | 0.047 | |||||||
| my8033_rel_native_lto.cz10a_u | 17.857 | 82.089 | 0.053 | 0.002 | 0.072 | ||||||
| my8033_rel_native_lto.cz10aps0_u | 18.922 | 81.031 | 0.046 | 0.002 | 0.104 |
Delete response time histogram: each cell has the percentage of responses that take <= the time in the header and max is the max response time in seconds. For max values in the top 25% of the range have a red background and in the bottom 25% of the range have a green background. The red background is not used when the min value is within 80% of the max value.
| dbms | 256us | 1ms | 4ms | 16ms | 64ms | 256ms | 1s | 4s | 16s | gt | max |
|---|---|---|---|---|---|---|---|---|---|---|---|
| my5651_rel_native_lto.cz10a_u | 0.341 | 27.226 | 72.430 | 0.003 | 0.127 | ||||||
| my5740_rel_native_lto.cz10a_u | 2.623 | 95.193 | 2.184 | 0.057 | |||||||
| my5740_rel_native_lto.cz10aps0_u | 5.291 | 93.661 | 1.048 | 0.045 | |||||||
| my8033_rel_native_lto.cz10a_u | 59.437 | 40.530 | 0.032 | 0.001 | 0.071 | ||||||
| my8033_rel_native_lto.cz10aps0_u | 66.492 | 33.480 | 0.027 | 0.001 | 0.092 |
Performance metrics for the DBMS listed above. Some are normalized by throughput, others are not. Legend for results is here.
ips	qps	rps	rmbps	wps	wmbps	rpq	rkbpq	wpi	wkbpi	csps	cpups	cspq	cpupq	dbgb1	dbgb2	rss	maxop	p50	p99	tag
23834	88731	548	2.5	2894.9	86.8	0.006	0.028	0.121	3.728	401861	52.2	4.529	471	237.3	433.8	215.9	0.087	3692	3469	my5651_rel_native_lto.cz10a_u
23828	88875	35	0.5	2904.5	86.9	0.000	0.006	0.122	3.736	380295	45.4	4.279	409	248.1	447.7	216.9	0.030	3724	3516	my5740_rel_native_lto.cz10a_u
23834	92584	36	0.6	2906.0	87.1	0.000	0.006	0.122	3.741	398963	43.3	4.309	374	247.7	446.2	216.8	0.030	3900	3676	my5740_rel_native_lto.cz10aps0_u
23828	76283	41	0.6	3394.2	102.0	0.001	0.009	0.142	4.384	471491	39.2	6.181	411	258.8	387.4	216.2	0.024	3245	3053	my8033_rel_native_lto.cz10a_u
23828	79769	40	0.6	3405.6	102.4	0.001	0.008	0.143	4.401	482703	39.1	6.051	392	260.3	388.9	216.0	0.048	3357	3181	my8033_rel_native_lto.cz10aps0_u
l.i0
l.i0: load without secondary indexes
Performance metrics for all DBMS, not just the ones listed above. Some are normalized by throughput, others are not. Legend for results is here.
ips	qps	rps	rmbps	wps	wmbps	rpq	rkbpq	wpi	wkbpi	csps	cpups	cspq	cpupq	dbgb1	dbgb2	rss	maxop	p50	p99	tag
473840	0	0	0.0	2352.3	114.5	0.000	0.000	0.005	0.247	68922	38.4	0.145	65	31.8	160.3	45.7	0.091	19590	17482	my5651_rel_native_lto.cz10a_u
567376	0	0	0.0	2823.8	134.9	0.000	0.000	0.005	0.244	80138	40.4	0.141	57	31.8	160.3	47.2	0.091	24176	21579	my5740_rel_native_lto.cz10a_u
654843	0	0	0.0	3208.3	154.4	0.000	0.000	0.005	0.241	91120	42.5	0.139	52	31.8	160.3	46.8	0.114	28072	24979	my5740_rel_native_lto.cz10aps0_u
883978	0	0	0.0	4191.9	224.0	0.000	0.000	0.005	0.259	198816	51.4	0.225	47	31.7	160.3	47.2	0.118	38761	32568	my8033_rel_native_lto.cz10a_u
907372	0	0	0.0	4306.1	230.2	0.000	0.000	0.005	0.260	179242	49.8	0.198	44	31.7	160.3	46.2	0.117	39061	31369	my8033_rel_native_lto.cz10aps0_u
l.x
l.x: create secondary indexes
Performance metrics for all DBMS, not just the ones listed above. Some are normalized by throughput, others are not. Legend for results is here.
ips	qps	rps	rmbps	wps	wmbps	rpq	rkbpq	wpi	wkbpi	csps	cpups	cspq	cpupq	dbgb1	dbgb2	rss	maxop	p50	p99	tag
335196	0	383	1.5	18793.4	649.4	0.001	0.005	0.056	1.984	68891	30.6	0.206	73	66.9	195.4	81.9	0.002	NA	NA	my5651_rel_native_lto.cz10a_u
2162163	0	0	0.0	36162.6	1956.4	0.000	0.000	0.017	0.927	150135	30.9	0.069	11	72.8	201.4	82.1	0.003	NA	NA	my5740_rel_native_lto.cz10a_u
1221374	0	0	0.0	20542.5	1107.5	0.000	0.000	0.017	0.929	119098	29.6	0.098	19	72.8	201.4	83.3	0.002	NA	NA	my5740_rel_native_lto.cz10aps0_u
1467890	0	8177	388.0	32472.9	1202.6	0.006	0.271	0.022	0.839	174909	73.9	0.119	40	72.7	201.2	69.3	0.005	NA	NA	my8033_rel_native_lto.cz10a_u
1486068	0	8344	396.0	32830.3	1217.9	0.006	0.273	0.022	0.839	220709	71.1	0.149	38	72.7	201.2	75.2	0.010	NA	NA	my8033_rel_native_lto.cz10aps0_u
l.i1
l.i1: continue load after secondary indexes created with 50 inserts per transaction
Performance metrics for all DBMS, not just the ones listed above. Some are normalized by throughput, others are not. Legend for results is here.
ips	qps	rps	rmbps	wps	wmbps	rpq	rkbpq	wpi	wkbpi	csps	cpups	cspq	cpupq	dbgb1	dbgb2	rss	maxop	p50	p99	tag
57341	0	1642	7.0	5644.5	179.3	0.029	0.124	0.098	3.202	131582	65.3	2.295	911	226.9	403.1	215.8	0.254	2398	1998	my5651_rel_native_lto.cz10a_u
105506	0	124	1.9	9392.1	300.8	0.001	0.019	0.089	2.919	112699	69.3	1.068	525	235.6	415.0	216.8	3.793	4396	3996	my5740_rel_native_lto.cz10a_u
119195	0	140	2.2	10283.0	330.7	0.001	0.018	0.086	2.841	129341	69.5	1.085	466	235.8	414.6	216.7	1.200	4995	4495	my5740_rel_native_lto.cz10aps0_u
187171	0	1229	19.2	16435.2	540.7	0.007	0.105	0.088	2.958	865898	57.0	4.626	244	247.7	437.8	216.2	0.540	7892	3496	my8033_rel_native_lto.cz10a_u
194489	0	1225	19.1	16855.3	555.6	0.006	0.101	0.087	2.925	825354	58.7	4.244	241	246.9	438.0	216.0	0.539	8541	3846	my8033_rel_native_lto.cz10aps0_u
l.i2
l.i2: continue load after secondary indexes created with 5 inserts per transaction
Performance metrics for all DBMS, not just the ones listed above. Some are normalized by throughput, others are not. Legend for results is here.
ips	qps	rps	rmbps	wps	wmbps	rpq	rkbpq	wpi	wkbpi	csps	cpups	cspq	cpupq	dbgb1	dbgb2	rss	maxop	p50	p99	tag
38505	0	5508	30.4	6180.2	185.2	0.143	0.808	0.161	4.925	340195	54.3	8.835	1128	237.3	433.8	215.9	0.130	1603	1484	my5651_rel_native_lto.cz10a_u
77046	0	1516	23.7	10452.3	317.3	0.020	0.315	0.136	4.217	552664	57.4	7.173	596	248.1	447.7	216.8	0.118	3242	2962	my5740_rel_native_lto.cz10a_u
84240	0	1676	26.2	11178.0	339.6	0.020	0.318	0.133	4.129	596326	57.0	7.079	541	247.7	446.2	216.7	0.109	3536	3257	my5740_rel_native_lto.cz10aps0_u
117302	0	2740	42.8	14961.9	466.3	0.023	0.374	0.128	4.070	1194482	62.7	10.183	428	258.8	486.2	216.2	0.142	5035	4495	my8033_rel_native_lto.cz10a_u
120603	0	2831	44.2	15320.3	478.2	0.023	0.376	0.127	4.060	1218526	62.8	10.104	417	260.3	488.6	216.0	0.119	4965	4470	my8033_rel_native_lto.cz10aps0_u
qr100.L1
qr100.L1: range queries with 100 insert/s per client
Performance metrics for all DBMS, not just the ones listed above. Some are normalized by throughput, others are not. Legend for results is here.
ips	qps	rps	rmbps	wps	wmbps	rpq	rkbpq	wpi	wkbpi	csps	cpups	cspq	cpupq	dbgb1	dbgb2	rss	maxop	p50	p99	tag
2381	142018	136	1.2	649.3	18.7	0.001	0.009	0.273	8.046	562441	33.5	3.960	189	237.3	433.8	215.9	0.041	5914	5402	my5651_rel_native_lto.cz10a_u
2381	126370	54	0.8	1324.3	37.3	0.000	0.007	0.556	16.042	502063	32.8	3.973	208	248.1	447.7	216.9	0.022	5322	4859	my5740_rel_native_lto.cz10a_u
2381	131022	54	0.8	1295.6	36.5	0.000	0.007	0.544	15.711	520018	32.1	3.969	196	247.7	446.2	216.7	0.043	5498	5002	my5740_rel_native_lto.cz10aps0_u
2381	104266	53	0.8	856.7	24.6	0.001	0.008	0.360	10.566	431686	32.1	4.140	246	258.8	387.4	216.2	0.048	4365	3997	my8033_rel_native_lto.cz10a_u
2382	110077	53	0.8	795.8	22.9	0.000	0.008	0.334	9.827	461820	31.8	4.195	231	260.3	388.9	216.0	0.023	4619	4220	my8033_rel_native_lto.cz10aps0_u
qp100.L2
qp100.L2: point queries with 100 insert/s per client
Performance metrics for all DBMS, not just the ones listed above. Some are normalized by throughput, others are not. Legend for results is here.
ips	qps	rps	rmbps	wps	wmbps	rpq	rkbpq	wpi	wkbpi	csps	cpups	cspq	cpupq	dbgb1	dbgb2	rss	maxop	p50	p99	tag
2381	106114	612	8.7	829.1	23.6	0.006	0.084	0.348	10.142	448587	32.9	4.227	248	237.3	433.8	215.9	0.022	4460	4220	my5651_rel_native_lto.cz10a_u
2381	97232	544	8.5	368.8	10.7	0.006	0.089	0.155	4.588	409417	31.9	4.211	262	248.1	447.7	216.9	0.022	4077	3836	my5740_rel_native_lto.cz10a_u
2381	99977	545	8.5	386.3	11.2	0.005	0.087	0.162	4.798	420648	31.7	4.207	254	247.7	446.2	216.7	0.021	4188	3963	my5740_rel_native_lto.cz10aps0_u
2382	80693	546	8.5	709.5	20.3	0.007	0.108	0.298	8.741	361793	31.9	4.484	316	258.8	387.4	216.2	0.007	3373	3181	my8033_rel_native_lto.cz10a_u
2381	84315	546	8.5	721.6	20.7	0.006	0.104	0.303	8.883	379444	31.8	4.500	302	260.3	388.9	216.0	0.023	3596	3373	my8033_rel_native_lto.cz10aps0_u
qr500.L3
qr500.L3: range queries with 500 insert/s per client
Performance metrics for all DBMS, not just the ones listed above. Some are normalized by throughput, others are not. Legend for results is here.
ips	qps	rps	rmbps	wps	wmbps	rpq	rkbpq	wpi	wkbpi	csps	cpups	cspq	cpupq	dbgb1	dbgb2	rss	maxop	p50	p99	tag
11907	130264	347	1.8	1751.4	51.7	0.003	0.014	0.147	4.446	525668	42.4	4.035	260	237.3	433.8	215.9	0.032	5418	4956	my5651_rel_native_lto.cz10a_u
11907	121975	39	0.6	1546.2	45.9	0.000	0.005	0.130	3.950	489534	37.5	4.013	246	248.1	447.7	216.9	0.025	5115	4667	my5740_rel_native_lto.cz10a_u
11907	127440	40	0.6	1546.7	46.0	0.000	0.005	0.130	3.956	510822	36.1	4.008	227	247.7	446.2	216.7	0.026	5354	4907	my5740_rel_native_lto.cz10aps0_u
11907	101703	42	0.7	1638.6	49.2	0.000	0.007	0.138	4.232	469960	35.2	4.621	277	258.8	387.4	216.2	0.018	4300	3931	my8033_rel_native_lto.cz10a_u
11907	107335	42	0.6	1636.9	49.2	0.000	0.006	0.137	4.227	501327	34.8	4.671	259	260.3	388.9	216.0	0.030	4444	4091	my8033_rel_native_lto.cz10aps0_u
qp500.L4
qp500.L4: point queries with 500 insert/s per client
Performance metrics for all DBMS, not just the ones listed above. Some are normalized by throughput, others are not. Legend for results is here.
ips	qps	rps	rmbps	wps	wmbps	rpq	rkbpq	wpi	wkbpi	csps	cpups	cspq	cpupq	dbgb1	dbgb2	rss	maxop	p50	p99	tag
11907	98950	305	1.2	2578.4	74.6	0.003	0.013	0.217	6.414	431406	41.3	4.360	334	237.3	433.8	215.9	0.025	4108	3900	my5651_rel_native_lto.cz10a_u
11907	94520	5	0.1	1618.5	48.0	0.000	0.001	0.136	4.131	405339	36.7	4.288	311	248.1	447.7	216.9	0.024	3964	3756	my5740_rel_native_lto.cz10a_u
11907	97270	6	0.1	1620.4	48.1	0.000	0.001	0.136	4.139	419427	35.9	4.312	295	247.7	446.2	216.7	0.026	4076	3852	my5740_rel_native_lto.cz10aps0_u
11907	79173	7	0.1	1795.0	53.5	0.000	0.001	0.151	4.603	402867	34.8	5.088	352	258.8	387.4	216.2	0.023	3325	3149	my8033_rel_native_lto.cz10a_u
11907	82730	7	0.1	1812.5	54.1	0.000	0.001	0.152	4.648	423343	34.5	5.117	334	260.3	388.9	216.0	0.016	3469	3293	my8033_rel_native_lto.cz10aps0_u
qr1000.L5
qr1000.L5: range queries with 1000 insert/s per client
Performance metrics for all DBMS, not just the ones listed above. Some are normalized by throughput, others are not. Legend for results is here.
ips	qps	rps	rmbps	wps	wmbps	rpq	rkbpq	wpi	wkbpi	csps	cpups	cspq	cpupq	dbgb1	dbgb2	rss	maxop	p50	p99	tag
23828	112780	642	3.5	2826.3	84.7	0.006	0.032	0.119	3.640	467639	54.5	4.146	387	237.3	433.8	215.9	0.064	4683	4316	my5651_rel_native_lto.cz10a_u
23828	113349	92	1.4	2882.3	86.4	0.001	0.013	0.121	3.713	450750	46.4	3.977	327	248.1	447.7	216.9	0.064	4731	4332	my5740_rel_native_lto.cz10a_u
23828	118943	94	1.5	2892.9	86.7	0.001	0.013	0.121	3.727	477600	44.2	4.015	297	247.7	446.2	216.8	0.031	4987	4555	my5740_rel_native_lto.cz10aps0_u
23828	97896	98	1.5	3374.7	101.5	0.001	0.016	0.142	4.360	524430	39.2	5.357	320	258.8	387.4	216.2	0.044	4108	3788	my8033_rel_native_lto.cz10a_u
23828	103571	97	1.5	3380.4	101.7	0.001	0.015	0.142	4.371	546290	38.8	5.275	300	260.3	388.9	216.0	0.058	4316	3948	my8033_rel_native_lto.cz10aps0_u
qp1000.L6
qp1000.L6: point queries with 1000 insert/s per client
Performance metrics for all DBMS, not just the ones listed above. Some are normalized by throughput, others are not. Legend for results is here.
ips	qps	rps	rmbps	wps	wmbps	rpq	rkbpq	wpi	wkbpi	csps	cpups	cspq	cpupq	dbgb1	dbgb2	rss	maxop	p50	p99	tag
23834	88731	548	2.5	2894.9	86.8	0.006	0.028	0.121	3.728	401861	52.2	4.529	471	237.3	433.8	215.9	0.087	3692	3469	my5651_rel_native_lto.cz10a_u
23828	88875	35	0.5	2904.5	86.9	0.000	0.006	0.122	3.736	380295	45.4	4.279	409	248.1	447.7	216.9	0.030	3724	3516	my5740_rel_native_lto.cz10a_u
23834	92584	36	0.6	2906.0	87.1	0.000	0.006	0.122	3.741	398963	43.3	4.309	374	247.7	446.2	216.8	0.030	3900	3676	my5740_rel_native_lto.cz10aps0_u
23828	76283	41	0.6	3394.2	102.0	0.001	0.009	0.142	4.384	471491	39.2	6.181	411	258.8	387.4	216.2	0.024	3245	3053	my8033_rel_native_lto.cz10a_u
23828	79769	40	0.6	3405.6	102.4	0.001	0.008	0.143	4.401	482703	39.1	6.051	392	260.3	388.9	216.0	0.048	3357	3181	my8033_rel_native_lto.cz10aps0_u
l.i0
- l.i0: load without secondary indexes
- Legend for results is here.
- Each entry lists the percentage of responses that fit in that bucket (slower than max time for previous bucket, faster than min time for next bucket).
Insert response time histogram
256us	1ms	4ms	16ms	64ms	256ms	1s	4s	16s	gt	max	tag
0.000	0.292	9.555	89.820	0.295	0.038	0.000	0.000	0.000	0.000	0.091	my5651_rel_native_lto.cz10a_u
0.000	0.196	47.544	52.214	0.002	0.043	0.000	0.000	0.000	0.000	0.091	my5740_rel_native_lto.cz10a_u
0.000	0.199	90.834	8.920	0.004	0.043	0.000	0.000	0.000	0.000	0.114	my5740_rel_native_lto.cz10aps0_u
0.000	0.000	99.925	0.030	0.014	0.032	0.000	0.000	0.000	0.000	0.118	my8033_rel_native_lto.cz10a_u
0.000	0.000	99.933	0.020	0.021	0.026	0.000	0.000	0.000	0.000	0.117	my8033_rel_native_lto.cz10aps0_u
l.x
- l.x: create secondary indexes
- Legend for results is here.
- Each entry lists the percentage of responses that fit in that bucket (slower than max time for previous bucket, faster than min time for next bucket).
TODO - determine whether there is data for create index response time
l.i1
- l.i1: continue load after secondary indexes created with 50 inserts per transaction
- Legend for results is here.
- Each entry lists the percentage of responses that fit in that bucket (slower than max time for previous bucket, faster than min time for next bucket).
Insert response time histogram
256us	1ms	4ms	16ms	64ms	256ms	1s	4s	16s	gt	max	tag
0.000	0.000	0.012	5.503	94.473	0.012	0.000	0.000	0.000	0.000	0.254	my5651_rel_native_lto.cz10a_u
0.000	0.000	0.020	99.795	0.150	0.034	nonzero	nonzero	0.000	0.000	3.793	my5740_rel_native_lto.cz10a_u
0.000	0.000	0.029	99.796	0.147	0.028	nonzero	nonzero	0.000	0.000	1.200	my5740_rel_native_lto.cz10aps0_u
0.000	0.000	25.715	73.769	0.355	0.140	0.021	0.000	0.000	0.000	0.540	my8033_rel_native_lto.cz10a_u
0.000	0.000	26.253	73.240	0.325	0.164	0.018	0.000	0.000	0.000	0.539	my8033_rel_native_lto.cz10aps0_u
Delete response time histogram
256us	1ms	4ms	16ms	64ms	256ms	1s	4s	16s	gt	max	tag
0.000	0.000	0.017	8.896	91.078	0.008	0.000	0.000	0.000	0.000	0.149	my5651_rel_native_lto.cz10a_u
0.000	0.000	0.046	99.803	0.118	0.032	nonzero	nonzero	0.000	0.000	3.848	my5740_rel_native_lto.cz10a_u
0.000	0.000	0.073	99.770	0.130	0.027	nonzero	nonzero	0.000	0.000	1.178	my5740_rel_native_lto.cz10aps0_u
0.000	0.000	52.513	46.189	0.598	0.570	0.130	0.000	0.000	0.000	0.574	my8033_rel_native_lto.cz10a_u
0.000	0.000	55.173	43.440	0.578	0.657	0.153	0.000	0.000	0.000	0.730	my8033_rel_native_lto.cz10aps0_u
l.i2
- l.i2: continue load after secondary indexes created with 5 inserts per transaction
- Legend for results is here.
- Each entry lists the percentage of responses that fit in that bucket (slower than max time for previous bucket, faster than min time for next bucket).
Insert response time histogram
256us	1ms	4ms	16ms	64ms	256ms	1s	4s	16s	gt	max	tag
nonzero	0.437	82.597	16.960	0.006	nonzero	0.000	0.000	0.000	0.000	0.130	my5651_rel_native_lto.cz10a_u
nonzero	6.323	93.598	0.067	0.005	0.007	0.000	0.000	0.000	0.000	0.118	my5740_rel_native_lto.cz10a_u
nonzero	12.606	87.318	0.064	0.006	0.005	0.000	0.000	0.000	0.000	0.109	my5740_rel_native_lto.cz10aps0_u
0.000	69.926	29.932	0.133	0.003	0.007	0.000	0.000	0.000	0.000	0.142	my8033_rel_native_lto.cz10a_u
0.000	72.601	27.247	0.143	0.004	0.005	0.000	0.000	0.000	0.000	0.119	my8033_rel_native_lto.cz10aps0_u
Delete response time histogram
256us	1ms	4ms	16ms	64ms	256ms	1s	4s	16s	gt	max	tag
nonzero	0.523	83.640	15.829	0.008	nonzero	0.000	0.000	0.000	0.000	0.132	my5651_rel_native_lto.cz10a_u
nonzero	5.884	94.036	0.067	0.006	0.007	0.000	0.000	0.000	0.000	0.118	my5740_rel_native_lto.cz10a_u
nonzero	11.735	88.187	0.065	0.007	0.005	0.000	0.000	0.000	0.000	0.109	my5740_rel_native_lto.cz10aps0_u
0.000	75.394	24.447	0.150	0.003	0.007	0.000	0.000	0.000	0.000	0.120	my8033_rel_native_lto.cz10a_u
0.000	77.052	22.779	0.160	0.004	0.005	0.000	0.000	0.000	0.000	0.117	my8033_rel_native_lto.cz10aps0_u
qr100.L1
- qr100.L1: range queries with 100 insert/s per client
- Legend for results is here.
- Each entry lists the percentage of responses that fit in that bucket (slower than max time for previous bucket, faster than min time for next bucket).
Query response time histogram
256us	1ms	4ms	16ms	64ms	256ms	1s	4s	16s	gt	max	tag
99.342	0.647	0.011	0.001	nonzero	0.000	0.000	0.000	0.000	0.000	0.041	my5651_rel_native_lto.cz10a_u
96.840	3.157	0.003	nonzero	nonzero	0.000	0.000	0.000	0.000	0.000	0.022	my5740_rel_native_lto.cz10a_u
98.207	1.790	0.003	nonzero	nonzero	0.000	0.000	0.000	0.000	0.000	0.043	my5740_rel_native_lto.cz10aps0_u
84.667	15.328	0.005	nonzero	nonzero	0.000	0.000	0.000	0.000	0.000	0.048	my8033_rel_native_lto.cz10a_u
90.978	9.017	0.004	nonzero	nonzero	0.000	0.000	0.000	0.000	0.000	0.023	my8033_rel_native_lto.cz10aps0_u
Insert response time histogram
256us	1ms	4ms	16ms	64ms	256ms	1s	4s	16s	gt	max	tag
0.000	0.000	14.258	82.945	2.797	0.000	0.000	0.000	0.000	0.000	0.053	my5651_rel_native_lto.cz10a_u
0.000	0.000	63.479	36.344	0.177	0.000	0.000	0.000	0.000	0.000	0.028	my5740_rel_native_lto.cz10a_u
0.000	0.000	90.848	8.612	0.541	0.000	0.000	0.000	0.000	0.000	0.048	my5740_rel_native_lto.cz10aps0_u
0.000	0.000	88.641	11.355	0.003	0.000	0.000	0.000	0.000	0.000	0.056	my8033_rel_native_lto.cz10a_u
0.000	0.000	92.509	7.491	0.000	0.000	0.000	0.000	0.000	0.000	0.010	my8033_rel_native_lto.cz10aps0_u
Delete response time histogram
256us	1ms	4ms	16ms	64ms	256ms	1s	4s	16s	gt	max	tag
0.000	0.000	25.455	72.844	1.701	0.000	0.000	0.000	0.000	0.000	0.053	my5651_rel_native_lto.cz10a_u
0.000	0.000	85.462	14.428	0.110	0.000	0.000	0.000	0.000	0.000	0.028	my5740_rel_native_lto.cz10a_u
0.000	0.000	96.278	3.259	0.464	0.000	0.000	0.000	0.000	0.000	0.045	my5740_rel_native_lto.cz10aps0_u
0.000	0.000	99.953	0.046	0.001	0.000	0.000	0.000	0.000	0.000	0.051	my8033_rel_native_lto.cz10a_u
0.000	0.000	99.957	0.043	0.000	0.000	0.000	0.000	0.000	0.000	0.010	my8033_rel_native_lto.cz10aps0_u
qp100.L2
- qp100.L2: point queries with 100 insert/s per client
- Legend for results is here.
- Each entry lists the percentage of responses that fit in that bucket (slower than max time for previous bucket, faster than min time for next bucket).
Query response time histogram
256us	1ms	4ms	16ms	64ms	256ms	1s	4s	16s	gt	max	tag
91.572	8.399	0.028	nonzero	nonzero	0.000	0.000	0.000	0.000	0.000	0.022	my5651_rel_native_lto.cz10a_u
76.224	23.751	0.025	nonzero	nonzero	0.000	0.000	0.000	0.000	0.000	0.022	my5740_rel_native_lto.cz10a_u
80.974	19.002	0.024	nonzero	nonzero	0.000	0.000	0.000	0.000	0.000	0.021	my5740_rel_native_lto.cz10aps0_u
36.986	62.981	0.034	nonzero	0.000	0.000	0.000	0.000	0.000	0.000	0.007	my8033_rel_native_lto.cz10a_u
46.478	53.491	0.031	nonzero	nonzero	0.000	0.000	0.000	0.000	0.000	0.023	my8033_rel_native_lto.cz10aps0_u
Insert response time histogram
256us	1ms	4ms	16ms	64ms	256ms	1s	4s	16s	gt	max	tag
0.000	0.000	14.054	85.921	0.025	0.000	0.000	0.000	0.000	0.000	0.048	my5651_rel_native_lto.cz10a_u
0.000	0.000	67.053	32.947	0.000	0.000	0.000	0.000	0.000	0.000	0.012	my5740_rel_native_lto.cz10a_u
0.000	0.000	97.633	2.367	0.000	0.000	0.000	0.000	0.000	0.000	0.010	my5740_rel_native_lto.cz10aps0_u
0.000	0.000	94.876	5.122	0.003	0.000	0.000	0.000	0.000	0.000	0.037	my8033_rel_native_lto.cz10a_u
0.000	0.000	94.952	5.048	0.000	0.000	0.000	0.000	0.000	0.000	0.009	my8033_rel_native_lto.cz10aps0_u
Delete response time histogram
256us	1ms	4ms	16ms	64ms	256ms	1s	4s	16s	gt	max	tag
0.000	0.000	21.830	78.153	0.017	0.000	0.000	0.000	0.000	0.000	0.048	my5651_rel_native_lto.cz10a_u
0.000	0.000	84.488	15.512	0.000	0.000	0.000	0.000	0.000	0.000	0.009	my5740_rel_native_lto.cz10a_u
0.000	0.000	99.834	0.166	0.000	0.000	0.000	0.000	0.000	0.000	0.006	my5740_rel_native_lto.cz10aps0_u
0.000	0.000	99.975	0.022	0.003	0.000	0.000	0.000	0.000	0.000	0.029	my8033_rel_native_lto.cz10a_u
0.000	0.000	99.975	0.025	0.000	0.000	0.000	0.000	0.000	0.000	0.007	my8033_rel_native_lto.cz10aps0_u
qr500.L3
- qr500.L3: range queries with 500 insert/s per client
- Legend for results is here.
- Each entry lists the percentage of responses that fit in that bucket (slower than max time for previous bucket, faster than min time for next bucket).
Query response time histogram
256us	1ms	4ms	16ms	64ms	256ms	1s	4s	16s	gt	max	tag
95.343	4.563	0.072	0.023	nonzero	0.000	0.000	0.000	0.000	0.000	0.032	my5651_rel_native_lto.cz10a_u
94.512	5.480	0.006	0.002	nonzero	0.000	0.000	0.000	0.000	0.000	0.025	my5740_rel_native_lto.cz10a_u
96.798	3.196	0.005	0.001	nonzero	0.000	0.000	0.000	0.000	0.000	0.026	my5740_rel_native_lto.cz10aps0_u
80.763	19.229	0.007	nonzero	nonzero	0.000	0.000	0.000	0.000	0.000	0.018	my8033_rel_native_lto.cz10a_u
87.750	12.242	0.009	nonzero	nonzero	0.000	0.000	0.000	0.000	0.000	0.030	my8033_rel_native_lto.cz10aps0_u
Insert response time histogram
256us	1ms	4ms	16ms	64ms	256ms	1s	4s	16s	gt	max	tag
0.000	0.000	1.786	39.030	59.183	0.001	0.000	0.000	0.000	0.000	0.078	my5651_rel_native_lto.cz10a_u
0.000	0.000	11.958	87.756	0.286	0.000	0.000	0.000	0.000	0.000	0.039	my5740_rel_native_lto.cz10a_u
0.000	0.000	20.839	79.050	0.110	0.000	0.000	0.000	0.000	0.000	0.034	my5740_rel_native_lto.cz10aps0_u
0.000	0.000	50.802	49.185	0.014	0.000	0.000	0.000	0.000	0.000	0.041	my8033_rel_native_lto.cz10a_u
0.000	0.000	46.590	53.402	0.008	0.000	0.000	0.000	0.000	0.000	0.034	my8033_rel_native_lto.cz10aps0_u
Delete response time histogram
256us	1ms	4ms	16ms	64ms	256ms	1s	4s	16s	gt	max	tag
0.000	0.000	2.659	43.403	53.936	0.002	0.000	0.000	0.000	0.000	0.084	my5651_rel_native_lto.cz10a_u
0.000	0.000	17.610	82.168	0.222	0.000	0.000	0.000	0.000	0.000	0.037	my5740_rel_native_lto.cz10a_u
0.000	0.000	30.209	69.706	0.084	0.000	0.000	0.000	0.000	0.000	0.031	my5740_rel_native_lto.cz10aps0_u
0.000	0.000	95.217	4.777	0.006	0.000	0.000	0.000	0.000	0.000	0.046	my8033_rel_native_lto.cz10a_u
0.000	0.000	93.746	6.249	0.005	0.000	0.000	0.000	0.000	0.000	0.034	my8033_rel_native_lto.cz10aps0_u
qp500.L4
- qp500.L4: point queries with 500 insert/s per client
- Legend for results is here.
- Each entry lists the percentage of responses that fit in that bucket (slower than max time for previous bucket, faster than min time for next bucket).
Query response time histogram
256us	1ms	4ms	16ms	64ms	256ms	1s	4s	16s	gt	max	tag
82.202	17.674	0.099	0.026	nonzero	0.000	0.000	0.000	0.000	0.000	0.025	my5651_rel_native_lto.cz10a_u
70.933	29.057	0.008	0.002	nonzero	0.000	0.000	0.000	0.000	0.000	0.024	my5740_rel_native_lto.cz10a_u
76.017	23.974	0.007	0.002	nonzero	0.000	0.000	0.000	0.000	0.000	0.026	my5740_rel_native_lto.cz10aps0_u
34.579	65.409	0.012	nonzero	nonzero	0.000	0.000	0.000	0.000	0.000	0.023	my8033_rel_native_lto.cz10a_u
43.250	56.741	0.008	nonzero	0.000	0.000	0.000	0.000	0.000	0.000	0.016	my8033_rel_native_lto.cz10aps0_u
Insert response time histogram
256us	1ms	4ms	16ms	64ms	256ms	1s	4s	16s	gt	max	tag
0.000	0.000	1.529	43.479	54.992	0.000	0.000	0.000	0.000	0.000	0.058	my5651_rel_native_lto.cz10a_u
0.000	0.000	10.555	89.243	0.202	0.000	0.000	0.000	0.000	0.000	0.035	my5740_rel_native_lto.cz10a_u
0.000	0.000	15.090	84.757	0.153	0.000	0.000	0.000	0.000	0.000	0.035	my5740_rel_native_lto.cz10aps0_u
0.000	0.000	42.543	57.451	0.006	0.000	0.000	0.000	0.000	0.000	0.027	my8033_rel_native_lto.cz10a_u
0.000	0.000	55.732	44.265	0.003	0.000	0.000	0.000	0.000	0.000	0.050	my8033_rel_native_lto.cz10aps0_u
Delete response time histogram
256us	1ms	4ms	16ms	64ms	256ms	1s	4s	16s	gt	max	tag
0.000	0.000	2.058	48.742	49.200	0.000	0.000	0.000	0.000	0.000	0.058	my5651_rel_native_lto.cz10a_u
0.000	0.000	16.151	83.697	0.152	0.000	0.000	0.000	0.000	0.000	0.035	my5740_rel_native_lto.cz10a_u
0.000	0.000	22.986	76.899	0.115	0.000	0.000	0.000	0.000	0.000	0.033	my5740_rel_native_lto.cz10aps0_u
0.000	0.000	90.412	9.584	0.004	0.000	0.000	0.000	0.000	0.000	0.026	my8033_rel_native_lto.cz10a_u
0.000	0.000	96.581	3.417	0.002	0.000	0.000	0.000	0.000	0.000	0.048	my8033_rel_native_lto.cz10aps0_u
qr1000.L5
- qr1000.L5: range queries with 1000 insert/s per client
- Legend for results is here.
- Each entry lists the percentage of responses that fit in that bucket (slower than max time for previous bucket, faster than min time for next bucket).
Query response time histogram
256us	1ms	4ms	16ms	64ms	256ms	1s	4s	16s	gt	max	tag
87.559	12.089	0.310	0.040	0.002	0.000	0.000	0.000	0.000	0.000	0.064	my5651_rel_native_lto.cz10a_u
88.264	11.662	0.056	0.018	nonzero	nonzero	0.000	0.000	0.000	0.000	0.064	my5740_rel_native_lto.cz10a_u
92.030	7.904	0.049	0.017	nonzero	0.000	0.000	0.000	0.000	0.000	0.031	my5740_rel_native_lto.cz10aps0_u
76.386	23.561	0.053	0.001	nonzero	0.000	0.000	0.000	0.000	0.000	0.044	my8033_rel_native_lto.cz10a_u
84.012	15.924	0.063	0.001	nonzero	0.000	0.000	0.000	0.000	0.000	0.058	my8033_rel_native_lto.cz10aps0_u
Insert response time histogram
256us	1ms	4ms	16ms	64ms	256ms	1s	4s	16s	gt	max	tag
0.000	0.000	0.464	14.191	85.345	0.000	0.000	0.000	0.000	0.000	0.062	my5651_rel_native_lto.cz10a_u
0.000	0.000	1.915	94.320	3.765	nonzero	0.000	0.000	0.000	0.000	0.076	my5740_rel_native_lto.cz10a_u
0.000	0.000	2.855	94.820	2.325	0.000	0.000	0.000	0.000	0.000	0.047	my5740_rel_native_lto.cz10aps0_u
0.000	0.000	18.916	81.042	0.042	0.000	0.000	0.000	0.000	0.000	0.055	my8033_rel_native_lto.cz10a_u
0.000	0.000	11.634	88.309	0.055	0.002	0.000	0.000	0.000	0.000	0.105	my8033_rel_native_lto.cz10aps0_u
Delete response time histogram
256us	1ms	4ms	16ms	64ms	256ms	1s	4s	16s	gt	max	tag
0.000	0.000	0.480	15.361	84.159	0.000	0.000	0.000	0.000	0.000	0.063	my5651_rel_native_lto.cz10a_u
0.000	0.000	1.517	95.751	2.732	nonzero	0.000	0.000	0.000	0.000	0.079	my5740_rel_native_lto.cz10a_u
0.000	0.000	2.069	96.281	1.650	0.000	0.000	0.000	0.000	0.000	0.044	my5740_rel_native_lto.cz10aps0_u
0.000	0.000	55.427	44.549	0.024	0.000	0.000	0.000	0.000	0.000	0.052	my8033_rel_native_lto.cz10a_u
0.000	0.000	47.393	52.576	0.030	0.001	0.000	0.000	0.000	0.000	0.100	my8033_rel_native_lto.cz10aps0_u
qp1000.L6
- qp1000.L6: point queries with 1000 insert/s per client
- Legend for results is here.
- Each entry lists the percentage of responses that fit in that bucket (slower than max time for previous bucket, faster than min time for next bucket).
Query response time histogram
256us	1ms	4ms	16ms	64ms	256ms	1s	4s	16s	gt	max	tag
67.536	32.111	0.309	0.042	0.002	nonzero	0.000	0.000	0.000	0.000	0.087	my5651_rel_native_lto.cz10a_u
62.138	37.782	0.061	0.019	nonzero	0.000	0.000	0.000	0.000	0.000	0.030	my5740_rel_native_lto.cz10a_u
68.808	31.128	0.048	0.016	nonzero	0.000	0.000	0.000	0.000	0.000	0.030	my5740_rel_native_lto.cz10aps0_u
30.623	69.308	0.068	0.001	nonzero	0.000	0.000	0.000	0.000	0.000	0.024	my8033_rel_native_lto.cz10a_u
39.206	60.728	0.064	0.001	nonzero	0.000	0.000	0.000	0.000	0.000	0.048	my8033_rel_native_lto.cz10aps0_u
Insert response time histogram
256us	1ms	4ms	16ms	64ms	256ms	1s	4s	16s	gt	max	tag
0.000	0.000	0.516	22.897	76.584	0.003	0.000	0.000	0.000	0.000	0.128	my5651_rel_native_lto.cz10a_u
0.000	0.000	2.825	94.106	3.069	0.000	0.000	0.000	0.000	0.000	0.047	my5740_rel_native_lto.cz10a_u
0.000	0.000	5.031	93.483	1.486	0.000	0.000	0.000	0.000	0.000	0.047	my5740_rel_native_lto.cz10aps0_u
0.000	0.000	17.857	82.089	0.053	0.002	0.000	0.000	0.000	0.000	0.072	my8033_rel_native_lto.cz10a_u
0.000	0.000	18.922	81.031	0.046	0.002	0.000	0.000	0.000	0.000	0.104	my8033_rel_native_lto.cz10aps0_u
Delete response time histogram
256us	1ms	4ms	16ms	64ms	256ms	1s	4s	16s	gt	max	tag
0.000	0.000	0.341	27.226	72.430	0.003	0.000	0.000	0.000	0.000	0.127	my5651_rel_native_lto.cz10a_u
0.000	0.000	2.623	95.193	2.184	0.000	0.000	0.000	0.000	0.000	0.057	my5740_rel_native_lto.cz10a_u
0.000	0.000	5.291	93.661	1.048	0.000	0.000	0.000	0.000	0.000	0.045	my5740_rel_native_lto.cz10aps0_u
0.000	0.000	59.437	40.530	0.032	0.001	0.000	0.000	0.000	0.000	0.071	my8033_rel_native_lto.cz10a_u
0.000	0.000	66.492	33.480	0.027	0.001	0.000	0.000	0.000	0.000	0.092	my8033_rel_native_lto.cz10aps0_u