Introduction
This is a report for the insert benchmark with 160M docs and 8 client(s). It is generated by scripts (bash, awk, sed) and Tufte might not be impressed. An overview of the insert benchmark is here and a short update is here. Below, by DBMS, I mean DBMS+version.config. An example is my8020.c10b40 where my means MySQL, 8020 is version 8.0.20 and c10b40 is the name for the configuration file.
The test server is a c2-standard-30 from GCP with 15 cores, hyperthreads disabled, Ubuntu 22.04 and XFS using SW RAID 0 over 4 local SSDs. The benchmark was run with 8 clients and there were 1, 2 or 3 connections per client. It uses 8 tables with a client per table. It loads 20M rows per table without secondary indexes, creates 3 secondary indexes per table, then inserts 50m+50m rows per table with a delete per insert to avoid growing the table. It then does 6 read+write tests for 1200s each that do queries as fast as possible with 100,100,500,500,1000,1000 inserts/s and the same for deletes/s per client concurrent with the queries. The database is cached in memory. Clients and the DBMS share one server. The per-database configs are in the per-database subdirectories here.
The tested DBMS are:
- my5621_rel.cz10a_gcp_c2s30 - MySQL 5.6.21 and InnoDB, CMAKE_BUILD_TYPE=Release, cz10a_gcp_c2s30 config
- my5631_rel.cz10a_gcp_c2s30 - MySQL 5.6.31 and InnoDB, CMAKE_BUILD_TYPE=Release, cz10a_gcp_c2s30 config
- my5641_rel.cz10a_gcp_c2s30 - MySQL 5.6.41 and InnoDB, CMAKE_BUILD_TYPE=Release, cz10a_gcp_c2s30 config
- my5651_rel.cz10a_gcp_c2s30 - MySQL 5.6.51 and InnoDB, CMAKE_BUILD_TYPE=Release, cz10a_gcp_c2s30 config
Contents
- Summary
- l.i0: load without secondary indexes
- l.x: create secondary indexes
- l.i1: continue load after secondary indexes created with 50 inserts per transaction
- l.i2: continue load after secondary indexes created with 5 inserts per transaction
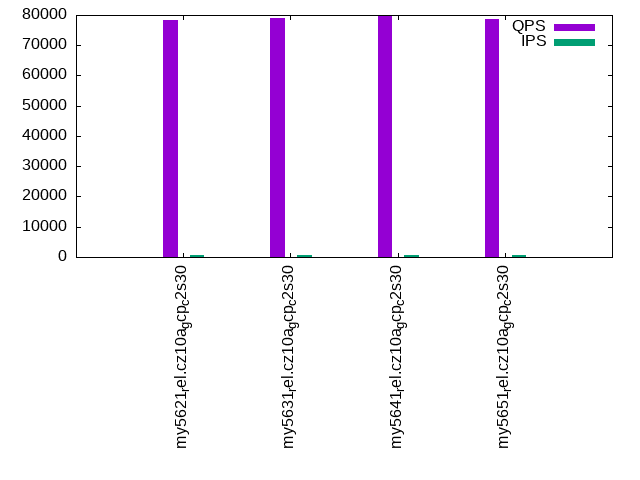
- qr100.L1: range queries with 100 insert/s per client
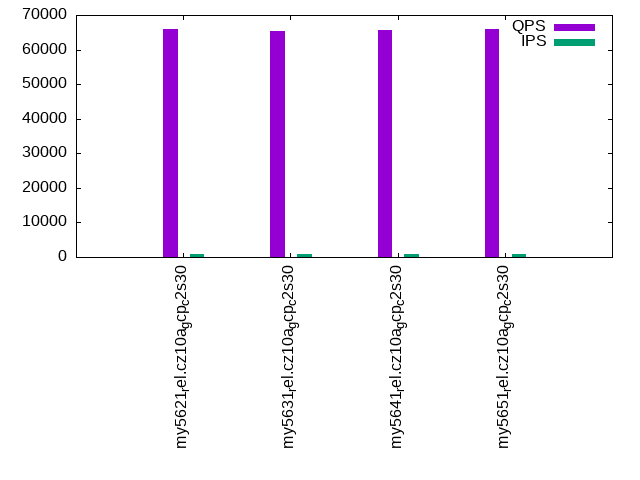
- qp100.L2: point queries with 100 insert/s per client
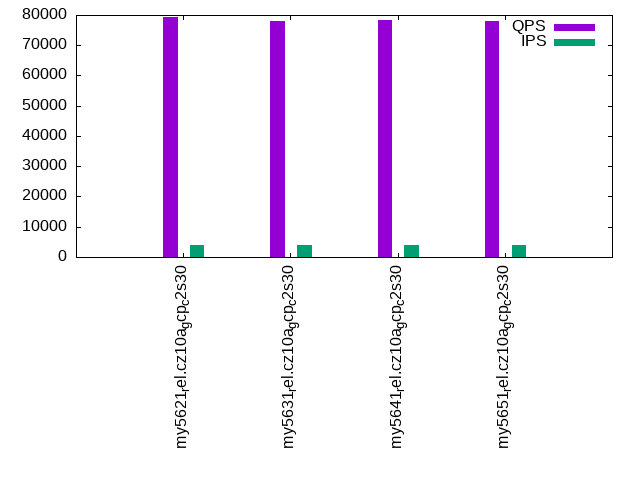
- qr500.L3: range queries with 500 insert/s per client
- qp500.L4: point queries with 500 insert/s per client
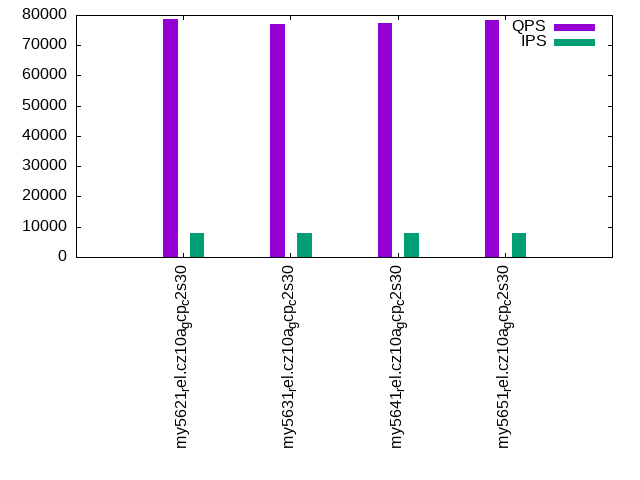
- qr1000.L5: range queries with 1000 insert/s per client
- qp1000.L6: point queries with 1000 insert/s per client
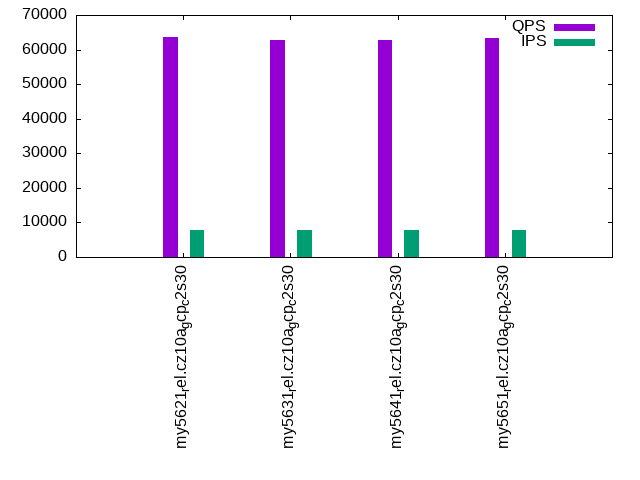
Summary
The numbers are inserts/s for l.i0, l.i1 and l.i2, indexed docs (or rows) /s for l.x and queries/s for qr100, qp100 thru qr1000, qp1000" The values are the average rate over the entire test for inserts (IPS) and queries (QPS). The range of values for IPS and QPS is split into 3 parts: bottom 25%, middle 50%, top 25%. Values in the bottom 25% have a red background, values in the top 25% have a green background and values in the middle have no color. A gray background is used for values that can be ignored because the DBMS did not sustain the target insert rate. Red backgrounds are not used when the minimum value is within 80% of the max value.
| dbms | l.i0 | l.x | l.i1 | l.i2 | qr100 | qp100 | qr500 | qp500 | qr1000 | qp1000 |
|---|---|---|---|---|---|---|---|---|---|---|
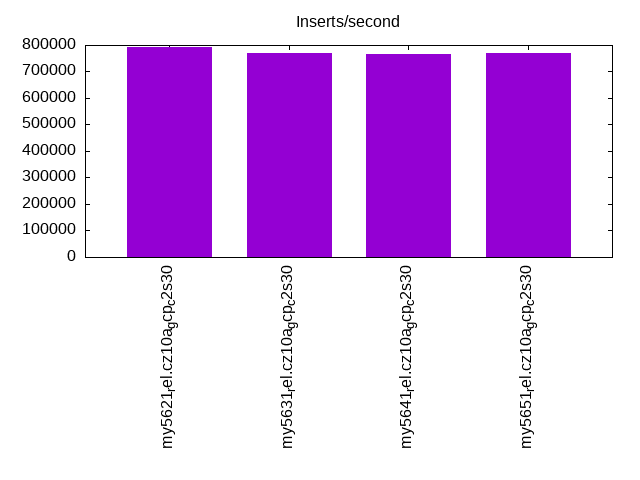
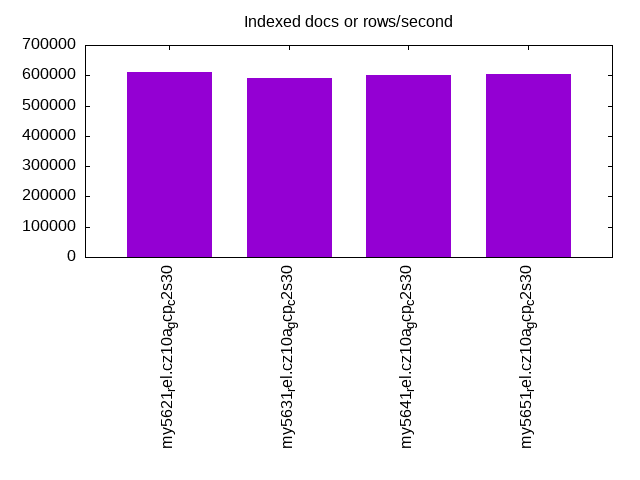
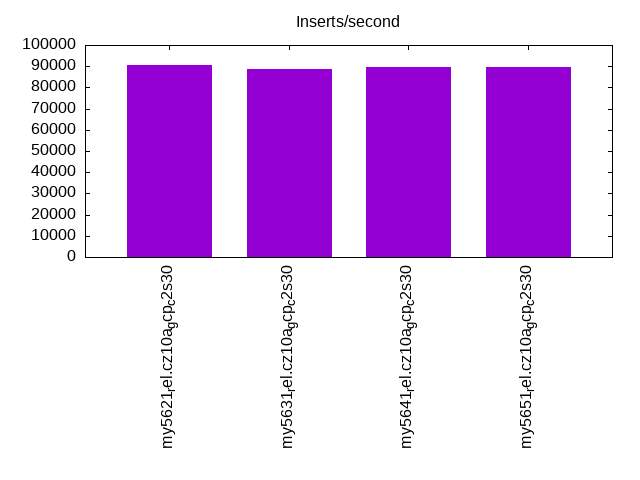
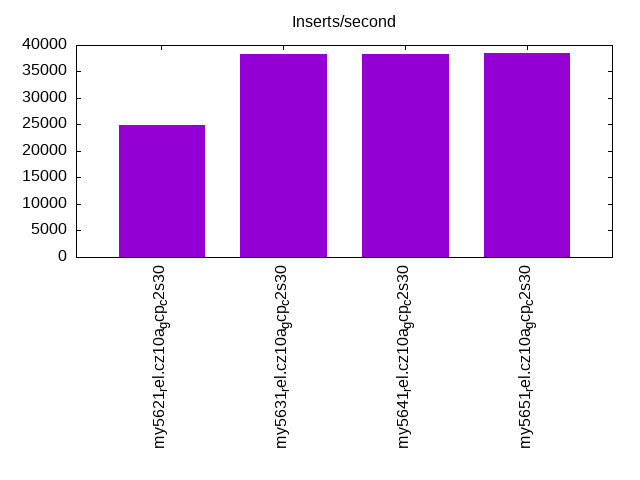
| my5621_rel.cz10a_gcp_c2s30 | 792079 | 610687 | 90549 | 24930 | 78402 | 66094 | 79412 | 64775 | 78534 | 63656 |
| my5631_rel.cz10a_gcp_c2s30 | 769231 | 590406 | 88889 | 38314 | 79102 | 65503 | 78008 | 63364 | 76865 | 62903 |
| my5641_rel.cz10a_gcp_c2s30 | 765550 | 601504 | 89410 | 38259 | 79506 | 65713 | 78237 | 63300 | 77339 | 62894 |
| my5651_rel.cz10a_gcp_c2s30 | 769231 | 603774 | 89510 | 38480 | 78677 | 65915 | 78153 | 63678 | 78333 | 63461 |
This table has relative throughput, throughput for the DBMS relative to the DBMS in the first line, using the absolute throughput from the previous table. Values less than 0.95 have a yellow background. Values greater than 1.05 have a blue background.
| dbms | l.i0 | l.x | l.i1 | l.i2 | qr100 | qp100 | qr500 | qp500 | qr1000 | qp1000 |
|---|---|---|---|---|---|---|---|---|---|---|
| my5621_rel.cz10a_gcp_c2s30 | 1.00 | 1.00 | 1.00 | 1.00 | 1.00 | 1.00 | 1.00 | 1.00 | 1.00 | 1.00 |
| my5631_rel.cz10a_gcp_c2s30 | 0.97 | 0.97 | 0.98 | 1.54 | 1.01 | 0.99 | 0.98 | 0.98 | 0.98 | 0.99 |
| my5641_rel.cz10a_gcp_c2s30 | 0.97 | 0.98 | 0.99 | 1.53 | 1.01 | 0.99 | 0.99 | 0.98 | 0.98 | 0.99 |
| my5651_rel.cz10a_gcp_c2s30 | 0.97 | 0.99 | 0.99 | 1.54 | 1.00 | 1.00 | 0.98 | 0.98 | 1.00 | 1.00 |
This lists the average rate of inserts/s for the tests that do inserts concurrent with queries. For such tests the query rate is listed in the table above. The read+write tests are setup so that the insert rate should match the target rate every second. Cells that are not at least 95% of the target have a red background to indicate a failure to satisfy the target.
| dbms | qr100.L1 | qp100.L2 | qr500.L3 | qp500.L4 | qr1000.L5 | qp1000.L6 |
|---|---|---|---|---|---|---|
| my5621_rel.cz10a_gcp_c2s30 | 794 | 794 | 3967 | 3967 | 7947 | 7947 |
| my5631_rel.cz10a_gcp_c2s30 | 793 | 794 | 3970 | 3970 | 7940 | 7940 |
| my5641_rel.cz10a_gcp_c2s30 | 794 | 794 | 3970 | 3967 | 7940 | 7940 |
| my5651_rel.cz10a_gcp_c2s30 | 794 | 794 | 3970 | 3967 | 7940 | 7947 |
| target | 800 | 800 | 4000 | 4000 | 8000 | 8000 |
l.i0
l.i0: load without secondary indexes. Graphs for performance per 1-second interval are here.
Average throughput:
Insert response time histogram: each cell has the percentage of responses that take <= the time in the header and max is the max response time in seconds. For the max column values in the top 25% of the range have a red background and in the bottom 25% of the range have a green background. The red background is not used when the min value is within 80% of the max value.
| dbms | 256us | 1ms | 4ms | 16ms | 64ms | 256ms | 1s | 4s | 16s | gt | max |
|---|---|---|---|---|---|---|---|---|---|---|---|
| my5621_rel.cz10a_gcp_c2s30 | 98.055 | 1.827 | 0.016 | 0.031 | 0.070 | 0.001 | 0.300 | ||||
| my5631_rel.cz10a_gcp_c2s30 | 97.281 | 2.600 | 0.015 | 0.032 | 0.071 | 0.247 | |||||
| my5641_rel.cz10a_gcp_c2s30 | 97.325 | 2.557 | 0.017 | 0.033 | 0.068 | 0.253 | |||||
| my5651_rel.cz10a_gcp_c2s30 | 97.337 | 2.540 | 0.017 | 0.040 | 0.065 | 0.248 |
Performance metrics for the DBMS listed above. Some are normalized by throughput, others are not. Legend for results is here.
ips	qps	rps	rmbps	wps	wmbps	rpq	rkbpq	wpi	wkbpi	csps	cpups	cspq	cpupq	dbgb1	dbgb2	rss	maxop	p50	p99	tag
792079	0	0	0.0	1590.7	158.1	0.000	0.000	0.002	0.204	75363	70.6	0.095	13	10.6	75.1	15.6	0.300	107583	84109	my5621_rel.cz10a_gcp_c2s30
769231	0	0	0.0	1493.9	154.5	0.000	0.000	0.002	0.206	73830	70.6	0.096	14	10.6	75.1	16.7	0.247	103320	81413	my5631_rel.cz10a_gcp_c2s30
765550	0	0	0.0	1491.6	150.9	0.000	0.000	0.002	0.202	73872	70.5	0.096	14	10.6	75.1	16.8	0.253	103189	79914	my5641_rel.cz10a_gcp_c2s30
769231	0	0	0.0	1558.6	153.6	0.000	0.000	0.002	0.204	72311	70.7	0.094	14	10.6	75.1	16.8	0.248	103489	78739	my5651_rel.cz10a_gcp_c2s30
l.x
l.x: create secondary indexes.
Average throughput:
Performance metrics for the DBMS listed above. Some are normalized by throughput, others are not. Legend for results is here.
ips	qps	rps	rmbps	wps	wmbps	rpq	rkbpq	wpi	wkbpi	csps	cpups	cspq	cpupq	dbgb1	dbgb2	rss	maxop	p50	p99	tag
610687	0	0	0.0	8033.3	662.8	0.000	0.000	0.013	1.111	18846	41.0	0.031	10	22.3	86.8	27.3	0.001	NA	NA	my5621_rel.cz10a_gcp_c2s30
590406	0	0	0.0	7867.7	642.4	0.000	0.000	0.013	1.114	18477	40.7	0.031	10	22.3	86.8	28.6	0.001	NA	NA	my5631_rel.cz10a_gcp_c2s30
601504	0	0	0.0	7545.2	642.1	0.000	0.000	0.013	1.093	16718	41.1	0.028	10	22.3	86.8	27.0	0.001	NA	NA	my5641_rel.cz10a_gcp_c2s30
603774	0	0	0.0	7683.9	652.8	0.000	0.000	0.013	1.107	17162	41.5	0.028	10	22.3	86.8	27.2	0.001	NA	NA	my5651_rel.cz10a_gcp_c2s30
l.i1
l.i1: continue load after secondary indexes created with 50 inserts per transaction. Graphs for performance per 1-second interval are here.
Average throughput:
Insert response time histogram: each cell has the percentage of responses that take <= the time in the header and max is the max response time in seconds. For the max column values in the top 25% of the range have a red background and in the bottom 25% of the range have a green background. The red background is not used when the min value is within 80% of the max value.
| dbms | 256us | 1ms | 4ms | 16ms | 64ms | 256ms | 1s | 4s | 16s | gt | max |
|---|---|---|---|---|---|---|---|---|---|---|---|
| my5621_rel.cz10a_gcp_c2s30 | 0.001 | 49.078 | 50.482 | 0.415 | 0.025 | 0.251 | |||||
| my5631_rel.cz10a_gcp_c2s30 | 0.001 | 47.372 | 52.188 | 0.416 | 0.023 | nonzero | 0.269 | ||||
| my5641_rel.cz10a_gcp_c2s30 | 0.001 | 48.012 | 51.550 | 0.413 | 0.024 | nonzero | 0.292 | ||||
| my5651_rel.cz10a_gcp_c2s30 | nonzero | 48.033 | 51.529 | 0.413 | 0.024 | nonzero | 0.271 |
Delete response time histogram: each cell has the percentage of responses that take <= the time in the header and max is the max response time in seconds. For the max column values in the top 25% of the range have a red background and in the bottom 25% of the range have a green background. The red background is not used when the min value is within 80% of the max value.
| dbms | 256us | 1ms | 4ms | 16ms | 64ms | 256ms | 1s | 4s | 16s | gt | max |
|---|---|---|---|---|---|---|---|---|---|---|---|
| my5621_rel.cz10a_gcp_c2s30 | 0.004 | 65.001 | 34.621 | 0.354 | 0.020 | 0.251 | |||||
| my5631_rel.cz10a_gcp_c2s30 | 0.004 | 62.708 | 36.914 | 0.355 | 0.019 | nonzero | 0.266 | ||||
| my5641_rel.cz10a_gcp_c2s30 | 0.004 | 63.988 | 35.637 | 0.351 | 0.019 | 0.250 | |||||
| my5651_rel.cz10a_gcp_c2s30 | 0.004 | 63.845 | 35.778 | 0.353 | 0.020 | 0.240 |
Performance metrics for the DBMS listed above. Some are normalized by throughput, others are not. Legend for results is here.
ips	qps	rps	rmbps	wps	wmbps	rpq	rkbpq	wpi	wkbpi	csps	cpups	cspq	cpupq	dbgb1	dbgb2	rss	maxop	p50	p99	tag
90549	0	1556	6.1	4849.4	183.0	0.017	0.069	0.054	2.070	148857	71.7	1.644	119	42.3	110.0	50.0	0.251	9689	7547	my5621_rel.cz10a_gcp_c2s30
88889	0	1549	6.1	4780.0	180.3	0.017	0.070	0.054	2.077	149408	72.0	1.681	122	41.6	108.9	49.0	0.269	9590	7444	my5631_rel.cz10a_gcp_c2s30
89410	0	1548	6.0	4836.5	181.7	0.017	0.069	0.054	2.081	149285	72.0	1.670	121	41.7	109.0	49.2	0.292	9640	7692	my5641_rel.cz10a_gcp_c2s30
89510	0	1558	6.1	4808.6	181.1	0.017	0.070	0.054	2.071	147661	72.3	1.650	121	41.6	108.8	48.9	0.271	9593	7542	my5651_rel.cz10a_gcp_c2s30
l.i2
l.i2: continue load after secondary indexes created with 5 inserts per transaction. Graphs for performance per 1-second interval are here.
Average throughput:
Insert response time histogram: each cell has the percentage of responses that take <= the time in the header and max is the max response time in seconds. For the max column values in the top 25% of the range have a red background and in the bottom 25% of the range have a green background. The red background is not used when the min value is within 80% of the max value.
| dbms | 256us | 1ms | 4ms | 16ms | 64ms | 256ms | 1s | 4s | 16s | gt | max |
|---|---|---|---|---|---|---|---|---|---|---|---|
| my5621_rel.cz10a_gcp_c2s30 | 0.076 | 20.460 | 78.632 | 0.821 | 0.008 | 0.002 | 0.099 | ||||
| my5631_rel.cz10a_gcp_c2s30 | 3.358 | 58.367 | 37.775 | 0.446 | 0.053 | 0.001 | 0.231 | ||||
| my5641_rel.cz10a_gcp_c2s30 | 3.078 | 58.588 | 37.830 | 0.449 | 0.054 | 0.002 | 0.224 | ||||
| my5651_rel.cz10a_gcp_c2s30 | 3.434 | 58.636 | 37.427 | 0.449 | 0.052 | 0.002 | 0.232 |
Delete response time histogram: each cell has the percentage of responses that take <= the time in the header and max is the max response time in seconds. For the max column values in the top 25% of the range have a red background and in the bottom 25% of the range have a green background. The red background is not used when the min value is within 80% of the max value.
| dbms | 256us | 1ms | 4ms | 16ms | 64ms | 256ms | 1s | 4s | 16s | gt | max |
|---|---|---|---|---|---|---|---|---|---|---|---|
| my5621_rel.cz10a_gcp_c2s30 | 0.099 | 25.613 | 73.645 | 0.634 | 0.008 | 0.001 | 0.100 | ||||
| my5631_rel.cz10a_gcp_c2s30 | 5.244 | 58.646 | 35.692 | 0.364 | 0.052 | 0.001 | 0.232 | ||||
| my5641_rel.cz10a_gcp_c2s30 | 5.233 | 58.794 | 35.551 | 0.368 | 0.053 | 0.001 | 0.223 | ||||
| my5651_rel.cz10a_gcp_c2s30 | 5.631 | 58.736 | 35.211 | 0.370 | 0.051 | 0.002 | 0.232 |
Performance metrics for the DBMS listed above. Some are normalized by throughput, others are not. Legend for results is here.
ips	qps	rps	rmbps	wps	wmbps	rpq	rkbpq	wpi	wkbpi	csps	cpups	cspq	cpupq	dbgb1	dbgb2	rss	maxop	p50	p99	tag
24930	0	3828	15.0	2600.5	89.3	0.154	0.614	0.104	3.667	320999	63.1	12.876	380	42.3	110.5	50.6	0.099	3093	2837	my5621_rel.cz10a_gcp_c2s30
38314	0	1892	7.4	3840.0	138.0	0.049	0.198	0.100	3.689	247120	71.3	6.450	279	41.6	108.9	49.4	0.231	5554	2797	my5631_rel.cz10a_gcp_c2s30
38259	0	1877	7.3	3808.3	137.0	0.049	0.196	0.100	3.667	245860	71.4	6.426	280	41.7	109.0	49.5	0.224	5506	2782	my5641_rel.cz10a_gcp_c2s30
38480	0	1895	7.4	3805.7	137.1	0.049	0.197	0.099	3.648	246415	71.3	6.404	278	41.6	108.8	49.3	0.232	5559	2792	my5651_rel.cz10a_gcp_c2s30
qr100.L1
qr100.L1: range queries with 100 insert/s per client. Graphs for performance per 1-second interval are here.
Average throughput:
Query response time histogram: each cell has the percentage of responses that take <= the time in the header and max is the max response time in seconds. For max values in the top 25% of the range have a red background and in the bottom 25% of the range have a green background. The red background is not used when the min value is within 80% of the max value.
| dbms | 256us | 1ms | 4ms | 16ms | 64ms | 256ms | 1s | 4s | 16s | gt | max |
|---|---|---|---|---|---|---|---|---|---|---|---|
| my5621_rel.cz10a_gcp_c2s30 | 99.926 | 0.065 | 0.006 | 0.003 | 0.015 | ||||||
| my5631_rel.cz10a_gcp_c2s30 | 99.954 | 0.041 | 0.004 | nonzero | 0.011 | ||||||
| my5641_rel.cz10a_gcp_c2s30 | 99.956 | 0.040 | 0.003 | nonzero | 0.010 | ||||||
| my5651_rel.cz10a_gcp_c2s30 | 99.954 | 0.041 | 0.004 | 0.001 | 0.011 |
Insert response time histogram: each cell has the percentage of responses that take <= the time in the header and max is the max response time in seconds. For max values in the top 25% of the range have a red background and in the bottom 25% of the range have a green background. The red background is not used when the min value is within 80% of the max value.
| dbms | 256us | 1ms | 4ms | 16ms | 64ms | 256ms | 1s | 4s | 16s | gt | max |
|---|---|---|---|---|---|---|---|---|---|---|---|
| my5621_rel.cz10a_gcp_c2s30 | 76.182 | 23.667 | 0.151 | 0.036 | |||||||
| my5631_rel.cz10a_gcp_c2s30 | 82.839 | 17.156 | 0.005 | 0.016 | |||||||
| my5641_rel.cz10a_gcp_c2s30 | 86.651 | 13.344 | 0.005 | 0.016 | |||||||
| my5651_rel.cz10a_gcp_c2s30 | 86.120 | 13.865 | 0.016 | 0.016 |
Delete response time histogram: each cell has the percentage of responses that take <= the time in the header and max is the max response time in seconds. For max values in the top 25% of the range have a red background and in the bottom 25% of the range have a green background. The red background is not used when the min value is within 80% of the max value.
| dbms | 256us | 1ms | 4ms | 16ms | 64ms | 256ms | 1s | 4s | 16s | gt | max |
|---|---|---|---|---|---|---|---|---|---|---|---|
| my5621_rel.cz10a_gcp_c2s30 | 0.068 | 88.703 | 11.104 | 0.125 | 0.036 | ||||||
| my5631_rel.cz10a_gcp_c2s30 | 0.109 | 88.760 | 11.125 | 0.005 | 0.017 | ||||||
| my5641_rel.cz10a_gcp_c2s30 | 0.078 | 91.542 | 8.375 | 0.005 | 0.018 | ||||||
| my5651_rel.cz10a_gcp_c2s30 | 0.094 | 90.958 | 8.932 | 0.016 | 0.020 |
Performance metrics for the DBMS listed above. Some are normalized by throughput, others are not. Legend for results is here.
ips	qps	rps	rmbps	wps	wmbps	rpq	rkbpq	wpi	wkbpi	csps	cpups	cspq	cpupq	dbgb1	dbgb2	rss	maxop	p50	p99	tag
794	78402	28	0.1	3772.4	115.6	0.000	0.001	4.751	149.110	302504	55.4	3.858	106	42.3	110.5	50.6	0.015	10165	6841	my5621_rel.cz10a_gcp_c2s30
793	79102	26	0.1	3704.3	112.2	0.000	0.001	4.669	144.863	308095	54.0	3.895	102	41.6	108.9	49.4	0.011	10085	9573	my5631_rel.cz10a_gcp_c2s30
794	79506	26	0.1	3335.2	101.1	0.000	0.001	4.200	130.359	308824	53.8	3.884	102	41.7	109.0	49.5	0.010	10197	9685	my5641_rel.cz10a_gcp_c2s30
794	78677	26	0.1	3520.6	106.7	0.000	0.001	4.434	137.614	305573	53.9	3.884	103	41.6	108.8	49.3	0.011	10005	9497	my5651_rel.cz10a_gcp_c2s30
qp100.L2
qp100.L2: point queries with 100 insert/s per client. Graphs for performance per 1-second interval are here.
Average throughput:
Query response time histogram: each cell has the percentage of responses that take <= the time in the header and max is the max response time in seconds. For max values in the top 25% of the range have a red background and in the bottom 25% of the range have a green background. The red background is not used when the min value is within 80% of the max value.
| dbms | 256us | 1ms | 4ms | 16ms | 64ms | 256ms | 1s | 4s | 16s | gt | max |
|---|---|---|---|---|---|---|---|---|---|---|---|
| my5621_rel.cz10a_gcp_c2s30 | 99.932 | 0.064 | 0.004 | nonzero | 0.010 | ||||||
| my5631_rel.cz10a_gcp_c2s30 | 99.932 | 0.063 | 0.004 | nonzero | 0.010 | ||||||
| my5641_rel.cz10a_gcp_c2s30 | 99.931 | 0.065 | 0.004 | nonzero | 0.009 | ||||||
| my5651_rel.cz10a_gcp_c2s30 | 99.932 | 0.063 | 0.004 | nonzero | 0.009 |
Insert response time histogram: each cell has the percentage of responses that take <= the time in the header and max is the max response time in seconds. For max values in the top 25% of the range have a red background and in the bottom 25% of the range have a green background. The red background is not used when the min value is within 80% of the max value.
| dbms | 256us | 1ms | 4ms | 16ms | 64ms | 256ms | 1s | 4s | 16s | gt | max |
|---|---|---|---|---|---|---|---|---|---|---|---|
| my5621_rel.cz10a_gcp_c2s30 | 78.188 | 21.807 | 0.005 | 0.017 | |||||||
| my5631_rel.cz10a_gcp_c2s30 | 74.422 | 25.536 | 0.042 | 0.022 | |||||||
| my5641_rel.cz10a_gcp_c2s30 | 82.557 | 17.427 | 0.016 | 0.019 | |||||||
| my5651_rel.cz10a_gcp_c2s30 | 79.323 | 20.677 | 0.013 |
Delete response time histogram: each cell has the percentage of responses that take <= the time in the header and max is the max response time in seconds. For max values in the top 25% of the range have a red background and in the bottom 25% of the range have a green background. The red background is not used when the min value is within 80% of the max value.
| dbms | 256us | 1ms | 4ms | 16ms | 64ms | 256ms | 1s | 4s | 16s | gt | max |
|---|---|---|---|---|---|---|---|---|---|---|---|
| my5621_rel.cz10a_gcp_c2s30 | 0.005 | 86.625 | 13.370 | 0.015 | |||||||
| my5631_rel.cz10a_gcp_c2s30 | 84.333 | 15.661 | 0.005 | 0.016 | |||||||
| my5641_rel.cz10a_gcp_c2s30 | 0.036 | 90.198 | 9.766 | 0.015 | |||||||
| my5651_rel.cz10a_gcp_c2s30 | 0.010 | 88.193 | 11.797 | 0.012 |
Performance metrics for the DBMS listed above. Some are normalized by throughput, others are not. Legend for results is here.
ips	qps	rps	rmbps	wps	wmbps	rpq	rkbpq	wpi	wkbpi	csps	cpups	cspq	cpupq	dbgb1	dbgb2	rss	maxop	p50	p99	tag
794	66094	26	0.1	260.5	8.3	0.000	0.002	0.328	10.683	263839	53.4	3.992	121	42.3	110.5	50.6	0.010	8311	8042	my5621_rel.cz10a_gcp_c2s30
794	65503	26	0.1	565.1	17.5	0.000	0.002	0.712	22.512	261960	53.4	3.999	122	41.6	108.9	49.4	0.010	8263	8007	my5631_rel.cz10a_gcp_c2s30
794	65713	26	0.1	396.8	12.4	0.000	0.002	0.500	15.963	262552	53.4	3.995	122	41.7	109.0	49.6	0.009	8295	8039	my5641_rel.cz10a_gcp_c2s30
794	65915	26	0.1	12.3	0.8	0.000	0.002	0.015	0.994	262750	53.3	3.986	121	41.6	108.8	49.3	0.009	8311	8199	my5651_rel.cz10a_gcp_c2s30
qr500.L3
qr500.L3: range queries with 500 insert/s per client. Graphs for performance per 1-second interval are here.
Average throughput:
Query response time histogram: each cell has the percentage of responses that take <= the time in the header and max is the max response time in seconds. For max values in the top 25% of the range have a red background and in the bottom 25% of the range have a green background. The red background is not used when the min value is within 80% of the max value.
| dbms | 256us | 1ms | 4ms | 16ms | 64ms | 256ms | 1s | 4s | 16s | gt | max |
|---|---|---|---|---|---|---|---|---|---|---|---|
| my5621_rel.cz10a_gcp_c2s30 | 99.806 | 0.164 | 0.029 | 0.001 | 0.011 | ||||||
| my5631_rel.cz10a_gcp_c2s30 | 99.685 | 0.276 | 0.038 | 0.001 | 0.010 | ||||||
| my5641_rel.cz10a_gcp_c2s30 | 99.688 | 0.274 | 0.038 | 0.001 | nonzero | 0.034 | |||||
| my5651_rel.cz10a_gcp_c2s30 | 99.688 | 0.274 | 0.037 | 0.001 | 0.012 |
Insert response time histogram: each cell has the percentage of responses that take <= the time in the header and max is the max response time in seconds. For max values in the top 25% of the range have a red background and in the bottom 25% of the range have a green background. The red background is not used when the min value is within 80% of the max value.
| dbms | 256us | 1ms | 4ms | 16ms | 64ms | 256ms | 1s | 4s | 16s | gt | max |
|---|---|---|---|---|---|---|---|---|---|---|---|
| my5621_rel.cz10a_gcp_c2s30 | 0.006 | 60.381 | 39.145 | 0.468 | 0.029 | ||||||
| my5631_rel.cz10a_gcp_c2s30 | 0.002 | 35.258 | 63.661 | 1.078 | 0.030 | ||||||
| my5641_rel.cz10a_gcp_c2s30 | 35.405 | 63.549 | 1.046 | 0.043 | |||||||
| my5651_rel.cz10a_gcp_c2s30 | 0.001 | 35.453 | 63.486 | 1.059 | 0.030 |
Delete response time histogram: each cell has the percentage of responses that take <= the time in the header and max is the max response time in seconds. For max values in the top 25% of the range have a red background and in the bottom 25% of the range have a green background. The red background is not used when the min value is within 80% of the max value.
| dbms | 256us | 1ms | 4ms | 16ms | 64ms | 256ms | 1s | 4s | 16s | gt | max |
|---|---|---|---|---|---|---|---|---|---|---|---|
| my5621_rel.cz10a_gcp_c2s30 | 0.572 | 67.303 | 31.869 | 0.256 | 0.029 | ||||||
| my5631_rel.cz10a_gcp_c2s30 | 0.015 | 43.356 | 55.995 | 0.634 | 0.029 | ||||||
| my5641_rel.cz10a_gcp_c2s30 | 0.016 | 44.289 | 55.150 | 0.546 | 0.043 | ||||||
| my5651_rel.cz10a_gcp_c2s30 | 0.022 | 43.601 | 55.780 | 0.597 | 0.027 |
Performance metrics for the DBMS listed above. Some are normalized by throughput, others are not. Legend for results is here.
ips	qps	rps	rmbps	wps	wmbps	rpq	rkbpq	wpi	wkbpi	csps	cpups	cspq	cpupq	dbgb1	dbgb2	rss	maxop	p50	p99	tag
3967	79412	50	0.2	21.7	2.7	0.001	0.003	0.005	0.685	303627	55.3	3.823	104	42.3	110.5	50.7	0.011	10021	9832	my5621_rel.cz10a_gcp_c2s30
3970	78008	113	0.4	21.3	2.6	0.001	0.006	0.005	0.665	300630	55.4	3.854	107	41.6	108.9	49.4	0.010	9849	9705	my5631_rel.cz10a_gcp_c2s30
3970	78237	111	0.4	21.8	2.5	0.001	0.006	0.005	0.655	301409	55.4	3.852	106	41.7	109.0	49.6	0.034	9925	9769	my5641_rel.cz10a_gcp_c2s30
3970	78153	114	0.4	20.7	2.5	0.001	0.006	0.005	0.634	301211	55.4	3.854	106	41.6	108.8	49.4	0.012	9813	9685	my5651_rel.cz10a_gcp_c2s30
qp500.L4
qp500.L4: point queries with 500 insert/s per client. Graphs for performance per 1-second interval are here.
Average throughput:

Query response time histogram: each cell has the percentage of responses that take <= the time in the header and max is the max response time in seconds. For max values in the top 25% of the range have a red background and in the bottom 25% of the range have a green background. The red background is not used when the min value is within 80% of the max value.
| dbms | 256us | 1ms | 4ms | 16ms | 64ms | 256ms | 1s | 4s | 16s | gt | max |
|---|---|---|---|---|---|---|---|---|---|---|---|
| my5621_rel.cz10a_gcp_c2s30 | 99.826 | 0.145 | 0.028 | 0.001 | 0.013 | ||||||
| my5631_rel.cz10a_gcp_c2s30 | 99.643 | 0.324 | 0.032 | 0.001 | 0.011 | ||||||
| my5641_rel.cz10a_gcp_c2s30 | 99.618 | 0.348 | 0.034 | 0.001 | 0.011 | ||||||
| my5651_rel.cz10a_gcp_c2s30 | 99.637 | 0.328 | 0.034 | 0.001 | 0.012 |
Insert response time histogram: each cell has the percentage of responses that take <= the time in the header and max is the max response time in seconds. For max values in the top 25% of the range have a red background and in the bottom 25% of the range have a green background. The red background is not used when the min value is within 80% of the max value.
| dbms | 256us | 1ms | 4ms | 16ms | 64ms | 256ms | 1s | 4s | 16s | gt | max |
|---|---|---|---|---|---|---|---|---|---|---|---|
| my5621_rel.cz10a_gcp_c2s30 | 0.006 | 78.842 | 21.042 | 0.110 | 0.024 | ||||||
| my5631_rel.cz10a_gcp_c2s30 | 39.416 | 59.256 | 1.328 | 0.030 | |||||||
| my5641_rel.cz10a_gcp_c2s30 | 34.710 | 63.774 | 1.516 | 0.032 | |||||||
| my5651_rel.cz10a_gcp_c2s30 | 0.001 | 37.250 | 61.327 | 1.422 | 0.037 |
Delete response time histogram: each cell has the percentage of responses that take <= the time in the header and max is the max response time in seconds. For max values in the top 25% of the range have a red background and in the bottom 25% of the range have a green background. The red background is not used when the min value is within 80% of the max value.
| dbms | 256us | 1ms | 4ms | 16ms | 64ms | 256ms | 1s | 4s | 16s | gt | max |
|---|---|---|---|---|---|---|---|---|---|---|---|
| my5621_rel.cz10a_gcp_c2s30 | 0.435 | 85.002 | 14.503 | 0.059 | 0.022 | ||||||
| my5631_rel.cz10a_gcp_c2s30 | 0.057 | 47.721 | 51.490 | 0.732 | 0.031 | ||||||
| my5641_rel.cz10a_gcp_c2s30 | 0.010 | 43.703 | 55.393 | 0.894 | 0.031 | ||||||
| my5651_rel.cz10a_gcp_c2s30 | 0.049 | 45.358 | 53.719 | 0.874 | 0.037 |
Performance metrics for the DBMS listed above. Some are normalized by throughput, others are not. Legend for results is here.
ips	qps	rps	rmbps	wps	wmbps	rpq	rkbpq	wpi	wkbpi	csps	cpups	cspq	cpupq	dbgb1	dbgb2	rss	maxop	p50	p99	tag
3967	64775	0	0.0	1996.4	62.3	0.000	0.000	0.503	16.070	259918	55.4	4.013	128	42.3	110.5	50.7	0.013	8199	7800	my5621_rel.cz10a_gcp_c2s30
3970	63364	102	0.4	2316.5	71.9	0.002	0.006	0.583	18.541	258320	55.9	4.077	132	41.6	108.9	49.5	0.011	8023	7640	my5631_rel.cz10a_gcp_c2s30
3967	63300	111	0.4	1955.7	61.0	0.002	0.007	0.493	15.758	258024	55.7	4.076	132	41.7	109.0	49.6	0.011	7991	7624	my5641_rel.cz10a_gcp_c2s30
3967	63678	104	0.4	2400.6	74.4	0.002	0.007	0.605	19.199	259961	55.8	4.082	131	41.6	108.8	49.4	0.012	8087	7690	my5651_rel.cz10a_gcp_c2s30
qr1000.L5
qr1000.L5: range queries with 1000 insert/s per client. Graphs for performance per 1-second interval are here.
Average throughput:
Query response time histogram: each cell has the percentage of responses that take <= the time in the header and max is the max response time in seconds. For max values in the top 25% of the range have a red background and in the bottom 25% of the range have a green background. The red background is not used when the min value is within 80% of the max value.
| dbms | 256us | 1ms | 4ms | 16ms | 64ms | 256ms | 1s | 4s | 16s | gt | max |
|---|---|---|---|---|---|---|---|---|---|---|---|
| my5621_rel.cz10a_gcp_c2s30 | 99.740 | 0.200 | 0.058 | 0.002 | 0.015 | ||||||
| my5631_rel.cz10a_gcp_c2s30 | 99.727 | 0.209 | 0.061 | 0.002 | 0.014 | ||||||
| my5641_rel.cz10a_gcp_c2s30 | 99.730 | 0.206 | 0.062 | 0.002 | 0.013 | ||||||
| my5651_rel.cz10a_gcp_c2s30 | 99.762 | 0.180 | 0.055 | 0.002 | 0.015 |
Insert response time histogram: each cell has the percentage of responses that take <= the time in the header and max is the max response time in seconds. For max values in the top 25% of the range have a red background and in the bottom 25% of the range have a green background. The red background is not used when the min value is within 80% of the max value.
| dbms | 256us | 1ms | 4ms | 16ms | 64ms | 256ms | 1s | 4s | 16s | gt | max |
|---|---|---|---|---|---|---|---|---|---|---|---|
| my5621_rel.cz10a_gcp_c2s30 | 0.049 | 68.338 | 31.469 | 0.144 | 0.026 | ||||||
| my5631_rel.cz10a_gcp_c2s30 | 0.017 | 67.533 | 32.284 | 0.166 | 0.027 | ||||||
| my5641_rel.cz10a_gcp_c2s30 | 0.010 | 67.059 | 32.771 | 0.160 | 0.028 | ||||||
| my5651_rel.cz10a_gcp_c2s30 | 0.027 | 72.604 | 27.208 | 0.161 | 0.030 |
Delete response time histogram: each cell has the percentage of responses that take <= the time in the header and max is the max response time in seconds. For max values in the top 25% of the range have a red background and in the bottom 25% of the range have a green background. The red background is not used when the min value is within 80% of the max value.
| dbms | 256us | 1ms | 4ms | 16ms | 64ms | 256ms | 1s | 4s | 16s | gt | max |
|---|---|---|---|---|---|---|---|---|---|---|---|
| my5621_rel.cz10a_gcp_c2s30 | 0.754 | 76.463 | 22.698 | 0.085 | 0.026 | ||||||
| my5631_rel.cz10a_gcp_c2s30 | 0.364 | 76.298 | 23.233 | 0.105 | 0.029 | ||||||
| my5641_rel.cz10a_gcp_c2s30 | 0.539 | 75.791 | 23.565 | 0.105 | 0.029 | ||||||
| my5651_rel.cz10a_gcp_c2s30 | 0.749 | 80.275 | 18.875 | 0.101 | 0.028 |
Performance metrics for the DBMS listed above. Some are normalized by throughput, others are not. Legend for results is here.
ips	qps	rps	rmbps	wps	wmbps	rpq	rkbpq	wpi	wkbpi	csps	cpups	cspq	cpupq	dbgb1	dbgb2	rss	maxop	p50	p99	tag
7947	78534	1	0.0	742.8	26.4	0.000	0.000	0.093	3.402	293420	57.3	3.736	109	42.3	110.5	50.7	0.015	9929	9722	my5621_rel.cz10a_gcp_c2s30
7940	76865	0	0.0	1668.4	54.3	0.000	0.000	0.210	7.001	289211	57.6	3.763	112	41.6	108.9	49.5	0.014	9701	9174	my5631_rel.cz10a_gcp_c2s30
7940	77339	0	0.0	769.7	27.1	0.000	0.000	0.097	3.499	289297	57.3	3.741	111	41.7	109.0	49.7	0.013	9859	9637	my5641_rel.cz10a_gcp_c2s30
7940	78333	0	0.0	768.9	27.2	0.000	0.000	0.097	3.506	292616	57.3	3.736	110	41.6	108.8	49.4	0.015	9826	9557	my5651_rel.cz10a_gcp_c2s30
qp1000.L6
qp1000.L6: point queries with 1000 insert/s per client. Graphs for performance per 1-second interval are here.
Average throughput:
Query response time histogram: each cell has the percentage of responses that take <= the time in the header and max is the max response time in seconds. For max values in the top 25% of the range have a red background and in the bottom 25% of the range have a green background. The red background is not used when the min value is within 80% of the max value.
| dbms | 256us | 1ms | 4ms | 16ms | 64ms | 256ms | 1s | 4s | 16s | gt | max |
|---|---|---|---|---|---|---|---|---|---|---|---|
| my5621_rel.cz10a_gcp_c2s30 | 99.645 | 0.295 | 0.058 | 0.002 | nonzero | 0.018 | |||||
| my5631_rel.cz10a_gcp_c2s30 | 99.660 | 0.283 | 0.056 | 0.002 | 0.014 | ||||||
| my5641_rel.cz10a_gcp_c2s30 | 99.646 | 0.295 | 0.057 | 0.002 | 0.013 | ||||||
| my5651_rel.cz10a_gcp_c2s30 | 99.664 | 0.277 | 0.057 | 0.002 | 0.015 |
Insert response time histogram: each cell has the percentage of responses that take <= the time in the header and max is the max response time in seconds. For max values in the top 25% of the range have a red background and in the bottom 25% of the range have a green background. The red background is not used when the min value is within 80% of the max value.
| dbms | 256us | 1ms | 4ms | 16ms | 64ms | 256ms | 1s | 4s | 16s | gt | max |
|---|---|---|---|---|---|---|---|---|---|---|---|
| my5621_rel.cz10a_gcp_c2s30 | 0.010 | 66.450 | 33.310 | 0.229 | 0.032 | ||||||
| my5631_rel.cz10a_gcp_c2s30 | 0.012 | 67.656 | 32.108 | 0.224 | 0.027 | ||||||
| my5641_rel.cz10a_gcp_c2s30 | 0.008 | 66.647 | 33.109 | 0.235 | 0.031 | ||||||
| my5651_rel.cz10a_gcp_c2s30 | 0.004 | 68.024 | 31.701 | 0.271 | 0.030 |
Delete response time histogram: each cell has the percentage of responses that take <= the time in the header and max is the max response time in seconds. For max values in the top 25% of the range have a red background and in the bottom 25% of the range have a green background. The red background is not used when the min value is within 80% of the max value.
| dbms | 256us | 1ms | 4ms | 16ms | 64ms | 256ms | 1s | 4s | 16s | gt | max |
|---|---|---|---|---|---|---|---|---|---|---|---|
| my5621_rel.cz10a_gcp_c2s30 | 0.508 | 75.158 | 24.212 | 0.122 | 0.028 | ||||||
| my5631_rel.cz10a_gcp_c2s30 | 0.320 | 76.407 | 23.156 | 0.117 | 0.027 | ||||||
| my5641_rel.cz10a_gcp_c2s30 | 0.235 | 76.025 | 23.605 | 0.134 | 0.031 | ||||||
| my5651_rel.cz10a_gcp_c2s30 | 0.305 | 76.906 | 22.613 | 0.177 | 0.032 |
Performance metrics for the DBMS listed above. Some are normalized by throughput, others are not. Legend for results is here.
ips	qps	rps	rmbps	wps	wmbps	rpq	rkbpq	wpi	wkbpi	csps	cpups	cspq	cpupq	dbgb1	dbgb2	rss	maxop	p50	p99	tag
7947	63656	1	0.0	1494.4	49.1	0.000	0.000	0.188	6.331	250128	57.4	3.929	135	42.3	110.5	50.8	0.018	8058	7687	my5621_rel.cz10a_gcp_c2s30
7940	62903	0	0.0	1934.0	62.3	0.000	0.000	0.244	8.031	247846	57.8	3.940	138	41.6	108.9	49.5	0.014	7959	7544	my5631_rel.cz10a_gcp_c2s30
7940	62894	0	0.0	1393.4	46.0	0.000	0.000	0.175	5.931	247012	57.6	3.927	137	41.7	109.0	49.7	0.013	7959	7560	my5641_rel.cz10a_gcp_c2s30
7947	63461	0	0.0	1509.2	49.5	0.000	0.000	0.190	6.377	249075	57.4	3.925	136	41.6	108.8	49.5	0.015	8055	7640	my5651_rel.cz10a_gcp_c2s30
l.i0
l.i0: load without secondary indexes
Performance metrics for all DBMS, not just the ones listed above. Some are normalized by throughput, others are not. Legend for results is here.
ips	qps	rps	rmbps	wps	wmbps	rpq	rkbpq	wpi	wkbpi	csps	cpups	cspq	cpupq	dbgb1	dbgb2	rss	maxop	p50	p99	tag
792079	0	0	0.0	1590.7	158.1	0.000	0.000	0.002	0.204	75363	70.6	0.095	13	10.6	75.1	15.6	0.300	107583	84109	my5621_rel.cz10a_gcp_c2s30
769231	0	0	0.0	1493.9	154.5	0.000	0.000	0.002	0.206	73830	70.6	0.096	14	10.6	75.1	16.7	0.247	103320	81413	my5631_rel.cz10a_gcp_c2s30
765550	0	0	0.0	1491.6	150.9	0.000	0.000	0.002	0.202	73872	70.5	0.096	14	10.6	75.1	16.8	0.253	103189	79914	my5641_rel.cz10a_gcp_c2s30
769231	0	0	0.0	1558.6	153.6	0.000	0.000	0.002	0.204	72311	70.7	0.094	14	10.6	75.1	16.8	0.248	103489	78739	my5651_rel.cz10a_gcp_c2s30
l.x
l.x: create secondary indexes
Performance metrics for all DBMS, not just the ones listed above. Some are normalized by throughput, others are not. Legend for results is here.
ips	qps	rps	rmbps	wps	wmbps	rpq	rkbpq	wpi	wkbpi	csps	cpups	cspq	cpupq	dbgb1	dbgb2	rss	maxop	p50	p99	tag
610687	0	0	0.0	8033.3	662.8	0.000	0.000	0.013	1.111	18846	41.0	0.031	10	22.3	86.8	27.3	0.001	NA	NA	my5621_rel.cz10a_gcp_c2s30
590406	0	0	0.0	7867.7	642.4	0.000	0.000	0.013	1.114	18477	40.7	0.031	10	22.3	86.8	28.6	0.001	NA	NA	my5631_rel.cz10a_gcp_c2s30
601504	0	0	0.0	7545.2	642.1	0.000	0.000	0.013	1.093	16718	41.1	0.028	10	22.3	86.8	27.0	0.001	NA	NA	my5641_rel.cz10a_gcp_c2s30
603774	0	0	0.0	7683.9	652.8	0.000	0.000	0.013	1.107	17162	41.5	0.028	10	22.3	86.8	27.2	0.001	NA	NA	my5651_rel.cz10a_gcp_c2s30
l.i1
l.i1: continue load after secondary indexes created with 50 inserts per transaction
Performance metrics for all DBMS, not just the ones listed above. Some are normalized by throughput, others are not. Legend for results is here.
ips	qps	rps	rmbps	wps	wmbps	rpq	rkbpq	wpi	wkbpi	csps	cpups	cspq	cpupq	dbgb1	dbgb2	rss	maxop	p50	p99	tag
90549	0	1556	6.1	4849.4	183.0	0.017	0.069	0.054	2.070	148857	71.7	1.644	119	42.3	110.0	50.0	0.251	9689	7547	my5621_rel.cz10a_gcp_c2s30
88889	0	1549	6.1	4780.0	180.3	0.017	0.070	0.054	2.077	149408	72.0	1.681	122	41.6	108.9	49.0	0.269	9590	7444	my5631_rel.cz10a_gcp_c2s30
89410	0	1548	6.0	4836.5	181.7	0.017	0.069	0.054	2.081	149285	72.0	1.670	121	41.7	109.0	49.2	0.292	9640	7692	my5641_rel.cz10a_gcp_c2s30
89510	0	1558	6.1	4808.6	181.1	0.017	0.070	0.054	2.071	147661	72.3	1.650	121	41.6	108.8	48.9	0.271	9593	7542	my5651_rel.cz10a_gcp_c2s30
l.i2
l.i2: continue load after secondary indexes created with 5 inserts per transaction
Performance metrics for all DBMS, not just the ones listed above. Some are normalized by throughput, others are not. Legend for results is here.
ips	qps	rps	rmbps	wps	wmbps	rpq	rkbpq	wpi	wkbpi	csps	cpups	cspq	cpupq	dbgb1	dbgb2	rss	maxop	p50	p99	tag
24930	0	3828	15.0	2600.5	89.3	0.154	0.614	0.104	3.667	320999	63.1	12.876	380	42.3	110.5	50.6	0.099	3093	2837	my5621_rel.cz10a_gcp_c2s30
38314	0	1892	7.4	3840.0	138.0	0.049	0.198	0.100	3.689	247120	71.3	6.450	279	41.6	108.9	49.4	0.231	5554	2797	my5631_rel.cz10a_gcp_c2s30
38259	0	1877	7.3	3808.3	137.0	0.049	0.196	0.100	3.667	245860	71.4	6.426	280	41.7	109.0	49.5	0.224	5506	2782	my5641_rel.cz10a_gcp_c2s30
38480	0	1895	7.4	3805.7	137.1	0.049	0.197	0.099	3.648	246415	71.3	6.404	278	41.6	108.8	49.3	0.232	5559	2792	my5651_rel.cz10a_gcp_c2s30
qr100.L1
qr100.L1: range queries with 100 insert/s per client
Performance metrics for all DBMS, not just the ones listed above. Some are normalized by throughput, others are not. Legend for results is here.
ips	qps	rps	rmbps	wps	wmbps	rpq	rkbpq	wpi	wkbpi	csps	cpups	cspq	cpupq	dbgb1	dbgb2	rss	maxop	p50	p99	tag
794	78402	28	0.1	3772.4	115.6	0.000	0.001	4.751	149.110	302504	55.4	3.858	106	42.3	110.5	50.6	0.015	10165	6841	my5621_rel.cz10a_gcp_c2s30
793	79102	26	0.1	3704.3	112.2	0.000	0.001	4.669	144.863	308095	54.0	3.895	102	41.6	108.9	49.4	0.011	10085	9573	my5631_rel.cz10a_gcp_c2s30
794	79506	26	0.1	3335.2	101.1	0.000	0.001	4.200	130.359	308824	53.8	3.884	102	41.7	109.0	49.5	0.010	10197	9685	my5641_rel.cz10a_gcp_c2s30
794	78677	26	0.1	3520.6	106.7	0.000	0.001	4.434	137.614	305573	53.9	3.884	103	41.6	108.8	49.3	0.011	10005	9497	my5651_rel.cz10a_gcp_c2s30
qp100.L2
qp100.L2: point queries with 100 insert/s per client
Performance metrics for all DBMS, not just the ones listed above. Some are normalized by throughput, others are not. Legend for results is here.
ips	qps	rps	rmbps	wps	wmbps	rpq	rkbpq	wpi	wkbpi	csps	cpups	cspq	cpupq	dbgb1	dbgb2	rss	maxop	p50	p99	tag
794	66094	26	0.1	260.5	8.3	0.000	0.002	0.328	10.683	263839	53.4	3.992	121	42.3	110.5	50.6	0.010	8311	8042	my5621_rel.cz10a_gcp_c2s30
794	65503	26	0.1	565.1	17.5	0.000	0.002	0.712	22.512	261960	53.4	3.999	122	41.6	108.9	49.4	0.010	8263	8007	my5631_rel.cz10a_gcp_c2s30
794	65713	26	0.1	396.8	12.4	0.000	0.002	0.500	15.963	262552	53.4	3.995	122	41.7	109.0	49.6	0.009	8295	8039	my5641_rel.cz10a_gcp_c2s30
794	65915	26	0.1	12.3	0.8	0.000	0.002	0.015	0.994	262750	53.3	3.986	121	41.6	108.8	49.3	0.009	8311	8199	my5651_rel.cz10a_gcp_c2s30
qr500.L3
qr500.L3: range queries with 500 insert/s per client
Performance metrics for all DBMS, not just the ones listed above. Some are normalized by throughput, others are not. Legend for results is here.
ips	qps	rps	rmbps	wps	wmbps	rpq	rkbpq	wpi	wkbpi	csps	cpups	cspq	cpupq	dbgb1	dbgb2	rss	maxop	p50	p99	tag
3967	79412	50	0.2	21.7	2.7	0.001	0.003	0.005	0.685	303627	55.3	3.823	104	42.3	110.5	50.7	0.011	10021	9832	my5621_rel.cz10a_gcp_c2s30
3970	78008	113	0.4	21.3	2.6	0.001	0.006	0.005	0.665	300630	55.4	3.854	107	41.6	108.9	49.4	0.010	9849	9705	my5631_rel.cz10a_gcp_c2s30
3970	78237	111	0.4	21.8	2.5	0.001	0.006	0.005	0.655	301409	55.4	3.852	106	41.7	109.0	49.6	0.034	9925	9769	my5641_rel.cz10a_gcp_c2s30
3970	78153	114	0.4	20.7	2.5	0.001	0.006	0.005	0.634	301211	55.4	3.854	106	41.6	108.8	49.4	0.012	9813	9685	my5651_rel.cz10a_gcp_c2s30
qp500.L4
qp500.L4: point queries with 500 insert/s per client
Performance metrics for all DBMS, not just the ones listed above. Some are normalized by throughput, others are not. Legend for results is here.
ips	qps	rps	rmbps	wps	wmbps	rpq	rkbpq	wpi	wkbpi	csps	cpups	cspq	cpupq	dbgb1	dbgb2	rss	maxop	p50	p99	tag
3967	64775	0	0.0	1996.4	62.3	0.000	0.000	0.503	16.070	259918	55.4	4.013	128	42.3	110.5	50.7	0.013	8199	7800	my5621_rel.cz10a_gcp_c2s30
3970	63364	102	0.4	2316.5	71.9	0.002	0.006	0.583	18.541	258320	55.9	4.077	132	41.6	108.9	49.5	0.011	8023	7640	my5631_rel.cz10a_gcp_c2s30
3967	63300	111	0.4	1955.7	61.0	0.002	0.007	0.493	15.758	258024	55.7	4.076	132	41.7	109.0	49.6	0.011	7991	7624	my5641_rel.cz10a_gcp_c2s30
3967	63678	104	0.4	2400.6	74.4	0.002	0.007	0.605	19.199	259961	55.8	4.082	131	41.6	108.8	49.4	0.012	8087	7690	my5651_rel.cz10a_gcp_c2s30
qr1000.L5
qr1000.L5: range queries with 1000 insert/s per client
Performance metrics for all DBMS, not just the ones listed above. Some are normalized by throughput, others are not. Legend for results is here.
ips	qps	rps	rmbps	wps	wmbps	rpq	rkbpq	wpi	wkbpi	csps	cpups	cspq	cpupq	dbgb1	dbgb2	rss	maxop	p50	p99	tag
7947	78534	1	0.0	742.8	26.4	0.000	0.000	0.093	3.402	293420	57.3	3.736	109	42.3	110.5	50.7	0.015	9929	9722	my5621_rel.cz10a_gcp_c2s30
7940	76865	0	0.0	1668.4	54.3	0.000	0.000	0.210	7.001	289211	57.6	3.763	112	41.6	108.9	49.5	0.014	9701	9174	my5631_rel.cz10a_gcp_c2s30
7940	77339	0	0.0	769.7	27.1	0.000	0.000	0.097	3.499	289297	57.3	3.741	111	41.7	109.0	49.7	0.013	9859	9637	my5641_rel.cz10a_gcp_c2s30
7940	78333	0	0.0	768.9	27.2	0.000	0.000	0.097	3.506	292616	57.3	3.736	110	41.6	108.8	49.4	0.015	9826	9557	my5651_rel.cz10a_gcp_c2s30
qp1000.L6
qp1000.L6: point queries with 1000 insert/s per client
Performance metrics for all DBMS, not just the ones listed above. Some are normalized by throughput, others are not. Legend for results is here.
ips	qps	rps	rmbps	wps	wmbps	rpq	rkbpq	wpi	wkbpi	csps	cpups	cspq	cpupq	dbgb1	dbgb2	rss	maxop	p50	p99	tag
7947	63656	1	0.0	1494.4	49.1	0.000	0.000	0.188	6.331	250128	57.4	3.929	135	42.3	110.5	50.8	0.018	8058	7687	my5621_rel.cz10a_gcp_c2s30
7940	62903	0	0.0	1934.0	62.3	0.000	0.000	0.244	8.031	247846	57.8	3.940	138	41.6	108.9	49.5	0.014	7959	7544	my5631_rel.cz10a_gcp_c2s30
7940	62894	0	0.0	1393.4	46.0	0.000	0.000	0.175	5.931	247012	57.6	3.927	137	41.7	109.0	49.7	0.013	7959	7560	my5641_rel.cz10a_gcp_c2s30
7947	63461	0	0.0	1509.2	49.5	0.000	0.000	0.190	6.377	249075	57.4	3.925	136	41.6	108.8	49.5	0.015	8055	7640	my5651_rel.cz10a_gcp_c2s30
l.i0
- l.i0: load without secondary indexes
- Legend for results is here.
- Each entry lists the percentage of responses that fit in that bucket (slower than max time for previous bucket, faster than min time for next bucket).
Insert response time histogram
256us	1ms	4ms	16ms	64ms	256ms	1s	4s	16s	gt	max	tag
0.000	98.055	1.827	0.016	0.031	0.070	0.001	0.000	0.000	0.000	0.300	my5621_rel.cz10a_gcp_c2s30
0.000	97.281	2.600	0.015	0.032	0.071	0.000	0.000	0.000	0.000	0.247	my5631_rel.cz10a_gcp_c2s30
0.000	97.325	2.557	0.017	0.033	0.068	0.000	0.000	0.000	0.000	0.253	my5641_rel.cz10a_gcp_c2s30
0.000	97.337	2.540	0.017	0.040	0.065	0.000	0.000	0.000	0.000	0.248	my5651_rel.cz10a_gcp_c2s30
l.x
- l.x: create secondary indexes
- Legend for results is here.
- Each entry lists the percentage of responses that fit in that bucket (slower than max time for previous bucket, faster than min time for next bucket).
TODO - determine whether there is data for create index response time
l.i1
- l.i1: continue load after secondary indexes created with 50 inserts per transaction
- Legend for results is here.
- Each entry lists the percentage of responses that fit in that bucket (slower than max time for previous bucket, faster than min time for next bucket).
Insert response time histogram
256us	1ms	4ms	16ms	64ms	256ms	1s	4s	16s	gt	max	tag
0.000	0.001	49.078	50.482	0.415	0.025	0.000	0.000	0.000	0.000	0.251	my5621_rel.cz10a_gcp_c2s30
0.000	0.001	47.372	52.188	0.416	0.023	nonzero	0.000	0.000	0.000	0.269	my5631_rel.cz10a_gcp_c2s30
0.000	0.001	48.012	51.550	0.413	0.024	nonzero	0.000	0.000	0.000	0.292	my5641_rel.cz10a_gcp_c2s30
0.000	nonzero	48.033	51.529	0.413	0.024	nonzero	0.000	0.000	0.000	0.271	my5651_rel.cz10a_gcp_c2s30
Delete response time histogram
256us	1ms	4ms	16ms	64ms	256ms	1s	4s	16s	gt	max	tag
0.000	0.004	65.001	34.621	0.354	0.020	0.000	0.000	0.000	0.000	0.251	my5621_rel.cz10a_gcp_c2s30
0.000	0.004	62.708	36.914	0.355	0.019	nonzero	0.000	0.000	0.000	0.266	my5631_rel.cz10a_gcp_c2s30
0.000	0.004	63.988	35.637	0.351	0.019	0.000	0.000	0.000	0.000	0.250	my5641_rel.cz10a_gcp_c2s30
0.000	0.004	63.845	35.778	0.353	0.020	0.000	0.000	0.000	0.000	0.240	my5651_rel.cz10a_gcp_c2s30
l.i2
- l.i2: continue load after secondary indexes created with 5 inserts per transaction
- Legend for results is here.
- Each entry lists the percentage of responses that fit in that bucket (slower than max time for previous bucket, faster than min time for next bucket).
Insert response time histogram
256us	1ms	4ms	16ms	64ms	256ms	1s	4s	16s	gt	max	tag
0.076	20.460	78.632	0.821	0.008	0.002	0.000	0.000	0.000	0.000	0.099	my5621_rel.cz10a_gcp_c2s30
3.358	58.367	37.775	0.446	0.053	0.001	0.000	0.000	0.000	0.000	0.231	my5631_rel.cz10a_gcp_c2s30
3.078	58.588	37.830	0.449	0.054	0.002	0.000	0.000	0.000	0.000	0.224	my5641_rel.cz10a_gcp_c2s30
3.434	58.636	37.427	0.449	0.052	0.002	0.000	0.000	0.000	0.000	0.232	my5651_rel.cz10a_gcp_c2s30
Delete response time histogram
256us	1ms	4ms	16ms	64ms	256ms	1s	4s	16s	gt	max	tag
0.099	25.613	73.645	0.634	0.008	0.001	0.000	0.000	0.000	0.000	0.100	my5621_rel.cz10a_gcp_c2s30
5.244	58.646	35.692	0.364	0.052	0.001	0.000	0.000	0.000	0.000	0.232	my5631_rel.cz10a_gcp_c2s30
5.233	58.794	35.551	0.368	0.053	0.001	0.000	0.000	0.000	0.000	0.223	my5641_rel.cz10a_gcp_c2s30
5.631	58.736	35.211	0.370	0.051	0.002	0.000	0.000	0.000	0.000	0.232	my5651_rel.cz10a_gcp_c2s30
qr100.L1
- qr100.L1: range queries with 100 insert/s per client
- Legend for results is here.
- Each entry lists the percentage of responses that fit in that bucket (slower than max time for previous bucket, faster than min time for next bucket).
Query response time histogram
256us	1ms	4ms	16ms	64ms	256ms	1s	4s	16s	gt	max	tag
99.926	0.065	0.006	0.003	0.000	0.000	0.000	0.000	0.000	0.000	0.015	my5621_rel.cz10a_gcp_c2s30
99.954	0.041	0.004	nonzero	0.000	0.000	0.000	0.000	0.000	0.000	0.011	my5631_rel.cz10a_gcp_c2s30
99.956	0.040	0.003	nonzero	0.000	0.000	0.000	0.000	0.000	0.000	0.010	my5641_rel.cz10a_gcp_c2s30
99.954	0.041	0.004	0.001	0.000	0.000	0.000	0.000	0.000	0.000	0.011	my5651_rel.cz10a_gcp_c2s30
Insert response time histogram
256us	1ms	4ms	16ms	64ms	256ms	1s	4s	16s	gt	max	tag
0.000	0.000	76.182	23.667	0.151	0.000	0.000	0.000	0.000	0.000	0.036	my5621_rel.cz10a_gcp_c2s30
0.000	0.000	82.839	17.156	0.005	0.000	0.000	0.000	0.000	0.000	0.016	my5631_rel.cz10a_gcp_c2s30
0.000	0.000	86.651	13.344	0.005	0.000	0.000	0.000	0.000	0.000	0.016	my5641_rel.cz10a_gcp_c2s30
0.000	0.000	86.120	13.865	0.016	0.000	0.000	0.000	0.000	0.000	0.016	my5651_rel.cz10a_gcp_c2s30
Delete response time histogram
256us	1ms	4ms	16ms	64ms	256ms	1s	4s	16s	gt	max	tag
0.000	0.068	88.703	11.104	0.125	0.000	0.000	0.000	0.000	0.000	0.036	my5621_rel.cz10a_gcp_c2s30
0.000	0.109	88.760	11.125	0.005	0.000	0.000	0.000	0.000	0.000	0.017	my5631_rel.cz10a_gcp_c2s30
0.000	0.078	91.542	8.375	0.005	0.000	0.000	0.000	0.000	0.000	0.018	my5641_rel.cz10a_gcp_c2s30
0.000	0.094	90.958	8.932	0.016	0.000	0.000	0.000	0.000	0.000	0.020	my5651_rel.cz10a_gcp_c2s30
qp100.L2
- qp100.L2: point queries with 100 insert/s per client
- Legend for results is here.
- Each entry lists the percentage of responses that fit in that bucket (slower than max time for previous bucket, faster than min time for next bucket).
Query response time histogram
256us	1ms	4ms	16ms	64ms	256ms	1s	4s	16s	gt	max	tag
99.932	0.064	0.004	nonzero	0.000	0.000	0.000	0.000	0.000	0.000	0.010	my5621_rel.cz10a_gcp_c2s30
99.932	0.063	0.004	nonzero	0.000	0.000	0.000	0.000	0.000	0.000	0.010	my5631_rel.cz10a_gcp_c2s30
99.931	0.065	0.004	nonzero	0.000	0.000	0.000	0.000	0.000	0.000	0.009	my5641_rel.cz10a_gcp_c2s30
99.932	0.063	0.004	nonzero	0.000	0.000	0.000	0.000	0.000	0.000	0.009	my5651_rel.cz10a_gcp_c2s30
Insert response time histogram
256us	1ms	4ms	16ms	64ms	256ms	1s	4s	16s	gt	max	tag
0.000	0.000	78.188	21.807	0.005	0.000	0.000	0.000	0.000	0.000	0.017	my5621_rel.cz10a_gcp_c2s30
0.000	0.000	74.422	25.536	0.042	0.000	0.000	0.000	0.000	0.000	0.022	my5631_rel.cz10a_gcp_c2s30
0.000	0.000	82.557	17.427	0.016	0.000	0.000	0.000	0.000	0.000	0.019	my5641_rel.cz10a_gcp_c2s30
0.000	0.000	79.323	20.677	0.000	0.000	0.000	0.000	0.000	0.000	0.013	my5651_rel.cz10a_gcp_c2s30
Delete response time histogram
256us	1ms	4ms	16ms	64ms	256ms	1s	4s	16s	gt	max	tag
0.000	0.005	86.625	13.370	0.000	0.000	0.000	0.000	0.000	0.000	0.015	my5621_rel.cz10a_gcp_c2s30
0.000	0.000	84.333	15.661	0.005	0.000	0.000	0.000	0.000	0.000	0.016	my5631_rel.cz10a_gcp_c2s30
0.000	0.036	90.198	9.766	0.000	0.000	0.000	0.000	0.000	0.000	0.015	my5641_rel.cz10a_gcp_c2s30
0.000	0.010	88.193	11.797	0.000	0.000	0.000	0.000	0.000	0.000	0.012	my5651_rel.cz10a_gcp_c2s30
qr500.L3
- qr500.L3: range queries with 500 insert/s per client
- Legend for results is here.
- Each entry lists the percentage of responses that fit in that bucket (slower than max time for previous bucket, faster than min time for next bucket).
Query response time histogram
256us	1ms	4ms	16ms	64ms	256ms	1s	4s	16s	gt	max	tag
99.806	0.164	0.029	0.001	0.000	0.000	0.000	0.000	0.000	0.000	0.011	my5621_rel.cz10a_gcp_c2s30
99.685	0.276	0.038	0.001	0.000	0.000	0.000	0.000	0.000	0.000	0.010	my5631_rel.cz10a_gcp_c2s30
99.688	0.274	0.038	0.001	nonzero	0.000	0.000	0.000	0.000	0.000	0.034	my5641_rel.cz10a_gcp_c2s30
99.688	0.274	0.037	0.001	0.000	0.000	0.000	0.000	0.000	0.000	0.012	my5651_rel.cz10a_gcp_c2s30
Insert response time histogram
256us	1ms	4ms	16ms	64ms	256ms	1s	4s	16s	gt	max	tag
0.000	0.006	60.381	39.145	0.468	0.000	0.000	0.000	0.000	0.000	0.029	my5621_rel.cz10a_gcp_c2s30
0.000	0.002	35.258	63.661	1.078	0.000	0.000	0.000	0.000	0.000	0.030	my5631_rel.cz10a_gcp_c2s30
0.000	0.000	35.405	63.549	1.046	0.000	0.000	0.000	0.000	0.000	0.043	my5641_rel.cz10a_gcp_c2s30
0.000	0.001	35.453	63.486	1.059	0.000	0.000	0.000	0.000	0.000	0.030	my5651_rel.cz10a_gcp_c2s30
Delete response time histogram
256us	1ms	4ms	16ms	64ms	256ms	1s	4s	16s	gt	max	tag
0.000	0.572	67.303	31.869	0.256	0.000	0.000	0.000	0.000	0.000	0.029	my5621_rel.cz10a_gcp_c2s30
0.000	0.015	43.356	55.995	0.634	0.000	0.000	0.000	0.000	0.000	0.029	my5631_rel.cz10a_gcp_c2s30
0.000	0.016	44.289	55.150	0.546	0.000	0.000	0.000	0.000	0.000	0.043	my5641_rel.cz10a_gcp_c2s30
0.000	0.022	43.601	55.780	0.597	0.000	0.000	0.000	0.000	0.000	0.027	my5651_rel.cz10a_gcp_c2s30
qp500.L4
- qp500.L4: point queries with 500 insert/s per client
- Legend for results is here.
- Each entry lists the percentage of responses that fit in that bucket (slower than max time for previous bucket, faster than min time for next bucket).
Query response time histogram
256us	1ms	4ms	16ms	64ms	256ms	1s	4s	16s	gt	max	tag
99.826	0.145	0.028	0.001	0.000	0.000	0.000	0.000	0.000	0.000	0.013	my5621_rel.cz10a_gcp_c2s30
99.643	0.324	0.032	0.001	0.000	0.000	0.000	0.000	0.000	0.000	0.011	my5631_rel.cz10a_gcp_c2s30
99.618	0.348	0.034	0.001	0.000	0.000	0.000	0.000	0.000	0.000	0.011	my5641_rel.cz10a_gcp_c2s30
99.637	0.328	0.034	0.001	0.000	0.000	0.000	0.000	0.000	0.000	0.012	my5651_rel.cz10a_gcp_c2s30
Insert response time histogram
256us	1ms	4ms	16ms	64ms	256ms	1s	4s	16s	gt	max	tag
0.000	0.006	78.842	21.042	0.110	0.000	0.000	0.000	0.000	0.000	0.024	my5621_rel.cz10a_gcp_c2s30
0.000	0.000	39.416	59.256	1.328	0.000	0.000	0.000	0.000	0.000	0.030	my5631_rel.cz10a_gcp_c2s30
0.000	0.000	34.710	63.774	1.516	0.000	0.000	0.000	0.000	0.000	0.032	my5641_rel.cz10a_gcp_c2s30
0.000	0.001	37.250	61.327	1.422	0.000	0.000	0.000	0.000	0.000	0.037	my5651_rel.cz10a_gcp_c2s30
Delete response time histogram
256us	1ms	4ms	16ms	64ms	256ms	1s	4s	16s	gt	max	tag
0.000	0.435	85.002	14.503	0.059	0.000	0.000	0.000	0.000	0.000	0.022	my5621_rel.cz10a_gcp_c2s30
0.000	0.057	47.721	51.490	0.732	0.000	0.000	0.000	0.000	0.000	0.031	my5631_rel.cz10a_gcp_c2s30
0.000	0.010	43.703	55.393	0.894	0.000	0.000	0.000	0.000	0.000	0.031	my5641_rel.cz10a_gcp_c2s30
0.000	0.049	45.358	53.719	0.874	0.000	0.000	0.000	0.000	0.000	0.037	my5651_rel.cz10a_gcp_c2s30
qr1000.L5
- qr1000.L5: range queries with 1000 insert/s per client
- Legend for results is here.
- Each entry lists the percentage of responses that fit in that bucket (slower than max time for previous bucket, faster than min time for next bucket).
Query response time histogram
256us	1ms	4ms	16ms	64ms	256ms	1s	4s	16s	gt	max	tag
99.740	0.200	0.058	0.002	0.000	0.000	0.000	0.000	0.000	0.000	0.015	my5621_rel.cz10a_gcp_c2s30
99.727	0.209	0.061	0.002	0.000	0.000	0.000	0.000	0.000	0.000	0.014	my5631_rel.cz10a_gcp_c2s30
99.730	0.206	0.062	0.002	0.000	0.000	0.000	0.000	0.000	0.000	0.013	my5641_rel.cz10a_gcp_c2s30
99.762	0.180	0.055	0.002	0.000	0.000	0.000	0.000	0.000	0.000	0.015	my5651_rel.cz10a_gcp_c2s30
Insert response time histogram
256us	1ms	4ms	16ms	64ms	256ms	1s	4s	16s	gt	max	tag
0.000	0.049	68.338	31.469	0.144	0.000	0.000	0.000	0.000	0.000	0.026	my5621_rel.cz10a_gcp_c2s30
0.000	0.017	67.533	32.284	0.166	0.000	0.000	0.000	0.000	0.000	0.027	my5631_rel.cz10a_gcp_c2s30
0.000	0.010	67.059	32.771	0.160	0.000	0.000	0.000	0.000	0.000	0.028	my5641_rel.cz10a_gcp_c2s30
0.000	0.027	72.604	27.208	0.161	0.000	0.000	0.000	0.000	0.000	0.030	my5651_rel.cz10a_gcp_c2s30
Delete response time histogram
256us	1ms	4ms	16ms	64ms	256ms	1s	4s	16s	gt	max	tag
0.000	0.754	76.463	22.698	0.085	0.000	0.000	0.000	0.000	0.000	0.026	my5621_rel.cz10a_gcp_c2s30
0.000	0.364	76.298	23.233	0.105	0.000	0.000	0.000	0.000	0.000	0.029	my5631_rel.cz10a_gcp_c2s30
0.000	0.539	75.791	23.565	0.105	0.000	0.000	0.000	0.000	0.000	0.029	my5641_rel.cz10a_gcp_c2s30
0.000	0.749	80.275	18.875	0.101	0.000	0.000	0.000	0.000	0.000	0.028	my5651_rel.cz10a_gcp_c2s30
qp1000.L6
- qp1000.L6: point queries with 1000 insert/s per client
- Legend for results is here.
- Each entry lists the percentage of responses that fit in that bucket (slower than max time for previous bucket, faster than min time for next bucket).
Query response time histogram
256us	1ms	4ms	16ms	64ms	256ms	1s	4s	16s	gt	max	tag
99.645	0.295	0.058	0.002	nonzero	0.000	0.000	0.000	0.000	0.000	0.018	my5621_rel.cz10a_gcp_c2s30
99.660	0.283	0.056	0.002	0.000	0.000	0.000	0.000	0.000	0.000	0.014	my5631_rel.cz10a_gcp_c2s30
99.646	0.295	0.057	0.002	0.000	0.000	0.000	0.000	0.000	0.000	0.013	my5641_rel.cz10a_gcp_c2s30
99.664	0.277	0.057	0.002	0.000	0.000	0.000	0.000	0.000	0.000	0.015	my5651_rel.cz10a_gcp_c2s30
Insert response time histogram
256us	1ms	4ms	16ms	64ms	256ms	1s	4s	16s	gt	max	tag
0.000	0.010	66.450	33.310	0.229	0.000	0.000	0.000	0.000	0.000	0.032	my5621_rel.cz10a_gcp_c2s30
0.000	0.012	67.656	32.108	0.224	0.000	0.000	0.000	0.000	0.000	0.027	my5631_rel.cz10a_gcp_c2s30
0.000	0.008	66.647	33.109	0.235	0.000	0.000	0.000	0.000	0.000	0.031	my5641_rel.cz10a_gcp_c2s30
0.000	0.004	68.024	31.701	0.271	0.000	0.000	0.000	0.000	0.000	0.030	my5651_rel.cz10a_gcp_c2s30
Delete response time histogram
256us	1ms	4ms	16ms	64ms	256ms	1s	4s	16s	gt	max	tag
0.000	0.508	75.158	24.212	0.122	0.000	0.000	0.000	0.000	0.000	0.028	my5621_rel.cz10a_gcp_c2s30
0.000	0.320	76.407	23.156	0.117	0.000	0.000	0.000	0.000	0.000	0.027	my5631_rel.cz10a_gcp_c2s30
0.000	0.235	76.025	23.605	0.134	0.000	0.000	0.000	0.000	0.000	0.031	my5641_rel.cz10a_gcp_c2s30
0.000	0.305	76.906	22.613	0.177	0.000	0.000	0.000	0.000	0.000	0.032	my5651_rel.cz10a_gcp_c2s30