Introduction
This is a report for the insert benchmark with 160M docs and 8 client(s). It is generated by scripts (bash, awk, sed) and Tufte might not be impressed. An overview of the insert benchmark is here and a short update is here. Below, by DBMS, I mean DBMS+version.config. An example is my8020.c10b40 where my means MySQL, 8020 is version 8.0.20 and c10b40 is the name for the configuration file.
The test server is a c2-standard-30 from GCP with 15 cores, hyperthreads disabled, Ubuntu 22.04 and XFS using SW RAID 0 over 4 local SSDs. The benchmark was run with 8 clients and there were 1, 2 or 3 connections per client. It uses 8 tables with a client per table. It loads 20M rows per table without secondary indexes, creates 3 secondary indexes per table, then inserts 50m+50m rows per table with a delete per insert to avoid growing the table. It then does 6 read+write tests for 1200s each that do queries as fast as possible with 100,100,500,500,1000,1000 inserts/s and the same for deletes/s per client concurrent with the queries. The database is cached in memory. Clients and the DBMS share one server. The per-database configs are in the per-database subdirectories here.
The tested DBMS are:
- fbmy5635_rel_221222.cza1_gcp_c2s30 - MyRocks 5.6.35 compiled on Dec 22, 2023 at git hash 4f3a57a1, RocksDB 8.7.0 at git hash 29005f0b, cza1_gcp_c2s30 config
- fbmy8028_rel_221222.cza1_gcp_c2s30 - MyRocks 8.0.28 compiled on Dec 22, 2023 at git hash 2ad105fc, RocksDB 8.7.0 at git hash 29005f0b, cza1_gcp_c2s30 config
- fbmy8028_rel_221222.cza1ps0_gcp_c2s30 - MyRocks 8.0.28 compiled on Dec 22, 2023 at git hash 2ad105fc, RocksDB 8.7.0 at git hash 29005f0b, cza1ps0_gcp_c2s30 config
- fbmy8032_rel_221222.cza1_gcp_c2s30 - MyRocks 8.0.32 compiled on Dec 22, 2023 at git hash 76707b44, RocksDB 8.7.0 at git hash 29005f0b, cza1_gcp_c2s30 config
- fbmy8032_rel_221222.cza1ps0_gcp_c2s30 - MyRocks 8.0.32 compiled on Dec 22, 2023 at git hash 76707b44, RocksDB 8.7.0 at git hash 29005f0b, cza1ps0_gcp_c2s30 config
Contents
- Summary
- l.i0: load without secondary indexes
- l.x: create secondary indexes
- l.i1: continue load after secondary indexes created with 50 inserts per transaction
- l.i2: continue load after secondary indexes created with 5 inserts per transaction
- qr100.L1: range queries with 100 insert/s per client
- qp100.L2: point queries with 100 insert/s per client
- qr500.L3: range queries with 500 insert/s per client
- qp500.L4: point queries with 500 insert/s per client
- qr1000.L5: range queries with 1000 insert/s per client
- qp1000.L6: point queries with 1000 insert/s per client
Summary
The numbers are inserts/s for l.i0, l.i1 and l.i2, indexed docs (or rows) /s for l.x and queries/s for qr100, qp100 thru qr1000, qp1000" The values are the average rate over the entire test for inserts (IPS) and queries (QPS). The range of values for IPS and QPS is split into 3 parts: bottom 25%, middle 50%, top 25%. Values in the bottom 25% have a red background, values in the top 25% have a green background and values in the middle have no color. A gray background is used for values that can be ignored because the DBMS did not sustain the target insert rate. Red backgrounds are not used when the minimum value is within 80% of the max value.
| dbms | l.i0 | l.x | l.i1 | l.i2 | qr100 | qp100 | qr500 | qp500 | qr1000 | qp1000 |
|---|---|---|---|---|---|---|---|---|---|---|
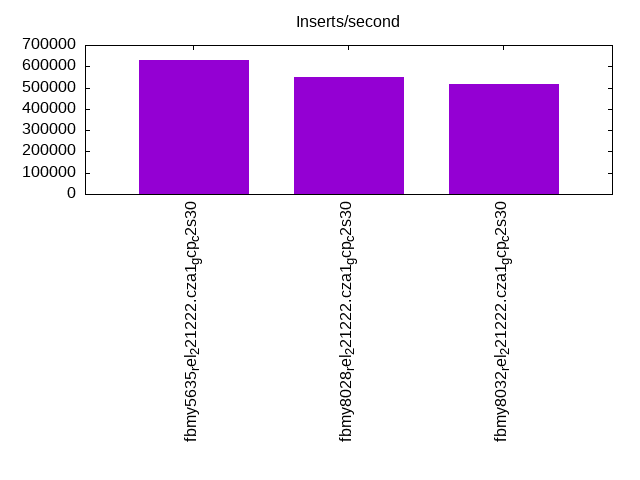
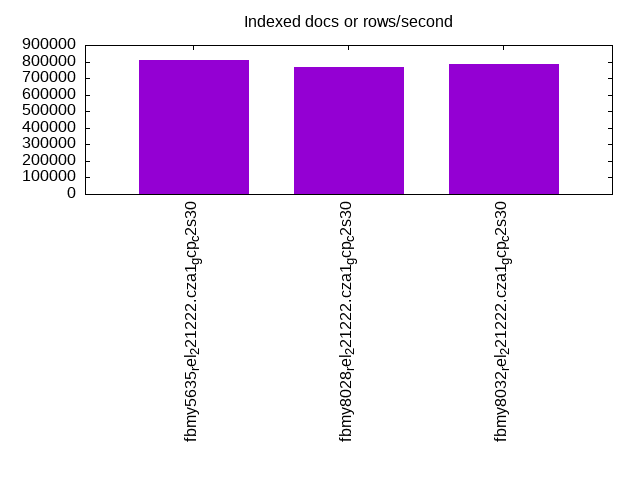
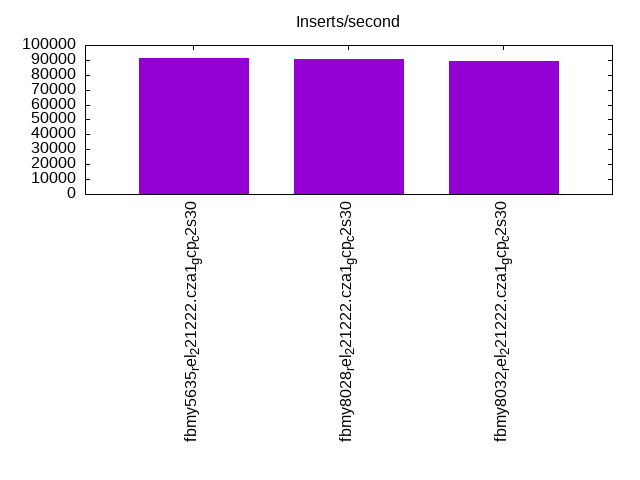
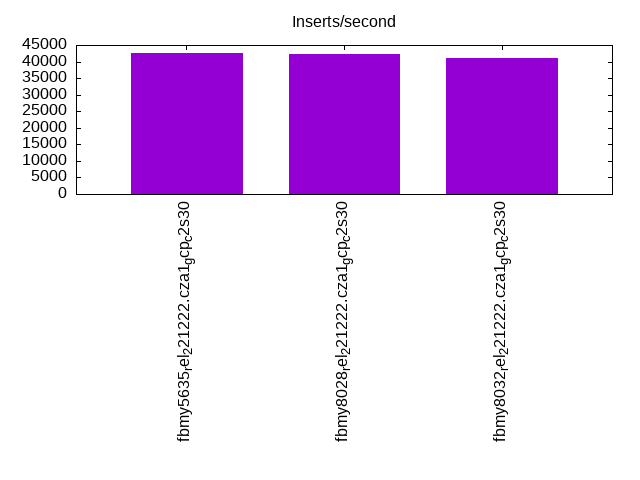
| fbmy5635_rel_221222.cza1_gcp_c2s30 | 629921 | 812183 | 91402 | 42508 | 25252 | 32006 | 23084 | 30582 | 23237 | 28627 |
| fbmy8028_rel_221222.cza1_gcp_c2s30 | 547945 | 765551 | 90446 | 42395 | 25421 | 35856 | 26636 | 34150 | 24914 | 32088 |
| fbmy8032_rel_221222.cza1_gcp_c2s30 | 517799 | 784314 | 89485 | 41026 | 26630 | 34269 | 26751 | 32625 | 25440 | 30619 |
This table has relative throughput, throughput for the DBMS relative to the DBMS in the first line, using the absolute throughput from the previous table. Values less than 0.95 have a yellow background. Values greater than 1.05 have a blue background.
| dbms | l.i0 | l.x | l.i1 | l.i2 | qr100 | qp100 | qr500 | qp500 | qr1000 | qp1000 |
|---|---|---|---|---|---|---|---|---|---|---|
| fbmy5635_rel_221222.cza1_gcp_c2s30 | 1.00 | 1.00 | 1.00 | 1.00 | 1.00 | 1.00 | 1.00 | 1.00 | 1.00 | 1.00 |
| fbmy8028_rel_221222.cza1_gcp_c2s30 | 0.87 | 0.94 | 0.99 | 1.00 | 1.01 | 1.12 | 1.15 | 1.12 | 1.07 | 1.12 |
| fbmy8032_rel_221222.cza1_gcp_c2s30 | 0.82 | 0.97 | 0.98 | 0.97 | 1.05 | 1.07 | 1.16 | 1.07 | 1.09 | 1.07 |
This lists the average rate of inserts/s for the tests that do inserts concurrent with queries. For such tests the query rate is listed in the table above. The read+write tests are setup so that the insert rate should match the target rate every second. Cells that are not at least 95% of the target have a red background to indicate a failure to satisfy the target.
| dbms | qr100.L1 | qp100.L2 | qr500.L3 | qp500.L4 | qr1000.L5 | qp1000.L6 |
|---|---|---|---|---|---|---|
| fbmy5635_rel_221222.cza1_gcp_c2s30 | 794 | 794 | 3967 | 3970 | 7947 | 7947 |
| fbmy8028_rel_221222.cza1_gcp_c2s30 | 794 | 794 | 3970 | 3970 | 7947 | 7947 |
| fbmy8032_rel_221222.cza1_gcp_c2s30 | 793 | 794 | 3970 | 3970 | 7947 | 7947 |
| target | 800 | 800 | 4000 | 4000 | 8000 | 8000 |
l.i0
l.i0: load without secondary indexes. Graphs for performance per 1-second interval are here.
Average throughput:
Insert response time histogram: each cell has the percentage of responses that take <= the time in the header and max is the max response time in seconds. For the max column values in the top 25% of the range have a red background and in the bottom 25% of the range have a green background. The red background is not used when the min value is within 80% of the max value.
| dbms | 256us | 1ms | 4ms | 16ms | 64ms | 256ms | 1s | 4s | 16s | gt | max |
|---|---|---|---|---|---|---|---|---|---|---|---|
| fbmy5635_rel_221222.cza1_gcp_c2s30 | 35.814 | 64.156 | 0.014 | 0.002 | 0.012 | 0.002 | 0.376 | ||||
| fbmy8028_rel_221222.cza1_gcp_c2s30 | 8.674 | 91.188 | 0.115 | 0.007 | 0.013 | 0.004 | 0.326 | ||||
| fbmy8032_rel_221222.cza1_gcp_c2s30 | 3.894 | 95.965 | 0.121 | 0.004 | 0.014 | 0.003 | 0.383 |
Performance metrics for the DBMS listed above. Some are normalized by throughput, others are not. Legend for results is here.
ips	qps	rps	rmbps	wps	wmbps	rpq	rkbpq	wpi	wkbpi	csps	cpups	cspq	cpupq	dbgb1	dbgb2	rss	maxop	p50	p99	tag
629921	0	0	0.0	520.3	146.7	0.000	0.000	0.001	0.239	72194	73.2	0.115	17	4.7	6.2	1.3	0.376	83909	53740	fbmy5635_rel_221222.cza1_gcp_c2s30
547945	0	0	0.0	461.8	126.6	0.000	0.000	0.001	0.237	62995	73.1	0.115	20	4.7	6.4	1.6	0.326	73420	51544	fbmy8028_rel_221222.cza1_gcp_c2s30
517799	0	0	0.0	445.8	121.7	0.000	0.000	0.001	0.241	60620	72.5	0.117	21	4.6	6.3	1.7	0.383	70323	43952	fbmy8032_rel_221222.cza1_gcp_c2s30
l.x
l.x: create secondary indexes.
Average throughput:
Performance metrics for the DBMS listed above. Some are normalized by throughput, others are not. Legend for results is here.
ips	qps	rps	rmbps	wps	wmbps	rpq	rkbpq	wpi	wkbpi	csps	cpups	cspq	cpupq	dbgb1	dbgb2	rss	maxop	p50	p99	tag
812183	0	1	0.1	306.5	110.6	0.000	0.000	0.000	0.139	1098	50.0	0.001	9	10.5	12.0	11.3	0.002	NA	NA	fbmy5635_rel_221222.cza1_gcp_c2s30
765551	0	1	0.1	284.1	107.7	0.000	0.000	0.000	0.144	1331	50.1	0.002	10	10.5	12.2	12.9	0.003	NA	NA	fbmy8028_rel_221222.cza1_gcp_c2s30
784314	0	1	0.1	291.0	109.9	0.000	0.000	0.000	0.144	1842	50.4	0.002	10	10.4	12.1	13.0	0.003	NA	NA	fbmy8032_rel_221222.cza1_gcp_c2s30
l.i1
l.i1: continue load after secondary indexes created with 50 inserts per transaction. Graphs for performance per 1-second interval are here.
Average throughput:
Insert response time histogram: each cell has the percentage of responses that take <= the time in the header and max is the max response time in seconds. For the max column values in the top 25% of the range have a red background and in the bottom 25% of the range have a green background. The red background is not used when the min value is within 80% of the max value.
| dbms | 256us | 1ms | 4ms | 16ms | 64ms | 256ms | 1s | 4s | 16s | gt | max |
|---|---|---|---|---|---|---|---|---|---|---|---|
| fbmy5635_rel_221222.cza1_gcp_c2s30 | 0.032 | 39.334 | 60.514 | 0.104 | 0.010 | 0.005 | 0.419 | ||||
| fbmy8028_rel_221222.cza1_gcp_c2s30 | 0.011 | 37.474 | 62.391 | 0.103 | 0.015 | 0.005 | 0.638 | ||||
| fbmy8032_rel_221222.cza1_gcp_c2s30 | 0.012 | 35.979 | 63.886 | 0.104 | 0.015 | 0.004 | 0.567 |
Delete response time histogram: each cell has the percentage of responses that take <= the time in the header and max is the max response time in seconds. For the max column values in the top 25% of the range have a red background and in the bottom 25% of the range have a green background. The red background is not used when the min value is within 80% of the max value.
| dbms | 256us | 1ms | 4ms | 16ms | 64ms | 256ms | 1s | 4s | 16s | gt | max |
|---|---|---|---|---|---|---|---|---|---|---|---|
| fbmy5635_rel_221222.cza1_gcp_c2s30 | 0.032 | 39.649 | 60.198 | 0.106 | 0.010 | 0.005 | 0.418 | ||||
| fbmy8028_rel_221222.cza1_gcp_c2s30 | 0.020 | 40.681 | 59.181 | 0.098 | 0.015 | 0.005 | 0.635 | ||||
| fbmy8032_rel_221222.cza1_gcp_c2s30 | 0.013 | 38.353 | 61.513 | 0.102 | 0.015 | 0.004 | 0.566 |
Performance metrics for the DBMS listed above. Some are normalized by throughput, others are not. Legend for results is here.
ips	qps	rps	rmbps	wps	wmbps	rpq	rkbpq	wpi	wkbpi	csps	cpups	cspq	cpupq	dbgb1	dbgb2	rss	maxop	p50	p99	tag
91402	0	4	0.4	572.4	169.2	0.000	0.004	0.006	1.896	60332	60.7	0.660	100	15.4	15.9	50.2	0.419	11641	8491	fbmy5635_rel_221222.cza1_gcp_c2s30
90446	0	4	0.4	589.3	165.4	0.000	0.004	0.007	1.873	54752	64.2	0.605	106	13.3	13.9	50.5	0.638	11438	8041	fbmy8028_rel_221222.cza1_gcp_c2s30
89485	0	4	0.4	574.0	162.9	0.000	0.004	0.006	1.864	54201	64.7	0.606	108	12.9	13.5	51.5	0.567	11341	8191	fbmy8032_rel_221222.cza1_gcp_c2s30
l.i2
l.i2: continue load after secondary indexes created with 5 inserts per transaction. Graphs for performance per 1-second interval are here.
Average throughput:
Insert response time histogram: each cell has the percentage of responses that take <= the time in the header and max is the max response time in seconds. For the max column values in the top 25% of the range have a red background and in the bottom 25% of the range have a green background. The red background is not used when the min value is within 80% of the max value.
| dbms | 256us | 1ms | 4ms | 16ms | 64ms | 256ms | 1s | 4s | 16s | gt | max |
|---|---|---|---|---|---|---|---|---|---|---|---|
| fbmy5635_rel_221222.cza1_gcp_c2s30 | 0.158 | 87.555 | 12.246 | 0.037 | 0.004 | 0.063 | |||||
| fbmy8028_rel_221222.cza1_gcp_c2s30 | 0.016 | 82.282 | 17.592 | 0.104 | 0.003 | 0.002 | nonzero | 0.325 | |||
| fbmy8032_rel_221222.cza1_gcp_c2s30 | 0.002 | 78.661 | 21.218 | 0.114 | 0.003 | 0.002 | nonzero | 0.704 |
Delete response time histogram: each cell has the percentage of responses that take <= the time in the header and max is the max response time in seconds. For the max column values in the top 25% of the range have a red background and in the bottom 25% of the range have a green background. The red background is not used when the min value is within 80% of the max value.
| dbms | 256us | 1ms | 4ms | 16ms | 64ms | 256ms | 1s | 4s | 16s | gt | max |
|---|---|---|---|---|---|---|---|---|---|---|---|
| fbmy5635_rel_221222.cza1_gcp_c2s30 | nonzero | 72.550 | 27.404 | 0.041 | 0.005 | 0.061 | |||||
| fbmy8028_rel_221222.cza1_gcp_c2s30 | nonzero | 75.137 | 24.749 | 0.108 | 0.003 | 0.003 | nonzero | 0.325 | |||
| fbmy8032_rel_221222.cza1_gcp_c2s30 | 70.729 | 29.149 | 0.117 | 0.003 | 0.002 | nonzero | 0.704 |
Performance metrics for the DBMS listed above. Some are normalized by throughput, others are not. Legend for results is here.
ips	qps	rps	rmbps	wps	wmbps	rpq	rkbpq	wpi	wkbpi	csps	cpups	cspq	cpupq	dbgb1	dbgb2	rss	maxop	p50	p99	tag
42508	0	0	0.0	316.3	70.0	0.000	0.000	0.007	1.687	255428	64.9	6.009	229	12.0	12.1	61.7	0.063	5501	3351	fbmy5635_rel_221222.cza1_gcp_c2s30
42395	0	0	0.0	330.9	74.4	0.000	0.000	0.008	1.797	230357	68.6	5.434	243	12.3	12.6	62.2	0.325	5574	3191	fbmy8028_rel_221222.cza1_gcp_c2s30
41026	0	0	0.0	320.5	70.7	0.000	0.000	0.008	1.766	222150	68.7	5.415	251	11.8	12.1	62.4	0.704	5379	3082	fbmy8032_rel_221222.cza1_gcp_c2s30
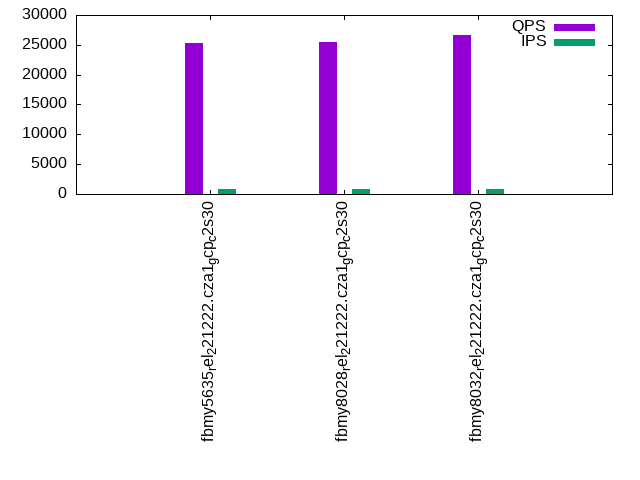
qr100.L1
qr100.L1: range queries with 100 insert/s per client. Graphs for performance per 1-second interval are here.
Average throughput:
Query response time histogram: each cell has the percentage of responses that take <= the time in the header and max is the max response time in seconds. For max values in the top 25% of the range have a red background and in the bottom 25% of the range have a green background. The red background is not used when the min value is within 80% of the max value.
| dbms | 256us | 1ms | 4ms | 16ms | 64ms | 256ms | 1s | 4s | 16s | gt | max |
|---|---|---|---|---|---|---|---|---|---|---|---|
| fbmy5635_rel_221222.cza1_gcp_c2s30 | 68.239 | 30.083 | 1.678 | nonzero | nonzero | 0.050 | |||||
| fbmy8028_rel_221222.cza1_gcp_c2s30 | 77.126 | 18.201 | 4.673 | nonzero | nonzero | 0.054 | |||||
| fbmy8032_rel_221222.cza1_gcp_c2s30 | 70.839 | 28.403 | 0.758 | nonzero | nonzero | 0.051 |
Insert response time histogram: each cell has the percentage of responses that take <= the time in the header and max is the max response time in seconds. For max values in the top 25% of the range have a red background and in the bottom 25% of the range have a green background. The red background is not used when the min value is within 80% of the max value.
| dbms | 256us | 1ms | 4ms | 16ms | 64ms | 256ms | 1s | 4s | 16s | gt | max |
|---|---|---|---|---|---|---|---|---|---|---|---|
| fbmy5635_rel_221222.cza1_gcp_c2s30 | 9.234 | 90.766 | 0.003 | ||||||||
| fbmy8028_rel_221222.cza1_gcp_c2s30 | 5.557 | 94.438 | 0.005 | 0.004 | |||||||
| fbmy8032_rel_221222.cza1_gcp_c2s30 | 0.500 | 99.099 | 0.401 | 0.006 |
Delete response time histogram: each cell has the percentage of responses that take <= the time in the header and max is the max response time in seconds. For max values in the top 25% of the range have a red background and in the bottom 25% of the range have a green background. The red background is not used when the min value is within 80% of the max value.
| dbms | 256us | 1ms | 4ms | 16ms | 64ms | 256ms | 1s | 4s | 16s | gt | max |
|---|---|---|---|---|---|---|---|---|---|---|---|
| fbmy5635_rel_221222.cza1_gcp_c2s30 | 11.474 | 88.521 | 0.005 | 0.005 | |||||||
| fbmy8028_rel_221222.cza1_gcp_c2s30 | 19.229 | 80.771 | 0.002 | ||||||||
| fbmy8032_rel_221222.cza1_gcp_c2s30 | 3.646 | 96.094 | 0.260 | 0.005 |
Performance metrics for the DBMS listed above. Some are normalized by throughput, others are not. Legend for results is here.
ips	qps	rps	rmbps	wps	wmbps	rpq	rkbpq	wpi	wkbpi	csps	cpups	cspq	cpupq	dbgb1	dbgb2	rss	maxop	p50	p99	tag
794	25252	0	0.0	15.3	3.4	0.000	0.000	0.019	4.386	97869	52.8	3.876	314	11.4	11.6	63.2	0.050	4219	3900	fbmy5635_rel_221222.cza1_gcp_c2s30
794	25421	0	0.0	19.7	4.5	0.000	0.000	0.025	5.760	98445	53.4	3.873	315	11.4	11.8	64.0	0.054	2558	2333	fbmy8028_rel_221222.cza1_gcp_c2s30
793	26630	0	0.0	15.0	3.2	0.000	0.000	0.019	4.072	103061	53.5	3.870	301	11.4	11.8	63.8	0.051	3708	3388	fbmy8032_rel_221222.cza1_gcp_c2s30
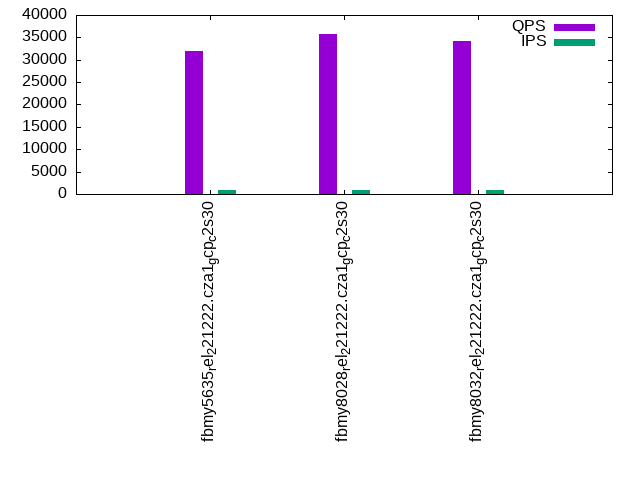
qp100.L2
qp100.L2: point queries with 100 insert/s per client. Graphs for performance per 1-second interval are here.
Average throughput:
Query response time histogram: each cell has the percentage of responses that take <= the time in the header and max is the max response time in seconds. For max values in the top 25% of the range have a red background and in the bottom 25% of the range have a green background. The red background is not used when the min value is within 80% of the max value.
| dbms | 256us | 1ms | 4ms | 16ms | 64ms | 256ms | 1s | 4s | 16s | gt | max |
|---|---|---|---|---|---|---|---|---|---|---|---|
| fbmy5635_rel_221222.cza1_gcp_c2s30 | 87.803 | 12.196 | 0.001 | 0.001 | nonzero | 0.024 | |||||
| fbmy8028_rel_221222.cza1_gcp_c2s30 | 96.590 | 3.409 | 0.001 | nonzero | nonzero | 0.031 | |||||
| fbmy8032_rel_221222.cza1_gcp_c2s30 | 95.090 | 4.909 | 0.001 | nonzero | nonzero | 0.028 |
Insert response time histogram: each cell has the percentage of responses that take <= the time in the header and max is the max response time in seconds. For max values in the top 25% of the range have a red background and in the bottom 25% of the range have a green background. The red background is not used when the min value is within 80% of the max value.
| dbms | 256us | 1ms | 4ms | 16ms | 64ms | 256ms | 1s | 4s | 16s | gt | max |
|---|---|---|---|---|---|---|---|---|---|---|---|
| fbmy5635_rel_221222.cza1_gcp_c2s30 | 2.047 | 92.724 | 5.224 | 0.005 | 0.016 | ||||||
| fbmy8028_rel_221222.cza1_gcp_c2s30 | 0.365 | 95.536 | 4.099 | 0.012 | |||||||
| fbmy8032_rel_221222.cza1_gcp_c2s30 | 0.188 | 98.812 | 0.990 | 0.010 | 0.016 |
Delete response time histogram: each cell has the percentage of responses that take <= the time in the header and max is the max response time in seconds. For max values in the top 25% of the range have a red background and in the bottom 25% of the range have a green background. The red background is not used when the min value is within 80% of the max value.
| dbms | 256us | 1ms | 4ms | 16ms | 64ms | 256ms | 1s | 4s | 16s | gt | max |
|---|---|---|---|---|---|---|---|---|---|---|---|
| fbmy5635_rel_221222.cza1_gcp_c2s30 | 3.312 | 92.021 | 4.661 | 0.005 | 0.016 | ||||||
| fbmy8028_rel_221222.cza1_gcp_c2s30 | 3.620 | 93.089 | 3.292 | 0.011 | |||||||
| fbmy8032_rel_221222.cza1_gcp_c2s30 | 3.000 | 96.161 | 0.823 | 0.016 | 0.016 |
Performance metrics for the DBMS listed above. Some are normalized by throughput, others are not. Legend for results is here.
ips	qps	rps	rmbps	wps	wmbps	rpq	rkbpq	wpi	wkbpi	csps	cpups	cspq	cpupq	dbgb1	dbgb2	rss	maxop	p50	p99	tag
794	32006	0	0.0	13.7	3.5	0.000	0.000	0.017	4.460	132325	53.4	4.134	250	11.4	11.8	74.3	0.024	4060	3484	fbmy5635_rel_221222.cza1_gcp_c2s30
794	35856	0	0.0	13.9	3.8	0.000	0.000	0.018	4.919	147622	54.2	4.117	227	11.4	12.1	74.8	0.031	4539	3820	fbmy8028_rel_221222.cza1_gcp_c2s30
794	34269	0	0.0	12.4	3.2	0.000	0.000	0.016	4.154	140576	53.9	4.102	236	11.4	12.1	74.3	0.028	4317	3741	fbmy8032_rel_221222.cza1_gcp_c2s30
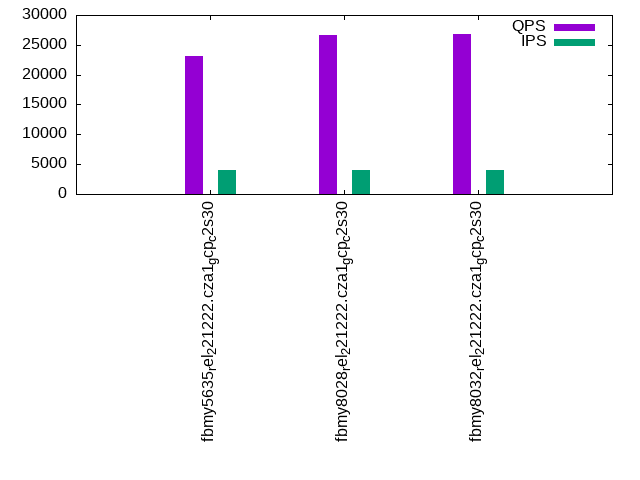
qr500.L3
qr500.L3: range queries with 500 insert/s per client. Graphs for performance per 1-second interval are here.
Average throughput:
Query response time histogram: each cell has the percentage of responses that take <= the time in the header and max is the max response time in seconds. For max values in the top 25% of the range have a red background and in the bottom 25% of the range have a green background. The red background is not used when the min value is within 80% of the max value.
| dbms | 256us | 1ms | 4ms | 16ms | 64ms | 256ms | 1s | 4s | 16s | gt | max |
|---|---|---|---|---|---|---|---|---|---|---|---|
| fbmy5635_rel_221222.cza1_gcp_c2s30 | 66.457 | 29.734 | 3.808 | 0.001 | nonzero | nonzero | 0.071 | ||||
| fbmy8028_rel_221222.cza1_gcp_c2s30 | 70.097 | 25.854 | 4.049 | 0.001 | nonzero | nonzero | 0.071 | ||||
| fbmy8032_rel_221222.cza1_gcp_c2s30 | 69.567 | 27.612 | 2.820 | 0.001 | nonzero | nonzero | 0.071 |
Insert response time histogram: each cell has the percentage of responses that take <= the time in the header and max is the max response time in seconds. For max values in the top 25% of the range have a red background and in the bottom 25% of the range have a green background. The red background is not used when the min value is within 80% of the max value.
| dbms | 256us | 1ms | 4ms | 16ms | 64ms | 256ms | 1s | 4s | 16s | gt | max |
|---|---|---|---|---|---|---|---|---|---|---|---|
| fbmy5635_rel_221222.cza1_gcp_c2s30 | 1.245 | 50.659 | 48.038 | 0.058 | 0.023 | ||||||
| fbmy8028_rel_221222.cza1_gcp_c2s30 | 2.704 | 77.366 | 19.903 | 0.027 | 0.021 | ||||||
| fbmy8032_rel_221222.cza1_gcp_c2s30 | 0.427 | 73.367 | 26.168 | 0.039 | 0.024 |
Delete response time histogram: each cell has the percentage of responses that take <= the time in the header and max is the max response time in seconds. For max values in the top 25% of the range have a red background and in the bottom 25% of the range have a green background. The red background is not used when the min value is within 80% of the max value.
| dbms | 256us | 1ms | 4ms | 16ms | 64ms | 256ms | 1s | 4s | 16s | gt | max |
|---|---|---|---|---|---|---|---|---|---|---|---|
| fbmy5635_rel_221222.cza1_gcp_c2s30 | 1.434 | 51.243 | 47.269 | 0.054 | 0.025 | ||||||
| fbmy8028_rel_221222.cza1_gcp_c2s30 | 6.401 | 74.954 | 18.616 | 0.028 | 0.001 | 0.069 | |||||
| fbmy8032_rel_221222.cza1_gcp_c2s30 | 1.861 | 73.093 | 25.010 | 0.035 | 0.023 |
Performance metrics for the DBMS listed above. Some are normalized by throughput, others are not. Legend for results is here.
ips	qps	rps	rmbps	wps	wmbps	rpq	rkbpq	wpi	wkbpi	csps	cpups	cspq	cpupq	dbgb1	dbgb2	rss	maxop	p50	p99	tag
3967	23084	0	0.0	57.7	18.4	0.000	0.000	0.015	4.760	90445	56.3	3.918	366	11.4	12.9	78.9	0.071	3246	2845	fbmy5635_rel_221222.cza1_gcp_c2s30
3970	26636	0	0.0	59.4	19.2	0.000	0.000	0.015	4.948	103838	57.0	3.898	321	11.4	13.0	79.5	0.071	3724	3228	fbmy8028_rel_221222.cza1_gcp_c2s30
3970	26751	0	0.0	55.5	17.6	0.000	0.000	0.014	4.529	104103	56.9	3.892	319	11.4	13.1	79.2	0.071	3772	3085	fbmy8032_rel_221222.cza1_gcp_c2s30
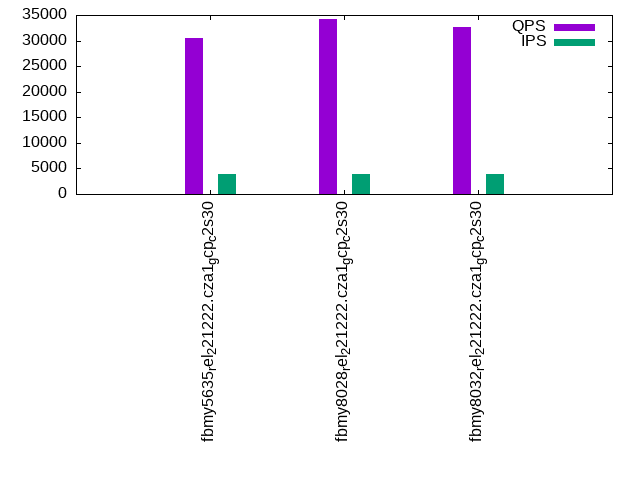
qp500.L4
qp500.L4: point queries with 500 insert/s per client. Graphs for performance per 1-second interval are here.
Average throughput:
Query response time histogram: each cell has the percentage of responses that take <= the time in the header and max is the max response time in seconds. For max values in the top 25% of the range have a red background and in the bottom 25% of the range have a green background. The red background is not used when the min value is within 80% of the max value.
| dbms | 256us | 1ms | 4ms | 16ms | 64ms | 256ms | 1s | 4s | 16s | gt | max |
|---|---|---|---|---|---|---|---|---|---|---|---|
| fbmy5635_rel_221222.cza1_gcp_c2s30 | 73.029 | 26.959 | 0.011 | nonzero | 0.016 | ||||||
| fbmy8028_rel_221222.cza1_gcp_c2s30 | 91.719 | 8.271 | 0.010 | nonzero | nonzero | 0.026 | |||||
| fbmy8032_rel_221222.cza1_gcp_c2s30 | 87.499 | 12.490 | 0.011 | nonzero | 0.016 |
Insert response time histogram: each cell has the percentage of responses that take <= the time in the header and max is the max response time in seconds. For max values in the top 25% of the range have a red background and in the bottom 25% of the range have a green background. The red background is not used when the min value is within 80% of the max value.
| dbms | 256us | 1ms | 4ms | 16ms | 64ms | 256ms | 1s | 4s | 16s | gt | max |
|---|---|---|---|---|---|---|---|---|---|---|---|
| fbmy5635_rel_221222.cza1_gcp_c2s30 | 1.061 | 51.491 | 47.402 | 0.046 | 0.024 | ||||||
| fbmy8028_rel_221222.cza1_gcp_c2s30 | 0.843 | 74.628 | 24.512 | 0.017 | 0.019 | ||||||
| fbmy8032_rel_221222.cza1_gcp_c2s30 | 0.132 | 78.181 | 21.663 | 0.024 | 0.031 |
Delete response time histogram: each cell has the percentage of responses that take <= the time in the header and max is the max response time in seconds. For max values in the top 25% of the range have a red background and in the bottom 25% of the range have a green background. The red background is not used when the min value is within 80% of the max value.
| dbms | 256us | 1ms | 4ms | 16ms | 64ms | 256ms | 1s | 4s | 16s | gt | max |
|---|---|---|---|---|---|---|---|---|---|---|---|
| fbmy5635_rel_221222.cza1_gcp_c2s30 | 1.504 | 52.536 | 45.920 | 0.040 | 0.023 | ||||||
| fbmy8028_rel_221222.cza1_gcp_c2s30 | 3.862 | 72.939 | 23.180 | 0.019 | 0.019 | ||||||
| fbmy8032_rel_221222.cza1_gcp_c2s30 | 1.361 | 78.329 | 20.289 | 0.021 | 0.029 |
Performance metrics for the DBMS listed above. Some are normalized by throughput, others are not. Legend for results is here.
ips	qps	rps	rmbps	wps	wmbps	rpq	rkbpq	wpi	wkbpi	csps	cpups	cspq	cpupq	dbgb1	dbgb2	rss	maxop	p50	p99	tag
3970	30582	0	0.0	60.6	17.0	0.000	0.000	0.015	4.381	130009	56.8	4.251	279	11.6	12.1	80.2	0.016	3916	3404	fbmy5635_rel_221222.cza1_gcp_c2s30
3970	34150	0	0.0	60.9	18.8	0.000	0.000	0.015	4.845	143903	57.5	4.214	253	11.5	12.3	81.6	0.026	4363	3868	fbmy8028_rel_221222.cza1_gcp_c2s30
3970	32625	0	0.0	62.1	18.3	0.000	0.000	0.016	4.719	136727	57.6	4.191	265	11.6	12.3	81.7	0.016	4171	3676	fbmy8032_rel_221222.cza1_gcp_c2s30
qr1000.L5
qr1000.L5: range queries with 1000 insert/s per client. Graphs for performance per 1-second interval are here.
Average throughput:
Query response time histogram: each cell has the percentage of responses that take <= the time in the header and max is the max response time in seconds. For max values in the top 25% of the range have a red background and in the bottom 25% of the range have a green background. The red background is not used when the min value is within 80% of the max value.
| dbms | 256us | 1ms | 4ms | 16ms | 64ms | 256ms | 1s | 4s | 16s | gt | max |
|---|---|---|---|---|---|---|---|---|---|---|---|
| fbmy5635_rel_221222.cza1_gcp_c2s30 | 63.175 | 34.507 | 2.317 | 0.001 | nonzero | nonzero | 0.074 | ||||
| fbmy8028_rel_221222.cza1_gcp_c2s30 | 68.268 | 29.616 | 2.114 | 0.001 | nonzero | nonzero | 0.075 | ||||
| fbmy8032_rel_221222.cza1_gcp_c2s30 | 68.965 | 28.892 | 2.142 | 0.001 | nonzero | nonzero | 0.066 |
Insert response time histogram: each cell has the percentage of responses that take <= the time in the header and max is the max response time in seconds. For max values in the top 25% of the range have a red background and in the bottom 25% of the range have a green background. The red background is not used when the min value is within 80% of the max value.
| dbms | 256us | 1ms | 4ms | 16ms | 64ms | 256ms | 1s | 4s | 16s | gt | max |
|---|---|---|---|---|---|---|---|---|---|---|---|
| fbmy5635_rel_221222.cza1_gcp_c2s30 | 1.060 | 47.108 | 51.774 | 0.057 | 0.035 | ||||||
| fbmy8028_rel_221222.cza1_gcp_c2s30 | 0.242 | 55.267 | 44.439 | 0.052 | 0.027 | ||||||
| fbmy8032_rel_221222.cza1_gcp_c2s30 | 0.076 | 57.086 | 42.778 | 0.060 | 0.038 |
Delete response time histogram: each cell has the percentage of responses that take <= the time in the header and max is the max response time in seconds. For max values in the top 25% of the range have a red background and in the bottom 25% of the range have a green background. The red background is not used when the min value is within 80% of the max value.
| dbms | 256us | 1ms | 4ms | 16ms | 64ms | 256ms | 1s | 4s | 16s | gt | max |
|---|---|---|---|---|---|---|---|---|---|---|---|
| fbmy5635_rel_221222.cza1_gcp_c2s30 | 1.144 | 47.918 | 50.885 | 0.053 | 0.038 | ||||||
| fbmy8028_rel_221222.cza1_gcp_c2s30 | 1.397 | 55.761 | 42.796 | 0.045 | 0.001 | 0.072 | |||||
| fbmy8032_rel_221222.cza1_gcp_c2s30 | 0.570 | 58.489 | 40.879 | 0.062 | 0.059 |
Performance metrics for the DBMS listed above. Some are normalized by throughput, others are not. Legend for results is here.
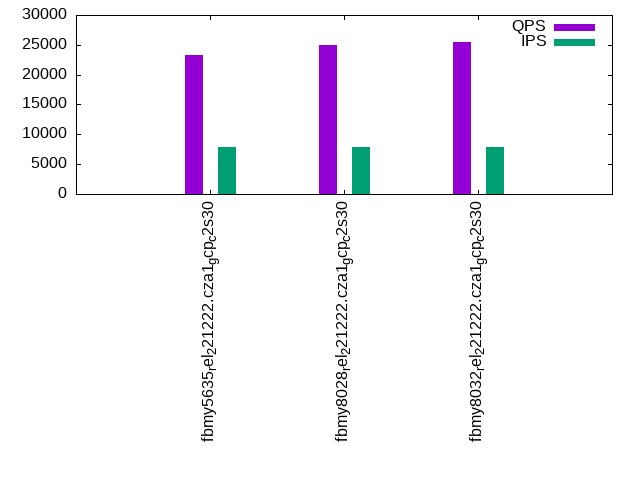
ips	qps	rps	rmbps	wps	wmbps	rpq	rkbpq	wpi	wkbpi	csps	cpups	cspq	cpupq	dbgb1	dbgb2	rss	maxop	p50	p99	tag
7947	23237	0	0.0	117.8	31.9	0.000	0.000	0.015	4.115	91601	60.4	3.942	390	12.2	12.8	80.5	0.074	3198	2429	fbmy5635_rel_221222.cza1_gcp_c2s30
7947	24914	0	0.0	117.8	34.3	0.000	0.000	0.015	4.413	97655	61.1	3.920	368	12.1	13.0	81.9	0.075	3374	2701	fbmy8028_rel_221222.cza1_gcp_c2s30
7947	25440	0	0.0	118.7	33.8	0.000	0.000	0.015	4.356	99211	61.3	3.900	361	12.1	13.0	82.0	0.066	2973	2381	fbmy8032_rel_221222.cza1_gcp_c2s30
qp1000.L6
qp1000.L6: point queries with 1000 insert/s per client. Graphs for performance per 1-second interval are here.
Average throughput:
Query response time histogram: each cell has the percentage of responses that take <= the time in the header and max is the max response time in seconds. For max values in the top 25% of the range have a red background and in the bottom 25% of the range have a green background. The red background is not used when the min value is within 80% of the max value.
| dbms | 256us | 1ms | 4ms | 16ms | 64ms | 256ms | 1s | 4s | 16s | gt | max |
|---|---|---|---|---|---|---|---|---|---|---|---|
| fbmy5635_rel_221222.cza1_gcp_c2s30 | 49.052 | 50.905 | 0.041 | 0.001 | 0.001 | 0.040 | |||||
| fbmy8028_rel_221222.cza1_gcp_c2s30 | 81.170 | 18.793 | 0.035 | 0.001 | 0.001 | 0.039 | |||||
| fbmy8032_rel_221222.cza1_gcp_c2s30 | 73.109 | 26.853 | 0.036 | 0.001 | 0.001 | 0.045 |
Insert response time histogram: each cell has the percentage of responses that take <= the time in the header and max is the max response time in seconds. For max values in the top 25% of the range have a red background and in the bottom 25% of the range have a green background. The red background is not used when the min value is within 80% of the max value.
| dbms | 256us | 1ms | 4ms | 16ms | 64ms | 256ms | 1s | 4s | 16s | gt | max |
|---|---|---|---|---|---|---|---|---|---|---|---|
| fbmy5635_rel_221222.cza1_gcp_c2s30 | 0.541 | 43.376 | 56.001 | 0.082 | 0.040 | ||||||
| fbmy8028_rel_221222.cza1_gcp_c2s30 | 0.152 | 54.933 | 44.879 | 0.036 | 0.037 | ||||||
| fbmy8032_rel_221222.cza1_gcp_c2s30 | 0.068 | 55.665 | 44.219 | 0.048 | 0.039 |
Delete response time histogram: each cell has the percentage of responses that take <= the time in the header and max is the max response time in seconds. For max values in the top 25% of the range have a red background and in the bottom 25% of the range have a green background. The red background is not used when the min value is within 80% of the max value.
| dbms | 256us | 1ms | 4ms | 16ms | 64ms | 256ms | 1s | 4s | 16s | gt | max |
|---|---|---|---|---|---|---|---|---|---|---|---|
| fbmy5635_rel_221222.cza1_gcp_c2s30 | 0.949 | 44.388 | 54.577 | 0.086 | 0.059 | ||||||
| fbmy8028_rel_221222.cza1_gcp_c2s30 | 1.371 | 55.703 | 42.881 | 0.045 | 0.063 | ||||||
| fbmy8032_rel_221222.cza1_gcp_c2s30 | 0.513 | 57.268 | 42.172 | 0.046 | 0.057 |
Performance metrics for the DBMS listed above. Some are normalized by throughput, others are not. Legend for results is here.
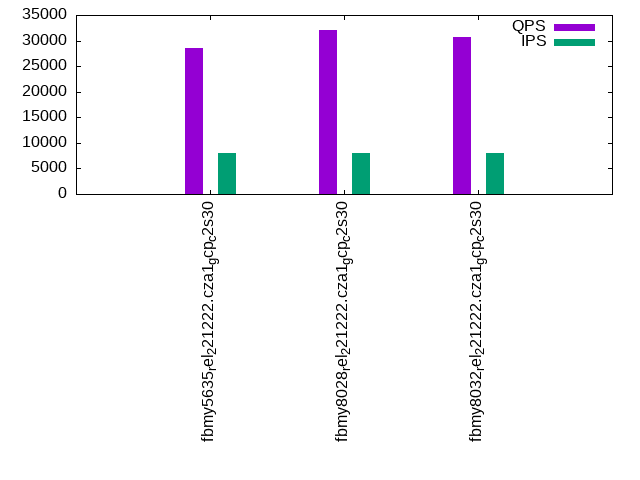
ips	qps	rps	rmbps	wps	wmbps	rpq	rkbpq	wpi	wkbpi	csps	cpups	cspq	cpupq	dbgb1	dbgb2	rss	maxop	p50	p99	tag
7947	28627	0	0.0	120.2	33.4	0.000	0.000	0.015	4.303	124899	60.9	4.363	319	12.2	13.0	82.2	0.040	3644	3132	fbmy5635_rel_221222.cza1_gcp_c2s30
7947	32088	0	0.0	123.1	34.8	0.000	0.000	0.015	4.489	137623	61.6	4.289	288	12.3	13.3	84.3	0.039	4091	3516	fbmy8028_rel_221222.cza1_gcp_c2s30
7947	30619	0	0.0	120.2	33.5	0.000	0.000	0.015	4.320	130493	61.9	4.262	303	12.2	13.2	83.5	0.045	3868	3292	fbmy8032_rel_221222.cza1_gcp_c2s30
l.i0
l.i0: load without secondary indexes
Performance metrics for all DBMS, not just the ones listed above. Some are normalized by throughput, others are not. Legend for results is here.
ips	qps	rps	rmbps	wps	wmbps	rpq	rkbpq	wpi	wkbpi	csps	cpups	cspq	cpupq	dbgb1	dbgb2	rss	maxop	p50	p99	tag
629921	0	0	0.0	520.3	146.7	0.000	0.000	0.001	0.239	72194	73.2	0.115	17	4.7	6.2	1.3	0.376	83909	53740	fbmy5635_rel_221222.cza1_gcp_c2s30
547945	0	0	0.0	461.8	126.6	0.000	0.000	0.001	0.237	62995	73.1	0.115	20	4.7	6.4	1.6	0.326	73420	51544	fbmy8028_rel_221222.cza1_gcp_c2s30
517799	0	0	0.0	445.8	121.7	0.000	0.000	0.001	0.241	60620	72.5	0.117	21	4.6	6.3	1.7	0.383	70323	43952	fbmy8032_rel_221222.cza1_gcp_c2s30
l.x
l.x: create secondary indexes
Performance metrics for all DBMS, not just the ones listed above. Some are normalized by throughput, others are not. Legend for results is here.
ips	qps	rps	rmbps	wps	wmbps	rpq	rkbpq	wpi	wkbpi	csps	cpups	cspq	cpupq	dbgb1	dbgb2	rss	maxop	p50	p99	tag
812183	0	1	0.1	306.5	110.6	0.000	0.000	0.000	0.139	1098	50.0	0.001	9	10.5	12.0	11.3	0.002	NA	NA	fbmy5635_rel_221222.cza1_gcp_c2s30
765551	0	1	0.1	284.1	107.7	0.000	0.000	0.000	0.144	1331	50.1	0.002	10	10.5	12.2	12.9	0.003	NA	NA	fbmy8028_rel_221222.cza1_gcp_c2s30
784314	0	1	0.1	291.0	109.9	0.000	0.000	0.000	0.144	1842	50.4	0.002	10	10.4	12.1	13.0	0.003	NA	NA	fbmy8032_rel_221222.cza1_gcp_c2s30
l.i1
l.i1: continue load after secondary indexes created with 50 inserts per transaction
Performance metrics for all DBMS, not just the ones listed above. Some are normalized by throughput, others are not. Legend for results is here.
ips	qps	rps	rmbps	wps	wmbps	rpq	rkbpq	wpi	wkbpi	csps	cpups	cspq	cpupq	dbgb1	dbgb2	rss	maxop	p50	p99	tag
91402	0	4	0.4	572.4	169.2	0.000	0.004	0.006	1.896	60332	60.7	0.660	100	15.4	15.9	50.2	0.419	11641	8491	fbmy5635_rel_221222.cza1_gcp_c2s30
90446	0	4	0.4	589.3	165.4	0.000	0.004	0.007	1.873	54752	64.2	0.605	106	13.3	13.9	50.5	0.638	11438	8041	fbmy8028_rel_221222.cza1_gcp_c2s30
89485	0	4	0.4	574.0	162.9	0.000	0.004	0.006	1.864	54201	64.7	0.606	108	12.9	13.5	51.5	0.567	11341	8191	fbmy8032_rel_221222.cza1_gcp_c2s30
l.i2
l.i2: continue load after secondary indexes created with 5 inserts per transaction
Performance metrics for all DBMS, not just the ones listed above. Some are normalized by throughput, others are not. Legend for results is here.
ips	qps	rps	rmbps	wps	wmbps	rpq	rkbpq	wpi	wkbpi	csps	cpups	cspq	cpupq	dbgb1	dbgb2	rss	maxop	p50	p99	tag
42508	0	0	0.0	316.3	70.0	0.000	0.000	0.007	1.687	255428	64.9	6.009	229	12.0	12.1	61.7	0.063	5501	3351	fbmy5635_rel_221222.cza1_gcp_c2s30
42395	0	0	0.0	330.9	74.4	0.000	0.000	0.008	1.797	230357	68.6	5.434	243	12.3	12.6	62.2	0.325	5574	3191	fbmy8028_rel_221222.cza1_gcp_c2s30
41026	0	0	0.0	320.5	70.7	0.000	0.000	0.008	1.766	222150	68.7	5.415	251	11.8	12.1	62.4	0.704	5379	3082	fbmy8032_rel_221222.cza1_gcp_c2s30
qr100.L1
qr100.L1: range queries with 100 insert/s per client
Performance metrics for all DBMS, not just the ones listed above. Some are normalized by throughput, others are not. Legend for results is here.
ips	qps	rps	rmbps	wps	wmbps	rpq	rkbpq	wpi	wkbpi	csps	cpups	cspq	cpupq	dbgb1	dbgb2	rss	maxop	p50	p99	tag
794	25252	0	0.0	15.3	3.4	0.000	0.000	0.019	4.386	97869	52.8	3.876	314	11.4	11.6	63.2	0.050	4219	3900	fbmy5635_rel_221222.cza1_gcp_c2s30
794	25421	0	0.0	19.7	4.5	0.000	0.000	0.025	5.760	98445	53.4	3.873	315	11.4	11.8	64.0	0.054	2558	2333	fbmy8028_rel_221222.cza1_gcp_c2s30
793	26630	0	0.0	15.0	3.2	0.000	0.000	0.019	4.072	103061	53.5	3.870	301	11.4	11.8	63.8	0.051	3708	3388	fbmy8032_rel_221222.cza1_gcp_c2s30
qp100.L2
qp100.L2: point queries with 100 insert/s per client
Performance metrics for all DBMS, not just the ones listed above. Some are normalized by throughput, others are not. Legend for results is here.
ips	qps	rps	rmbps	wps	wmbps	rpq	rkbpq	wpi	wkbpi	csps	cpups	cspq	cpupq	dbgb1	dbgb2	rss	maxop	p50	p99	tag
794	32006	0	0.0	13.7	3.5	0.000	0.000	0.017	4.460	132325	53.4	4.134	250	11.4	11.8	74.3	0.024	4060	3484	fbmy5635_rel_221222.cza1_gcp_c2s30
794	35856	0	0.0	13.9	3.8	0.000	0.000	0.018	4.919	147622	54.2	4.117	227	11.4	12.1	74.8	0.031	4539	3820	fbmy8028_rel_221222.cza1_gcp_c2s30
794	34269	0	0.0	12.4	3.2	0.000	0.000	0.016	4.154	140576	53.9	4.102	236	11.4	12.1	74.3	0.028	4317	3741	fbmy8032_rel_221222.cza1_gcp_c2s30
qr500.L3
qr500.L3: range queries with 500 insert/s per client
Performance metrics for all DBMS, not just the ones listed above. Some are normalized by throughput, others are not. Legend for results is here.
ips	qps	rps	rmbps	wps	wmbps	rpq	rkbpq	wpi	wkbpi	csps	cpups	cspq	cpupq	dbgb1	dbgb2	rss	maxop	p50	p99	tag
3967	23084	0	0.0	57.7	18.4	0.000	0.000	0.015	4.760	90445	56.3	3.918	366	11.4	12.9	78.9	0.071	3246	2845	fbmy5635_rel_221222.cza1_gcp_c2s30
3970	26636	0	0.0	59.4	19.2	0.000	0.000	0.015	4.948	103838	57.0	3.898	321	11.4	13.0	79.5	0.071	3724	3228	fbmy8028_rel_221222.cza1_gcp_c2s30
3970	26751	0	0.0	55.5	17.6	0.000	0.000	0.014	4.529	104103	56.9	3.892	319	11.4	13.1	79.2	0.071	3772	3085	fbmy8032_rel_221222.cza1_gcp_c2s30
qp500.L4
qp500.L4: point queries with 500 insert/s per client
Performance metrics for all DBMS, not just the ones listed above. Some are normalized by throughput, others are not. Legend for results is here.
ips	qps	rps	rmbps	wps	wmbps	rpq	rkbpq	wpi	wkbpi	csps	cpups	cspq	cpupq	dbgb1	dbgb2	rss	maxop	p50	p99	tag
3970	30582	0	0.0	60.6	17.0	0.000	0.000	0.015	4.381	130009	56.8	4.251	279	11.6	12.1	80.2	0.016	3916	3404	fbmy5635_rel_221222.cza1_gcp_c2s30
3970	34150	0	0.0	60.9	18.8	0.000	0.000	0.015	4.845	143903	57.5	4.214	253	11.5	12.3	81.6	0.026	4363	3868	fbmy8028_rel_221222.cza1_gcp_c2s30
3970	32625	0	0.0	62.1	18.3	0.000	0.000	0.016	4.719	136727	57.6	4.191	265	11.6	12.3	81.7	0.016	4171	3676	fbmy8032_rel_221222.cza1_gcp_c2s30
qr1000.L5
qr1000.L5: range queries with 1000 insert/s per client
Performance metrics for all DBMS, not just the ones listed above. Some are normalized by throughput, others are not. Legend for results is here.
ips	qps	rps	rmbps	wps	wmbps	rpq	rkbpq	wpi	wkbpi	csps	cpups	cspq	cpupq	dbgb1	dbgb2	rss	maxop	p50	p99	tag
7947	23237	0	0.0	117.8	31.9	0.000	0.000	0.015	4.115	91601	60.4	3.942	390	12.2	12.8	80.5	0.074	3198	2429	fbmy5635_rel_221222.cza1_gcp_c2s30
7947	24914	0	0.0	117.8	34.3	0.000	0.000	0.015	4.413	97655	61.1	3.920	368	12.1	13.0	81.9	0.075	3374	2701	fbmy8028_rel_221222.cza1_gcp_c2s30
7947	25440	0	0.0	118.7	33.8	0.000	0.000	0.015	4.356	99211	61.3	3.900	361	12.1	13.0	82.0	0.066	2973	2381	fbmy8032_rel_221222.cza1_gcp_c2s30
qp1000.L6
qp1000.L6: point queries with 1000 insert/s per client
Performance metrics for all DBMS, not just the ones listed above. Some are normalized by throughput, others are not. Legend for results is here.
ips	qps	rps	rmbps	wps	wmbps	rpq	rkbpq	wpi	wkbpi	csps	cpups	cspq	cpupq	dbgb1	dbgb2	rss	maxop	p50	p99	tag
7947	28627	0	0.0	120.2	33.4	0.000	0.000	0.015	4.303	124899	60.9	4.363	319	12.2	13.0	82.2	0.040	3644	3132	fbmy5635_rel_221222.cza1_gcp_c2s30
7947	32088	0	0.0	123.1	34.8	0.000	0.000	0.015	4.489	137623	61.6	4.289	288	12.3	13.3	84.3	0.039	4091	3516	fbmy8028_rel_221222.cza1_gcp_c2s30
7947	30619	0	0.0	120.2	33.5	0.000	0.000	0.015	4.320	130493	61.9	4.262	303	12.2	13.2	83.5	0.045	3868	3292	fbmy8032_rel_221222.cza1_gcp_c2s30
l.i0
- l.i0: load without secondary indexes
- Legend for results is here.
- Each entry lists the percentage of responses that fit in that bucket (slower than max time for previous bucket, faster than min time for next bucket).
Insert response time histogram
256us	1ms	4ms	16ms	64ms	256ms	1s	4s	16s	gt	max	tag
0.000	35.814	64.156	0.014	0.002	0.012	0.002	0.000	0.000	0.000	0.376	fbmy5635_rel_221222.cza1_gcp_c2s30
0.000	8.674	91.188	0.115	0.007	0.013	0.004	0.000	0.000	0.000	0.326	fbmy8028_rel_221222.cza1_gcp_c2s30
0.000	3.894	95.965	0.121	0.004	0.014	0.003	0.000	0.000	0.000	0.383	fbmy8032_rel_221222.cza1_gcp_c2s30
l.x
- l.x: create secondary indexes
- Legend for results is here.
- Each entry lists the percentage of responses that fit in that bucket (slower than max time for previous bucket, faster than min time for next bucket).
TODO - determine whether there is data for create index response time
l.i1
- l.i1: continue load after secondary indexes created with 50 inserts per transaction
- Legend for results is here.
- Each entry lists the percentage of responses that fit in that bucket (slower than max time for previous bucket, faster than min time for next bucket).
Insert response time histogram
256us	1ms	4ms	16ms	64ms	256ms	1s	4s	16s	gt	max	tag
0.000	0.032	39.334	60.514	0.104	0.010	0.005	0.000	0.000	0.000	0.419	fbmy5635_rel_221222.cza1_gcp_c2s30
0.000	0.011	37.474	62.391	0.103	0.015	0.005	0.000	0.000	0.000	0.638	fbmy8028_rel_221222.cza1_gcp_c2s30
0.000	0.012	35.979	63.886	0.104	0.015	0.004	0.000	0.000	0.000	0.567	fbmy8032_rel_221222.cza1_gcp_c2s30
Delete response time histogram
256us	1ms	4ms	16ms	64ms	256ms	1s	4s	16s	gt	max	tag
0.000	0.032	39.649	60.198	0.106	0.010	0.005	0.000	0.000	0.000	0.418	fbmy5635_rel_221222.cza1_gcp_c2s30
0.000	0.020	40.681	59.181	0.098	0.015	0.005	0.000	0.000	0.000	0.635	fbmy8028_rel_221222.cza1_gcp_c2s30
0.000	0.013	38.353	61.513	0.102	0.015	0.004	0.000	0.000	0.000	0.566	fbmy8032_rel_221222.cza1_gcp_c2s30
l.i2
- l.i2: continue load after secondary indexes created with 5 inserts per transaction
- Legend for results is here.
- Each entry lists the percentage of responses that fit in that bucket (slower than max time for previous bucket, faster than min time for next bucket).
Insert response time histogram
256us	1ms	4ms	16ms	64ms	256ms	1s	4s	16s	gt	max	tag
0.158	87.555	12.246	0.037	0.004	0.000	0.000	0.000	0.000	0.000	0.063	fbmy5635_rel_221222.cza1_gcp_c2s30
0.016	82.282	17.592	0.104	0.003	0.002	nonzero	0.000	0.000	0.000	0.325	fbmy8028_rel_221222.cza1_gcp_c2s30
0.002	78.661	21.218	0.114	0.003	0.002	nonzero	0.000	0.000	0.000	0.704	fbmy8032_rel_221222.cza1_gcp_c2s30
Delete response time histogram
256us	1ms	4ms	16ms	64ms	256ms	1s	4s	16s	gt	max	tag
nonzero	72.550	27.404	0.041	0.005	0.000	0.000	0.000	0.000	0.000	0.061	fbmy5635_rel_221222.cza1_gcp_c2s30
nonzero	75.137	24.749	0.108	0.003	0.003	nonzero	0.000	0.000	0.000	0.325	fbmy8028_rel_221222.cza1_gcp_c2s30
0.000	70.729	29.149	0.117	0.003	0.002	nonzero	0.000	0.000	0.000	0.704	fbmy8032_rel_221222.cza1_gcp_c2s30
qr100.L1
- qr100.L1: range queries with 100 insert/s per client
- Legend for results is here.
- Each entry lists the percentage of responses that fit in that bucket (slower than max time for previous bucket, faster than min time for next bucket).
Query response time histogram
256us	1ms	4ms	16ms	64ms	256ms	1s	4s	16s	gt	max	tag
68.239	30.083	1.678	nonzero	nonzero	0.000	0.000	0.000	0.000	0.000	0.050	fbmy5635_rel_221222.cza1_gcp_c2s30
77.126	18.201	4.673	nonzero	nonzero	0.000	0.000	0.000	0.000	0.000	0.054	fbmy8028_rel_221222.cza1_gcp_c2s30
70.839	28.403	0.758	nonzero	nonzero	0.000	0.000	0.000	0.000	0.000	0.051	fbmy8032_rel_221222.cza1_gcp_c2s30
Insert response time histogram
256us	1ms	4ms	16ms	64ms	256ms	1s	4s	16s	gt	max	tag
0.000	9.234	90.766	0.000	0.000	0.000	0.000	0.000	0.000	0.000	0.003	fbmy5635_rel_221222.cza1_gcp_c2s30
0.000	5.557	94.438	0.005	0.000	0.000	0.000	0.000	0.000	0.000	0.004	fbmy8028_rel_221222.cza1_gcp_c2s30
0.000	0.500	99.099	0.401	0.000	0.000	0.000	0.000	0.000	0.000	0.006	fbmy8032_rel_221222.cza1_gcp_c2s30
Delete response time histogram
256us	1ms	4ms	16ms	64ms	256ms	1s	4s	16s	gt	max	tag
0.000	11.474	88.521	0.005	0.000	0.000	0.000	0.000	0.000	0.000	0.005	fbmy5635_rel_221222.cza1_gcp_c2s30
0.000	19.229	80.771	0.000	0.000	0.000	0.000	0.000	0.000	0.000	0.002	fbmy8028_rel_221222.cza1_gcp_c2s30
0.000	3.646	96.094	0.260	0.000	0.000	0.000	0.000	0.000	0.000	0.005	fbmy8032_rel_221222.cza1_gcp_c2s30
qp100.L2
- qp100.L2: point queries with 100 insert/s per client
- Legend for results is here.
- Each entry lists the percentage of responses that fit in that bucket (slower than max time for previous bucket, faster than min time for next bucket).
Query response time histogram
256us	1ms	4ms	16ms	64ms	256ms	1s	4s	16s	gt	max	tag
87.803	12.196	0.001	0.001	nonzero	0.000	0.000	0.000	0.000	0.000	0.024	fbmy5635_rel_221222.cza1_gcp_c2s30
96.590	3.409	0.001	nonzero	nonzero	0.000	0.000	0.000	0.000	0.000	0.031	fbmy8028_rel_221222.cza1_gcp_c2s30
95.090	4.909	0.001	nonzero	nonzero	0.000	0.000	0.000	0.000	0.000	0.028	fbmy8032_rel_221222.cza1_gcp_c2s30
Insert response time histogram
256us	1ms	4ms	16ms	64ms	256ms	1s	4s	16s	gt	max	tag
0.000	2.047	92.724	5.224	0.005	0.000	0.000	0.000	0.000	0.000	0.016	fbmy5635_rel_221222.cza1_gcp_c2s30
0.000	0.365	95.536	4.099	0.000	0.000	0.000	0.000	0.000	0.000	0.012	fbmy8028_rel_221222.cza1_gcp_c2s30
0.000	0.188	98.812	0.990	0.010	0.000	0.000	0.000	0.000	0.000	0.016	fbmy8032_rel_221222.cza1_gcp_c2s30
Delete response time histogram
256us	1ms	4ms	16ms	64ms	256ms	1s	4s	16s	gt	max	tag
0.000	3.312	92.021	4.661	0.005	0.000	0.000	0.000	0.000	0.000	0.016	fbmy5635_rel_221222.cza1_gcp_c2s30
0.000	3.620	93.089	3.292	0.000	0.000	0.000	0.000	0.000	0.000	0.011	fbmy8028_rel_221222.cza1_gcp_c2s30
0.000	3.000	96.161	0.823	0.016	0.000	0.000	0.000	0.000	0.000	0.016	fbmy8032_rel_221222.cza1_gcp_c2s30
qr500.L3
- qr500.L3: range queries with 500 insert/s per client
- Legend for results is here.
- Each entry lists the percentage of responses that fit in that bucket (slower than max time for previous bucket, faster than min time for next bucket).
Query response time histogram
256us	1ms	4ms	16ms	64ms	256ms	1s	4s	16s	gt	max	tag
66.457	29.734	3.808	0.001	nonzero	nonzero	0.000	0.000	0.000	0.000	0.071	fbmy5635_rel_221222.cza1_gcp_c2s30
70.097	25.854	4.049	0.001	nonzero	nonzero	0.000	0.000	0.000	0.000	0.071	fbmy8028_rel_221222.cza1_gcp_c2s30
69.567	27.612	2.820	0.001	nonzero	nonzero	0.000	0.000	0.000	0.000	0.071	fbmy8032_rel_221222.cza1_gcp_c2s30
Insert response time histogram
256us	1ms	4ms	16ms	64ms	256ms	1s	4s	16s	gt	max	tag
0.000	1.245	50.659	48.038	0.058	0.000	0.000	0.000	0.000	0.000	0.023	fbmy5635_rel_221222.cza1_gcp_c2s30
0.000	2.704	77.366	19.903	0.027	0.000	0.000	0.000	0.000	0.000	0.021	fbmy8028_rel_221222.cza1_gcp_c2s30
0.000	0.427	73.367	26.168	0.039	0.000	0.000	0.000	0.000	0.000	0.024	fbmy8032_rel_221222.cza1_gcp_c2s30
Delete response time histogram
256us	1ms	4ms	16ms	64ms	256ms	1s	4s	16s	gt	max	tag
0.000	1.434	51.243	47.269	0.054	0.000	0.000	0.000	0.000	0.000	0.025	fbmy5635_rel_221222.cza1_gcp_c2s30
0.000	6.401	74.954	18.616	0.028	0.001	0.000	0.000	0.000	0.000	0.069	fbmy8028_rel_221222.cza1_gcp_c2s30
0.000	1.861	73.093	25.010	0.035	0.000	0.000	0.000	0.000	0.000	0.023	fbmy8032_rel_221222.cza1_gcp_c2s30
qp500.L4
- qp500.L4: point queries with 500 insert/s per client
- Legend for results is here.
- Each entry lists the percentage of responses that fit in that bucket (slower than max time for previous bucket, faster than min time for next bucket).
Query response time histogram
256us	1ms	4ms	16ms	64ms	256ms	1s	4s	16s	gt	max	tag
73.029	26.959	0.011	nonzero	0.000	0.000	0.000	0.000	0.000	0.000	0.016	fbmy5635_rel_221222.cza1_gcp_c2s30
91.719	8.271	0.010	nonzero	nonzero	0.000	0.000	0.000	0.000	0.000	0.026	fbmy8028_rel_221222.cza1_gcp_c2s30
87.499	12.490	0.011	nonzero	0.000	0.000	0.000	0.000	0.000	0.000	0.016	fbmy8032_rel_221222.cza1_gcp_c2s30
Insert response time histogram
256us	1ms	4ms	16ms	64ms	256ms	1s	4s	16s	gt	max	tag
0.000	1.061	51.491	47.402	0.046	0.000	0.000	0.000	0.000	0.000	0.024	fbmy5635_rel_221222.cza1_gcp_c2s30
0.000	0.843	74.628	24.512	0.017	0.000	0.000	0.000	0.000	0.000	0.019	fbmy8028_rel_221222.cza1_gcp_c2s30
0.000	0.132	78.181	21.663	0.024	0.000	0.000	0.000	0.000	0.000	0.031	fbmy8032_rel_221222.cza1_gcp_c2s30
Delete response time histogram
256us	1ms	4ms	16ms	64ms	256ms	1s	4s	16s	gt	max	tag
0.000	1.504	52.536	45.920	0.040	0.000	0.000	0.000	0.000	0.000	0.023	fbmy5635_rel_221222.cza1_gcp_c2s30
0.000	3.862	72.939	23.180	0.019	0.000	0.000	0.000	0.000	0.000	0.019	fbmy8028_rel_221222.cza1_gcp_c2s30
0.000	1.361	78.329	20.289	0.021	0.000	0.000	0.000	0.000	0.000	0.029	fbmy8032_rel_221222.cza1_gcp_c2s30
qr1000.L5
- qr1000.L5: range queries with 1000 insert/s per client
- Legend for results is here.
- Each entry lists the percentage of responses that fit in that bucket (slower than max time for previous bucket, faster than min time for next bucket).
Query response time histogram
256us	1ms	4ms	16ms	64ms	256ms	1s	4s	16s	gt	max	tag
63.175	34.507	2.317	0.001	nonzero	nonzero	0.000	0.000	0.000	0.000	0.074	fbmy5635_rel_221222.cza1_gcp_c2s30
68.268	29.616	2.114	0.001	nonzero	nonzero	0.000	0.000	0.000	0.000	0.075	fbmy8028_rel_221222.cza1_gcp_c2s30
68.965	28.892	2.142	0.001	nonzero	nonzero	0.000	0.000	0.000	0.000	0.066	fbmy8032_rel_221222.cza1_gcp_c2s30
Insert response time histogram
256us	1ms	4ms	16ms	64ms	256ms	1s	4s	16s	gt	max	tag
0.000	1.060	47.108	51.774	0.057	0.000	0.000	0.000	0.000	0.000	0.035	fbmy5635_rel_221222.cza1_gcp_c2s30
0.000	0.242	55.267	44.439	0.052	0.000	0.000	0.000	0.000	0.000	0.027	fbmy8028_rel_221222.cza1_gcp_c2s30
0.000	0.076	57.086	42.778	0.060	0.000	0.000	0.000	0.000	0.000	0.038	fbmy8032_rel_221222.cza1_gcp_c2s30
Delete response time histogram
256us	1ms	4ms	16ms	64ms	256ms	1s	4s	16s	gt	max	tag
0.000	1.144	47.918	50.885	0.053	0.000	0.000	0.000	0.000	0.000	0.038	fbmy5635_rel_221222.cza1_gcp_c2s30
0.000	1.397	55.761	42.796	0.045	0.001	0.000	0.000	0.000	0.000	0.072	fbmy8028_rel_221222.cza1_gcp_c2s30
0.000	0.570	58.489	40.879	0.062	0.000	0.000	0.000	0.000	0.000	0.059	fbmy8032_rel_221222.cza1_gcp_c2s30
qp1000.L6
- qp1000.L6: point queries with 1000 insert/s per client
- Legend for results is here.
- Each entry lists the percentage of responses that fit in that bucket (slower than max time for previous bucket, faster than min time for next bucket).
Query response time histogram
256us	1ms	4ms	16ms	64ms	256ms	1s	4s	16s	gt	max	tag
49.052	50.905	0.041	0.001	0.001	0.000	0.000	0.000	0.000	0.000	0.040	fbmy5635_rel_221222.cza1_gcp_c2s30
81.170	18.793	0.035	0.001	0.001	0.000	0.000	0.000	0.000	0.000	0.039	fbmy8028_rel_221222.cza1_gcp_c2s30
73.109	26.853	0.036	0.001	0.001	0.000	0.000	0.000	0.000	0.000	0.045	fbmy8032_rel_221222.cza1_gcp_c2s30
Insert response time histogram
256us	1ms	4ms	16ms	64ms	256ms	1s	4s	16s	gt	max	tag
0.000	0.541	43.376	56.001	0.082	0.000	0.000	0.000	0.000	0.000	0.040	fbmy5635_rel_221222.cza1_gcp_c2s30
0.000	0.152	54.933	44.879	0.036	0.000	0.000	0.000	0.000	0.000	0.037	fbmy8028_rel_221222.cza1_gcp_c2s30
0.000	0.068	55.665	44.219	0.048	0.000	0.000	0.000	0.000	0.000	0.039	fbmy8032_rel_221222.cza1_gcp_c2s30
Delete response time histogram
256us	1ms	4ms	16ms	64ms	256ms	1s	4s	16s	gt	max	tag
0.000	0.949	44.388	54.577	0.086	0.000	0.000	0.000	0.000	0.000	0.059	fbmy5635_rel_221222.cza1_gcp_c2s30
0.000	1.371	55.703	42.881	0.045	0.000	0.000	0.000	0.000	0.000	0.063	fbmy8028_rel_221222.cza1_gcp_c2s30
0.000	0.513	57.268	42.172	0.046	0.000	0.000	0.000	0.000	0.000	0.057	fbmy8032_rel_221222.cza1_gcp_c2s30