Introduction
This is a report for the insert benchmark with 20M docs and 1 client(s). It is generated by scripts (bash, awk, sed) and Tufte might not be impressed. An overview of the insert benchmark is here and a short update is here. Below, by DBMS, I mean DBMS+version.config. An example is my8020.c10b40 where my means MySQL, 8020 is version 8.0.20 and c10b40 is the name for the configuration file.
The test server has 8 AMD cores, 16G RAM and an NVMe SSD. It is described here as the Beelink. The benchmark was run with 1 client and there were 1 or 3 connections per client (1 for queries or inserts without rate limits, 1+1 for rate limited inserts+deletes). It uses 1 table. It loads 20M rows per table without secondary indexes, creates 3 secondary indexes per table, then inserts 50m+50m rows per table with a delete per insert to avoid growing the table. It then does 6 read+write tests for 1800s each that do queries as fast as possible with 100,100,500,500,1000,1000 inserts/s and the same for deletes/s per client concurrent with the queries. The database is cached in memory. Clients and the DBMS share one server. The per-database configs are in the per-database subdirectories here.
The tested DBMS are:
- fbmy8028_rel_221222.cza1_bee - MyRocks 8.0.28 compiled with gcc 11.4.0 from code as of 2023-12-22 at git hash 2ad105fc, RocksDB 8.7.0 at git hash 29005f0b, cza1_bee config
- fbmy8028_rel_221222.cza1ps0_bee - MyRocks 8.0.28 compiled with gcc 11.4.0 from code as of 2023-12-22 at git hash 2ad105fc, RocksDB 8.7.0 at git hash 29005f0b, cza1ps0_bee config that disables the perf schema
- fbmy8032_rel_221222.cza1_bee - MyRocks 8.0.32 compiled with gcc 11.4.0 from code as of 2023-12-22 at git hash 76707b44, RocksDB 8.7.0 at git hash 29005f0b, cza1_bee config
- fbmy8032_rel_221222.cza1ps0_bee - MyRocks 8.0.32 compiled with gcc 11.4.0 from code as of 2023-12-22 at git hash 76707b44, RocksDB 8.7.0 at git hash 29005f0b, cza1ps0_bee config that disables the perf schema
Contents
- Summary
- l.i0: load without secondary indexes
- l.x: create secondary indexes
- l.i1: continue load after secondary indexes created with 50 inserts per transaction
- l.i2: continue load after secondary indexes created with 5 inserts per transaction
- qr100.L1: range queries with 100 insert/s per client
- qp100.L2: point queries with 100 insert/s per client
- qr500.L3: range queries with 500 insert/s per client
- qp500.L4: point queries with 500 insert/s per client
- qr1000.L5: range queries with 1000 insert/s per client
- qp1000.L6: point queries with 1000 insert/s per client
Summary
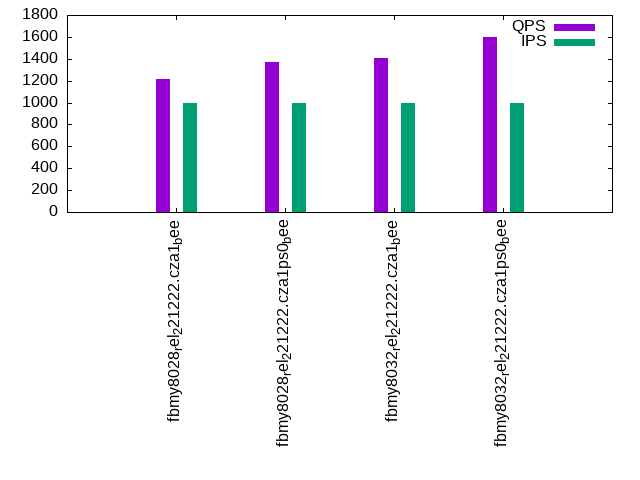
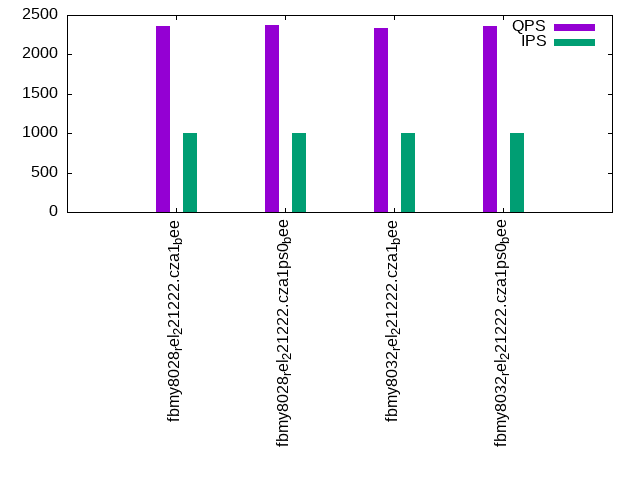
The numbers are inserts/s for l.i0, l.i1 and l.i2, indexed docs (or rows) /s for l.x and queries/s for qr100, qp100 thru qr1000, qp1000" The values are the average rate over the entire test for inserts (IPS) and queries (QPS). The range of values for IPS and QPS is split into 3 parts: bottom 25%, middle 50%, top 25%. Values in the bottom 25% have a red background, values in the top 25% have a green background and values in the middle have no color. A gray background is used for values that can be ignored because the DBMS did not sustain the target insert rate. Red backgrounds are not used when the minimum value is within 80% of the max value.
| dbms | l.i0 | l.x | l.i1 | l.i2 | qr100 | qp100 | qr500 | qp500 | qr1000 | qp1000 |
|---|---|---|---|---|---|---|---|---|---|---|
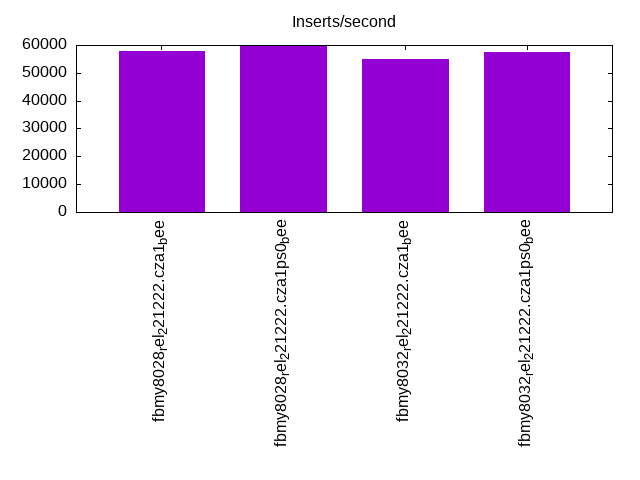
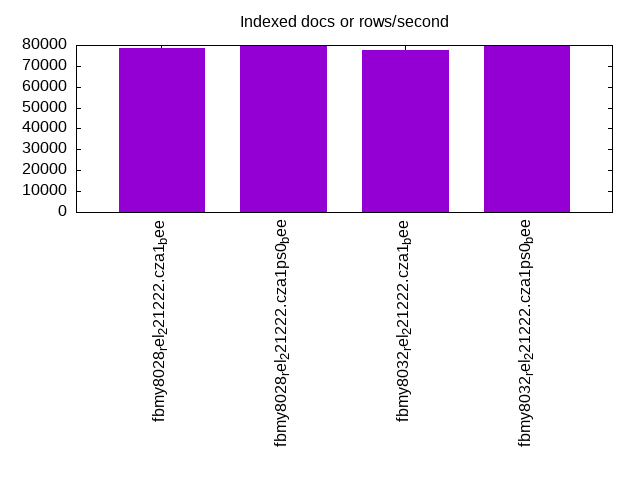
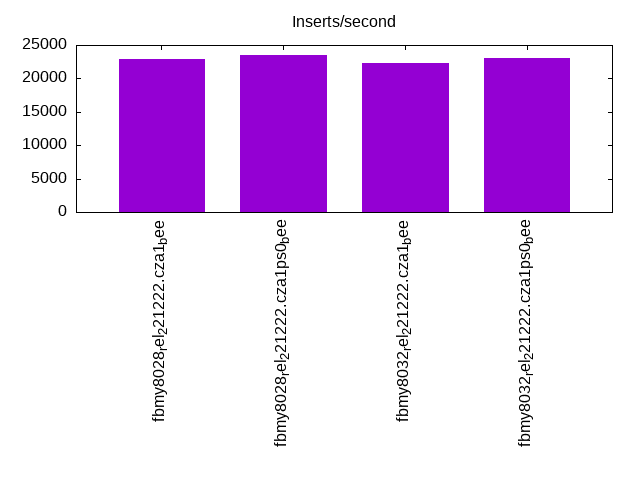
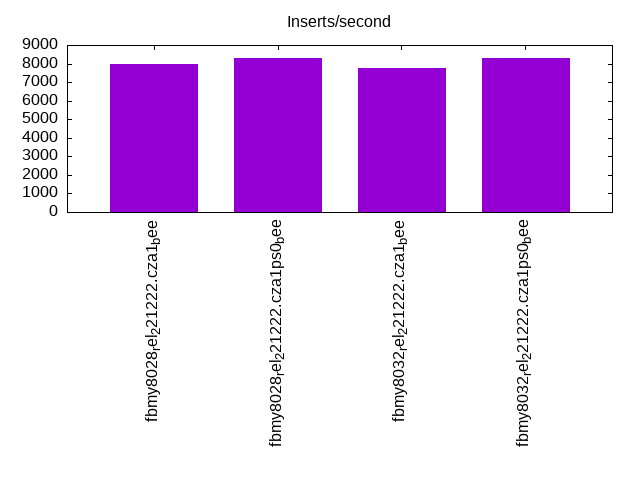
| fbmy8028_rel_221222.cza1_bee | 57803 | 78432 | 22896 | 7968 | 1704 | 2480 | 1498 | 2393 | 1212 | 2358 |
| fbmy8028_rel_221222.cza1ps0_bee | 59701 | 79682 | 23460 | 8326 | 1776 | 2306 | 1594 | 2336 | 1366 | 2368 |
| fbmy8032_rel_221222.cza1_bee | 54945 | 77821 | 22309 | 7752 | 1363 | 2360 | 1362 | 2305 | 1406 | 2334 |
| fbmy8032_rel_221222.cza1ps0_bee | 57637 | 79682 | 23041 | 8285 | 1817 | 2334 | 1376 | 2334 | 1601 | 2358 |
This table has relative throughput, throughput for the DBMS relative to the DBMS in the first line, using the absolute throughput from the previous table. Values less than 0.95 have a yellow background. Values greater than 1.05 have a blue background.
| dbms | l.i0 | l.x | l.i1 | l.i2 | qr100 | qp100 | qr500 | qp500 | qr1000 | qp1000 |
|---|---|---|---|---|---|---|---|---|---|---|
| fbmy8028_rel_221222.cza1_bee | 1.00 | 1.00 | 1.00 | 1.00 | 1.00 | 1.00 | 1.00 | 1.00 | 1.00 | 1.00 |
| fbmy8028_rel_221222.cza1ps0_bee | 1.03 | 1.02 | 1.02 | 1.04 | 1.04 | 0.93 | 1.06 | 0.98 | 1.13 | 1.00 |
| fbmy8032_rel_221222.cza1_bee | 0.95 | 0.99 | 0.97 | 0.97 | 0.80 | 0.95 | 0.91 | 0.96 | 1.16 | 0.99 |
| fbmy8032_rel_221222.cza1ps0_bee | 1.00 | 1.02 | 1.01 | 1.04 | 1.07 | 0.94 | 0.92 | 0.98 | 1.32 | 1.00 |
This lists the average rate of inserts/s for the tests that do inserts concurrent with queries. For such tests the query rate is listed in the table above. The read+write tests are setup so that the insert rate should match the target rate every second. Cells that are not at least 95% of the target have a red background to indicate a failure to satisfy the target.
| dbms | qr100.L1 | qp100.L2 | qr500.L3 | qp500.L4 | qr1000.L5 | qp1000.L6 |
|---|---|---|---|---|---|---|
| fbmy8028_rel_221222.cza1_bee | 100 | 100 | 499 | 499 | 998 | 998 |
| fbmy8028_rel_221222.cza1ps0_bee | 100 | 100 | 499 | 499 | 998 | 998 |
| fbmy8032_rel_221222.cza1_bee | 100 | 100 | 499 | 499 | 998 | 998 |
| fbmy8032_rel_221222.cza1ps0_bee | 100 | 100 | 499 | 499 | 998 | 998 |
| target | 100 | 100 | 500 | 500 | 1000 | 1000 |
l.i0
l.i0: load without secondary indexes. Graphs for performance per 1-second interval are here.
Average throughput:
Insert response time histogram: each cell has the percentage of responses that take <= the time in the header and max is the max response time in seconds. For the max column values in the top 25% of the range have a red background and in the bottom 25% of the range have a green background. The red background is not used when the min value is within 80% of the max value.
| dbms | 256us | 1ms | 4ms | 16ms | 64ms | 256ms | 1s | 4s | 16s | gt | max |
|---|---|---|---|---|---|---|---|---|---|---|---|
| fbmy8028_rel_221222.cza1_bee | 99.723 | 0.200 | 0.074 | 0.003 | 0.077 | ||||||
| fbmy8028_rel_221222.cza1ps0_bee | 99.729 | 0.193 | 0.076 | 0.003 | 0.076 | ||||||
| fbmy8032_rel_221222.cza1_bee | 99.715 | 0.206 | 0.076 | 0.002 | 0.068 | ||||||
| fbmy8032_rel_221222.cza1ps0_bee | 99.722 | 0.203 | 0.072 | 0.002 | 0.071 |
Performance metrics for the DBMS listed above. Some are normalized by throughput, others are not. Legend for results is here.
ips	qps	rps	rmbps	wps	wmbps	rpq	rkbpq	wpi	wkbpi	csps	cpups	cspq	cpupq	dbgb1	dbgb2	rss	maxop	p50	p99	tag
57803	0	0	0.0	34.6	11.1	0.000	0.000	0.001	0.196	5985	22.0	0.104	30	0.7	1.9	0.6	0.077	58042	52741	fbmy8028_rel_221222.cza1_bee
59701	0	0	0.0	35.9	11.4	0.000	0.000	0.001	0.196	6155	22.3	0.103	30	0.7	1.9	0.4	0.076	59934	53443	fbmy8028_rel_221222.cza1ps0_bee
54945	0	0	0.0	33.6	10.4	0.000	0.000	0.001	0.194	5920	21.6	0.108	31	0.7	1.9	0.6	0.068	55140	50132	fbmy8032_rel_221222.cza1_bee
57637	0	0	0.0	35.6	11.1	0.000	0.000	0.001	0.197	6185	22.1	0.107	31	0.7	1.9	0.4	0.071	57881	51147	fbmy8032_rel_221222.cza1ps0_bee
l.x
l.x: create secondary indexes.
Average throughput:
Performance metrics for the DBMS listed above. Some are normalized by throughput, others are not. Legend for results is here.
ips	qps	rps	rmbps	wps	wmbps	rpq	rkbpq	wpi	wkbpi	csps	cpups	cspq	cpupq	dbgb1	dbgb2	rss	maxop	p50	p99	tag
78432	0	0	0.0	30.5	12.1	0.000	0.000	0.000	0.158	351	11.8	0.004	12	1.4	2.6	2.0	0.003	NA	NA	fbmy8028_rel_221222.cza1_bee
79682	0	0	0.0	31.5	12.4	0.000	0.000	0.000	0.159	344	11.8	0.004	12	1.4	2.6	1.8	0.004	NA	NA	fbmy8028_rel_221222.cza1ps0_bee
77821	0	0	0.0	30.8	12.1	0.000	0.000	0.000	0.160	583	11.8	0.007	12	1.4	2.6	2.0	0.003	NA	NA	fbmy8032_rel_221222.cza1_bee
79682	0	0	0.0	31.5	12.4	0.000	0.000	0.000	0.159	558	11.8	0.007	12	1.4	2.6	1.8	0.003	NA	NA	fbmy8032_rel_221222.cza1ps0_bee
l.i1
l.i1: continue load after secondary indexes created with 50 inserts per transaction. Graphs for performance per 1-second interval are here.
Average throughput:
Insert response time histogram: each cell has the percentage of responses that take <= the time in the header and max is the max response time in seconds. For the max column values in the top 25% of the range have a red background and in the bottom 25% of the range have a green background. The red background is not used when the min value is within 80% of the max value.
| dbms | 256us | 1ms | 4ms | 16ms | 64ms | 256ms | 1s | 4s | 16s | gt | max |
|---|---|---|---|---|---|---|---|---|---|---|---|
| fbmy8028_rel_221222.cza1_bee | 99.671 | 0.254 | 0.072 | 0.003 | 0.090 | ||||||
| fbmy8028_rel_221222.cza1ps0_bee | 99.675 | 0.251 | 0.070 | 0.003 | 0.090 | ||||||
| fbmy8032_rel_221222.cza1_bee | 99.666 | 0.259 | 0.074 | 0.002 | 0.081 | ||||||
| fbmy8032_rel_221222.cza1ps0_bee | 99.674 | 0.254 | 0.070 | 0.002 | 0.080 |
Delete response time histogram: each cell has the percentage of responses that take <= the time in the header and max is the max response time in seconds. For the max column values in the top 25% of the range have a red background and in the bottom 25% of the range have a green background. The red background is not used when the min value is within 80% of the max value.
| dbms | 256us | 1ms | 4ms | 16ms | 64ms | 256ms | 1s | 4s | 16s | gt | max |
|---|---|---|---|---|---|---|---|---|---|---|---|
| fbmy8028_rel_221222.cza1_bee | 99.662 | 0.255 | 0.080 | 0.003 | 0.095 | ||||||
| fbmy8028_rel_221222.cza1ps0_bee | 99.667 | 0.251 | 0.079 | 0.003 | 0.088 | ||||||
| fbmy8032_rel_221222.cza1_bee | 99.652 | 0.265 | 0.081 | 0.002 | 0.079 | ||||||
| fbmy8032_rel_221222.cza1ps0_bee | 99.663 | 0.255 | 0.080 | 0.002 | 0.080 |
Performance metrics for the DBMS listed above. Some are normalized by throughput, others are not. Legend for results is here.
ips	qps	rps	rmbps	wps	wmbps	rpq	rkbpq	wpi	wkbpi	csps	cpups	cspq	cpupq	dbgb1	dbgb2	rss	maxop	p50	p99	tag
22896	0	76	0.4	111.8	42.5	0.003	0.019	0.005	1.899	10203	46.1	0.446	161	1.9	4.0	5.5	0.090	22874	20427	fbmy8028_rel_221222.cza1_bee
23460	0	78	0.4	111.2	42.4	0.003	0.019	0.005	1.851	10405	46.0	0.444	157	1.7	3.8	5.1	0.090	23394	20727	fbmy8028_rel_221222.cza1ps0_bee
22309	0	74	0.4	107.5	40.5	0.003	0.019	0.005	1.860	10088	45.8	0.452	164	1.7	3.8	5.3	0.081	22275	20177	fbmy8032_rel_221222.cza1_bee
23041	0	76	0.4	109.7	41.6	0.003	0.019	0.005	1.851	10428	46.0	0.453	160	1.6	3.7	5.0	0.080	22975	20627	fbmy8032_rel_221222.cza1ps0_bee
l.i2
l.i2: continue load after secondary indexes created with 5 inserts per transaction. Graphs for performance per 1-second interval are here.
Average throughput:
Insert response time histogram: each cell has the percentage of responses that take <= the time in the header and max is the max response time in seconds. For the max column values in the top 25% of the range have a red background and in the bottom 25% of the range have a green background. The red background is not used when the min value is within 80% of the max value.
| dbms | 256us | 1ms | 4ms | 16ms | 64ms | 256ms | 1s | 4s | 16s | gt | max |
|---|---|---|---|---|---|---|---|---|---|---|---|
| fbmy8028_rel_221222.cza1_bee | 99.834 | 0.082 | 0.080 | 0.003 | nonzero | 0.081 | |||||
| fbmy8028_rel_221222.cza1ps0_bee | 99.860 | 0.059 | 0.078 | 0.003 | nonzero | 0.072 | |||||
| fbmy8032_rel_221222.cza1_bee | 99.802 | 0.113 | 0.082 | 0.002 | nonzero | 0.068 | |||||
| fbmy8032_rel_221222.cza1ps0_bee | 99.850 | 0.069 | 0.078 | 0.003 | nonzero | 0.075 |
Delete response time histogram: each cell has the percentage of responses that take <= the time in the header and max is the max response time in seconds. For the max column values in the top 25% of the range have a red background and in the bottom 25% of the range have a green background. The red background is not used when the min value is within 80% of the max value.
| dbms | 256us | 1ms | 4ms | 16ms | 64ms | 256ms | 1s | 4s | 16s | gt | max |
|---|---|---|---|---|---|---|---|---|---|---|---|
| fbmy8028_rel_221222.cza1_bee | 99.796 | 0.119 | 0.081 | 0.003 | nonzero | 0.077 | |||||
| fbmy8028_rel_221222.cza1ps0_bee | 99.842 | 0.076 | 0.079 | 0.003 | nonzero | 0.081 | |||||
| fbmy8032_rel_221222.cza1_bee | 99.761 | 0.152 | 0.084 | 0.002 | nonzero | 0.071 | |||||
| fbmy8032_rel_221222.cza1ps0_bee | 99.824 | 0.093 | 0.079 | 0.004 | 0.064 |
Performance metrics for the DBMS listed above. Some are normalized by throughput, others are not. Legend for results is here.
ips	qps	rps	rmbps	wps	wmbps	rpq	rkbpq	wpi	wkbpi	csps	cpups	cspq	cpupq	dbgb1	dbgb2	rss	maxop	p50	p99	tag
7968	0	0	0.0	99.3	35.9	0.000	0.000	0.012	4.608	33145	43.2	4.160	434	1.5	1.7	7.6	0.081	7929	7042	fbmy8028_rel_221222.cza1_bee
8326	0	0	0.0	102.8	37.8	0.000	0.000	0.012	4.653	34370	43.7	4.128	420	1.5	1.7	7.4	0.072	8266	7322	fbmy8028_rel_221222.cza1ps0_bee
7752	0	0	0.0	96.8	35.0	0.000	0.000	0.012	4.620	32579	42.8	4.203	442	1.5	1.8	7.5	0.068	7737	6766	fbmy8032_rel_221222.cza1_bee
8285	0	0	0.0	102.9	37.6	0.000	0.000	0.012	4.650	34509	43.7	4.165	422	1.6	1.8	7.4	0.075	8260	7177	fbmy8032_rel_221222.cza1ps0_bee
qr100.L1
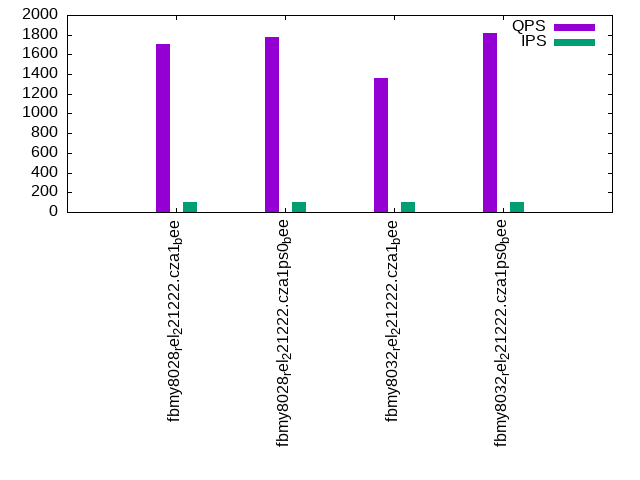
qr100.L1: range queries with 100 insert/s per client. Graphs for performance per 1-second interval are here.
Average throughput:
Query response time histogram: each cell has the percentage of responses that take <= the time in the header and max is the max response time in seconds. For max values in the top 25% of the range have a red background and in the bottom 25% of the range have a green background. The red background is not used when the min value is within 80% of the max value.
| dbms | 256us | 1ms | 4ms | 16ms | 64ms | 256ms | 1s | 4s | 16s | gt | max |
|---|---|---|---|---|---|---|---|---|---|---|---|
| fbmy8028_rel_221222.cza1_bee | 9.647 | 81.277 | 9.075 | 0.001 | nonzero | 0.018 | |||||
| fbmy8028_rel_221222.cza1ps0_bee | 10.774 | 73.695 | 15.531 | nonzero | 0.027 | ||||||
| fbmy8032_rel_221222.cza1_bee | 7.531 | 70.656 | 21.813 | nonzero | 0.014 | ||||||
| fbmy8032_rel_221222.cza1ps0_bee | 14.722 | 75.677 | 9.602 | nonzero | 0.004 |
Insert response time histogram: each cell has the percentage of responses that take <= the time in the header and max is the max response time in seconds. For max values in the top 25% of the range have a red background and in the bottom 25% of the range have a green background. The red background is not used when the min value is within 80% of the max value.
| dbms | 256us | 1ms | 4ms | 16ms | 64ms | 256ms | 1s | 4s | 16s | gt | max |
|---|---|---|---|---|---|---|---|---|---|---|---|
| fbmy8028_rel_221222.cza1_bee | 99.444 | 0.500 | 0.056 | 0.018 | |||||||
| fbmy8028_rel_221222.cza1ps0_bee | 99.361 | 0.583 | 0.056 | 0.018 | |||||||
| fbmy8032_rel_221222.cza1_bee | 99.389 | 0.556 | 0.056 | 0.018 | |||||||
| fbmy8032_rel_221222.cza1ps0_bee | 99.583 | 0.361 | 0.056 | 0.018 |
Delete response time histogram: each cell has the percentage of responses that take <= the time in the header and max is the max response time in seconds. For max values in the top 25% of the range have a red background and in the bottom 25% of the range have a green background. The red background is not used when the min value is within 80% of the max value.
| dbms | 256us | 1ms | 4ms | 16ms | 64ms | 256ms | 1s | 4s | 16s | gt | max |
|---|---|---|---|---|---|---|---|---|---|---|---|
| fbmy8028_rel_221222.cza1_bee | 99.556 | 0.389 | 0.056 | 0.018 | |||||||
| fbmy8028_rel_221222.cza1ps0_bee | 99.528 | 0.444 | 0.028 | 0.017 | |||||||
| fbmy8032_rel_221222.cza1_bee | 99.500 | 0.472 | 0.028 | 0.018 | |||||||
| fbmy8032_rel_221222.cza1ps0_bee | 99.694 | 0.278 | 0.028 | 0.018 |
Performance metrics for the DBMS listed above. Some are normalized by throughput, others are not. Legend for results is here.
ips	qps	rps	rmbps	wps	wmbps	rpq	rkbpq	wpi	wkbpi	csps	cpups	cspq	cpupq	dbgb1	dbgb2	rss	maxop	p50	p99	tag
100	1704	0	0.0	4.3	0.4	0.000	0.000	0.043	4.015	6794	12.6	3.987	591	1.5	1.7	7.9	0.018	1885	1167	fbmy8028_rel_221222.cza1_bee
100	1776	0	0.0	4.4	0.4	0.000	0.000	0.044	4.450	7060	12.5	3.974	563	1.5	1.7	7.6	0.027	1870	1214	fbmy8028_rel_221222.cza1ps0_bee
100	1363	0	0.0	4.2	0.4	0.000	0.000	0.042	4.038	5687	12.6	4.172	739	1.5	1.7	7.8	0.014	1359	1246	fbmy8032_rel_221222.cza1_bee
100	1817	0	0.0	4.1	0.3	0.000	0.000	0.041	3.560	7410	12.3	4.077	541	1.5	1.7	7.6	0.004	1822	1519	fbmy8032_rel_221222.cza1ps0_bee
qp100.L2
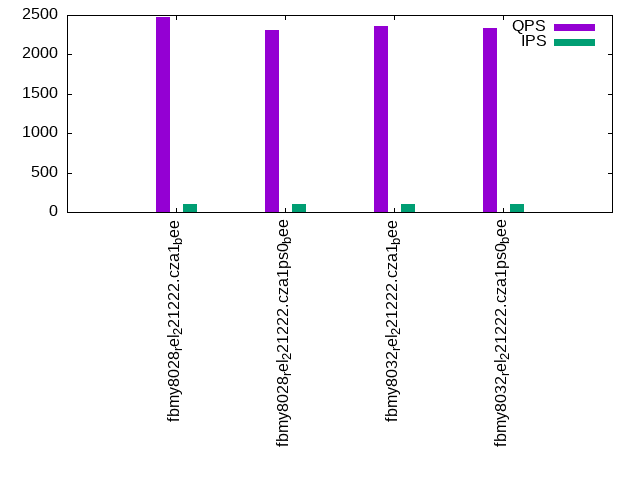
qp100.L2: point queries with 100 insert/s per client. Graphs for performance per 1-second interval are here.
Average throughput:
Query response time histogram: each cell has the percentage of responses that take <= the time in the header and max is the max response time in seconds. For max values in the top 25% of the range have a red background and in the bottom 25% of the range have a green background. The red background is not used when the min value is within 80% of the max value.
| dbms | 256us | 1ms | 4ms | 16ms | 64ms | 256ms | 1s | 4s | 16s | gt | max |
|---|---|---|---|---|---|---|---|---|---|---|---|
| fbmy8028_rel_221222.cza1_bee | nonzero | 99.986 | 0.013 | 0.001 | 0.010 | ||||||
| fbmy8028_rel_221222.cza1ps0_bee | 0.004 | 99.991 | 0.004 | 0.001 | 0.010 | ||||||
| fbmy8032_rel_221222.cza1_bee | 99.994 | 0.005 | 0.001 | 0.010 | |||||||
| fbmy8032_rel_221222.cza1ps0_bee | nonzero | 99.996 | 0.003 | 0.003 |
Insert response time histogram: each cell has the percentage of responses that take <= the time in the header and max is the max response time in seconds. For max values in the top 25% of the range have a red background and in the bottom 25% of the range have a green background. The red background is not used when the min value is within 80% of the max value.
| dbms | 256us | 1ms | 4ms | 16ms | 64ms | 256ms | 1s | 4s | 16s | gt | max |
|---|---|---|---|---|---|---|---|---|---|---|---|
| fbmy8028_rel_221222.cza1_bee | 99.611 | 0.333 | 0.056 | 0.018 | |||||||
| fbmy8028_rel_221222.cza1ps0_bee | 99.417 | 0.500 | 0.083 | 0.018 | |||||||
| fbmy8032_rel_221222.cza1_bee | 99.639 | 0.278 | 0.083 | 0.018 | |||||||
| fbmy8032_rel_221222.cza1ps0_bee | 99.306 | 0.611 | 0.083 | 0.018 |
Delete response time histogram: each cell has the percentage of responses that take <= the time in the header and max is the max response time in seconds. For max values in the top 25% of the range have a red background and in the bottom 25% of the range have a green background. The red background is not used when the min value is within 80% of the max value.
| dbms | 256us | 1ms | 4ms | 16ms | 64ms | 256ms | 1s | 4s | 16s | gt | max |
|---|---|---|---|---|---|---|---|---|---|---|---|
| fbmy8028_rel_221222.cza1_bee | 99.750 | 0.194 | 0.056 | 0.018 | |||||||
| fbmy8028_rel_221222.cza1ps0_bee | 99.528 | 0.389 | 0.083 | 0.017 | |||||||
| fbmy8032_rel_221222.cza1_bee | 99.722 | 0.222 | 0.056 | 0.018 | |||||||
| fbmy8032_rel_221222.cza1ps0_bee | 99.417 | 0.528 | 0.056 | 0.018 |
Performance metrics for the DBMS listed above. Some are normalized by throughput, others are not. Legend for results is here.
ips	qps	rps	rmbps	wps	wmbps	rpq	rkbpq	wpi	wkbpi	csps	cpups	cspq	cpupq	dbgb1	dbgb2	rss	maxop	p50	p99	tag
100	2480	23	0.1	4.1	0.3	0.009	0.058	0.041	3.476	10320	13.2	4.161	426	1.5	1.8	8.6	0.010	2446	2045	fbmy8028_rel_221222.cza1_bee
100	2306	6	0.0	4.0	0.3	0.003	0.018	0.040	3.466	9585	12.8	4.157	444	1.5	1.8	8.5	0.010	2237	2045	fbmy8028_rel_221222.cza1ps0_bee
100	2360	5	0.0	3.9	0.3	0.002	0.013	0.040	3.504	10218	13.4	4.329	454	1.5	1.8	8.6	0.010	2334	1966	fbmy8032_rel_221222.cza1_bee
100	2334	0	0.0	4.2	0.4	0.000	0.000	0.042	4.342	9886	13.3	4.235	456	1.5	1.8	8.4	0.003	2221	2061	fbmy8032_rel_221222.cza1ps0_bee
qr500.L3
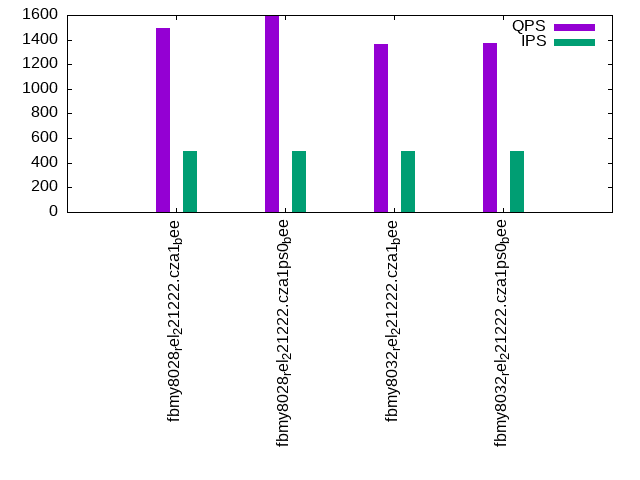
qr500.L3: range queries with 500 insert/s per client. Graphs for performance per 1-second interval are here.
Average throughput:
Query response time histogram: each cell has the percentage of responses that take <= the time in the header and max is the max response time in seconds. For max values in the top 25% of the range have a red background and in the bottom 25% of the range have a green background. The red background is not used when the min value is within 80% of the max value.
| dbms | 256us | 1ms | 4ms | 16ms | 64ms | 256ms | 1s | 4s | 16s | gt | max |
|---|---|---|---|---|---|---|---|---|---|---|---|
| fbmy8028_rel_221222.cza1_bee | 6.189 | 69.258 | 24.553 | nonzero | nonzero | 0.031 | |||||
| fbmy8028_rel_221222.cza1ps0_bee | 8.597 | 73.875 | 17.528 | nonzero | nonzero | 0.029 | |||||
| fbmy8032_rel_221222.cza1_bee | 7.828 | 71.945 | 20.226 | nonzero | nonzero | 0.033 | |||||
| fbmy8032_rel_221222.cza1ps0_bee | 12.385 | 57.137 | 30.477 | nonzero | nonzero | 0.031 |
Insert response time histogram: each cell has the percentage of responses that take <= the time in the header and max is the max response time in seconds. For max values in the top 25% of the range have a red background and in the bottom 25% of the range have a green background. The red background is not used when the min value is within 80% of the max value.
| dbms | 256us | 1ms | 4ms | 16ms | 64ms | 256ms | 1s | 4s | 16s | gt | max |
|---|---|---|---|---|---|---|---|---|---|---|---|
| fbmy8028_rel_221222.cza1_bee | 99.422 | 0.517 | 0.061 | 0.018 | |||||||
| fbmy8028_rel_221222.cza1ps0_bee | 99.417 | 0.511 | 0.072 | 0.022 | |||||||
| fbmy8032_rel_221222.cza1_bee | 99.550 | 0.367 | 0.083 | 0.018 | |||||||
| fbmy8032_rel_221222.cza1ps0_bee | 99.544 | 0.367 | 0.089 | 0.025 |
Delete response time histogram: each cell has the percentage of responses that take <= the time in the header and max is the max response time in seconds. For max values in the top 25% of the range have a red background and in the bottom 25% of the range have a green background. The red background is not used when the min value is within 80% of the max value.
| dbms | 256us | 1ms | 4ms | 16ms | 64ms | 256ms | 1s | 4s | 16s | gt | max |
|---|---|---|---|---|---|---|---|---|---|---|---|
| fbmy8028_rel_221222.cza1_bee | 99.461 | 0.483 | 0.056 | 0.018 | |||||||
| fbmy8028_rel_221222.cza1ps0_bee | 99.472 | 0.461 | 0.067 | 0.022 | |||||||
| fbmy8032_rel_221222.cza1_bee | 99.561 | 0.361 | 0.078 | 0.018 | |||||||
| fbmy8032_rel_221222.cza1ps0_bee | 99.594 | 0.322 | 0.083 | 0.024 |
Performance metrics for the DBMS listed above. Some are normalized by throughput, others are not. Legend for results is here.
ips	qps	rps	rmbps	wps	wmbps	rpq	rkbpq	wpi	wkbpi	csps	cpups	cspq	cpupq	dbgb1	dbgb2	rss	maxop	p50	p99	tag
499	1498	0	0.0	9.0	2.4	0.000	0.000	0.018	4.968	6164	13.5	4.116	721	1.5	1.9	8.7	0.031	1486	1215	fbmy8028_rel_221222.cza1_bee
499	1594	0	0.0	8.7	2.3	0.000	0.000	0.018	4.724	6524	13.5	4.093	678	1.5	1.9	8.6	0.029	1567	1279	fbmy8028_rel_221222.cza1ps0_bee
499	1362	0	0.0	8.9	2.4	0.000	0.000	0.018	4.844	5826	13.6	4.278	799	1.5	2.0	8.8	0.033	1390	1071	fbmy8032_rel_221222.cza1_bee
499	1376	0	0.0	8.8	2.3	0.000	0.000	0.018	4.687	5878	13.4	4.272	779	1.5	2.0	8.5	0.031	1374	1135	fbmy8032_rel_221222.cza1ps0_bee
qp500.L4
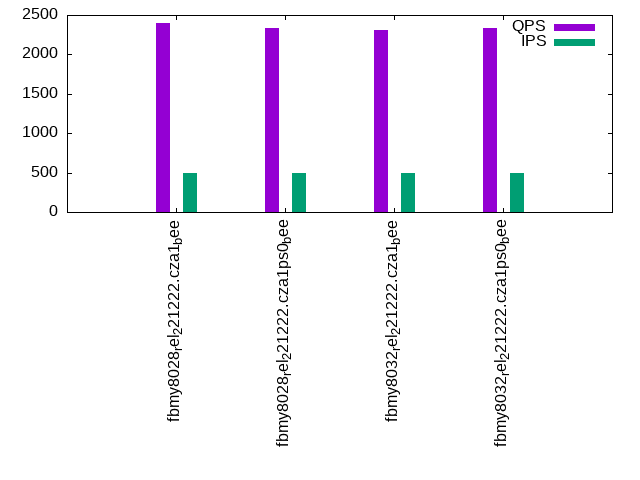
qp500.L4: point queries with 500 insert/s per client. Graphs for performance per 1-second interval are here.
Average throughput:
Query response time histogram: each cell has the percentage of responses that take <= the time in the header and max is the max response time in seconds. For max values in the top 25% of the range have a red background and in the bottom 25% of the range have a green background. The red background is not used when the min value is within 80% of the max value.
| dbms | 256us | 1ms | 4ms | 16ms | 64ms | 256ms | 1s | 4s | 16s | gt | max |
|---|---|---|---|---|---|---|---|---|---|---|---|
| fbmy8028_rel_221222.cza1_bee | 99.994 | 0.006 | nonzero | 0.005 | |||||||
| fbmy8028_rel_221222.cza1ps0_bee | 0.015 | 99.979 | 0.006 | nonzero | 0.005 | ||||||
| fbmy8032_rel_221222.cza1_bee | 99.993 | 0.007 | nonzero | 0.006 | |||||||
| fbmy8032_rel_221222.cza1ps0_bee | 0.002 | 99.993 | 0.005 | 0.003 |
Insert response time histogram: each cell has the percentage of responses that take <= the time in the header and max is the max response time in seconds. For max values in the top 25% of the range have a red background and in the bottom 25% of the range have a green background. The red background is not used when the min value is within 80% of the max value.
| dbms | 256us | 1ms | 4ms | 16ms | 64ms | 256ms | 1s | 4s | 16s | gt | max |
|---|---|---|---|---|---|---|---|---|---|---|---|
| fbmy8028_rel_221222.cza1_bee | 99.528 | 0.383 | 0.089 | 0.018 | |||||||
| fbmy8028_rel_221222.cza1ps0_bee | 99.550 | 0.367 | 0.083 | 0.018 | |||||||
| fbmy8032_rel_221222.cza1_bee | 99.694 | 0.217 | 0.089 | 0.018 | |||||||
| fbmy8032_rel_221222.cza1ps0_bee | 99.722 | 0.194 | 0.083 | 0.018 |
Delete response time histogram: each cell has the percentage of responses that take <= the time in the header and max is the max response time in seconds. For max values in the top 25% of the range have a red background and in the bottom 25% of the range have a green background. The red background is not used when the min value is within 80% of the max value.
| dbms | 256us | 1ms | 4ms | 16ms | 64ms | 256ms | 1s | 4s | 16s | gt | max |
|---|---|---|---|---|---|---|---|---|---|---|---|
| fbmy8028_rel_221222.cza1_bee | 99.594 | 0.333 | 0.072 | 0.018 | |||||||
| fbmy8028_rel_221222.cza1ps0_bee | 99.628 | 0.306 | 0.067 | 0.018 | |||||||
| fbmy8032_rel_221222.cza1_bee | 99.711 | 0.200 | 0.089 | 0.018 | |||||||
| fbmy8032_rel_221222.cza1ps0_bee | 99.717 | 0.200 | 0.083 | 0.039 |
Performance metrics for the DBMS listed above. Some are normalized by throughput, others are not. Legend for results is here.
ips	qps	rps	rmbps	wps	wmbps	rpq	rkbpq	wpi	wkbpi	csps	cpups	cspq	cpupq	dbgb1	dbgb2	rss	maxop	p50	p99	tag
499	2393	0	0.0	8.1	2.1	0.000	0.000	0.016	4.379	10059	14.7	4.203	491	1.5	2.2	9.0	0.005	2366	2014	fbmy8028_rel_221222.cza1_bee
499	2336	0	0.0	8.0	2.2	0.000	0.000	0.016	4.427	9822	14.4	4.204	493	1.5	2.2	8.7	0.005	2253	2077	fbmy8028_rel_221222.cza1ps0_bee
499	2305	0	0.0	8.1	2.2	0.000	0.000	0.016	4.441	9898	14.8	4.295	514	1.5	2.2	9.0	0.006	2301	1918	fbmy8032_rel_221222.cza1_bee
499	2334	0	0.0	8.2	2.2	0.000	0.000	0.016	4.517	10019	14.9	4.292	511	1.5	2.2	8.9	0.003	2222	2045	fbmy8032_rel_221222.cza1ps0_bee
qr1000.L5
qr1000.L5: range queries with 1000 insert/s per client. Graphs for performance per 1-second interval are here.
Average throughput:
Query response time histogram: each cell has the percentage of responses that take <= the time in the header and max is the max response time in seconds. For max values in the top 25% of the range have a red background and in the bottom 25% of the range have a green background. The red background is not used when the min value is within 80% of the max value.
| dbms | 256us | 1ms | 4ms | 16ms | 64ms | 256ms | 1s | 4s | 16s | gt | max |
|---|---|---|---|---|---|---|---|---|---|---|---|
| fbmy8028_rel_221222.cza1_bee | 4.717 | 69.575 | 25.696 | 0.011 | 0.001 | 0.042 | |||||
| fbmy8028_rel_221222.cza1ps0_bee | 8.159 | 71.674 | 20.160 | 0.006 | nonzero | 0.032 | |||||
| fbmy8032_rel_221222.cza1_bee | 7.966 | 70.949 | 21.083 | 0.001 | 0.001 | 0.031 | |||||
| fbmy8032_rel_221222.cza1ps0_bee | 13.262 | 66.910 | 19.827 | nonzero | 0.001 | 0.033 |
Insert response time histogram: each cell has the percentage of responses that take <= the time in the header and max is the max response time in seconds. For max values in the top 25% of the range have a red background and in the bottom 25% of the range have a green background. The red background is not used when the min value is within 80% of the max value.
| dbms | 256us | 1ms | 4ms | 16ms | 64ms | 256ms | 1s | 4s | 16s | gt | max |
|---|---|---|---|---|---|---|---|---|---|---|---|
| fbmy8028_rel_221222.cza1_bee | 99.689 | 0.231 | 0.081 | 0.062 | |||||||
| fbmy8028_rel_221222.cza1ps0_bee | 99.753 | 0.164 | 0.083 | 0.048 | |||||||
| fbmy8032_rel_221222.cza1_bee | 99.550 | 0.375 | 0.075 | 0.042 | |||||||
| fbmy8032_rel_221222.cza1ps0_bee | 99.617 | 0.303 | 0.081 | 0.051 |
Delete response time histogram: each cell has the percentage of responses that take <= the time in the header and max is the max response time in seconds. For max values in the top 25% of the range have a red background and in the bottom 25% of the range have a green background. The red background is not used when the min value is within 80% of the max value.
| dbms | 256us | 1ms | 4ms | 16ms | 64ms | 256ms | 1s | 4s | 16s | gt | max |
|---|---|---|---|---|---|---|---|---|---|---|---|
| fbmy8028_rel_221222.cza1_bee | 99.717 | 0.203 | 0.081 | 0.049 | |||||||
| fbmy8028_rel_221222.cza1ps0_bee | 99.783 | 0.139 | 0.078 | 0.063 | |||||||
| fbmy8032_rel_221222.cza1_bee | 99.583 | 0.347 | 0.069 | 0.056 | |||||||
| fbmy8032_rel_221222.cza1ps0_bee | 99.653 | 0.272 | 0.075 | 0.043 |
Performance metrics for the DBMS listed above. Some are normalized by throughput, others are not. Legend for results is here.
ips	qps	rps	rmbps	wps	wmbps	rpq	rkbpq	wpi	wkbpi	csps	cpups	cspq	cpupq	dbgb1	dbgb2	rss	maxop	p50	p99	tag
998	1212	29	0.2	14.2	4.6	0.024	0.154	0.014	4.725	5345	15.3	4.411	1010	1.5	2.6	9.1	0.042	1199	895	fbmy8028_rel_221222.cza1_bee
998	1366	3	0.0	13.6	4.6	0.002	0.012	0.014	4.712	5876	15.3	4.302	896	1.5	2.6	8.8	0.032	1374	879	fbmy8028_rel_221222.cza1ps0_bee
998	1406	9	0.0	14.2	4.7	0.006	0.034	0.014	4.803	6255	15.5	4.448	882	1.7	2.8	9.0	0.031	1374	975	fbmy8032_rel_221222.cza1_bee
998	1601	0	0.0	14.1	4.7	0.000	0.000	0.014	4.832	6979	15.5	4.359	775	1.5	2.6	8.9	0.033	1550	1215	fbmy8032_rel_221222.cza1ps0_bee
qp1000.L6
qp1000.L6: point queries with 1000 insert/s per client. Graphs for performance per 1-second interval are here.
Average throughput:
Query response time histogram: each cell has the percentage of responses that take <= the time in the header and max is the max response time in seconds. For max values in the top 25% of the range have a red background and in the bottom 25% of the range have a green background. The red background is not used when the min value is within 80% of the max value.
| dbms | 256us | 1ms | 4ms | 16ms | 64ms | 256ms | 1s | 4s | 16s | gt | max |
|---|---|---|---|---|---|---|---|---|---|---|---|
| fbmy8028_rel_221222.cza1_bee | 0.001 | 99.989 | 0.009 | nonzero | 0.005 | ||||||
| fbmy8028_rel_221222.cza1ps0_bee | 0.029 | 99.964 | 0.007 | 0.003 | |||||||
| fbmy8032_rel_221222.cza1_bee | 99.993 | 0.007 | 0.003 | ||||||||
| fbmy8032_rel_221222.cza1ps0_bee | 0.004 | 99.990 | 0.007 | nonzero | 0.008 |
Insert response time histogram: each cell has the percentage of responses that take <= the time in the header and max is the max response time in seconds. For max values in the top 25% of the range have a red background and in the bottom 25% of the range have a green background. The red background is not used when the min value is within 80% of the max value.
| dbms | 256us | 1ms | 4ms | 16ms | 64ms | 256ms | 1s | 4s | 16s | gt | max |
|---|---|---|---|---|---|---|---|---|---|---|---|
| fbmy8028_rel_221222.cza1_bee | 99.547 | 0.375 | 0.078 | 0.063 | |||||||
| fbmy8028_rel_221222.cza1ps0_bee | 99.572 | 0.344 | 0.083 | 0.049 | |||||||
| fbmy8032_rel_221222.cza1_bee | 99.656 | 0.247 | 0.097 | 0.056 | |||||||
| fbmy8032_rel_221222.cza1ps0_bee | 99.308 | 0.617 | 0.075 | 0.049 |
Delete response time histogram: each cell has the percentage of responses that take <= the time in the header and max is the max response time in seconds. For max values in the top 25% of the range have a red background and in the bottom 25% of the range have a green background. The red background is not used when the min value is within 80% of the max value.
| dbms | 256us | 1ms | 4ms | 16ms | 64ms | 256ms | 1s | 4s | 16s | gt | max |
|---|---|---|---|---|---|---|---|---|---|---|---|
| fbmy8028_rel_221222.cza1_bee | 99.578 | 0.342 | 0.081 | 0.049 | |||||||
| fbmy8028_rel_221222.cza1ps0_bee | 99.617 | 0.306 | 0.075 | 0.003 | 0.067 | ||||||
| fbmy8032_rel_221222.cza1_bee | 99.683 | 0.225 | 0.092 | 0.042 | |||||||
| fbmy8032_rel_221222.cza1ps0_bee | 99.369 | 0.561 | 0.069 | 0.042 |
Performance metrics for the DBMS listed above. Some are normalized by throughput, others are not. Legend for results is here.
ips	qps	rps	rmbps	wps	wmbps	rpq	rkbpq	wpi	wkbpi	csps	cpups	cspq	cpupq	dbgb1	dbgb2	rss	maxop	p50	p99	tag
998	2358	28	0.2	13.5	4.4	0.012	0.067	0.013	4.503	10186	16.5	4.319	560	1.5	3.0	9.4	0.005	2348	1981	fbmy8028_rel_221222.cza1_bee
998	2368	24	0.1	13.4	4.4	0.010	0.059	0.013	4.539	10223	16.2	4.317	547	1.5	2.9	9.0	0.003	2269	2078	fbmy8028_rel_221222.cza1ps0_bee
998	2334	20	0.1	13.7	4.4	0.008	0.048	0.014	4.472	10272	16.6	4.400	569	1.5	2.9	9.2	0.003	2319	1950	fbmy8032_rel_221222.cza1_bee
998	2358	9	0.0	13.8	4.4	0.004	0.021	0.014	4.512	10371	16.2	4.398	550	1.5	3.0	9.1	0.008	2285	2061	fbmy8032_rel_221222.cza1ps0_bee
l.i0
l.i0: load without secondary indexes
Performance metrics for all DBMS, not just the ones listed above. Some are normalized by throughput, others are not. Legend for results is here.
ips	qps	rps	rmbps	wps	wmbps	rpq	rkbpq	wpi	wkbpi	csps	cpups	cspq	cpupq	dbgb1	dbgb2	rss	maxop	p50	p99	tag
57803	0	0	0.0	34.6	11.1	0.000	0.000	0.001	0.196	5985	22.0	0.104	30	0.7	1.9	0.6	0.077	58042	52741	fbmy8028_rel_221222.cza1_bee
59701	0	0	0.0	35.9	11.4	0.000	0.000	0.001	0.196	6155	22.3	0.103	30	0.7	1.9	0.4	0.076	59934	53443	fbmy8028_rel_221222.cza1ps0_bee
54945	0	0	0.0	33.6	10.4	0.000	0.000	0.001	0.194	5920	21.6	0.108	31	0.7	1.9	0.6	0.068	55140	50132	fbmy8032_rel_221222.cza1_bee
57637	0	0	0.0	35.6	11.1	0.000	0.000	0.001	0.197	6185	22.1	0.107	31	0.7	1.9	0.4	0.071	57881	51147	fbmy8032_rel_221222.cza1ps0_bee
l.x
l.x: create secondary indexes
Performance metrics for all DBMS, not just the ones listed above. Some are normalized by throughput, others are not. Legend for results is here.
ips	qps	rps	rmbps	wps	wmbps	rpq	rkbpq	wpi	wkbpi	csps	cpups	cspq	cpupq	dbgb1	dbgb2	rss	maxop	p50	p99	tag
78432	0	0	0.0	30.5	12.1	0.000	0.000	0.000	0.158	351	11.8	0.004	12	1.4	2.6	2.0	0.003	NA	NA	fbmy8028_rel_221222.cza1_bee
79682	0	0	0.0	31.5	12.4	0.000	0.000	0.000	0.159	344	11.8	0.004	12	1.4	2.6	1.8	0.004	NA	NA	fbmy8028_rel_221222.cza1ps0_bee
77821	0	0	0.0	30.8	12.1	0.000	0.000	0.000	0.160	583	11.8	0.007	12	1.4	2.6	2.0	0.003	NA	NA	fbmy8032_rel_221222.cza1_bee
79682	0	0	0.0	31.5	12.4	0.000	0.000	0.000	0.159	558	11.8	0.007	12	1.4	2.6	1.8	0.003	NA	NA	fbmy8032_rel_221222.cza1ps0_bee
l.i1
l.i1: continue load after secondary indexes created with 50 inserts per transaction
Performance metrics for all DBMS, not just the ones listed above. Some are normalized by throughput, others are not. Legend for results is here.
ips	qps	rps	rmbps	wps	wmbps	rpq	rkbpq	wpi	wkbpi	csps	cpups	cspq	cpupq	dbgb1	dbgb2	rss	maxop	p50	p99	tag
22896	0	76	0.4	111.8	42.5	0.003	0.019	0.005	1.899	10203	46.1	0.446	161	1.9	4.0	5.5	0.090	22874	20427	fbmy8028_rel_221222.cza1_bee
23460	0	78	0.4	111.2	42.4	0.003	0.019	0.005	1.851	10405	46.0	0.444	157	1.7	3.8	5.1	0.090	23394	20727	fbmy8028_rel_221222.cza1ps0_bee
22309	0	74	0.4	107.5	40.5	0.003	0.019	0.005	1.860	10088	45.8	0.452	164	1.7	3.8	5.3	0.081	22275	20177	fbmy8032_rel_221222.cza1_bee
23041	0	76	0.4	109.7	41.6	0.003	0.019	0.005	1.851	10428	46.0	0.453	160	1.6	3.7	5.0	0.080	22975	20627	fbmy8032_rel_221222.cza1ps0_bee
l.i2
l.i2: continue load after secondary indexes created with 5 inserts per transaction
Performance metrics for all DBMS, not just the ones listed above. Some are normalized by throughput, others are not. Legend for results is here.
ips	qps	rps	rmbps	wps	wmbps	rpq	rkbpq	wpi	wkbpi	csps	cpups	cspq	cpupq	dbgb1	dbgb2	rss	maxop	p50	p99	tag
7968	0	0	0.0	99.3	35.9	0.000	0.000	0.012	4.608	33145	43.2	4.160	434	1.5	1.7	7.6	0.081	7929	7042	fbmy8028_rel_221222.cza1_bee
8326	0	0	0.0	102.8	37.8	0.000	0.000	0.012	4.653	34370	43.7	4.128	420	1.5	1.7	7.4	0.072	8266	7322	fbmy8028_rel_221222.cza1ps0_bee
7752	0	0	0.0	96.8	35.0	0.000	0.000	0.012	4.620	32579	42.8	4.203	442	1.5	1.8	7.5	0.068	7737	6766	fbmy8032_rel_221222.cza1_bee
8285	0	0	0.0	102.9	37.6	0.000	0.000	0.012	4.650	34509	43.7	4.165	422	1.6	1.8	7.4	0.075	8260	7177	fbmy8032_rel_221222.cza1ps0_bee
qr100.L1
qr100.L1: range queries with 100 insert/s per client
Performance metrics for all DBMS, not just the ones listed above. Some are normalized by throughput, others are not. Legend for results is here.
ips	qps	rps	rmbps	wps	wmbps	rpq	rkbpq	wpi	wkbpi	csps	cpups	cspq	cpupq	dbgb1	dbgb2	rss	maxop	p50	p99	tag
100	1704	0	0.0	4.3	0.4	0.000	0.000	0.043	4.015	6794	12.6	3.987	591	1.5	1.7	7.9	0.018	1885	1167	fbmy8028_rel_221222.cza1_bee
100	1776	0	0.0	4.4	0.4	0.000	0.000	0.044	4.450	7060	12.5	3.974	563	1.5	1.7	7.6	0.027	1870	1214	fbmy8028_rel_221222.cza1ps0_bee
100	1363	0	0.0	4.2	0.4	0.000	0.000	0.042	4.038	5687	12.6	4.172	739	1.5	1.7	7.8	0.014	1359	1246	fbmy8032_rel_221222.cza1_bee
100	1817	0	0.0	4.1	0.3	0.000	0.000	0.041	3.560	7410	12.3	4.077	541	1.5	1.7	7.6	0.004	1822	1519	fbmy8032_rel_221222.cza1ps0_bee
qp100.L2
qp100.L2: point queries with 100 insert/s per client
Performance metrics for all DBMS, not just the ones listed above. Some are normalized by throughput, others are not. Legend for results is here.
ips	qps	rps	rmbps	wps	wmbps	rpq	rkbpq	wpi	wkbpi	csps	cpups	cspq	cpupq	dbgb1	dbgb2	rss	maxop	p50	p99	tag
100	2480	23	0.1	4.1	0.3	0.009	0.058	0.041	3.476	10320	13.2	4.161	426	1.5	1.8	8.6	0.010	2446	2045	fbmy8028_rel_221222.cza1_bee
100	2306	6	0.0	4.0	0.3	0.003	0.018	0.040	3.466	9585	12.8	4.157	444	1.5	1.8	8.5	0.010	2237	2045	fbmy8028_rel_221222.cza1ps0_bee
100	2360	5	0.0	3.9	0.3	0.002	0.013	0.040	3.504	10218	13.4	4.329	454	1.5	1.8	8.6	0.010	2334	1966	fbmy8032_rel_221222.cza1_bee
100	2334	0	0.0	4.2	0.4	0.000	0.000	0.042	4.342	9886	13.3	4.235	456	1.5	1.8	8.4	0.003	2221	2061	fbmy8032_rel_221222.cza1ps0_bee
qr500.L3
qr500.L3: range queries with 500 insert/s per client
Performance metrics for all DBMS, not just the ones listed above. Some are normalized by throughput, others are not. Legend for results is here.
ips	qps	rps	rmbps	wps	wmbps	rpq	rkbpq	wpi	wkbpi	csps	cpups	cspq	cpupq	dbgb1	dbgb2	rss	maxop	p50	p99	tag
499	1498	0	0.0	9.0	2.4	0.000	0.000	0.018	4.968	6164	13.5	4.116	721	1.5	1.9	8.7	0.031	1486	1215	fbmy8028_rel_221222.cza1_bee
499	1594	0	0.0	8.7	2.3	0.000	0.000	0.018	4.724	6524	13.5	4.093	678	1.5	1.9	8.6	0.029	1567	1279	fbmy8028_rel_221222.cza1ps0_bee
499	1362	0	0.0	8.9	2.4	0.000	0.000	0.018	4.844	5826	13.6	4.278	799	1.5	2.0	8.8	0.033	1390	1071	fbmy8032_rel_221222.cza1_bee
499	1376	0	0.0	8.8	2.3	0.000	0.000	0.018	4.687	5878	13.4	4.272	779	1.5	2.0	8.5	0.031	1374	1135	fbmy8032_rel_221222.cza1ps0_bee
qp500.L4
qp500.L4: point queries with 500 insert/s per client
Performance metrics for all DBMS, not just the ones listed above. Some are normalized by throughput, others are not. Legend for results is here.
ips	qps	rps	rmbps	wps	wmbps	rpq	rkbpq	wpi	wkbpi	csps	cpups	cspq	cpupq	dbgb1	dbgb2	rss	maxop	p50	p99	tag
499	2393	0	0.0	8.1	2.1	0.000	0.000	0.016	4.379	10059	14.7	4.203	491	1.5	2.2	9.0	0.005	2366	2014	fbmy8028_rel_221222.cza1_bee
499	2336	0	0.0	8.0	2.2	0.000	0.000	0.016	4.427	9822	14.4	4.204	493	1.5	2.2	8.7	0.005	2253	2077	fbmy8028_rel_221222.cza1ps0_bee
499	2305	0	0.0	8.1	2.2	0.000	0.000	0.016	4.441	9898	14.8	4.295	514	1.5	2.2	9.0	0.006	2301	1918	fbmy8032_rel_221222.cza1_bee
499	2334	0	0.0	8.2	2.2	0.000	0.000	0.016	4.517	10019	14.9	4.292	511	1.5	2.2	8.9	0.003	2222	2045	fbmy8032_rel_221222.cza1ps0_bee
qr1000.L5
qr1000.L5: range queries with 1000 insert/s per client
Performance metrics for all DBMS, not just the ones listed above. Some are normalized by throughput, others are not. Legend for results is here.
ips	qps	rps	rmbps	wps	wmbps	rpq	rkbpq	wpi	wkbpi	csps	cpups	cspq	cpupq	dbgb1	dbgb2	rss	maxop	p50	p99	tag
998	1212	29	0.2	14.2	4.6	0.024	0.154	0.014	4.725	5345	15.3	4.411	1010	1.5	2.6	9.1	0.042	1199	895	fbmy8028_rel_221222.cza1_bee
998	1366	3	0.0	13.6	4.6	0.002	0.012	0.014	4.712	5876	15.3	4.302	896	1.5	2.6	8.8	0.032	1374	879	fbmy8028_rel_221222.cza1ps0_bee
998	1406	9	0.0	14.2	4.7	0.006	0.034	0.014	4.803	6255	15.5	4.448	882	1.7	2.8	9.0	0.031	1374	975	fbmy8032_rel_221222.cza1_bee
998	1601	0	0.0	14.1	4.7	0.000	0.000	0.014	4.832	6979	15.5	4.359	775	1.5	2.6	8.9	0.033	1550	1215	fbmy8032_rel_221222.cza1ps0_bee
qp1000.L6
qp1000.L6: point queries with 1000 insert/s per client
Performance metrics for all DBMS, not just the ones listed above. Some are normalized by throughput, others are not. Legend for results is here.
ips	qps	rps	rmbps	wps	wmbps	rpq	rkbpq	wpi	wkbpi	csps	cpups	cspq	cpupq	dbgb1	dbgb2	rss	maxop	p50	p99	tag
998	2358	28	0.2	13.5	4.4	0.012	0.067	0.013	4.503	10186	16.5	4.319	560	1.5	3.0	9.4	0.005	2348	1981	fbmy8028_rel_221222.cza1_bee
998	2368	24	0.1	13.4	4.4	0.010	0.059	0.013	4.539	10223	16.2	4.317	547	1.5	2.9	9.0	0.003	2269	2078	fbmy8028_rel_221222.cza1ps0_bee
998	2334	20	0.1	13.7	4.4	0.008	0.048	0.014	4.472	10272	16.6	4.400	569	1.5	2.9	9.2	0.003	2319	1950	fbmy8032_rel_221222.cza1_bee
998	2358	9	0.0	13.8	4.4	0.004	0.021	0.014	4.512	10371	16.2	4.398	550	1.5	3.0	9.1	0.008	2285	2061	fbmy8032_rel_221222.cza1ps0_bee
l.i0
- l.i0: load without secondary indexes
- Legend for results is here.
- Each entry lists the percentage of responses that fit in that bucket (slower than max time for previous bucket, faster than min time for next bucket).
Insert response time histogram
256us	1ms	4ms	16ms	64ms	256ms	1s	4s	16s	gt	max	tag
0.000	0.000	99.723	0.200	0.074	0.003	0.000	0.000	0.000	0.000	0.077	fbmy8028_rel_221222.cza1_bee
0.000	0.000	99.729	0.193	0.076	0.003	0.000	0.000	0.000	0.000	0.076	fbmy8028_rel_221222.cza1ps0_bee
0.000	0.000	99.715	0.206	0.076	0.002	0.000	0.000	0.000	0.000	0.068	fbmy8032_rel_221222.cza1_bee
0.000	0.000	99.722	0.203	0.072	0.002	0.000	0.000	0.000	0.000	0.071	fbmy8032_rel_221222.cza1ps0_bee
l.x
- l.x: create secondary indexes
- Legend for results is here.
- Each entry lists the percentage of responses that fit in that bucket (slower than max time for previous bucket, faster than min time for next bucket).
TODO - determine whether there is data for create index response time
l.i1
- l.i1: continue load after secondary indexes created with 50 inserts per transaction
- Legend for results is here.
- Each entry lists the percentage of responses that fit in that bucket (slower than max time for previous bucket, faster than min time for next bucket).
Insert response time histogram
256us	1ms	4ms	16ms	64ms	256ms	1s	4s	16s	gt	max	tag
0.000	0.000	99.671	0.254	0.072	0.003	0.000	0.000	0.000	0.000	0.090	fbmy8028_rel_221222.cza1_bee
0.000	0.000	99.675	0.251	0.070	0.003	0.000	0.000	0.000	0.000	0.090	fbmy8028_rel_221222.cza1ps0_bee
0.000	0.000	99.666	0.259	0.074	0.002	0.000	0.000	0.000	0.000	0.081	fbmy8032_rel_221222.cza1_bee
0.000	0.000	99.674	0.254	0.070	0.002	0.000	0.000	0.000	0.000	0.080	fbmy8032_rel_221222.cza1ps0_bee
Delete response time histogram
256us	1ms	4ms	16ms	64ms	256ms	1s	4s	16s	gt	max	tag
0.000	0.000	99.662	0.255	0.080	0.003	0.000	0.000	0.000	0.000	0.095	fbmy8028_rel_221222.cza1_bee
0.000	0.000	99.667	0.251	0.079	0.003	0.000	0.000	0.000	0.000	0.088	fbmy8028_rel_221222.cza1ps0_bee
0.000	0.000	99.652	0.265	0.081	0.002	0.000	0.000	0.000	0.000	0.079	fbmy8032_rel_221222.cza1_bee
0.000	0.000	99.663	0.255	0.080	0.002	0.000	0.000	0.000	0.000	0.080	fbmy8032_rel_221222.cza1ps0_bee
l.i2
- l.i2: continue load after secondary indexes created with 5 inserts per transaction
- Legend for results is here.
- Each entry lists the percentage of responses that fit in that bucket (slower than max time for previous bucket, faster than min time for next bucket).
Insert response time histogram
256us	1ms	4ms	16ms	64ms	256ms	1s	4s	16s	gt	max	tag
0.000	99.834	0.082	0.080	0.003	nonzero	0.000	0.000	0.000	0.000	0.081	fbmy8028_rel_221222.cza1_bee
0.000	99.860	0.059	0.078	0.003	nonzero	0.000	0.000	0.000	0.000	0.072	fbmy8028_rel_221222.cza1ps0_bee
0.000	99.802	0.113	0.082	0.002	nonzero	0.000	0.000	0.000	0.000	0.068	fbmy8032_rel_221222.cza1_bee
0.000	99.850	0.069	0.078	0.003	nonzero	0.000	0.000	0.000	0.000	0.075	fbmy8032_rel_221222.cza1ps0_bee
Delete response time histogram
256us	1ms	4ms	16ms	64ms	256ms	1s	4s	16s	gt	max	tag
0.000	99.796	0.119	0.081	0.003	nonzero	0.000	0.000	0.000	0.000	0.077	fbmy8028_rel_221222.cza1_bee
0.000	99.842	0.076	0.079	0.003	nonzero	0.000	0.000	0.000	0.000	0.081	fbmy8028_rel_221222.cza1ps0_bee
0.000	99.761	0.152	0.084	0.002	nonzero	0.000	0.000	0.000	0.000	0.071	fbmy8032_rel_221222.cza1_bee
0.000	99.824	0.093	0.079	0.004	0.000	0.000	0.000	0.000	0.000	0.064	fbmy8032_rel_221222.cza1ps0_bee
qr100.L1
- qr100.L1: range queries with 100 insert/s per client
- Legend for results is here.
- Each entry lists the percentage of responses that fit in that bucket (slower than max time for previous bucket, faster than min time for next bucket).
Query response time histogram
256us	1ms	4ms	16ms	64ms	256ms	1s	4s	16s	gt	max	tag
9.647	81.277	9.075	0.001	nonzero	0.000	0.000	0.000	0.000	0.000	0.018	fbmy8028_rel_221222.cza1_bee
10.774	73.695	15.531	0.000	nonzero	0.000	0.000	0.000	0.000	0.000	0.027	fbmy8028_rel_221222.cza1ps0_bee
7.531	70.656	21.813	nonzero	0.000	0.000	0.000	0.000	0.000	0.000	0.014	fbmy8032_rel_221222.cza1_bee
14.722	75.677	9.602	nonzero	0.000	0.000	0.000	0.000	0.000	0.000	0.004	fbmy8032_rel_221222.cza1ps0_bee
Insert response time histogram
256us	1ms	4ms	16ms	64ms	256ms	1s	4s	16s	gt	max	tag
0.000	0.000	99.444	0.500	0.056	0.000	0.000	0.000	0.000	0.000	0.018	fbmy8028_rel_221222.cza1_bee
0.000	0.000	99.361	0.583	0.056	0.000	0.000	0.000	0.000	0.000	0.018	fbmy8028_rel_221222.cza1ps0_bee
0.000	0.000	99.389	0.556	0.056	0.000	0.000	0.000	0.000	0.000	0.018	fbmy8032_rel_221222.cza1_bee
0.000	0.000	99.583	0.361	0.056	0.000	0.000	0.000	0.000	0.000	0.018	fbmy8032_rel_221222.cza1ps0_bee
Delete response time histogram
256us	1ms	4ms	16ms	64ms	256ms	1s	4s	16s	gt	max	tag
0.000	0.000	99.556	0.389	0.056	0.000	0.000	0.000	0.000	0.000	0.018	fbmy8028_rel_221222.cza1_bee
0.000	0.000	99.528	0.444	0.028	0.000	0.000	0.000	0.000	0.000	0.017	fbmy8028_rel_221222.cza1ps0_bee
0.000	0.000	99.500	0.472	0.028	0.000	0.000	0.000	0.000	0.000	0.018	fbmy8032_rel_221222.cza1_bee
0.000	0.000	99.694	0.278	0.028	0.000	0.000	0.000	0.000	0.000	0.018	fbmy8032_rel_221222.cza1ps0_bee
qp100.L2
- qp100.L2: point queries with 100 insert/s per client
- Legend for results is here.
- Each entry lists the percentage of responses that fit in that bucket (slower than max time for previous bucket, faster than min time for next bucket).
Query response time histogram
256us	1ms	4ms	16ms	64ms	256ms	1s	4s	16s	gt	max	tag
nonzero	99.986	0.013	0.001	0.000	0.000	0.000	0.000	0.000	0.000	0.010	fbmy8028_rel_221222.cza1_bee
0.004	99.991	0.004	0.001	0.000	0.000	0.000	0.000	0.000	0.000	0.010	fbmy8028_rel_221222.cza1ps0_bee
0.000	99.994	0.005	0.001	0.000	0.000	0.000	0.000	0.000	0.000	0.010	fbmy8032_rel_221222.cza1_bee
nonzero	99.996	0.003	0.000	0.000	0.000	0.000	0.000	0.000	0.000	0.003	fbmy8032_rel_221222.cza1ps0_bee
Insert response time histogram
256us	1ms	4ms	16ms	64ms	256ms	1s	4s	16s	gt	max	tag
0.000	0.000	99.611	0.333	0.056	0.000	0.000	0.000	0.000	0.000	0.018	fbmy8028_rel_221222.cza1_bee
0.000	0.000	99.417	0.500	0.083	0.000	0.000	0.000	0.000	0.000	0.018	fbmy8028_rel_221222.cza1ps0_bee
0.000	0.000	99.639	0.278	0.083	0.000	0.000	0.000	0.000	0.000	0.018	fbmy8032_rel_221222.cza1_bee
0.000	0.000	99.306	0.611	0.083	0.000	0.000	0.000	0.000	0.000	0.018	fbmy8032_rel_221222.cza1ps0_bee
Delete response time histogram
256us	1ms	4ms	16ms	64ms	256ms	1s	4s	16s	gt	max	tag
0.000	0.000	99.750	0.194	0.056	0.000	0.000	0.000	0.000	0.000	0.018	fbmy8028_rel_221222.cza1_bee
0.000	0.000	99.528	0.389	0.083	0.000	0.000	0.000	0.000	0.000	0.017	fbmy8028_rel_221222.cza1ps0_bee
0.000	0.000	99.722	0.222	0.056	0.000	0.000	0.000	0.000	0.000	0.018	fbmy8032_rel_221222.cza1_bee
0.000	0.000	99.417	0.528	0.056	0.000	0.000	0.000	0.000	0.000	0.018	fbmy8032_rel_221222.cza1ps0_bee
qr500.L3
- qr500.L3: range queries with 500 insert/s per client
- Legend for results is here.
- Each entry lists the percentage of responses that fit in that bucket (slower than max time for previous bucket, faster than min time for next bucket).
Query response time histogram
256us	1ms	4ms	16ms	64ms	256ms	1s	4s	16s	gt	max	tag
6.189	69.258	24.553	nonzero	nonzero	0.000	0.000	0.000	0.000	0.000	0.031	fbmy8028_rel_221222.cza1_bee
8.597	73.875	17.528	nonzero	nonzero	0.000	0.000	0.000	0.000	0.000	0.029	fbmy8028_rel_221222.cza1ps0_bee
7.828	71.945	20.226	nonzero	nonzero	0.000	0.000	0.000	0.000	0.000	0.033	fbmy8032_rel_221222.cza1_bee
12.385	57.137	30.477	nonzero	nonzero	0.000	0.000	0.000	0.000	0.000	0.031	fbmy8032_rel_221222.cza1ps0_bee
Insert response time histogram
256us	1ms	4ms	16ms	64ms	256ms	1s	4s	16s	gt	max	tag
0.000	0.000	99.422	0.517	0.061	0.000	0.000	0.000	0.000	0.000	0.018	fbmy8028_rel_221222.cza1_bee
0.000	0.000	99.417	0.511	0.072	0.000	0.000	0.000	0.000	0.000	0.022	fbmy8028_rel_221222.cza1ps0_bee
0.000	0.000	99.550	0.367	0.083	0.000	0.000	0.000	0.000	0.000	0.018	fbmy8032_rel_221222.cza1_bee
0.000	0.000	99.544	0.367	0.089	0.000	0.000	0.000	0.000	0.000	0.025	fbmy8032_rel_221222.cza1ps0_bee
Delete response time histogram
256us	1ms	4ms	16ms	64ms	256ms	1s	4s	16s	gt	max	tag
0.000	0.000	99.461	0.483	0.056	0.000	0.000	0.000	0.000	0.000	0.018	fbmy8028_rel_221222.cza1_bee
0.000	0.000	99.472	0.461	0.067	0.000	0.000	0.000	0.000	0.000	0.022	fbmy8028_rel_221222.cza1ps0_bee
0.000	0.000	99.561	0.361	0.078	0.000	0.000	0.000	0.000	0.000	0.018	fbmy8032_rel_221222.cza1_bee
0.000	0.000	99.594	0.322	0.083	0.000	0.000	0.000	0.000	0.000	0.024	fbmy8032_rel_221222.cza1ps0_bee
qp500.L4
- qp500.L4: point queries with 500 insert/s per client
- Legend for results is here.
- Each entry lists the percentage of responses that fit in that bucket (slower than max time for previous bucket, faster than min time for next bucket).
Query response time histogram
256us	1ms	4ms	16ms	64ms	256ms	1s	4s	16s	gt	max	tag
0.000	99.994	0.006	nonzero	0.000	0.000	0.000	0.000	0.000	0.000	0.005	fbmy8028_rel_221222.cza1_bee
0.015	99.979	0.006	nonzero	0.000	0.000	0.000	0.000	0.000	0.000	0.005	fbmy8028_rel_221222.cza1ps0_bee
0.000	99.993	0.007	nonzero	0.000	0.000	0.000	0.000	0.000	0.000	0.006	fbmy8032_rel_221222.cza1_bee
0.002	99.993	0.005	0.000	0.000	0.000	0.000	0.000	0.000	0.000	0.003	fbmy8032_rel_221222.cza1ps0_bee
Insert response time histogram
256us	1ms	4ms	16ms	64ms	256ms	1s	4s	16s	gt	max	tag
0.000	0.000	99.528	0.383	0.089	0.000	0.000	0.000	0.000	0.000	0.018	fbmy8028_rel_221222.cza1_bee
0.000	0.000	99.550	0.367	0.083	0.000	0.000	0.000	0.000	0.000	0.018	fbmy8028_rel_221222.cza1ps0_bee
0.000	0.000	99.694	0.217	0.089	0.000	0.000	0.000	0.000	0.000	0.018	fbmy8032_rel_221222.cza1_bee
0.000	0.000	99.722	0.194	0.083	0.000	0.000	0.000	0.000	0.000	0.018	fbmy8032_rel_221222.cza1ps0_bee
Delete response time histogram
256us	1ms	4ms	16ms	64ms	256ms	1s	4s	16s	gt	max	tag
0.000	0.000	99.594	0.333	0.072	0.000	0.000	0.000	0.000	0.000	0.018	fbmy8028_rel_221222.cza1_bee
0.000	0.000	99.628	0.306	0.067	0.000	0.000	0.000	0.000	0.000	0.018	fbmy8028_rel_221222.cza1ps0_bee
0.000	0.000	99.711	0.200	0.089	0.000	0.000	0.000	0.000	0.000	0.018	fbmy8032_rel_221222.cza1_bee
0.000	0.000	99.717	0.200	0.083	0.000	0.000	0.000	0.000	0.000	0.039	fbmy8032_rel_221222.cza1ps0_bee
qr1000.L5
- qr1000.L5: range queries with 1000 insert/s per client
- Legend for results is here.
- Each entry lists the percentage of responses that fit in that bucket (slower than max time for previous bucket, faster than min time for next bucket).
Query response time histogram
256us	1ms	4ms	16ms	64ms	256ms	1s	4s	16s	gt	max	tag
4.717	69.575	25.696	0.011	0.001	0.000	0.000	0.000	0.000	0.000	0.042	fbmy8028_rel_221222.cza1_bee
8.159	71.674	20.160	0.006	nonzero	0.000	0.000	0.000	0.000	0.000	0.032	fbmy8028_rel_221222.cza1ps0_bee
7.966	70.949	21.083	0.001	0.001	0.000	0.000	0.000	0.000	0.000	0.031	fbmy8032_rel_221222.cza1_bee
13.262	66.910	19.827	nonzero	0.001	0.000	0.000	0.000	0.000	0.000	0.033	fbmy8032_rel_221222.cza1ps0_bee
Insert response time histogram
256us	1ms	4ms	16ms	64ms	256ms	1s	4s	16s	gt	max	tag
0.000	0.000	99.689	0.231	0.081	0.000	0.000	0.000	0.000	0.000	0.062	fbmy8028_rel_221222.cza1_bee
0.000	0.000	99.753	0.164	0.083	0.000	0.000	0.000	0.000	0.000	0.048	fbmy8028_rel_221222.cza1ps0_bee
0.000	0.000	99.550	0.375	0.075	0.000	0.000	0.000	0.000	0.000	0.042	fbmy8032_rel_221222.cza1_bee
0.000	0.000	99.617	0.303	0.081	0.000	0.000	0.000	0.000	0.000	0.051	fbmy8032_rel_221222.cza1ps0_bee
Delete response time histogram
256us	1ms	4ms	16ms	64ms	256ms	1s	4s	16s	gt	max	tag
0.000	0.000	99.717	0.203	0.081	0.000	0.000	0.000	0.000	0.000	0.049	fbmy8028_rel_221222.cza1_bee
0.000	0.000	99.783	0.139	0.078	0.000	0.000	0.000	0.000	0.000	0.063	fbmy8028_rel_221222.cza1ps0_bee
0.000	0.000	99.583	0.347	0.069	0.000	0.000	0.000	0.000	0.000	0.056	fbmy8032_rel_221222.cza1_bee
0.000	0.000	99.653	0.272	0.075	0.000	0.000	0.000	0.000	0.000	0.043	fbmy8032_rel_221222.cza1ps0_bee
qp1000.L6
- qp1000.L6: point queries with 1000 insert/s per client
- Legend for results is here.
- Each entry lists the percentage of responses that fit in that bucket (slower than max time for previous bucket, faster than min time for next bucket).
Query response time histogram
256us	1ms	4ms	16ms	64ms	256ms	1s	4s	16s	gt	max	tag
0.001	99.989	0.009	nonzero	0.000	0.000	0.000	0.000	0.000	0.000	0.005	fbmy8028_rel_221222.cza1_bee
0.029	99.964	0.007	0.000	0.000	0.000	0.000	0.000	0.000	0.000	0.003	fbmy8028_rel_221222.cza1ps0_bee
0.000	99.993	0.007	0.000	0.000	0.000	0.000	0.000	0.000	0.000	0.003	fbmy8032_rel_221222.cza1_bee
0.004	99.990	0.007	nonzero	0.000	0.000	0.000	0.000	0.000	0.000	0.008	fbmy8032_rel_221222.cza1ps0_bee
Insert response time histogram
256us	1ms	4ms	16ms	64ms	256ms	1s	4s	16s	gt	max	tag
0.000	0.000	99.547	0.375	0.078	0.000	0.000	0.000	0.000	0.000	0.063	fbmy8028_rel_221222.cza1_bee
0.000	0.000	99.572	0.344	0.083	0.000	0.000	0.000	0.000	0.000	0.049	fbmy8028_rel_221222.cza1ps0_bee
0.000	0.000	99.656	0.247	0.097	0.000	0.000	0.000	0.000	0.000	0.056	fbmy8032_rel_221222.cza1_bee
0.000	0.000	99.308	0.617	0.075	0.000	0.000	0.000	0.000	0.000	0.049	fbmy8032_rel_221222.cza1ps0_bee
Delete response time histogram
256us	1ms	4ms	16ms	64ms	256ms	1s	4s	16s	gt	max	tag
0.000	0.000	99.578	0.342	0.081	0.000	0.000	0.000	0.000	0.000	0.049	fbmy8028_rel_221222.cza1_bee
0.000	0.000	99.617	0.306	0.075	0.003	0.000	0.000	0.000	0.000	0.067	fbmy8028_rel_221222.cza1ps0_bee
0.000	0.000	99.683	0.225	0.092	0.000	0.000	0.000	0.000	0.000	0.042	fbmy8032_rel_221222.cza1_bee
0.000	0.000	99.369	0.561	0.069	0.000	0.000	0.000	0.000	0.000	0.042	fbmy8032_rel_221222.cza1ps0_bee