Introduction
This is a report for the insert benchmark with 240M docs and 12 client(s). It is generated by scripts (bash, awk, sed) and Tufte might not be impressed. An overview of the insert benchmark is here and a short update is here. Below, by DBMS, I mean DBMS+version.config. An example is my8020.c10b40 where my means MySQL, 8020 is version 8.0.20 and c10b40 is the name for the configuration file.
The test server has 8 AMD cores, 32G RAM, Ubuntu 22.04, XFS and an NVMe SSD. The benchmark was run with 1 client and there were 1 or 3 connections per client (1 for queries or inserts without rate limits, 1+1 for rate limited inserts+deletes). It uses 1 table. It loads 20M rows per table without secondary indexes, creates 3 secondary indexes per table, then inserts 50m+50m rows per table with a delete per insert to avoid growing the table. It then does 6 read+write tests for 1200s each that do queries as fast as possible with 100,100,500,500,1000,1000 inserts/s and the same for deletes/s per client concurrent with the queries. The database is cached in memory. Clients and the DBMS share one server. The per-database configs are in the per-database subdirectories here.
The tested DBMS are:
- fbmy5635_rel_221222.cza1_c24r64 - MyRocks 5.6.35 compiled on 2023-12-22 at git hash 4f3a57a1, RocksDB 8.7.0 at git hash 29005f0b, cza1_c24r64 config
- fbmy8028_rel_221222.cza1_c24r64 - MyRocks 8.0.28 compiled on 2023-12-22 at git hash 2ad105fc, RocksDB 8.7.0 at git hash 29005f0b, cza1_c24r64 config
- fbmy8028_rel_221222.cza1ps0_c24r64 - MyRocks 8.0.28 compiled on 2023-12-22 at git hash 2ad105fc, RocksDB 8.7.0 at git hash 29005f0b, cza1ps0_c24r64 config that adds performance_schema=0
- fbmy8032_rel_221222.cza1_c24r64 - MyRocks 8.0.32 compiled on 2023-12-22 at git hash 76707b44, RocksDB 8.7.0 at git hash 29005f0b, cza1_c24r64 config
- fbmy8032_rel_221222.cza1ps0_c24r64 - MyRocks 8.0.32 compiled on 2023-12-22 at git hash 76707b44, RocksDB 8.7.0 at git hash 29005f0b, cza1ps0_c24r64 config that adds performance_schema=0
Contents
- Summary
- l.i0: load without secondary indexes
- l.x: create secondary indexes
- l.i1: continue load after secondary indexes created with 50 inserts per transaction
- l.i2: continue load after secondary indexes created with 5 inserts per transaction
- qr100.L1: range queries with 100 insert/s per client
- qp100.L2: point queries with 100 insert/s per client
- qr500.L3: range queries with 500 insert/s per client
- qp500.L4: point queries with 500 insert/s per client
- qr1000.L5: range queries with 1000 insert/s per client
- qp1000.L6: point queries with 1000 insert/s per client
Summary
The numbers are inserts/s for l.i0, l.i1 and l.i2, indexed docs (or rows) /s for l.x and queries/s for qr100, qp100 thru qr1000, qp1000" The values are the average rate over the entire test for inserts (IPS) and queries (QPS). The range of values for IPS and QPS is split into 3 parts: bottom 25%, middle 50%, top 25%. Values in the bottom 25% have a red background, values in the top 25% have a green background and values in the middle have no color. A gray background is used for values that can be ignored because the DBMS did not sustain the target insert rate. Red backgrounds are not used when the minimum value is within 80% of the max value.
| dbms | l.i0 | l.x | l.i1 | l.i2 | qr100 | qp100 | qr500 | qp500 | qr1000 | qp1000 |
|---|---|---|---|---|---|---|---|---|---|---|
| fbmy5635_rel_221222.cza1_c24r64 | 662983 | 1116280 | 37011 | 28436 | 26938 | 48115 | 27118 | 43996 | 25681 | 41805 |
| fbmy8028_rel_221222.cza1_c24r64 | 578313 | 1170732 | 37981 | 35693 | 31796 | 47687 | 29059 | 44034 | 29509 | 42390 |
| fbmy8028_rel_221222.cza1ps0_c24r64 | 589680 | 1165049 | 38083 | 34246 | 30515 | 49542 | 29556 | 45133 | 29401 | 43543 |
| fbmy8032_rel_221222.cza1_c24r64 | 555556 | 1153847 | 38138 | 35896 | 31243 | 46082 | 30700 | 42339 | 30277 | 40723 |
| fbmy8032_rel_221222.cza1ps0_c24r64 | 547945 | 1188119 | 38156 | 34712 | 30049 | 48479 | 31324 | 44545 | 31845 | 43170 |
This table has relative throughput, throughput for the DBMS relative to the DBMS in the first line, using the absolute throughput from the previous table. Values less than 0.95 have a yellow background. Values greater than 1.05 have a blue background.
| dbms | l.i0 | l.x | l.i1 | l.i2 | qr100 | qp100 | qr500 | qp500 | qr1000 | qp1000 |
|---|---|---|---|---|---|---|---|---|---|---|
| fbmy5635_rel_221222.cza1_c24r64 | 1.00 | 1.00 | 1.00 | 1.00 | 1.00 | 1.00 | 1.00 | 1.00 | 1.00 | 1.00 |
| fbmy8028_rel_221222.cza1_c24r64 | 0.87 | 1.05 | 1.03 | 1.26 | 1.18 | 0.99 | 1.07 | 1.00 | 1.15 | 1.01 |
| fbmy8028_rel_221222.cza1ps0_c24r64 | 0.89 | 1.04 | 1.03 | 1.20 | 1.13 | 1.03 | 1.09 | 1.03 | 1.14 | 1.04 |
| fbmy8032_rel_221222.cza1_c24r64 | 0.84 | 1.03 | 1.03 | 1.26 | 1.16 | 0.96 | 1.13 | 0.96 | 1.18 | 0.97 |
| fbmy8032_rel_221222.cza1ps0_c24r64 | 0.83 | 1.06 | 1.03 | 1.22 | 1.12 | 1.01 | 1.16 | 1.01 | 1.24 | 1.03 |
This lists the average rate of inserts/s for the tests that do inserts concurrent with queries. For such tests the query rate is listed in the table above. The read+write tests are setup so that the insert rate should match the target rate every second. Cells that are not at least 95% of the target have a red background to indicate a failure to satisfy the target.
| dbms | qr100.L1 | qp100.L2 | qr500.L3 | qp500.L4 | qr1000.L5 | qp1000.L6 |
|---|---|---|---|---|---|---|
| fbmy5635_rel_221222.cza1_c24r64 | 1187 | 1186 | 5936 | 5936 | 11871 | 11871 |
| fbmy8028_rel_221222.cza1_c24r64 | 1187 | 1187 | 5931 | 5931 | 11881 | 11881 |
| fbmy8028_rel_221222.cza1ps0_c24r64 | 1187 | 1186 | 5936 | 5936 | 11871 | 11881 |
| fbmy8032_rel_221222.cza1_c24r64 | 1187 | 1186 | 5936 | 5931 | 11871 | 11881 |
| fbmy8032_rel_221222.cza1ps0_c24r64 | 1186 | 1187 | 5931 | 5936 | 11881 | 11871 |
| target | 1200 | 1200 | 6000 | 6000 | 12000 | 12000 |
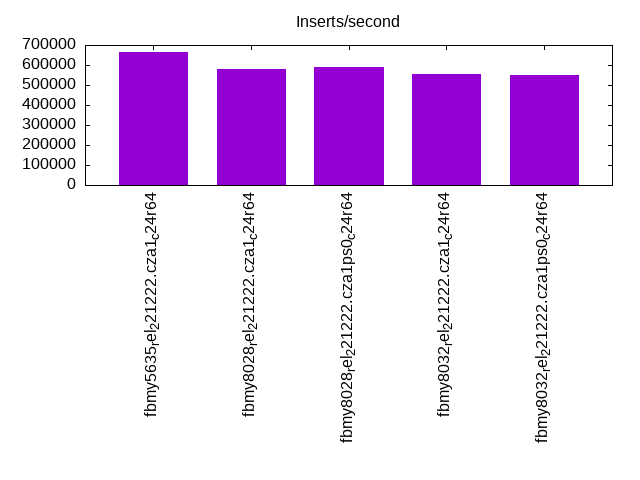
l.i0
l.i0: load without secondary indexes. Graphs for performance per 1-second interval are here.
Average throughput:
Insert response time histogram: each cell has the percentage of responses that take <= the time in the header and max is the max response time in seconds. For the max column values in the top 25% of the range have a red background and in the bottom 25% of the range have a green background. The red background is not used when the min value is within 80% of the max value.
| dbms | 256us | 1ms | 4ms | 16ms | 64ms | 256ms | 1s | 4s | 16s | gt | max |
|---|---|---|---|---|---|---|---|---|---|---|---|
| fbmy5635_rel_221222.cza1_c24r64 | 3.121 | 96.775 | 0.080 | 0.003 | 0.021 | 0.214 | |||||
| fbmy8028_rel_221222.cza1_c24r64 | 0.201 | 98.952 | 0.798 | 0.024 | 0.024 | 0.210 | |||||
| fbmy8028_rel_221222.cza1ps0_c24r64 | 0.384 | 98.822 | 0.742 | 0.027 | 0.025 | 0.193 | |||||
| fbmy8032_rel_221222.cza1_c24r64 | 0.044 | 99.076 | 0.831 | 0.026 | 0.022 | 0.197 | |||||
| fbmy8032_rel_221222.cza1ps0_c24r64 | 0.208 | 98.807 | 0.930 | 0.032 | 0.023 | 0.001 | 0.265 |
Performance metrics for the DBMS listed above. Some are normalized by throughput, others are not. Legend for results is here.
ips	qps	rps	rmbps	wps	wmbps	rpq	rkbpq	wpi	wkbpi	csps	cpups	cspq	cpupq	dbgb1	dbgb2	rss	maxop	p50	p99	tag
662983	0	0	0.0	750.6	243.3	0.000	0.000	0.001	0.376	123339	68.2	0.186	25	7.0	7.5	1.9	0.214	58836	42053	fbmy5635_rel_221222.cza1_c24r64
578313	0	0	0.0	534.6	215.0	0.000	0.000	0.001	0.381	93408	68.0	0.162	28	7.0	7.7	2.4	0.210	52060	38558	fbmy8028_rel_221222.cza1_c24r64
589680	0	0	0.0	544.2	220.4	0.000	0.000	0.001	0.383	97571	68.3	0.165	28	6.9	7.7	2.1	0.193	51744	39356	fbmy8028_rel_221222.cza1ps0_c24r64
555556	0	0	0.0	510.1	204.8	0.000	0.000	0.001	0.377	88742	67.5	0.160	29	7.0	7.7	2.4	0.197	48852	35461	fbmy8032_rel_221222.cza1_c24r64
547945	0	0	0.0	548.0	222.5	0.000	0.000	0.001	0.416	96154	68.6	0.175	30	7.1	7.9	2.2	0.265	49048	34862	fbmy8032_rel_221222.cza1ps0_c24r64
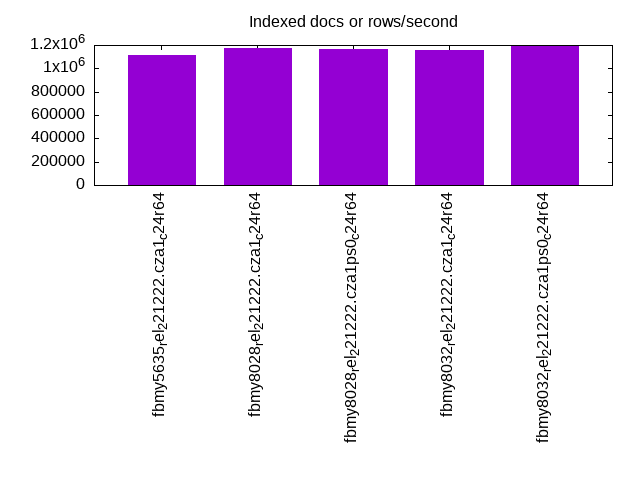
l.x
l.x: create secondary indexes.
Average throughput:
Performance metrics for the DBMS listed above. Some are normalized by throughput, others are not. Legend for results is here.
ips	qps	rps	rmbps	wps	wmbps	rpq	rkbpq	wpi	wkbpi	csps	cpups	cspq	cpupq	dbgb1	dbgb2	rss	maxop	p50	p99	tag
1116280	0	2	0.2	568.0	173.8	0.000	0.000	0.001	0.159	2396	44.3	0.002	10	15.7	16.2	16.8	0.005	NA	NA	fbmy5635_rel_221222.cza1_c24r64
1170732	0	2	0.2	434.5	182.2	0.000	0.000	0.000	0.159	3177	45.0	0.003	9	15.6	16.4	19.6	0.007	NA	NA	fbmy8028_rel_221222.cza1_c24r64
1165049	0	2	0.2	433.2	182.0	0.000	0.000	0.000	0.160	3292	45.7	0.003	9	15.6	16.4	19.2	0.011	NA	NA	fbmy8028_rel_221222.cza1ps0_c24r64
1153847	0	2	0.2	430.6	181.6	0.000	0.000	0.000	0.161	3927	46.0	0.003	10	15.6	16.4	19.5	0.010	NA	NA	fbmy8032_rel_221222.cza1_c24r64
1188119	0	2	0.2	441.7	186.6	0.000	0.000	0.000	0.161	4033	46.2	0.003	9	15.6	16.4	19.4	0.006	NA	NA	fbmy8032_rel_221222.cza1ps0_c24r64
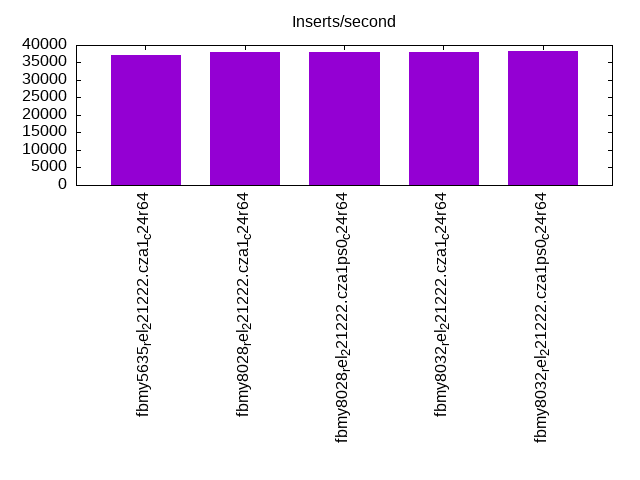
l.i1
l.i1: continue load after secondary indexes created with 50 inserts per transaction. Graphs for performance per 1-second interval are here.
Average throughput:
Insert response time histogram: each cell has the percentage of responses that take <= the time in the header and max is the max response time in seconds. For the max column values in the top 25% of the range have a red background and in the bottom 25% of the range have a green background. The red background is not used when the min value is within 80% of the max value.
| dbms | 256us | 1ms | 4ms | 16ms | 64ms | 256ms | 1s | 4s | 16s | gt | max |
|---|---|---|---|---|---|---|---|---|---|---|---|
| fbmy5635_rel_221222.cza1_c24r64 | nonzero | 0.069 | 38.817 | 61.113 | nonzero | 0.072 | |||||
| fbmy8028_rel_221222.cza1_c24r64 | 0.060 | 47.165 | 52.773 | 0.001 | 0.122 | ||||||
| fbmy8028_rel_221222.cza1ps0_c24r64 | 0.057 | 48.245 | 51.697 | 0.001 | 0.231 | ||||||
| fbmy8032_rel_221222.cza1_c24r64 | 0.070 | 48.654 | 51.274 | 0.001 | nonzero | 1.309 | |||||
| fbmy8032_rel_221222.cza1ps0_c24r64 | nonzero | 0.065 | 48.325 | 51.609 | 0.001 | 0.140 |
Delete response time histogram: each cell has the percentage of responses that take <= the time in the header and max is the max response time in seconds. For the max column values in the top 25% of the range have a red background and in the bottom 25% of the range have a green background. The red background is not used when the min value is within 80% of the max value.
| dbms | 256us | 1ms | 4ms | 16ms | 64ms | 256ms | 1s | 4s | 16s | gt | max |
|---|---|---|---|---|---|---|---|---|---|---|---|
| fbmy5635_rel_221222.cza1_c24r64 | 0.069 | 54.736 | 45.191 | 0.004 | 0.192 | ||||||
| fbmy8028_rel_221222.cza1_c24r64 | 0.097 | 49.856 | 50.045 | 0.002 | 0.130 | ||||||
| fbmy8028_rel_221222.cza1ps0_c24r64 | 0.092 | 50.953 | 48.952 | 0.003 | 0.231 | ||||||
| fbmy8032_rel_221222.cza1_c24r64 | 0.102 | 50.819 | 49.076 | 0.003 | nonzero | 1.307 | |||||
| fbmy8032_rel_221222.cza1ps0_c24r64 | 0.101 | 50.725 | 49.171 | 0.002 | 0.203 |
Performance metrics for the DBMS listed above. Some are normalized by throughput, others are not. Legend for results is here.
ips	qps	rps	rmbps	wps	wmbps	rpq	rkbpq	wpi	wkbpi	csps	cpups	cspq	cpupq	dbgb1	dbgb2	rss	maxop	p50	p99	tag
37011	0	1540	8.5	325.6	107.8	0.042	0.235	0.009	2.983	34412	33.6	0.930	218	18.4	19.0	44.9	0.072	3096	2647	fbmy5635_rel_221222.cza1_c24r64
37981	0	1610	9.2	285.0	112.0	0.042	0.248	0.008	3.020	32149	38.0	0.846	240	18.1	18.9	47.0	0.122	3148	2697	fbmy8028_rel_221222.cza1_c24r64
38083	0	1614	9.2	286.0	112.5	0.042	0.248	0.008	3.024	32612	37.6	0.856	237	18.3	19.1	46.3	0.231	3196	2647	fbmy8028_rel_221222.cza1ps0_c24r64
38138	0	1731	9.9	292.6	115.1	0.045	0.266	0.008	3.089	32153	39.2	0.843	247	17.9	18.7	46.5	1.309	3196	2647	fbmy8032_rel_221222.cza1_c24r64
38156	0	1670	9.6	284.1	111.8	0.044	0.258	0.007	2.999	31985	39.3	0.838	247	18.0	18.8	46.7	0.140	3196	2647	fbmy8032_rel_221222.cza1ps0_c24r64
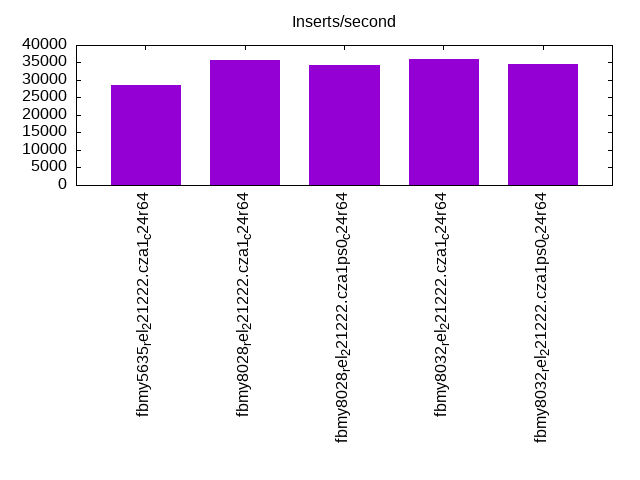
l.i2
l.i2: continue load after secondary indexes created with 5 inserts per transaction. Graphs for performance per 1-second interval are here.
Average throughput:
Insert response time histogram: each cell has the percentage of responses that take <= the time in the header and max is the max response time in seconds. For the max column values in the top 25% of the range have a red background and in the bottom 25% of the range have a green background. The red background is not used when the min value is within 80% of the max value.
| dbms | 256us | 1ms | 4ms | 16ms | 64ms | 256ms | 1s | 4s | 16s | gt | max |
|---|---|---|---|---|---|---|---|---|---|---|---|
| fbmy5635_rel_221222.cza1_c24r64 | 0.012 | 3.606 | 96.329 | 0.049 | 0.004 | nonzero | 0.095 | ||||
| fbmy8028_rel_221222.cza1_c24r64 | 5.874 | 94.028 | 0.088 | 0.010 | nonzero | 0.147 | |||||
| fbmy8028_rel_221222.cza1ps0_c24r64 | 5.044 | 94.847 | 0.099 | 0.010 | nonzero | 0.118 | |||||
| fbmy8032_rel_221222.cza1_c24r64 | 5.998 | 93.908 | 0.086 | 0.009 | nonzero | 0.094 | |||||
| fbmy8032_rel_221222.cza1ps0_c24r64 | 5.281 | 94.590 | 0.119 | 0.010 | nonzero | 0.066 |
Delete response time histogram: each cell has the percentage of responses that take <= the time in the header and max is the max response time in seconds. For the max column values in the top 25% of the range have a red background and in the bottom 25% of the range have a green background. The red background is not used when the min value is within 80% of the max value.
| dbms | 256us | 1ms | 4ms | 16ms | 64ms | 256ms | 1s | 4s | 16s | gt | max |
|---|---|---|---|---|---|---|---|---|---|---|---|
| fbmy5635_rel_221222.cza1_c24r64 | 0.001 | 2.592 | 97.302 | 0.099 | 0.006 | 0.001 | 0.100 | ||||
| fbmy8028_rel_221222.cza1_c24r64 | 3.846 | 96.038 | 0.106 | 0.010 | nonzero | 0.155 | |||||
| fbmy8028_rel_221222.cza1ps0_c24r64 | 3.292 | 96.569 | 0.128 | 0.011 | nonzero | 0.148 | |||||
| fbmy8032_rel_221222.cza1_c24r64 | 3.922 | 95.965 | 0.103 | 0.009 | nonzero | 0.092 | |||||
| fbmy8032_rel_221222.cza1ps0_c24r64 | 3.480 | 96.361 | 0.148 | 0.011 | nonzero | 0.098 |
Performance metrics for the DBMS listed above. Some are normalized by throughput, others are not. Legend for results is here.
ips	qps	rps	rmbps	wps	wmbps	rpq	rkbpq	wpi	wkbpi	csps	cpups	cspq	cpupq	dbgb1	dbgb2	rss	maxop	p50	p99	tag
28436	0	1746	9.5	254.3	84.6	0.061	0.344	0.009	3.048	196168	47.9	6.899	404	19.7	19.8	44.3	0.095	2382	1688	fbmy5635_rel_221222.cza1_c24r64
35693	0	2411	13.7	299.8	112.2	0.068	0.394	0.008	3.219	244071	53.4	6.838	359	18.0	18.3	44.4	0.147	3018	2163	fbmy8028_rel_221222.cza1_c24r64
34246	0	2346	13.4	288.3	107.1	0.069	0.400	0.008	3.204	233202	52.6	6.810	369	17.9	18.2	44.5	0.118	2897	2043	fbmy8028_rel_221222.cza1ps0_c24r64
35896	0	2351	13.4	299.1	110.5	0.066	0.382	0.008	3.153	245912	53.3	6.851	356	18.2	18.5	44.5	0.094	3022	2202	fbmy8032_rel_221222.cza1_c24r64
34712	0	2289	13.0	290.0	106.9	0.066	0.385	0.008	3.154	234333	53.2	6.751	368	19.2	19.5	44.8	0.066	2928	2053	fbmy8032_rel_221222.cza1ps0_c24r64
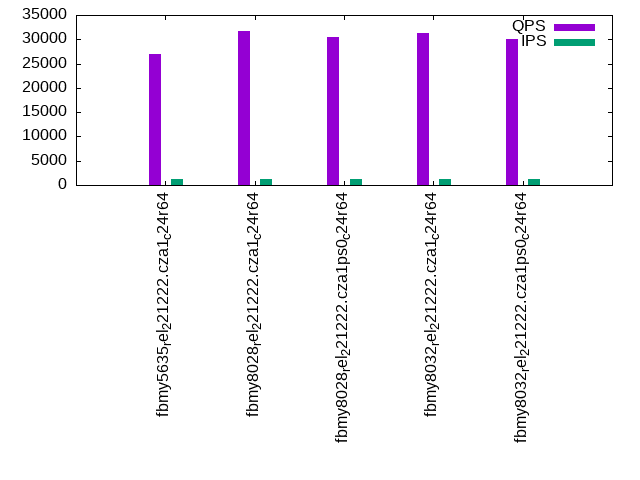
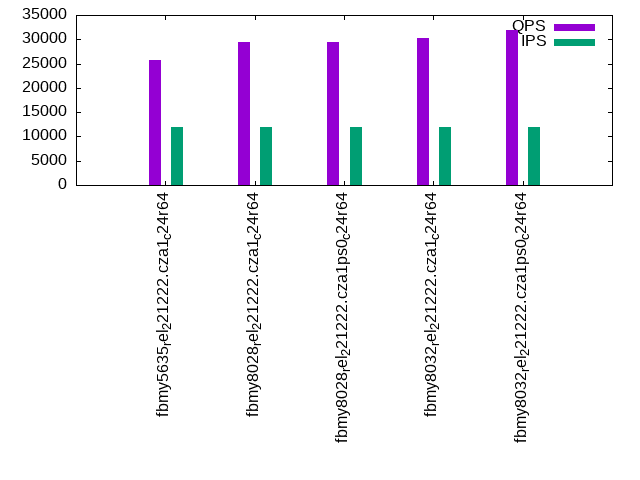
qr100.L1
qr100.L1: range queries with 100 insert/s per client. Graphs for performance per 1-second interval are here.
Average throughput:
Query response time histogram: each cell has the percentage of responses that take <= the time in the header and max is the max response time in seconds. For max values in the top 25% of the range have a red background and in the bottom 25% of the range have a green background. The red background is not used when the min value is within 80% of the max value.
| dbms | 256us | 1ms | 4ms | 16ms | 64ms | 256ms | 1s | 4s | 16s | gt | max |
|---|---|---|---|---|---|---|---|---|---|---|---|
| fbmy5635_rel_221222.cza1_c24r64 | 62.007 | 27.478 | 10.514 | nonzero | nonzero | nonzero | 0.083 | ||||
| fbmy8028_rel_221222.cza1_c24r64 | 64.531 | 31.165 | 4.303 | nonzero | nonzero | nonzero | 0.104 | ||||
| fbmy8028_rel_221222.cza1ps0_c24r64 | 64.787 | 28.566 | 6.646 | nonzero | nonzero | nonzero | 0.071 | ||||
| fbmy8032_rel_221222.cza1_c24r64 | 65.488 | 29.424 | 5.087 | nonzero | nonzero | nonzero | 0.093 | ||||
| fbmy8032_rel_221222.cza1ps0_c24r64 | 66.184 | 26.193 | 7.622 | nonzero | nonzero | nonzero | 0.113 |
Insert response time histogram: each cell has the percentage of responses that take <= the time in the header and max is the max response time in seconds. For max values in the top 25% of the range have a red background and in the bottom 25% of the range have a green background. The red background is not used when the min value is within 80% of the max value.
| dbms | 256us | 1ms | 4ms | 16ms | 64ms | 256ms | 1s | 4s | 16s | gt | max |
|---|---|---|---|---|---|---|---|---|---|---|---|
| fbmy5635_rel_221222.cza1_c24r64 | 0.632 | 91.851 | 7.503 | 0.014 | 0.024 | ||||||
| fbmy8028_rel_221222.cza1_c24r64 | 96.087 | 3.910 | 0.003 | 0.028 | |||||||
| fbmy8028_rel_221222.cza1ps0_c24r64 | 0.003 | 95.556 | 4.441 | 0.007 | |||||||
| fbmy8032_rel_221222.cza1_c24r64 | 95.382 | 4.618 | 0.008 | ||||||||
| fbmy8032_rel_221222.cza1ps0_c24r64 | 96.351 | 3.649 | 0.008 |
Delete response time histogram: each cell has the percentage of responses that take <= the time in the header and max is the max response time in seconds. For max values in the top 25% of the range have a red background and in the bottom 25% of the range have a green background. The red background is not used when the min value is within 80% of the max value.
| dbms | 256us | 1ms | 4ms | 16ms | 64ms | 256ms | 1s | 4s | 16s | gt | max |
|---|---|---|---|---|---|---|---|---|---|---|---|
| fbmy5635_rel_221222.cza1_c24r64 | 1.753 | 92.062 | 6.167 | 0.017 | 0.053 | ||||||
| fbmy8028_rel_221222.cza1_c24r64 | 0.163 | 98.219 | 1.615 | 0.003 | 0.024 | ||||||
| fbmy8028_rel_221222.cza1ps0_c24r64 | 0.413 | 97.219 | 2.368 | 0.008 | |||||||
| fbmy8032_rel_221222.cza1_c24r64 | 0.017 | 97.632 | 2.347 | 0.003 | 0.141 | ||||||
| fbmy8032_rel_221222.cza1ps0_c24r64 | 0.122 | 98.128 | 1.747 | 0.003 | 0.025 |
Performance metrics for the DBMS listed above. Some are normalized by throughput, others are not. Legend for results is here.
ips	qps	rps	rmbps	wps	wmbps	rpq	rkbpq	wpi	wkbpi	csps	cpups	cspq	cpupq	dbgb1	dbgb2	rss	maxop	p50	p99	tag
1187	26938	57	0.3	22.2	6.4	0.002	0.013	0.019	5.514	105453	49.3	3.915	439	17.4	17.7	44.5	0.083	2366	2030	fbmy5635_rel_221222.cza1_c24r64
1187	31796	102	0.6	26.4	9.0	0.003	0.019	0.022	7.742	124227	50.5	3.907	381	17.4	17.9	44.9	0.104	2222	1966	fbmy8028_rel_221222.cza1_c24r64
1187	30515	61	0.4	22.2	7.1	0.002	0.013	0.019	6.099	119150	49.5	3.905	389	17.4	17.9	44.8	0.071	3308	3038	fbmy8028_rel_221222.cza1ps0_c24r64
1187	31243	106	0.6	24.5	8.1	0.003	0.021	0.021	7.023	122029	50.3	3.906	386	17.3	17.8	44.9	0.093	2301	1982	fbmy8032_rel_221222.cza1_c24r64
1186	30049	96	0.6	26.4	9.1	0.003	0.021	0.022	7.855	117646	49.6	3.915	396	17.4	17.9	45.3	0.113	2047	1759	fbmy8032_rel_221222.cza1ps0_c24r64
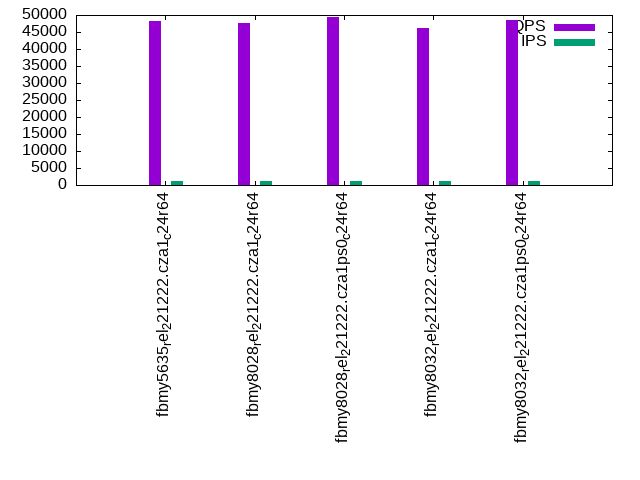
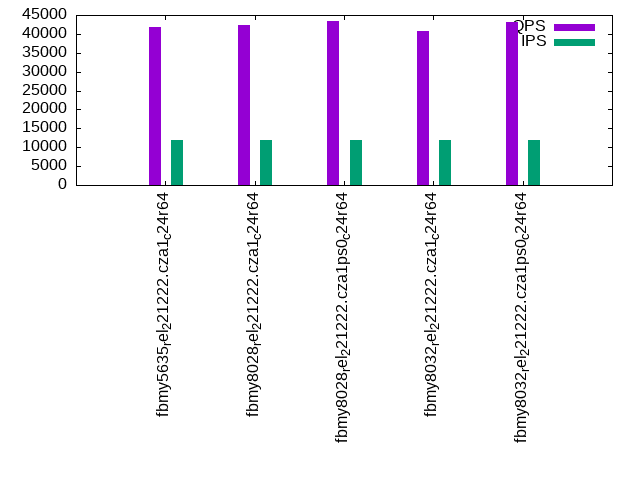
qp100.L2
qp100.L2: point queries with 100 insert/s per client. Graphs for performance per 1-second interval are here.
Average throughput:
Query response time histogram: each cell has the percentage of responses that take <= the time in the header and max is the max response time in seconds. For max values in the top 25% of the range have a red background and in the bottom 25% of the range have a green background. The red background is not used when the min value is within 80% of the max value.
| dbms | 256us | 1ms | 4ms | 16ms | 64ms | 256ms | 1s | 4s | 16s | gt | max |
|---|---|---|---|---|---|---|---|---|---|---|---|
| fbmy5635_rel_221222.cza1_c24r64 | 84.447 | 15.490 | 0.060 | 0.004 | nonzero | 0.027 | |||||
| fbmy8028_rel_221222.cza1_c24r64 | 83.835 | 16.092 | 0.065 | 0.007 | 0.001 | 0.044 | |||||
| fbmy8028_rel_221222.cza1ps0_c24r64 | 88.387 | 11.555 | 0.052 | 0.006 | 0.001 | 0.036 | |||||
| fbmy8032_rel_221222.cza1_c24r64 | 78.631 | 21.293 | 0.065 | 0.010 | 0.001 | 0.064 | |||||
| fbmy8032_rel_221222.cza1ps0_c24r64 | 86.001 | 13.920 | 0.068 | 0.009 | 0.001 | 0.056 |
Insert response time histogram: each cell has the percentage of responses that take <= the time in the header and max is the max response time in seconds. For max values in the top 25% of the range have a red background and in the bottom 25% of the range have a green background. The red background is not used when the min value is within 80% of the max value.
| dbms | 256us | 1ms | 4ms | 16ms | 64ms | 256ms | 1s | 4s | 16s | gt | max |
|---|---|---|---|---|---|---|---|---|---|---|---|
| fbmy5635_rel_221222.cza1_c24r64 | 0.892 | 98.590 | 0.486 | 0.031 | 0.058 | ||||||
| fbmy8028_rel_221222.cza1_c24r64 | 93.260 | 6.733 | 0.007 | 0.017 | |||||||
| fbmy8028_rel_221222.cza1ps0_c24r64 | 99.542 | 0.451 | 0.007 | 0.025 | |||||||
| fbmy8032_rel_221222.cza1_c24r64 | 91.503 | 8.483 | 0.014 | 0.053 | |||||||
| fbmy8032_rel_221222.cza1ps0_c24r64 | 98.434 | 1.559 | 0.007 | 0.020 |
Delete response time histogram: each cell has the percentage of responses that take <= the time in the header and max is the max response time in seconds. For max values in the top 25% of the range have a red background and in the bottom 25% of the range have a green background. The red background is not used when the min value is within 80% of the max value.
| dbms | 256us | 1ms | 4ms | 16ms | 64ms | 256ms | 1s | 4s | 16s | gt | max |
|---|---|---|---|---|---|---|---|---|---|---|---|
| fbmy5635_rel_221222.cza1_c24r64 | 3.368 | 96.306 | 0.292 | 0.035 | 0.057 | ||||||
| fbmy8028_rel_221222.cza1_c24r64 | 0.472 | 94.524 | 5.003 | 0.014 | |||||||
| fbmy8028_rel_221222.cza1ps0_c24r64 | 1.649 | 98.073 | 0.274 | 0.003 | 0.019 | ||||||
| fbmy8032_rel_221222.cza1_c24r64 | 0.003 | 92.944 | 7.045 | 0.007 | 0.025 | ||||||
| fbmy8032_rel_221222.cza1ps0_c24r64 | 0.090 | 98.889 | 1.014 | 0.007 | 0.020 |
Performance metrics for the DBMS listed above. Some are normalized by throughput, others are not. Legend for results is here.
ips	qps	rps	rmbps	wps	wmbps	rpq	rkbpq	wpi	wkbpi	csps	cpups	cspq	cpupq	dbgb1	dbgb2	rss	maxop	p50	p99	tag
1186	48115	902	5.4	29.3	8.9	0.019	0.116	0.025	7.710	215474	49.8	4.478	248	17.4	18.0	48.3	0.027	4123	1407	fbmy5635_rel_221222.cza1_c24r64
1187	47687	929	6.1	29.8	10.4	0.019	0.131	0.025	8.934	214451	50.4	4.497	254	17.4	18.2	48.8	0.044	4139	1454	fbmy8028_rel_221222.cza1_c24r64
1186	49542	950	6.2	26.9	9.1	0.019	0.129	0.023	7.875	222181	49.6	4.485	240	17.4	18.2	48.9	0.036	4267	1566	fbmy8028_rel_221222.cza1ps0_c24r64
1186	46082	871	5.6	27.9	9.5	0.019	0.124	0.024	8.214	206625	50.1	4.484	261	17.4	18.2	48.7	0.064	3980	1294	fbmy8032_rel_221222.cza1_c24r64
1187	48479	949	6.3	29.5	10.0	0.020	0.132	0.025	8.638	220739	49.7	4.553	246	17.4	18.2	49.1	0.056	4203	1231	fbmy8032_rel_221222.cza1ps0_c24r64
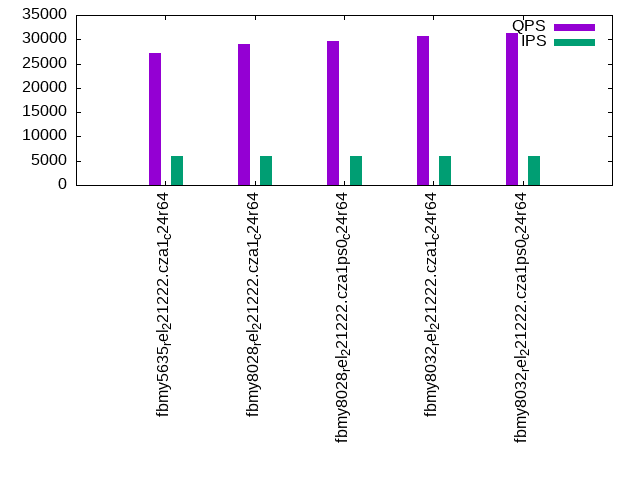
qr500.L3
qr500.L3: range queries with 500 insert/s per client. Graphs for performance per 1-second interval are here.
Average throughput:
Query response time histogram: each cell has the percentage of responses that take <= the time in the header and max is the max response time in seconds. For max values in the top 25% of the range have a red background and in the bottom 25% of the range have a green background. The red background is not used when the min value is within 80% of the max value.
| dbms | 256us | 1ms | 4ms | 16ms | 64ms | 256ms | 1s | 4s | 16s | gt | max |
|---|---|---|---|---|---|---|---|---|---|---|---|
| fbmy5635_rel_221222.cza1_c24r64 | 60.881 | 28.884 | 10.229 | 0.004 | 0.002 | nonzero | 0.192 | ||||
| fbmy8028_rel_221222.cza1_c24r64 | 60.511 | 32.950 | 6.535 | 0.002 | 0.002 | nonzero | 0.178 | ||||
| fbmy8028_rel_221222.cza1ps0_c24r64 | 63.204 | 30.806 | 5.985 | 0.002 | 0.002 | nonzero | 0.172 | ||||
| fbmy8032_rel_221222.cza1_c24r64 | 64.715 | 29.391 | 5.891 | 0.002 | 0.002 | nonzero | 0.172 | ||||
| fbmy8032_rel_221222.cza1ps0_c24r64 | 65.700 | 27.428 | 6.869 | 0.002 | 0.002 | nonzero | 0.149 |
Insert response time histogram: each cell has the percentage of responses that take <= the time in the header and max is the max response time in seconds. For max values in the top 25% of the range have a red background and in the bottom 25% of the range have a green background. The red background is not used when the min value is within 80% of the max value.
| dbms | 256us | 1ms | 4ms | 16ms | 64ms | 256ms | 1s | 4s | 16s | gt | max |
|---|---|---|---|---|---|---|---|---|---|---|---|
| fbmy5635_rel_221222.cza1_c24r64 | 0.618 | 20.858 | 77.487 | 1.037 | 0.044 | ||||||
| fbmy8028_rel_221222.cza1_c24r64 | 21.370 | 77.947 | 0.683 | 0.028 | |||||||
| fbmy8028_rel_221222.cza1ps0_c24r64 | 28.217 | 71.369 | 0.415 | 0.032 | |||||||
| fbmy8032_rel_221222.cza1_c24r64 | 26.165 | 73.456 | 0.380 | 0.028 | |||||||
| fbmy8032_rel_221222.cza1ps0_c24r64 | 17.040 | 81.868 | 1.092 | 0.038 |
Delete response time histogram: each cell has the percentage of responses that take <= the time in the header and max is the max response time in seconds. For max values in the top 25% of the range have a red background and in the bottom 25% of the range have a green background. The red background is not used when the min value is within 80% of the max value.
| dbms | 256us | 1ms | 4ms | 16ms | 64ms | 256ms | 1s | 4s | 16s | gt | max |
|---|---|---|---|---|---|---|---|---|---|---|---|
| fbmy5635_rel_221222.cza1_c24r64 | 1.484 | 20.892 | 76.658 | 0.966 | 0.042 | ||||||
| fbmy8028_rel_221222.cza1_c24r64 | 0.008 | 22.894 | 76.453 | 0.643 | 0.001 | 0.191 | |||||
| fbmy8028_rel_221222.cza1ps0_c24r64 | 0.045 | 30.321 | 69.229 | 0.405 | 0.028 | ||||||
| fbmy8032_rel_221222.cza1_c24r64 | 27.961 | 71.671 | 0.367 | 0.001 | 0.140 | ||||||
| fbmy8032_rel_221222.cza1ps0_c24r64 | 0.001 | 18.182 | 80.781 | 1.036 | 0.036 |
Performance metrics for the DBMS listed above. Some are normalized by throughput, others are not. Legend for results is here.
ips	qps	rps	rmbps	wps	wmbps	rpq	rkbpq	wpi	wkbpi	csps	cpups	cspq	cpupq	dbgb1	dbgb2	rss	maxop	p50	p99	tag
5936	27118	446	2.7	139.6	45.3	0.016	0.103	0.024	7.815	110162	54.4	4.062	481	18.4	18.7	47.0	0.192	2397	1903	fbmy5635_rel_221222.cza1_c24r64
5931	29059	487	3.1	116.5	45.7	0.017	0.108	0.020	7.889	118153	55.0	4.066	454	17.4	17.8	49.4	0.178	2829	2205	fbmy8028_rel_221222.cza1_c24r64
5936	29556	463	3.0	117.5	45.4	0.016	0.103	0.020	7.830	120046	54.6	4.062	443	18.2	18.6	48.2	0.172	2733	2254	fbmy8028_rel_221222.cza1ps0_c24r64
5936	30700	466	3.0	118.5	45.1	0.015	0.099	0.020	7.786	123845	54.9	4.034	429	17.6	18.0	48.7	0.172	2637	1822	fbmy8032_rel_221222.cza1_c24r64
5931	31324	475	3.0	108.0	41.2	0.015	0.098	0.018	7.110	126192	54.9	4.029	421	17.5	17.9	48.0	0.149	2621	1663	fbmy8032_rel_221222.cza1ps0_c24r64
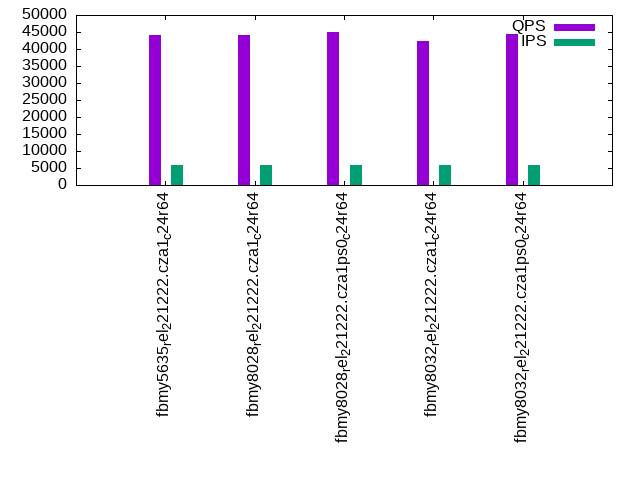
qp500.L4
qp500.L4: point queries with 500 insert/s per client. Graphs for performance per 1-second interval are here.
Average throughput:
Query response time histogram: each cell has the percentage of responses that take <= the time in the header and max is the max response time in seconds. For max values in the top 25% of the range have a red background and in the bottom 25% of the range have a green background. The red background is not used when the min value is within 80% of the max value.
| dbms | 256us | 1ms | 4ms | 16ms | 64ms | 256ms | 1s | 4s | 16s | gt | max |
|---|---|---|---|---|---|---|---|---|---|---|---|
| fbmy5635_rel_221222.cza1_c24r64 | 58.894 | 41.087 | 0.019 | nonzero | nonzero | 0.032 | |||||
| fbmy8028_rel_221222.cza1_c24r64 | 59.199 | 40.788 | 0.012 | nonzero | 0.011 | ||||||
| fbmy8028_rel_221222.cza1ps0_c24r64 | 67.994 | 31.981 | 0.024 | 0.001 | nonzero | 0.016 | |||||
| fbmy8032_rel_221222.cza1_c24r64 | 46.125 | 53.838 | 0.036 | 0.001 | 0.012 | ||||||
| fbmy8032_rel_221222.cza1ps0_c24r64 | 63.853 | 36.124 | 0.023 | nonzero | nonzero | 0.020 |
Insert response time histogram: each cell has the percentage of responses that take <= the time in the header and max is the max response time in seconds. For max values in the top 25% of the range have a red background and in the bottom 25% of the range have a green background. The red background is not used when the min value is within 80% of the max value.
| dbms | 256us | 1ms | 4ms | 16ms | 64ms | 256ms | 1s | 4s | 16s | gt | max |
|---|---|---|---|---|---|---|---|---|---|---|---|
| fbmy5635_rel_221222.cza1_c24r64 | 0.022 | 41.058 | 58.891 | 0.029 | 0.020 | ||||||
| fbmy8028_rel_221222.cza1_c24r64 | 84.597 | 15.396 | 0.008 | 0.019 | |||||||
| fbmy8028_rel_221222.cza1ps0_c24r64 | 36.962 | 62.979 | 0.058 | 0.028 | |||||||
| fbmy8032_rel_221222.cza1_c24r64 | 32.511 | 67.451 | 0.037 | 0.025 | |||||||
| fbmy8032_rel_221222.cza1ps0_c24r64 | 56.320 | 43.652 | 0.028 | 0.054 |
Delete response time histogram: each cell has the percentage of responses that take <= the time in the header and max is the max response time in seconds. For max values in the top 25% of the range have a red background and in the bottom 25% of the range have a green background. The red background is not used when the min value is within 80% of the max value.
| dbms | 256us | 1ms | 4ms | 16ms | 64ms | 256ms | 1s | 4s | 16s | gt | max |
|---|---|---|---|---|---|---|---|---|---|---|---|
| fbmy5635_rel_221222.cza1_c24r64 | 0.264 | 43.710 | 55.992 | 0.033 | 0.001 | 0.165 | |||||
| fbmy8028_rel_221222.cza1_c24r64 | 0.103 | 86.186 | 13.701 | 0.008 | 0.001 | 0.137 | |||||
| fbmy8028_rel_221222.cza1ps0_c24r64 | 0.016 | 39.678 | 60.251 | 0.055 | 0.030 | ||||||
| fbmy8032_rel_221222.cza1_c24r64 | 34.455 | 65.515 | 0.028 | 0.001 | 0.161 | ||||||
| fbmy8032_rel_221222.cza1ps0_c24r64 | 0.010 | 58.433 | 41.530 | 0.028 | 0.051 |
Performance metrics for the DBMS listed above. Some are normalized by throughput, others are not. Legend for results is here.
ips	qps	rps	rmbps	wps	wmbps	rpq	rkbpq	wpi	wkbpi	csps	cpups	cspq	cpupq	dbgb1	dbgb2	rss	maxop	p50	p99	tag
5936	43996	494	2.9	140.9	46.8	0.011	0.067	0.024	8.068	253586	54.3	5.764	296	17.4	19.3	47.3	0.032	3660	3326	fbmy5635_rel_221222.cza1_c24r64
5931	44034	474	2.7	124.2	47.1	0.011	0.064	0.021	8.124	243869	54.9	5.538	299	17.4	19.4	49.1	0.011	3660	3181	fbmy8028_rel_221222.cza1_c24r64
5936	45133	502	2.9	123.4	47.0	0.011	0.067	0.021	8.106	258461	54.4	5.727	289	17.4	19.4	48.6	0.016	3741	3244	fbmy8028_rel_221222.cza1ps0_c24r64
5931	42339	496	2.9	124.8	47.9	0.012	0.071	0.021	8.263	233708	55.1	5.520	312	17.6	19.6	49.3	0.012	3532	3149	fbmy8032_rel_221222.cza1_c24r64
5936	44545	495	2.9	112.1	42.9	0.011	0.067	0.019	7.408	254790	54.6	5.720	294	18.0	20.0	48.8	0.020	3740	3324	fbmy8032_rel_221222.cza1ps0_c24r64
qr1000.L5
qr1000.L5: range queries with 1000 insert/s per client. Graphs for performance per 1-second interval are here.
Average throughput:
Query response time histogram: each cell has the percentage of responses that take <= the time in the header and max is the max response time in seconds. For max values in the top 25% of the range have a red background and in the bottom 25% of the range have a green background. The red background is not used when the min value is within 80% of the max value.
| dbms | 256us | 1ms | 4ms | 16ms | 64ms | 256ms | 1s | 4s | 16s | gt | max |
|---|---|---|---|---|---|---|---|---|---|---|---|
| fbmy5635_rel_221222.cza1_c24r64 | 57.686 | 30.007 | 12.304 | 0.002 | nonzero | nonzero | 0.163 | ||||
| fbmy8028_rel_221222.cza1_c24r64 | 58.648 | 35.765 | 5.585 | 0.002 | nonzero | nonzero | 0.108 | ||||
| fbmy8028_rel_221222.cza1ps0_c24r64 | 61.536 | 31.810 | 6.652 | 0.002 | nonzero | nonzero | 0.136 | ||||
| fbmy8032_rel_221222.cza1_c24r64 | 63.261 | 30.695 | 6.042 | 0.002 | nonzero | nonzero | 0.103 | ||||
| fbmy8032_rel_221222.cza1ps0_c24r64 | 65.191 | 29.945 | 4.862 | 0.001 | nonzero | nonzero | 0.158 |
Insert response time histogram: each cell has the percentage of responses that take <= the time in the header and max is the max response time in seconds. For max values in the top 25% of the range have a red background and in the bottom 25% of the range have a green background. The red background is not used when the min value is within 80% of the max value.
| dbms | 256us | 1ms | 4ms | 16ms | 64ms | 256ms | 1s | 4s | 16s | gt | max |
|---|---|---|---|---|---|---|---|---|---|---|---|
| fbmy5635_rel_221222.cza1_c24r64 | 0.017 | 10.484 | 87.255 | 2.244 | 0.050 | ||||||
| fbmy8028_rel_221222.cza1_c24r64 | 14.127 | 85.089 | 0.784 | 0.049 | |||||||
| fbmy8028_rel_221222.cza1ps0_c24r64 | 17.619 | 81.854 | 0.527 | 0.043 | |||||||
| fbmy8032_rel_221222.cza1_c24r64 | 17.976 | 81.480 | 0.544 | 0.042 | |||||||
| fbmy8032_rel_221222.cza1ps0_c24r64 | 14.302 | 85.048 | 0.650 | 0.034 |
Delete response time histogram: each cell has the percentage of responses that take <= the time in the header and max is the max response time in seconds. For max values in the top 25% of the range have a red background and in the bottom 25% of the range have a green background. The red background is not used when the min value is within 80% of the max value.
| dbms | 256us | 1ms | 4ms | 16ms | 64ms | 256ms | 1s | 4s | 16s | gt | max |
|---|---|---|---|---|---|---|---|---|---|---|---|
| fbmy5635_rel_221222.cza1_c24r64 | 0.083 | 10.793 | 86.992 | 2.131 | 0.001 | 0.089 | |||||
| fbmy8028_rel_221222.cza1_c24r64 | 0.003 | 15.353 | 83.884 | 0.759 | nonzero | 0.103 | |||||
| fbmy8028_rel_221222.cza1ps0_c24r64 | 0.008 | 18.837 | 80.672 | 0.483 | nonzero | 0.091 | |||||
| fbmy8032_rel_221222.cza1_c24r64 | 19.106 | 80.364 | 0.530 | 0.001 | 0.101 | ||||||
| fbmy8032_rel_221222.cza1ps0_c24r64 | nonzero | 15.320 | 84.062 | 0.618 | nonzero | 0.080 |
Performance metrics for the DBMS listed above. Some are normalized by throughput, others are not. Legend for results is here.
ips	qps	rps	rmbps	wps	wmbps	rpq	rkbpq	wpi	wkbpi	csps	cpups	cspq	cpupq	dbgb1	dbgb2	rss	maxop	p50	p99	tag
11871	25681	968	5.6	154.3	50.5	0.038	0.225	0.013	4.356	108291	57.0	4.217	533	17.5	18.5	46.9	0.163	2078	1503	fbmy5635_rel_221222.cza1_c24r64
11881	29509	846	5.2	137.2	49.7	0.029	0.179	0.012	4.281	123024	57.4	4.169	467	17.6	18.8	47.0	0.108	2621	2062	fbmy8028_rel_221222.cza1_c24r64
11871	29401	842	5.0	140.3	49.9	0.029	0.175	0.012	4.303	122933	57.1	4.181	466	17.5	18.7	47.2	0.136	2301	1854	fbmy8028_rel_221222.cza1ps0_c24r64
11871	30277	912	5.5	137.3	50.2	0.030	0.186	0.012	4.333	125547	57.6	4.147	457	17.5	18.6	47.2	0.103	2637	1919	fbmy8032_rel_221222.cza1_c24r64
11881	31845	939	5.6	125.6	45.4	0.029	0.181	0.011	3.911	131114	57.4	4.117	433	17.5	18.7	47.3	0.158	2445	1919	fbmy8032_rel_221222.cza1ps0_c24r64
qp1000.L6
qp1000.L6: point queries with 1000 insert/s per client. Graphs for performance per 1-second interval are here.
Average throughput:
Query response time histogram: each cell has the percentage of responses that take <= the time in the header and max is the max response time in seconds. For max values in the top 25% of the range have a red background and in the bottom 25% of the range have a green background. The red background is not used when the min value is within 80% of the max value.
| dbms | 256us | 1ms | 4ms | 16ms | 64ms | 256ms | 1s | 4s | 16s | gt | max |
|---|---|---|---|---|---|---|---|---|---|---|---|
| fbmy5635_rel_221222.cza1_c24r64 | 45.927 | 53.971 | 0.099 | 0.002 | nonzero | 0.021 | |||||
| fbmy8028_rel_221222.cza1_c24r64 | 50.319 | 49.575 | 0.105 | 0.001 | 0.016 | ||||||
| fbmy8028_rel_221222.cza1ps0_c24r64 | 59.998 | 39.885 | 0.115 | 0.001 | nonzero | 0.024 | |||||
| fbmy8032_rel_221222.cza1_c24r64 | 35.192 | 64.692 | 0.115 | 0.001 | nonzero | 0.018 | |||||
| fbmy8032_rel_221222.cza1ps0_c24r64 | 56.174 | 43.737 | 0.088 | 0.001 | nonzero | 0.024 |
Insert response time histogram: each cell has the percentage of responses that take <= the time in the header and max is the max response time in seconds. For max values in the top 25% of the range have a red background and in the bottom 25% of the range have a green background. The red background is not used when the min value is within 80% of the max value.
| dbms | 256us | 1ms | 4ms | 16ms | 64ms | 256ms | 1s | 4s | 16s | gt | max |
|---|---|---|---|---|---|---|---|---|---|---|---|
| fbmy5635_rel_221222.cza1_c24r64 | 0.001 | 14.722 | 84.993 | 0.285 | 0.058 | ||||||
| fbmy8028_rel_221222.cza1_c24r64 | 22.896 | 76.925 | 0.179 | 0.042 | |||||||
| fbmy8028_rel_221222.cza1ps0_c24r64 | 15.070 | 84.673 | 0.257 | 0.044 | |||||||
| fbmy8032_rel_221222.cza1_c24r64 | 23.132 | 76.703 | 0.165 | 0.035 | |||||||
| fbmy8032_rel_221222.cza1ps0_c24r64 | 27.866 | 72.041 | 0.093 | 0.055 |
Delete response time histogram: each cell has the percentage of responses that take <= the time in the header and max is the max response time in seconds. For max values in the top 25% of the range have a red background and in the bottom 25% of the range have a green background. The red background is not used when the min value is within 80% of the max value.
| dbms | 256us | 1ms | 4ms | 16ms | 64ms | 256ms | 1s | 4s | 16s | gt | max |
|---|---|---|---|---|---|---|---|---|---|---|---|
| fbmy5635_rel_221222.cza1_c24r64 | 0.018 | 16.072 | 83.634 | 0.274 | 0.002 | 0.110 | |||||
| fbmy8028_rel_221222.cza1_c24r64 | 0.003 | 24.636 | 75.184 | 0.177 | 0.048 | ||||||
| fbmy8028_rel_221222.cza1ps0_c24r64 | 0.008 | 16.616 | 83.149 | 0.227 | 0.001 | 0.074 | |||||
| fbmy8032_rel_221222.cza1_c24r64 | 25.061 | 74.790 | 0.149 | nonzero | 0.079 | ||||||
| fbmy8032_rel_221222.cza1ps0_c24r64 | 0.001 | 29.992 | 69.913 | 0.094 | 0.054 |
Performance metrics for the DBMS listed above. Some are normalized by throughput, others are not. Legend for results is here.
ips	qps	rps	rmbps	wps	wmbps	rpq	rkbpq	wpi	wkbpi	csps	cpups	cspq	cpupq	dbgb1	dbgb2	rss	maxop	p50	p99	tag
11871	41805	812	4.6	154.5	50.6	0.019	0.112	0.013	4.368	254728	56.3	6.093	323	17.7	17.9	47.2	0.021	3486	3052	fbmy5635_rel_221222.cza1_c24r64
11881	42390	905	5.3	139.6	49.7	0.021	0.129	0.012	4.286	242775	56.9	5.727	322	17.8	18.2	47.5	0.016	3532	3021	fbmy8028_rel_221222.cza1_c24r64
11881	43543	904	5.3	139.9	49.3	0.021	0.125	0.012	4.251	257966	56.3	5.924	310	17.5	17.9	47.4	0.024	3644	3164	fbmy8028_rel_221222.cza1ps0_c24r64
11881	40723	854	5.0	144.2	51.3	0.021	0.127	0.012	4.420	236785	57.0	5.814	336	17.5	17.9	47.5	0.018	3404	2925	fbmy8032_rel_221222.cza1_c24r64
11871	43170	897	5.2	132.9	46.8	0.021	0.124	0.011	4.033	248827	56.4	5.764	314	17.5	17.9	47.6	0.024	3596	3102	fbmy8032_rel_221222.cza1ps0_c24r64
l.i0
l.i0: load without secondary indexes
Performance metrics for all DBMS, not just the ones listed above. Some are normalized by throughput, others are not. Legend for results is here.
ips	qps	rps	rmbps	wps	wmbps	rpq	rkbpq	wpi	wkbpi	csps	cpups	cspq	cpupq	dbgb1	dbgb2	rss	maxop	p50	p99	tag
662983	0	0	0.0	750.6	243.3	0.000	0.000	0.001	0.376	123339	68.2	0.186	25	7.0	7.5	1.9	0.214	58836	42053	fbmy5635_rel_221222.cza1_c24r64
578313	0	0	0.0	534.6	215.0	0.000	0.000	0.001	0.381	93408	68.0	0.162	28	7.0	7.7	2.4	0.210	52060	38558	fbmy8028_rel_221222.cza1_c24r64
589680	0	0	0.0	544.2	220.4	0.000	0.000	0.001	0.383	97571	68.3	0.165	28	6.9	7.7	2.1	0.193	51744	39356	fbmy8028_rel_221222.cza1ps0_c24r64
555556	0	0	0.0	510.1	204.8	0.000	0.000	0.001	0.377	88742	67.5	0.160	29	7.0	7.7	2.4	0.197	48852	35461	fbmy8032_rel_221222.cza1_c24r64
547945	0	0	0.0	548.0	222.5	0.000	0.000	0.001	0.416	96154	68.6	0.175	30	7.1	7.9	2.2	0.265	49048	34862	fbmy8032_rel_221222.cza1ps0_c24r64
l.x
l.x: create secondary indexes
Performance metrics for all DBMS, not just the ones listed above. Some are normalized by throughput, others are not. Legend for results is here.
ips	qps	rps	rmbps	wps	wmbps	rpq	rkbpq	wpi	wkbpi	csps	cpups	cspq	cpupq	dbgb1	dbgb2	rss	maxop	p50	p99	tag
1116280	0	2	0.2	568.0	173.8	0.000	0.000	0.001	0.159	2396	44.3	0.002	10	15.7	16.2	16.8	0.005	NA	NA	fbmy5635_rel_221222.cza1_c24r64
1170732	0	2	0.2	434.5	182.2	0.000	0.000	0.000	0.159	3177	45.0	0.003	9	15.6	16.4	19.6	0.007	NA	NA	fbmy8028_rel_221222.cza1_c24r64
1165049	0	2	0.2	433.2	182.0	0.000	0.000	0.000	0.160	3292	45.7	0.003	9	15.6	16.4	19.2	0.011	NA	NA	fbmy8028_rel_221222.cza1ps0_c24r64
1153847	0	2	0.2	430.6	181.6	0.000	0.000	0.000	0.161	3927	46.0	0.003	10	15.6	16.4	19.5	0.010	NA	NA	fbmy8032_rel_221222.cza1_c24r64
1188119	0	2	0.2	441.7	186.6	0.000	0.000	0.000	0.161	4033	46.2	0.003	9	15.6	16.4	19.4	0.006	NA	NA	fbmy8032_rel_221222.cza1ps0_c24r64
l.i1
l.i1: continue load after secondary indexes created with 50 inserts per transaction
Performance metrics for all DBMS, not just the ones listed above. Some are normalized by throughput, others are not. Legend for results is here.
ips	qps	rps	rmbps	wps	wmbps	rpq	rkbpq	wpi	wkbpi	csps	cpups	cspq	cpupq	dbgb1	dbgb2	rss	maxop	p50	p99	tag
37011	0	1540	8.5	325.6	107.8	0.042	0.235	0.009	2.983	34412	33.6	0.930	218	18.4	19.0	44.9	0.072	3096	2647	fbmy5635_rel_221222.cza1_c24r64
37981	0	1610	9.2	285.0	112.0	0.042	0.248	0.008	3.020	32149	38.0	0.846	240	18.1	18.9	47.0	0.122	3148	2697	fbmy8028_rel_221222.cza1_c24r64
38083	0	1614	9.2	286.0	112.5	0.042	0.248	0.008	3.024	32612	37.6	0.856	237	18.3	19.1	46.3	0.231	3196	2647	fbmy8028_rel_221222.cza1ps0_c24r64
38138	0	1731	9.9	292.6	115.1	0.045	0.266	0.008	3.089	32153	39.2	0.843	247	17.9	18.7	46.5	1.309	3196	2647	fbmy8032_rel_221222.cza1_c24r64
38156	0	1670	9.6	284.1	111.8	0.044	0.258	0.007	2.999	31985	39.3	0.838	247	18.0	18.8	46.7	0.140	3196	2647	fbmy8032_rel_221222.cza1ps0_c24r64
l.i2
l.i2: continue load after secondary indexes created with 5 inserts per transaction
Performance metrics for all DBMS, not just the ones listed above. Some are normalized by throughput, others are not. Legend for results is here.
ips	qps	rps	rmbps	wps	wmbps	rpq	rkbpq	wpi	wkbpi	csps	cpups	cspq	cpupq	dbgb1	dbgb2	rss	maxop	p50	p99	tag
28436	0	1746	9.5	254.3	84.6	0.061	0.344	0.009	3.048	196168	47.9	6.899	404	19.7	19.8	44.3	0.095	2382	1688	fbmy5635_rel_221222.cza1_c24r64
35693	0	2411	13.7	299.8	112.2	0.068	0.394	0.008	3.219	244071	53.4	6.838	359	18.0	18.3	44.4	0.147	3018	2163	fbmy8028_rel_221222.cza1_c24r64
34246	0	2346	13.4	288.3	107.1	0.069	0.400	0.008	3.204	233202	52.6	6.810	369	17.9	18.2	44.5	0.118	2897	2043	fbmy8028_rel_221222.cza1ps0_c24r64
35896	0	2351	13.4	299.1	110.5	0.066	0.382	0.008	3.153	245912	53.3	6.851	356	18.2	18.5	44.5	0.094	3022	2202	fbmy8032_rel_221222.cza1_c24r64
34712	0	2289	13.0	290.0	106.9	0.066	0.385	0.008	3.154	234333	53.2	6.751	368	19.2	19.5	44.8	0.066	2928	2053	fbmy8032_rel_221222.cza1ps0_c24r64
qr100.L1
qr100.L1: range queries with 100 insert/s per client
Performance metrics for all DBMS, not just the ones listed above. Some are normalized by throughput, others are not. Legend for results is here.
ips	qps	rps	rmbps	wps	wmbps	rpq	rkbpq	wpi	wkbpi	csps	cpups	cspq	cpupq	dbgb1	dbgb2	rss	maxop	p50	p99	tag
1187	26938	57	0.3	22.2	6.4	0.002	0.013	0.019	5.514	105453	49.3	3.915	439	17.4	17.7	44.5	0.083	2366	2030	fbmy5635_rel_221222.cza1_c24r64
1187	31796	102	0.6	26.4	9.0	0.003	0.019	0.022	7.742	124227	50.5	3.907	381	17.4	17.9	44.9	0.104	2222	1966	fbmy8028_rel_221222.cza1_c24r64
1187	30515	61	0.4	22.2	7.1	0.002	0.013	0.019	6.099	119150	49.5	3.905	389	17.4	17.9	44.8	0.071	3308	3038	fbmy8028_rel_221222.cza1ps0_c24r64
1187	31243	106	0.6	24.5	8.1	0.003	0.021	0.021	7.023	122029	50.3	3.906	386	17.3	17.8	44.9	0.093	2301	1982	fbmy8032_rel_221222.cza1_c24r64
1186	30049	96	0.6	26.4	9.1	0.003	0.021	0.022	7.855	117646	49.6	3.915	396	17.4	17.9	45.3	0.113	2047	1759	fbmy8032_rel_221222.cza1ps0_c24r64
qp100.L2
qp100.L2: point queries with 100 insert/s per client
Performance metrics for all DBMS, not just the ones listed above. Some are normalized by throughput, others are not. Legend for results is here.
ips	qps	rps	rmbps	wps	wmbps	rpq	rkbpq	wpi	wkbpi	csps	cpups	cspq	cpupq	dbgb1	dbgb2	rss	maxop	p50	p99	tag
1186	48115	902	5.4	29.3	8.9	0.019	0.116	0.025	7.710	215474	49.8	4.478	248	17.4	18.0	48.3	0.027	4123	1407	fbmy5635_rel_221222.cza1_c24r64
1187	47687	929	6.1	29.8	10.4	0.019	0.131	0.025	8.934	214451	50.4	4.497	254	17.4	18.2	48.8	0.044	4139	1454	fbmy8028_rel_221222.cza1_c24r64
1186	49542	950	6.2	26.9	9.1	0.019	0.129	0.023	7.875	222181	49.6	4.485	240	17.4	18.2	48.9	0.036	4267	1566	fbmy8028_rel_221222.cza1ps0_c24r64
1186	46082	871	5.6	27.9	9.5	0.019	0.124	0.024	8.214	206625	50.1	4.484	261	17.4	18.2	48.7	0.064	3980	1294	fbmy8032_rel_221222.cza1_c24r64
1187	48479	949	6.3	29.5	10.0	0.020	0.132	0.025	8.638	220739	49.7	4.553	246	17.4	18.2	49.1	0.056	4203	1231	fbmy8032_rel_221222.cza1ps0_c24r64
qr500.L3
qr500.L3: range queries with 500 insert/s per client
Performance metrics for all DBMS, not just the ones listed above. Some are normalized by throughput, others are not. Legend for results is here.
ips	qps	rps	rmbps	wps	wmbps	rpq	rkbpq	wpi	wkbpi	csps	cpups	cspq	cpupq	dbgb1	dbgb2	rss	maxop	p50	p99	tag
5936	27118	446	2.7	139.6	45.3	0.016	0.103	0.024	7.815	110162	54.4	4.062	481	18.4	18.7	47.0	0.192	2397	1903	fbmy5635_rel_221222.cza1_c24r64
5931	29059	487	3.1	116.5	45.7	0.017	0.108	0.020	7.889	118153	55.0	4.066	454	17.4	17.8	49.4	0.178	2829	2205	fbmy8028_rel_221222.cza1_c24r64
5936	29556	463	3.0	117.5	45.4	0.016	0.103	0.020	7.830	120046	54.6	4.062	443	18.2	18.6	48.2	0.172	2733	2254	fbmy8028_rel_221222.cza1ps0_c24r64
5936	30700	466	3.0	118.5	45.1	0.015	0.099	0.020	7.786	123845	54.9	4.034	429	17.6	18.0	48.7	0.172	2637	1822	fbmy8032_rel_221222.cza1_c24r64
5931	31324	475	3.0	108.0	41.2	0.015	0.098	0.018	7.110	126192	54.9	4.029	421	17.5	17.9	48.0	0.149	2621	1663	fbmy8032_rel_221222.cza1ps0_c24r64
qp500.L4
qp500.L4: point queries with 500 insert/s per client
Performance metrics for all DBMS, not just the ones listed above. Some are normalized by throughput, others are not. Legend for results is here.
ips	qps	rps	rmbps	wps	wmbps	rpq	rkbpq	wpi	wkbpi	csps	cpups	cspq	cpupq	dbgb1	dbgb2	rss	maxop	p50	p99	tag
5936	43996	494	2.9	140.9	46.8	0.011	0.067	0.024	8.068	253586	54.3	5.764	296	17.4	19.3	47.3	0.032	3660	3326	fbmy5635_rel_221222.cza1_c24r64
5931	44034	474	2.7	124.2	47.1	0.011	0.064	0.021	8.124	243869	54.9	5.538	299	17.4	19.4	49.1	0.011	3660	3181	fbmy8028_rel_221222.cza1_c24r64
5936	45133	502	2.9	123.4	47.0	0.011	0.067	0.021	8.106	258461	54.4	5.727	289	17.4	19.4	48.6	0.016	3741	3244	fbmy8028_rel_221222.cza1ps0_c24r64
5931	42339	496	2.9	124.8	47.9	0.012	0.071	0.021	8.263	233708	55.1	5.520	312	17.6	19.6	49.3	0.012	3532	3149	fbmy8032_rel_221222.cza1_c24r64
5936	44545	495	2.9	112.1	42.9	0.011	0.067	0.019	7.408	254790	54.6	5.720	294	18.0	20.0	48.8	0.020	3740	3324	fbmy8032_rel_221222.cza1ps0_c24r64
qr1000.L5
qr1000.L5: range queries with 1000 insert/s per client
Performance metrics for all DBMS, not just the ones listed above. Some are normalized by throughput, others are not. Legend for results is here.
ips	qps	rps	rmbps	wps	wmbps	rpq	rkbpq	wpi	wkbpi	csps	cpups	cspq	cpupq	dbgb1	dbgb2	rss	maxop	p50	p99	tag
11871	25681	968	5.6	154.3	50.5	0.038	0.225	0.013	4.356	108291	57.0	4.217	533	17.5	18.5	46.9	0.163	2078	1503	fbmy5635_rel_221222.cza1_c24r64
11881	29509	846	5.2	137.2	49.7	0.029	0.179	0.012	4.281	123024	57.4	4.169	467	17.6	18.8	47.0	0.108	2621	2062	fbmy8028_rel_221222.cza1_c24r64
11871	29401	842	5.0	140.3	49.9	0.029	0.175	0.012	4.303	122933	57.1	4.181	466	17.5	18.7	47.2	0.136	2301	1854	fbmy8028_rel_221222.cza1ps0_c24r64
11871	30277	912	5.5	137.3	50.2	0.030	0.186	0.012	4.333	125547	57.6	4.147	457	17.5	18.6	47.2	0.103	2637	1919	fbmy8032_rel_221222.cza1_c24r64
11881	31845	939	5.6	125.6	45.4	0.029	0.181	0.011	3.911	131114	57.4	4.117	433	17.5	18.7	47.3	0.158	2445	1919	fbmy8032_rel_221222.cza1ps0_c24r64
qp1000.L6
qp1000.L6: point queries with 1000 insert/s per client
Performance metrics for all DBMS, not just the ones listed above. Some are normalized by throughput, others are not. Legend for results is here.
ips	qps	rps	rmbps	wps	wmbps	rpq	rkbpq	wpi	wkbpi	csps	cpups	cspq	cpupq	dbgb1	dbgb2	rss	maxop	p50	p99	tag
11871	41805	812	4.6	154.5	50.6	0.019	0.112	0.013	4.368	254728	56.3	6.093	323	17.7	17.9	47.2	0.021	3486	3052	fbmy5635_rel_221222.cza1_c24r64
11881	42390	905	5.3	139.6	49.7	0.021	0.129	0.012	4.286	242775	56.9	5.727	322	17.8	18.2	47.5	0.016	3532	3021	fbmy8028_rel_221222.cza1_c24r64
11881	43543	904	5.3	139.9	49.3	0.021	0.125	0.012	4.251	257966	56.3	5.924	310	17.5	17.9	47.4	0.024	3644	3164	fbmy8028_rel_221222.cza1ps0_c24r64
11881	40723	854	5.0	144.2	51.3	0.021	0.127	0.012	4.420	236785	57.0	5.814	336	17.5	17.9	47.5	0.018	3404	2925	fbmy8032_rel_221222.cza1_c24r64
11871	43170	897	5.2	132.9	46.8	0.021	0.124	0.011	4.033	248827	56.4	5.764	314	17.5	17.9	47.6	0.024	3596	3102	fbmy8032_rel_221222.cza1ps0_c24r64
l.i0
- l.i0: load without secondary indexes
- Legend for results is here.
- Each entry lists the percentage of responses that fit in that bucket (slower than max time for previous bucket, faster than min time for next bucket).
Insert response time histogram
256us	1ms	4ms	16ms	64ms	256ms	1s	4s	16s	gt	max	tag
0.000	3.121	96.775	0.080	0.003	0.021	0.000	0.000	0.000	0.000	0.214	fbmy5635_rel_221222.cza1_c24r64
0.000	0.201	98.952	0.798	0.024	0.024	0.000	0.000	0.000	0.000	0.210	fbmy8028_rel_221222.cza1_c24r64
0.000	0.384	98.822	0.742	0.027	0.025	0.000	0.000	0.000	0.000	0.193	fbmy8028_rel_221222.cza1ps0_c24r64
0.000	0.044	99.076	0.831	0.026	0.022	0.000	0.000	0.000	0.000	0.197	fbmy8032_rel_221222.cza1_c24r64
0.000	0.208	98.807	0.930	0.032	0.023	0.001	0.000	0.000	0.000	0.265	fbmy8032_rel_221222.cza1ps0_c24r64
l.x
- l.x: create secondary indexes
- Legend for results is here.
- Each entry lists the percentage of responses that fit in that bucket (slower than max time for previous bucket, faster than min time for next bucket).
TODO - determine whether there is data for create index response time
l.i1
- l.i1: continue load after secondary indexes created with 50 inserts per transaction
- Legend for results is here.
- Each entry lists the percentage of responses that fit in that bucket (slower than max time for previous bucket, faster than min time for next bucket).
Insert response time histogram
256us	1ms	4ms	16ms	64ms	256ms	1s	4s	16s	gt	max	tag
0.000	nonzero	0.069	38.817	61.113	nonzero	0.000	0.000	0.000	0.000	0.072	fbmy5635_rel_221222.cza1_c24r64
0.000	0.000	0.060	47.165	52.773	0.001	0.000	0.000	0.000	0.000	0.122	fbmy8028_rel_221222.cza1_c24r64
0.000	0.000	0.057	48.245	51.697	0.001	0.000	0.000	0.000	0.000	0.231	fbmy8028_rel_221222.cza1ps0_c24r64
0.000	0.000	0.070	48.654	51.274	0.001	0.000	nonzero	0.000	0.000	1.309	fbmy8032_rel_221222.cza1_c24r64
0.000	nonzero	0.065	48.325	51.609	0.001	0.000	0.000	0.000	0.000	0.140	fbmy8032_rel_221222.cza1ps0_c24r64
Delete response time histogram
256us	1ms	4ms	16ms	64ms	256ms	1s	4s	16s	gt	max	tag
0.000	0.000	0.069	54.736	45.191	0.004	0.000	0.000	0.000	0.000	0.192	fbmy5635_rel_221222.cza1_c24r64
0.000	0.000	0.097	49.856	50.045	0.002	0.000	0.000	0.000	0.000	0.130	fbmy8028_rel_221222.cza1_c24r64
0.000	0.000	0.092	50.953	48.952	0.003	0.000	0.000	0.000	0.000	0.231	fbmy8028_rel_221222.cza1ps0_c24r64
0.000	0.000	0.102	50.819	49.076	0.003	0.000	nonzero	0.000	0.000	1.307	fbmy8032_rel_221222.cza1_c24r64
0.000	0.000	0.101	50.725	49.171	0.002	0.000	0.000	0.000	0.000	0.203	fbmy8032_rel_221222.cza1ps0_c24r64
l.i2
- l.i2: continue load after secondary indexes created with 5 inserts per transaction
- Legend for results is here.
- Each entry lists the percentage of responses that fit in that bucket (slower than max time for previous bucket, faster than min time for next bucket).
Insert response time histogram
256us	1ms	4ms	16ms	64ms	256ms	1s	4s	16s	gt	max	tag
0.012	3.606	96.329	0.049	0.004	nonzero	0.000	0.000	0.000	0.000	0.095	fbmy5635_rel_221222.cza1_c24r64
0.000	5.874	94.028	0.088	0.010	nonzero	0.000	0.000	0.000	0.000	0.147	fbmy8028_rel_221222.cza1_c24r64
0.000	5.044	94.847	0.099	0.010	nonzero	0.000	0.000	0.000	0.000	0.118	fbmy8028_rel_221222.cza1ps0_c24r64
0.000	5.998	93.908	0.086	0.009	nonzero	0.000	0.000	0.000	0.000	0.094	fbmy8032_rel_221222.cza1_c24r64
0.000	5.281	94.590	0.119	0.010	nonzero	0.000	0.000	0.000	0.000	0.066	fbmy8032_rel_221222.cza1ps0_c24r64
Delete response time histogram
256us	1ms	4ms	16ms	64ms	256ms	1s	4s	16s	gt	max	tag
0.001	2.592	97.302	0.099	0.006	0.001	0.000	0.000	0.000	0.000	0.100	fbmy5635_rel_221222.cza1_c24r64
0.000	3.846	96.038	0.106	0.010	nonzero	0.000	0.000	0.000	0.000	0.155	fbmy8028_rel_221222.cza1_c24r64
0.000	3.292	96.569	0.128	0.011	nonzero	0.000	0.000	0.000	0.000	0.148	fbmy8028_rel_221222.cza1ps0_c24r64
0.000	3.922	95.965	0.103	0.009	nonzero	0.000	0.000	0.000	0.000	0.092	fbmy8032_rel_221222.cza1_c24r64
0.000	3.480	96.361	0.148	0.011	nonzero	0.000	0.000	0.000	0.000	0.098	fbmy8032_rel_221222.cza1ps0_c24r64
qr100.L1
- qr100.L1: range queries with 100 insert/s per client
- Legend for results is here.
- Each entry lists the percentage of responses that fit in that bucket (slower than max time for previous bucket, faster than min time for next bucket).
Query response time histogram
256us	1ms	4ms	16ms	64ms	256ms	1s	4s	16s	gt	max	tag
62.007	27.478	10.514	nonzero	nonzero	nonzero	0.000	0.000	0.000	0.000	0.083	fbmy5635_rel_221222.cza1_c24r64
64.531	31.165	4.303	nonzero	nonzero	nonzero	0.000	0.000	0.000	0.000	0.104	fbmy8028_rel_221222.cza1_c24r64
64.787	28.566	6.646	nonzero	nonzero	nonzero	0.000	0.000	0.000	0.000	0.071	fbmy8028_rel_221222.cza1ps0_c24r64
65.488	29.424	5.087	nonzero	nonzero	nonzero	0.000	0.000	0.000	0.000	0.093	fbmy8032_rel_221222.cza1_c24r64
66.184	26.193	7.622	nonzero	nonzero	nonzero	0.000	0.000	0.000	0.000	0.113	fbmy8032_rel_221222.cza1ps0_c24r64
Insert response time histogram
256us	1ms	4ms	16ms	64ms	256ms	1s	4s	16s	gt	max	tag
0.000	0.632	91.851	7.503	0.014	0.000	0.000	0.000	0.000	0.000	0.024	fbmy5635_rel_221222.cza1_c24r64
0.000	0.000	96.087	3.910	0.003	0.000	0.000	0.000	0.000	0.000	0.028	fbmy8028_rel_221222.cza1_c24r64
0.000	0.003	95.556	4.441	0.000	0.000	0.000	0.000	0.000	0.000	0.007	fbmy8028_rel_221222.cza1ps0_c24r64
0.000	0.000	95.382	4.618	0.000	0.000	0.000	0.000	0.000	0.000	0.008	fbmy8032_rel_221222.cza1_c24r64
0.000	0.000	96.351	3.649	0.000	0.000	0.000	0.000	0.000	0.000	0.008	fbmy8032_rel_221222.cza1ps0_c24r64
Delete response time histogram
256us	1ms	4ms	16ms	64ms	256ms	1s	4s	16s	gt	max	tag
0.000	1.753	92.062	6.167	0.017	0.000	0.000	0.000	0.000	0.000	0.053	fbmy5635_rel_221222.cza1_c24r64
0.000	0.163	98.219	1.615	0.003	0.000	0.000	0.000	0.000	0.000	0.024	fbmy8028_rel_221222.cza1_c24r64
0.000	0.413	97.219	2.368	0.000	0.000	0.000	0.000	0.000	0.000	0.008	fbmy8028_rel_221222.cza1ps0_c24r64
0.000	0.017	97.632	2.347	0.000	0.003	0.000	0.000	0.000	0.000	0.141	fbmy8032_rel_221222.cza1_c24r64
0.000	0.122	98.128	1.747	0.003	0.000	0.000	0.000	0.000	0.000	0.025	fbmy8032_rel_221222.cza1ps0_c24r64
qp100.L2
- qp100.L2: point queries with 100 insert/s per client
- Legend for results is here.
- Each entry lists the percentage of responses that fit in that bucket (slower than max time for previous bucket, faster than min time for next bucket).
Query response time histogram
256us	1ms	4ms	16ms	64ms	256ms	1s	4s	16s	gt	max	tag
84.447	15.490	0.060	0.004	nonzero	0.000	0.000	0.000	0.000	0.000	0.027	fbmy5635_rel_221222.cza1_c24r64
83.835	16.092	0.065	0.007	0.001	0.000	0.000	0.000	0.000	0.000	0.044	fbmy8028_rel_221222.cza1_c24r64
88.387	11.555	0.052	0.006	0.001	0.000	0.000	0.000	0.000	0.000	0.036	fbmy8028_rel_221222.cza1ps0_c24r64
78.631	21.293	0.065	0.010	0.001	0.000	0.000	0.000	0.000	0.000	0.064	fbmy8032_rel_221222.cza1_c24r64
86.001	13.920	0.068	0.009	0.001	0.000	0.000	0.000	0.000	0.000	0.056	fbmy8032_rel_221222.cza1ps0_c24r64
Insert response time histogram
256us	1ms	4ms	16ms	64ms	256ms	1s	4s	16s	gt	max	tag
0.000	0.892	98.590	0.486	0.031	0.000	0.000	0.000	0.000	0.000	0.058	fbmy5635_rel_221222.cza1_c24r64
0.000	0.000	93.260	6.733	0.007	0.000	0.000	0.000	0.000	0.000	0.017	fbmy8028_rel_221222.cza1_c24r64
0.000	0.000	99.542	0.451	0.007	0.000	0.000	0.000	0.000	0.000	0.025	fbmy8028_rel_221222.cza1ps0_c24r64
0.000	0.000	91.503	8.483	0.014	0.000	0.000	0.000	0.000	0.000	0.053	fbmy8032_rel_221222.cza1_c24r64
0.000	0.000	98.434	1.559	0.007	0.000	0.000	0.000	0.000	0.000	0.020	fbmy8032_rel_221222.cza1ps0_c24r64
Delete response time histogram
256us	1ms	4ms	16ms	64ms	256ms	1s	4s	16s	gt	max	tag
0.000	3.368	96.306	0.292	0.035	0.000	0.000	0.000	0.000	0.000	0.057	fbmy5635_rel_221222.cza1_c24r64
0.000	0.472	94.524	5.003	0.000	0.000	0.000	0.000	0.000	0.000	0.014	fbmy8028_rel_221222.cza1_c24r64
0.000	1.649	98.073	0.274	0.003	0.000	0.000	0.000	0.000	0.000	0.019	fbmy8028_rel_221222.cza1ps0_c24r64
0.000	0.003	92.944	7.045	0.007	0.000	0.000	0.000	0.000	0.000	0.025	fbmy8032_rel_221222.cza1_c24r64
0.000	0.090	98.889	1.014	0.007	0.000	0.000	0.000	0.000	0.000	0.020	fbmy8032_rel_221222.cza1ps0_c24r64
qr500.L3
- qr500.L3: range queries with 500 insert/s per client
- Legend for results is here.
- Each entry lists the percentage of responses that fit in that bucket (slower than max time for previous bucket, faster than min time for next bucket).
Query response time histogram
256us	1ms	4ms	16ms	64ms	256ms	1s	4s	16s	gt	max	tag
60.881	28.884	10.229	0.004	0.002	nonzero	0.000	0.000	0.000	0.000	0.192	fbmy5635_rel_221222.cza1_c24r64
60.511	32.950	6.535	0.002	0.002	nonzero	0.000	0.000	0.000	0.000	0.178	fbmy8028_rel_221222.cza1_c24r64
63.204	30.806	5.985	0.002	0.002	nonzero	0.000	0.000	0.000	0.000	0.172	fbmy8028_rel_221222.cza1ps0_c24r64
64.715	29.391	5.891	0.002	0.002	nonzero	0.000	0.000	0.000	0.000	0.172	fbmy8032_rel_221222.cza1_c24r64
65.700	27.428	6.869	0.002	0.002	nonzero	0.000	0.000	0.000	0.000	0.149	fbmy8032_rel_221222.cza1ps0_c24r64
Insert response time histogram
256us	1ms	4ms	16ms	64ms	256ms	1s	4s	16s	gt	max	tag
0.000	0.618	20.858	77.487	1.037	0.000	0.000	0.000	0.000	0.000	0.044	fbmy5635_rel_221222.cza1_c24r64
0.000	0.000	21.370	77.947	0.683	0.000	0.000	0.000	0.000	0.000	0.028	fbmy8028_rel_221222.cza1_c24r64
0.000	0.000	28.217	71.369	0.415	0.000	0.000	0.000	0.000	0.000	0.032	fbmy8028_rel_221222.cza1ps0_c24r64
0.000	0.000	26.165	73.456	0.380	0.000	0.000	0.000	0.000	0.000	0.028	fbmy8032_rel_221222.cza1_c24r64
0.000	0.000	17.040	81.868	1.092	0.000	0.000	0.000	0.000	0.000	0.038	fbmy8032_rel_221222.cza1ps0_c24r64
Delete response time histogram
256us	1ms	4ms	16ms	64ms	256ms	1s	4s	16s	gt	max	tag
0.000	1.484	20.892	76.658	0.966	0.000	0.000	0.000	0.000	0.000	0.042	fbmy5635_rel_221222.cza1_c24r64
0.000	0.008	22.894	76.453	0.643	0.001	0.000	0.000	0.000	0.000	0.191	fbmy8028_rel_221222.cza1_c24r64
0.000	0.045	30.321	69.229	0.405	0.000	0.000	0.000	0.000	0.000	0.028	fbmy8028_rel_221222.cza1ps0_c24r64
0.000	0.000	27.961	71.671	0.367	0.001	0.000	0.000	0.000	0.000	0.140	fbmy8032_rel_221222.cza1_c24r64
0.000	0.001	18.182	80.781	1.036	0.000	0.000	0.000	0.000	0.000	0.036	fbmy8032_rel_221222.cza1ps0_c24r64
qp500.L4
- qp500.L4: point queries with 500 insert/s per client
- Legend for results is here.
- Each entry lists the percentage of responses that fit in that bucket (slower than max time for previous bucket, faster than min time for next bucket).
Query response time histogram
256us	1ms	4ms	16ms	64ms	256ms	1s	4s	16s	gt	max	tag
58.894	41.087	0.019	nonzero	nonzero	0.000	0.000	0.000	0.000	0.000	0.032	fbmy5635_rel_221222.cza1_c24r64
59.199	40.788	0.012	nonzero	0.000	0.000	0.000	0.000	0.000	0.000	0.011	fbmy8028_rel_221222.cza1_c24r64
67.994	31.981	0.024	0.001	nonzero	0.000	0.000	0.000	0.000	0.000	0.016	fbmy8028_rel_221222.cza1ps0_c24r64
46.125	53.838	0.036	0.001	0.000	0.000	0.000	0.000	0.000	0.000	0.012	fbmy8032_rel_221222.cza1_c24r64
63.853	36.124	0.023	nonzero	nonzero	0.000	0.000	0.000	0.000	0.000	0.020	fbmy8032_rel_221222.cza1ps0_c24r64
Insert response time histogram
256us	1ms	4ms	16ms	64ms	256ms	1s	4s	16s	gt	max	tag
0.000	0.022	41.058	58.891	0.029	0.000	0.000	0.000	0.000	0.000	0.020	fbmy5635_rel_221222.cza1_c24r64
0.000	0.000	84.597	15.396	0.008	0.000	0.000	0.000	0.000	0.000	0.019	fbmy8028_rel_221222.cza1_c24r64
0.000	0.000	36.962	62.979	0.058	0.000	0.000	0.000	0.000	0.000	0.028	fbmy8028_rel_221222.cza1ps0_c24r64
0.000	0.000	32.511	67.451	0.037	0.000	0.000	0.000	0.000	0.000	0.025	fbmy8032_rel_221222.cza1_c24r64
0.000	0.000	56.320	43.652	0.028	0.000	0.000	0.000	0.000	0.000	0.054	fbmy8032_rel_221222.cza1ps0_c24r64
Delete response time histogram
256us	1ms	4ms	16ms	64ms	256ms	1s	4s	16s	gt	max	tag
0.000	0.264	43.710	55.992	0.033	0.001	0.000	0.000	0.000	0.000	0.165	fbmy5635_rel_221222.cza1_c24r64
0.000	0.103	86.186	13.701	0.008	0.001	0.000	0.000	0.000	0.000	0.137	fbmy8028_rel_221222.cza1_c24r64
0.000	0.016	39.678	60.251	0.055	0.000	0.000	0.000	0.000	0.000	0.030	fbmy8028_rel_221222.cza1ps0_c24r64
0.000	0.000	34.455	65.515	0.028	0.001	0.000	0.000	0.000	0.000	0.161	fbmy8032_rel_221222.cza1_c24r64
0.000	0.010	58.433	41.530	0.028	0.000	0.000	0.000	0.000	0.000	0.051	fbmy8032_rel_221222.cza1ps0_c24r64
qr1000.L5
- qr1000.L5: range queries with 1000 insert/s per client
- Legend for results is here.
- Each entry lists the percentage of responses that fit in that bucket (slower than max time for previous bucket, faster than min time for next bucket).
Query response time histogram
256us	1ms	4ms	16ms	64ms	256ms	1s	4s	16s	gt	max	tag
57.686	30.007	12.304	0.002	nonzero	nonzero	0.000	0.000	0.000	0.000	0.163	fbmy5635_rel_221222.cza1_c24r64
58.648	35.765	5.585	0.002	nonzero	nonzero	0.000	0.000	0.000	0.000	0.108	fbmy8028_rel_221222.cza1_c24r64
61.536	31.810	6.652	0.002	nonzero	nonzero	0.000	0.000	0.000	0.000	0.136	fbmy8028_rel_221222.cza1ps0_c24r64
63.261	30.695	6.042	0.002	nonzero	nonzero	0.000	0.000	0.000	0.000	0.103	fbmy8032_rel_221222.cza1_c24r64
65.191	29.945	4.862	0.001	nonzero	nonzero	0.000	0.000	0.000	0.000	0.158	fbmy8032_rel_221222.cza1ps0_c24r64
Insert response time histogram
256us	1ms	4ms	16ms	64ms	256ms	1s	4s	16s	gt	max	tag
0.000	0.017	10.484	87.255	2.244	0.000	0.000	0.000	0.000	0.000	0.050	fbmy5635_rel_221222.cza1_c24r64
0.000	0.000	14.127	85.089	0.784	0.000	0.000	0.000	0.000	0.000	0.049	fbmy8028_rel_221222.cza1_c24r64
0.000	0.000	17.619	81.854	0.527	0.000	0.000	0.000	0.000	0.000	0.043	fbmy8028_rel_221222.cza1ps0_c24r64
0.000	0.000	17.976	81.480	0.544	0.000	0.000	0.000	0.000	0.000	0.042	fbmy8032_rel_221222.cza1_c24r64
0.000	0.000	14.302	85.048	0.650	0.000	0.000	0.000	0.000	0.000	0.034	fbmy8032_rel_221222.cza1ps0_c24r64
Delete response time histogram
256us	1ms	4ms	16ms	64ms	256ms	1s	4s	16s	gt	max	tag
0.000	0.083	10.793	86.992	2.131	0.001	0.000	0.000	0.000	0.000	0.089	fbmy5635_rel_221222.cza1_c24r64
0.000	0.003	15.353	83.884	0.759	nonzero	0.000	0.000	0.000	0.000	0.103	fbmy8028_rel_221222.cza1_c24r64
0.000	0.008	18.837	80.672	0.483	nonzero	0.000	0.000	0.000	0.000	0.091	fbmy8028_rel_221222.cza1ps0_c24r64
0.000	0.000	19.106	80.364	0.530	0.001	0.000	0.000	0.000	0.000	0.101	fbmy8032_rel_221222.cza1_c24r64
0.000	nonzero	15.320	84.062	0.618	nonzero	0.000	0.000	0.000	0.000	0.080	fbmy8032_rel_221222.cza1ps0_c24r64
qp1000.L6
- qp1000.L6: point queries with 1000 insert/s per client
- Legend for results is here.
- Each entry lists the percentage of responses that fit in that bucket (slower than max time for previous bucket, faster than min time for next bucket).
Query response time histogram
256us	1ms	4ms	16ms	64ms	256ms	1s	4s	16s	gt	max	tag
45.927	53.971	0.099	0.002	nonzero	0.000	0.000	0.000	0.000	0.000	0.021	fbmy5635_rel_221222.cza1_c24r64
50.319	49.575	0.105	0.001	0.000	0.000	0.000	0.000	0.000	0.000	0.016	fbmy8028_rel_221222.cza1_c24r64
59.998	39.885	0.115	0.001	nonzero	0.000	0.000	0.000	0.000	0.000	0.024	fbmy8028_rel_221222.cza1ps0_c24r64
35.192	64.692	0.115	0.001	nonzero	0.000	0.000	0.000	0.000	0.000	0.018	fbmy8032_rel_221222.cza1_c24r64
56.174	43.737	0.088	0.001	nonzero	0.000	0.000	0.000	0.000	0.000	0.024	fbmy8032_rel_221222.cza1ps0_c24r64
Insert response time histogram
256us	1ms	4ms	16ms	64ms	256ms	1s	4s	16s	gt	max	tag
0.000	0.001	14.722	84.993	0.285	0.000	0.000	0.000	0.000	0.000	0.058	fbmy5635_rel_221222.cza1_c24r64
0.000	0.000	22.896	76.925	0.179	0.000	0.000	0.000	0.000	0.000	0.042	fbmy8028_rel_221222.cza1_c24r64
0.000	0.000	15.070	84.673	0.257	0.000	0.000	0.000	0.000	0.000	0.044	fbmy8028_rel_221222.cza1ps0_c24r64
0.000	0.000	23.132	76.703	0.165	0.000	0.000	0.000	0.000	0.000	0.035	fbmy8032_rel_221222.cza1_c24r64
0.000	0.000	27.866	72.041	0.093	0.000	0.000	0.000	0.000	0.000	0.055	fbmy8032_rel_221222.cza1ps0_c24r64
Delete response time histogram
256us	1ms	4ms	16ms	64ms	256ms	1s	4s	16s	gt	max	tag
0.000	0.018	16.072	83.634	0.274	0.002	0.000	0.000	0.000	0.000	0.110	fbmy5635_rel_221222.cza1_c24r64
0.000	0.003	24.636	75.184	0.177	0.000	0.000	0.000	0.000	0.000	0.048	fbmy8028_rel_221222.cza1_c24r64
0.000	0.008	16.616	83.149	0.227	0.001	0.000	0.000	0.000	0.000	0.074	fbmy8028_rel_221222.cza1ps0_c24r64
0.000	0.000	25.061	74.790	0.149	nonzero	0.000	0.000	0.000	0.000	0.079	fbmy8032_rel_221222.cza1_c24r64
0.000	0.001	29.992	69.913	0.094	0.000	0.000	0.000	0.000	0.000	0.054	fbmy8032_rel_221222.cza1ps0_c24r64