Introduction
This is a report for the insert benchmark with 480M docs and 24 client(s). It is generated by scripts (bash, awk, sed) and Tufte might not be impressed. An overview of the insert benchmark is here and a short update is here. Below, by DBMS, I mean DBMS+version.config. An example is my8020.c10b40 where my means MySQL, 8020 is version 8.0.20 and c10b40 is the name for the configuration file.
The test server has 40 cores, 80 HW threads (hyperthreads enabled), 256G RAM and many TB of fast NVMe SSD with XFS and SW RAID 0. The benchmark was run with 24 clients and there were 1 or 3 connections per client (1 for queries or inserts without rate limits, 1+1 for rate limited inserts+deletes). It uses 1 table per client. It loads 20M rows per table without secondary indexes, creates 3 secondary indexes per table, then inserts 50m+50m rows per table with a delete per insert to avoid growing the table. It then does 6 read+write tests for 3600s each that do queries as fast as possible with 100,100,500,500,1000,1000 inserts/s and the same for deletes/s per client concurrent with the queries. The database is cached in memory. Clients and the DBMS share one server. The per-database configs are in the per-database subdirectories here.
The tested DBMS are:
- fbmy5635_20231221.cy9d1_u - MyRocks 5.6.35 compiled with clang on Dec 21, 2023 at git hash 4f3a57a1, RocksDB 8.7.0 at git hash 29005f0b, cy9d1_u config
- fbmy8028_20231221.cy9d1_u - MyRocks 8.0.28 compiled with clang on Dec 22, 2023 at git hash 2ad105fc, RocksDB 8.7.0 at git hash 29005f0b, cy9d1_u config
- fbmy8028_20231221.cy9d2_u - MyRocks 8.0.28 compiled with clang on Dec 22, 2023 at git hash 2ad105fc, RocksDB 8.7.0 at git hash 29005f0b, cy9d2_u config that disables perf schema
- fbmy8032_20231221.cy9d1_u - MyRocks 8.0.32 compiled with clang on Dec 22, 2023 at git hash 76707b44, RocksDB 8.7.0 at git hash 29005f0b, cy9d1_u config
- fbmy8032_20231221.cy9d2_u - MyRocks 8.0.32 compiled with clang on Dec 22, 2023 at git hash 76707b44, RocksDB 8.7.0 at git hash 29005f0b, cy9d2_u config that disables perf schema
Contents
- Summary
- l.i0: load without secondary indexes
- l.x: create secondary indexes
- l.i1: continue load after secondary indexes created with 50 inserts per transaction
- l.i2: continue load after secondary indexes created with 5 inserts per transaction
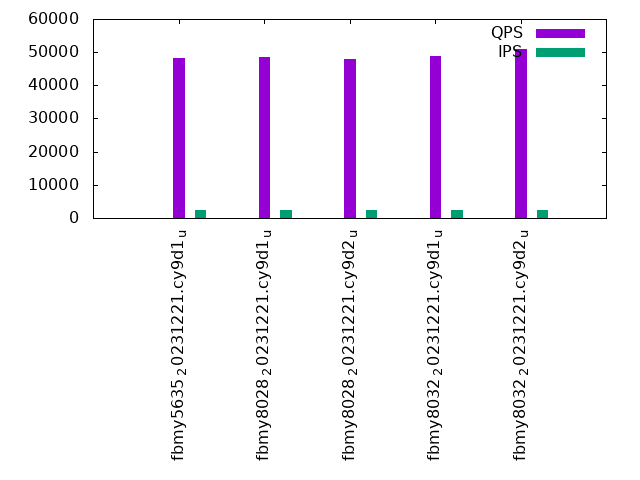
- qr100.L1: range queries with 100 insert/s per client
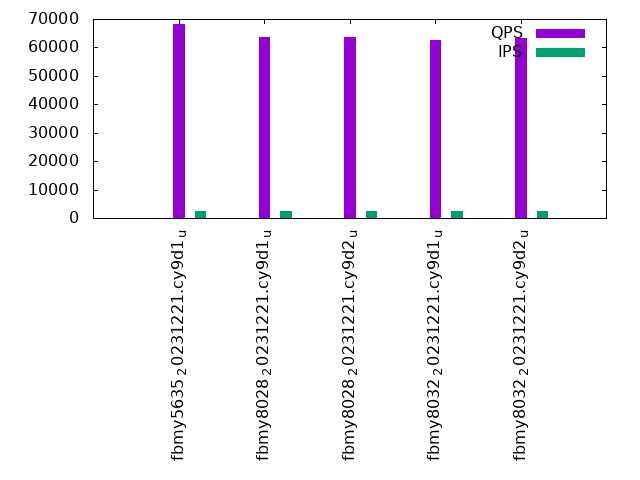
- qp100.L2: point queries with 100 insert/s per client
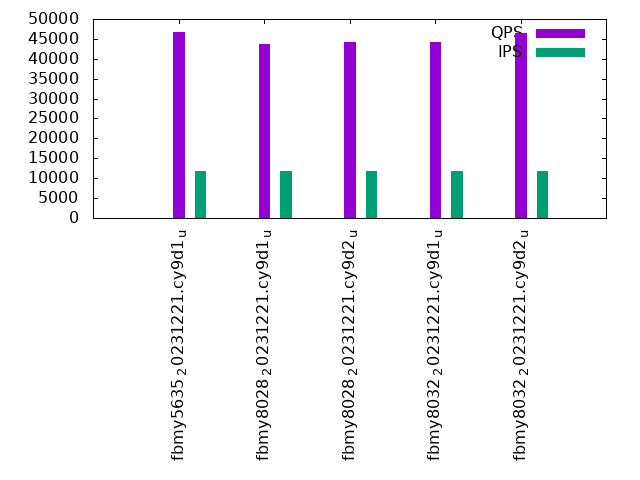
- qr500.L3: range queries with 500 insert/s per client
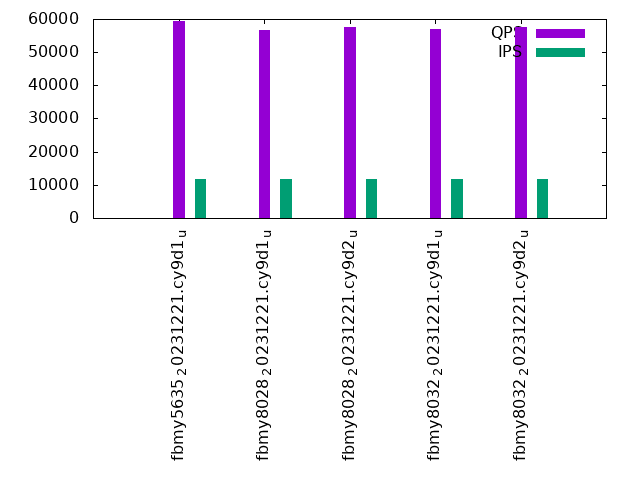
- qp500.L4: point queries with 500 insert/s per client
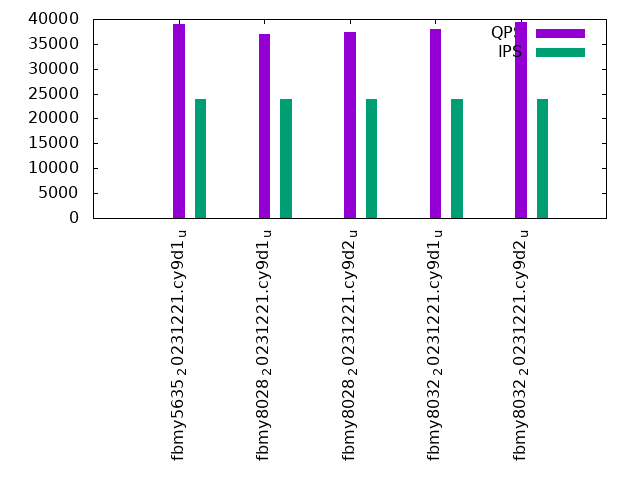
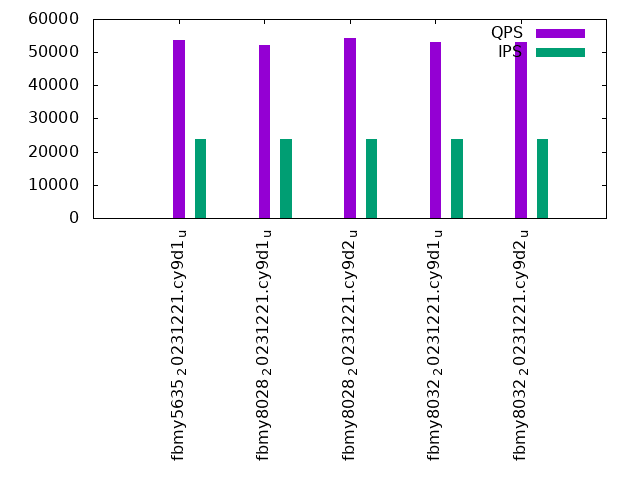
- qr1000.L5: range queries with 1000 insert/s per client
- qp1000.L6: point queries with 1000 insert/s per client
Summary
The numbers are inserts/s for l.i0, l.i1 and l.i2, indexed docs (or rows) /s for l.x and queries/s for qr100, qp100 thru qr1000, qp1000" The values are the average rate over the entire test for inserts (IPS) and queries (QPS). The range of values for IPS and QPS is split into 3 parts: bottom 25%, middle 50%, top 25%. Values in the bottom 25% have a red background, values in the top 25% have a green background and values in the middle have no color. A gray background is used for values that can be ignored because the DBMS did not sustain the target insert rate. Red backgrounds are not used when the minimum value is within 80% of the max value.
| dbms | l.i0 | l.x | l.i1 | l.i2 | qr100 | qp100 | qr500 | qp500 | qr1000 | qp1000 |
|---|---|---|---|---|---|---|---|---|---|---|
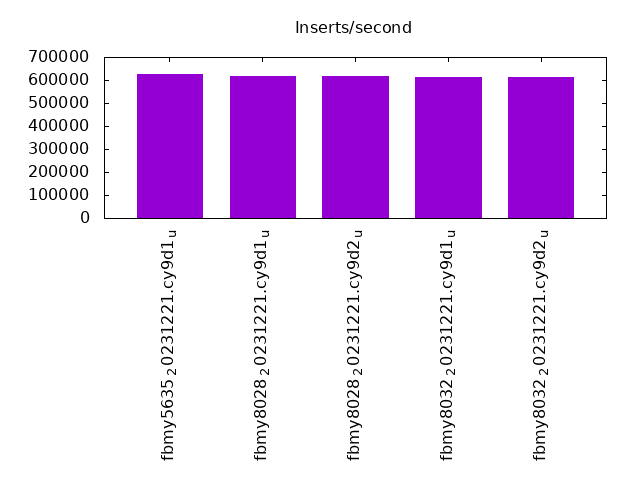
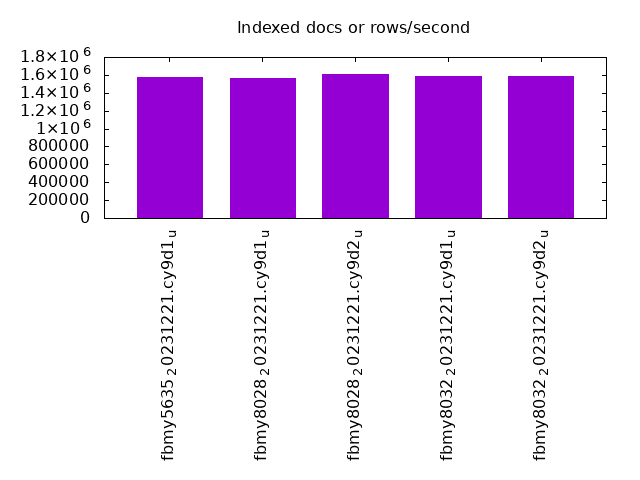
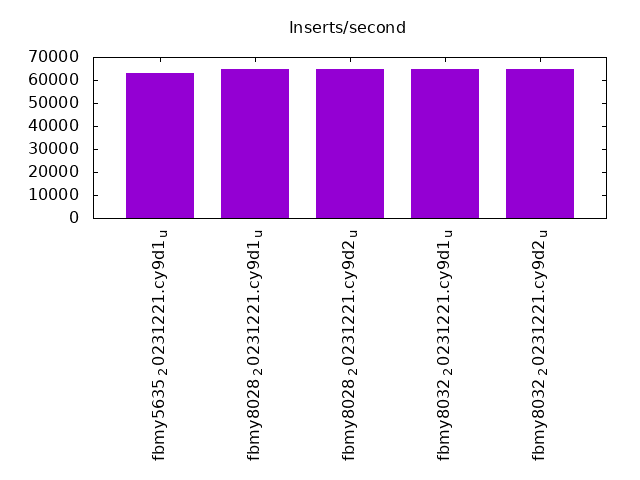
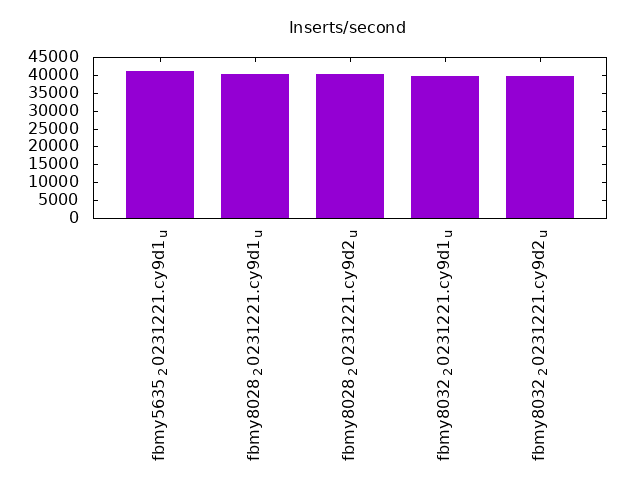
| fbmy5635_20231221.cy9d1_u | 625815 | 1578948 | 62926 | 40977 | 48188 | 68068 | 46730 | 59314 | 38913 | 53759 |
| fbmy8028_20231221.cy9d1_u | 618557 | 1563518 | 64612 | 40228 | 48684 | 63575 | 43723 | 56833 | 36931 | 52167 |
| fbmy8028_20231221.cy9d2_u | 618557 | 1605352 | 64795 | 40356 | 47982 | 63677 | 44337 | 57493 | 37380 | 54293 |
| fbmy8032_20231221.cy9d1_u | 612245 | 1584159 | 64703 | 39610 | 48907 | 62490 | 44306 | 57025 | 37938 | 53114 |
| fbmy8032_20231221.cy9d2_u | 613811 | 1589404 | 64790 | 39821 | 51105 | 63323 | 46543 | 57703 | 39496 | 52950 |
This table has relative throughput, throughput for the DBMS relative to the DBMS in the first line, using the absolute throughput from the previous table. Values less than 0.95 have a yellow background. Values greater than 1.05 have a blue background.
| dbms | l.i0 | l.x | l.i1 | l.i2 | qr100 | qp100 | qr500 | qp500 | qr1000 | qp1000 |
|---|---|---|---|---|---|---|---|---|---|---|
| fbmy5635_20231221.cy9d1_u | 1.00 | 1.00 | 1.00 | 1.00 | 1.00 | 1.00 | 1.00 | 1.00 | 1.00 | 1.00 |
| fbmy8028_20231221.cy9d1_u | 0.99 | 0.99 | 1.03 | 0.98 | 1.01 | 0.93 | 0.94 | 0.96 | 0.95 | 0.97 |
| fbmy8028_20231221.cy9d2_u | 0.99 | 1.02 | 1.03 | 0.98 | 1.00 | 0.94 | 0.95 | 0.97 | 0.96 | 1.01 |
| fbmy8032_20231221.cy9d1_u | 0.98 | 1.00 | 1.03 | 0.97 | 1.01 | 0.92 | 0.95 | 0.96 | 0.97 | 0.99 |
| fbmy8032_20231221.cy9d2_u | 0.98 | 1.01 | 1.03 | 0.97 | 1.06 | 0.93 | 1.00 | 0.97 | 1.01 | 0.98 |
This lists the average rate of inserts/s for the tests that do inserts concurrent with queries. For such tests the query rate is listed in the table above. The read+write tests are setup so that the insert rate should match the target rate every second. Cells that are not at least 95% of the target have a red background to indicate a failure to satisfy the target.
| dbms | qr100.L1 | qp100.L2 | qr500.L3 | qp500.L4 | qr1000.L5 | qp1000.L6 |
|---|---|---|---|---|---|---|
| fbmy5635_20231221.cy9d1_u | 2381 | 2381 | 11907 | 11907 | 23828 | 23828 |
| fbmy8028_20231221.cy9d1_u | 2382 | 2382 | 11907 | 11907 | 23828 | 23828 |
| fbmy8028_20231221.cy9d2_u | 2382 | 2382 | 11907 | 11907 | 23828 | 23828 |
| fbmy8032_20231221.cy9d1_u | 2381 | 2381 | 11907 | 11907 | 23828 | 23828 |
| fbmy8032_20231221.cy9d2_u | 2382 | 2382 | 11911 | 11907 | 23828 | 23828 |
| target | 2400 | 2400 | 12000 | 12000 | 24000 | 24000 |
l.i0
l.i0: load without secondary indexes. Graphs for performance per 1-second interval are here.
Average throughput:
Insert response time histogram: each cell has the percentage of responses that take <= the time in the header and max is the max response time in seconds. For the max column values in the top 25% of the range have a red background and in the bottom 25% of the range have a green background. The red background is not used when the min value is within 80% of the max value.
| dbms | 256us | 1ms | 4ms | 16ms | 64ms | 256ms | 1s | 4s | 16s | gt | max |
|---|---|---|---|---|---|---|---|---|---|---|---|
| fbmy5635_20231221.cy9d1_u | 0.112 | 76.511 | 23.335 | nonzero | 0.042 | 0.098 | |||||
| fbmy8028_20231221.cy9d1_u | 71.961 | 27.995 | 0.001 | 0.043 | 0.101 | ||||||
| fbmy8028_20231221.cy9d2_u | 72.871 | 27.085 | 0.001 | 0.043 | 0.107 | ||||||
| fbmy8032_20231221.cy9d1_u | 70.352 | 29.603 | 0.003 | 0.043 | 0.103 | ||||||
| fbmy8032_20231221.cy9d2_u | 71.670 | 28.286 | 0.001 | 0.043 | 0.103 |
Performance metrics for the DBMS listed above. Some are normalized by throughput, others are not. Legend for results is here.
ips	qps	rps	rmbps	wps	wmbps	rpq	rkbpq	wpi	wkbpi	csps	cpups	cspq	cpupq	dbgb1	dbgb2	rss	maxop	p50	p99	tag
625815	0	0	0.0	2061.8	247.3	0.000	0.000	0.003	0.405	316415	38.2	0.506	49	14.0	15.1	4.0	0.098	26973	21379	fbmy5635_20231221.cy9d1_u
618557	0	0	0.0	2141.2	149.1	0.000	0.000	0.003	0.247	227541	41.0	0.368	53	13.9	15.3	4.3	0.101	26174	20579	fbmy8028_20231221.cy9d1_u
618557	0	0	0.0	2172.5	150.5	0.000	0.000	0.004	0.249	227815	40.9	0.368	53	13.8	15.2	4.1	0.107	26571	21978	fbmy8028_20231221.cy9d2_u
612245	0	0	0.0	2154.8	149.4	0.000	0.000	0.004	0.250	205560	41.4	0.336	54	13.8	15.2	4.4	0.103	26274	16883	fbmy8032_20231221.cy9d1_u
613811	0	0	0.0	2148.5	151.6	0.000	0.000	0.004	0.253	218594	40.9	0.356	53	13.9	15.3	4.2	0.103	26374	21579	fbmy8032_20231221.cy9d2_u
l.x
l.x: create secondary indexes.
Average throughput:
Performance metrics for the DBMS listed above. Some are normalized by throughput, others are not. Legend for results is here.
ips	qps	rps	rmbps	wps	wmbps	rpq	rkbpq	wpi	wkbpi	csps	cpups	cspq	cpupq	dbgb1	dbgb2	rss	maxop	p50	p99	tag
1578948	0	33	0.3	2031.9	221.9	0.000	0.000	0.001	0.144	21362	27.6	0.014	14	31.1	32.2	33.4	0.004	NA	NA	fbmy5635_20231221.cy9d1_u
1563518	0	33	0.3	2054.6	143.5	0.000	0.000	0.001	0.094	22866	27.4	0.015	14	31.1	32.5	33.6	0.003	NA	NA	fbmy8028_20231221.cy9d1_u
1605352	0	34	0.3	2089.1	146.2	0.000	0.000	0.001	0.093	23076	27.8	0.014	14	31.1	32.5	33.4	0.004	NA	NA	fbmy8028_20231221.cy9d2_u
1584159	0	33	0.3	2085.9	149.2	0.000	0.000	0.001	0.096	21767	27.0	0.014	14	31.1	32.5	33.7	0.003	NA	NA	fbmy8032_20231221.cy9d1_u
1589404	0	33	0.3	2084.0	149.6	0.000	0.000	0.001	0.096	22348	27.3	0.014	14	31.1	32.4	33.4	0.018	NA	NA	fbmy8032_20231221.cy9d2_u
l.i1
l.i1: continue load after secondary indexes created with 50 inserts per transaction. Graphs for performance per 1-second interval are here.
Average throughput:
Insert response time histogram: each cell has the percentage of responses that take <= the time in the header and max is the max response time in seconds. For the max column values in the top 25% of the range have a red background and in the bottom 25% of the range have a green background. The red background is not used when the min value is within 80% of the max value.
| dbms | 256us | 1ms | 4ms | 16ms | 64ms | 256ms | 1s | 4s | 16s | gt | max |
|---|---|---|---|---|---|---|---|---|---|---|---|
| fbmy5635_20231221.cy9d1_u | 0.048 | 15.659 | 84.292 | 0.001 | 0.087 | ||||||
| fbmy8028_20231221.cy9d1_u | 0.042 | 18.774 | 81.183 | 0.001 | 0.190 | ||||||
| fbmy8028_20231221.cy9d2_u | 0.038 | 18.993 | 80.967 | 0.002 | 0.214 | ||||||
| fbmy8032_20231221.cy9d1_u | 0.033 | 18.966 | 81.001 | 0.001 | 0.104 | ||||||
| fbmy8032_20231221.cy9d2_u | 0.032 | 19.129 | 80.835 | 0.003 | nonzero | 0.352 |
Delete response time histogram: each cell has the percentage of responses that take <= the time in the header and max is the max response time in seconds. For the max column values in the top 25% of the range have a red background and in the bottom 25% of the range have a green background. The red background is not used when the min value is within 80% of the max value.
| dbms | 256us | 1ms | 4ms | 16ms | 64ms | 256ms | 1s | 4s | 16s | gt | max |
|---|---|---|---|---|---|---|---|---|---|---|---|
| fbmy5635_20231221.cy9d1_u | 0.049 | 16.869 | 83.081 | 0.001 | 0.173 | ||||||
| fbmy8028_20231221.cy9d1_u | 0.043 | 19.432 | 80.523 | 0.001 | 0.190 | ||||||
| fbmy8028_20231221.cy9d2_u | 0.040 | 19.580 | 80.379 | 0.002 | 0.214 | ||||||
| fbmy8032_20231221.cy9d1_u | 0.034 | 19.133 | 80.832 | 0.001 | 0.144 | ||||||
| fbmy8032_20231221.cy9d2_u | 0.034 | 19.452 | 80.510 | 0.003 | nonzero | 0.352 |
Performance metrics for the DBMS listed above. Some are normalized by throughput, others are not. Legend for results is here.
ips	qps	rps	rmbps	wps	wmbps	rpq	rkbpq	wpi	wkbpi	csps	cpups	cspq	cpupq	dbgb1	dbgb2	rss	maxop	p50	p99	tag
62926	0	44	1.4	1716.8	204.9	0.001	0.022	0.027	3.334	118283	16.6	1.880	211	36.0	37.5	177.8	0.087	2647	2348	fbmy5635_20231221.cy9d1_u
64612	0	38	1.3	1810.2	119.1	0.001	0.021	0.028	1.887	130790	19.2	2.024	238	39.1	40.6	177.9	0.190	2697	2447	fbmy8028_20231221.cy9d1_u
64795	0	34	1.3	1807.2	119.1	0.001	0.021	0.028	1.883	132319	19.1	2.042	236	37.9	39.5	177.9	0.214	2697	2447	fbmy8028_20231221.cy9d2_u
64703	0	36	1.3	1807.8	119.6	0.001	0.021	0.028	1.892	127173	19.3	1.965	239	35.9	37.5	177.8	0.104	2697	2447	fbmy8032_20231221.cy9d1_u
64790	0	35	1.3	1820.6	120.0	0.001	0.021	0.028	1.897	128885	19.1	1.989	236	35.8	37.4	177.7	0.352	2697	2447	fbmy8032_20231221.cy9d2_u
l.i2
l.i2: continue load after secondary indexes created with 5 inserts per transaction. Graphs for performance per 1-second interval are here.
Average throughput:
Insert response time histogram: each cell has the percentage of responses that take <= the time in the header and max is the max response time in seconds. For the max column values in the top 25% of the range have a red background and in the bottom 25% of the range have a green background. The red background is not used when the min value is within 80% of the max value.
| dbms | 256us | 1ms | 4ms | 16ms | 64ms | 256ms | 1s | 4s | 16s | gt | max |
|---|---|---|---|---|---|---|---|---|---|---|---|
| fbmy5635_20231221.cy9d1_u | 0.021 | 0.212 | 99.690 | 0.073 | 0.004 | 0.051 | |||||
| fbmy8028_20231221.cy9d1_u | nonzero | 0.154 | 99.612 | 0.229 | 0.001 | 0.005 | 0.102 | ||||
| fbmy8028_20231221.cy9d2_u | 0.001 | 0.166 | 99.612 | 0.215 | 0.001 | 0.005 | 0.161 | ||||
| fbmy8032_20231221.cy9d1_u | 0.163 | 99.550 | 0.282 | 0.001 | 0.004 | 0.132 | |||||
| fbmy8032_20231221.cy9d2_u | nonzero | 0.134 | 99.657 | 0.204 | 0.001 | 0.004 | 0.166 |
Delete response time histogram: each cell has the percentage of responses that take <= the time in the header and max is the max response time in seconds. For the max column values in the top 25% of the range have a red background and in the bottom 25% of the range have a green background. The red background is not used when the min value is within 80% of the max value.
| dbms | 256us | 1ms | 4ms | 16ms | 64ms | 256ms | 1s | 4s | 16s | gt | max |
|---|---|---|---|---|---|---|---|---|---|---|---|
| fbmy5635_20231221.cy9d1_u | nonzero | 0.175 | 99.629 | 0.191 | 0.004 | nonzero | 0.096 | ||||
| fbmy8028_20231221.cy9d1_u | 0.124 | 99.603 | 0.266 | 0.001 | 0.005 | 0.101 | |||||
| fbmy8028_20231221.cy9d2_u | 0.145 | 99.598 | 0.252 | 0.001 | 0.005 | 0.160 | |||||
| fbmy8032_20231221.cy9d1_u | 0.139 | 99.526 | 0.330 | 0.001 | 0.004 | 0.132 | |||||
| fbmy8032_20231221.cy9d2_u | 0.109 | 99.643 | 0.242 | 0.001 | 0.004 | 0.163 |
Performance metrics for the DBMS listed above. Some are normalized by throughput, others are not. Legend for results is here.
ips	qps	rps	rmbps	wps	wmbps	rpq	rkbpq	wpi	wkbpi	csps	cpups	cspq	cpupq	dbgb1	dbgb2	rss	maxop	p50	p99	tag
40977	0	82	0.6	1251.7	146.9	0.002	0.014	0.031	3.672	398912	19.3	9.735	377	38.1	38.2	177.9	0.051	1718	1518	fbmy5635_20231221.cy9d1_u
40228	0	77	0.5	1307.0	81.9	0.002	0.013	0.032	2.085	356591	26.3	8.864	523	35.9	36.2	178.4	0.102	1683	1474	fbmy8028_20231221.cy9d1_u
40356	0	80	0.5	1289.6	80.4	0.002	0.014	0.032	2.040	357169	25.9	8.850	513	36.1	36.4	178.2	0.161	1688	1474	fbmy8028_20231221.cy9d2_u
39610	0	80	0.5	1276.5	79.9	0.002	0.014	0.032	2.067	351702	26.0	8.879	525	38.1	38.4	178.5	0.132	1653	1454	fbmy8032_20231221.cy9d1_u
39821	0	81	0.5	1283.1	80.4	0.002	0.014	0.032	2.067	352665	25.5	8.856	512	35.7	36.0	178.1	0.166	1663	1459	fbmy8032_20231221.cy9d2_u
qr100.L1
qr100.L1: range queries with 100 insert/s per client. Graphs for performance per 1-second interval are here.
Average throughput:
Query response time histogram: each cell has the percentage of responses that take <= the time in the header and max is the max response time in seconds. For max values in the top 25% of the range have a red background and in the bottom 25% of the range have a green background. The red background is not used when the min value is within 80% of the max value.
| dbms | 256us | 1ms | 4ms | 16ms | 64ms | 256ms | 1s | 4s | 16s | gt | max |
|---|---|---|---|---|---|---|---|---|---|---|---|
| fbmy5635_20231221.cy9d1_u | 61.574 | 23.829 | 14.587 | 0.010 | nonzero | nonzero | 0.073 | ||||
| fbmy8028_20231221.cy9d1_u | 44.655 | 42.311 | 13.017 | 0.017 | nonzero | nonzero | 0.093 | ||||
| fbmy8028_20231221.cy9d2_u | 50.052 | 35.698 | 14.230 | 0.020 | nonzero | nonzero | 0.100 | ||||
| fbmy8032_20231221.cy9d1_u | 58.113 | 27.443 | 14.431 | 0.013 | nonzero | nonzero | 0.106 | ||||
| fbmy8032_20231221.cy9d2_u | 61.243 | 25.718 | 13.016 | 0.023 | nonzero | nonzero | 0.170 |
Insert response time histogram: each cell has the percentage of responses that take <= the time in the header and max is the max response time in seconds. For max values in the top 25% of the range have a red background and in the bottom 25% of the range have a green background. The red background is not used when the min value is within 80% of the max value.
| dbms | 256us | 1ms | 4ms | 16ms | 64ms | 256ms | 1s | 4s | 16s | gt | max |
|---|---|---|---|---|---|---|---|---|---|---|---|
| fbmy5635_20231221.cy9d1_u | 99.412 | 0.588 | 0.007 | ||||||||
| fbmy8028_20231221.cy9d1_u | 98.365 | 1.635 | 0.012 | ||||||||
| fbmy8028_20231221.cy9d2_u | 96.838 | 3.162 | 0.011 | ||||||||
| fbmy8032_20231221.cy9d1_u | 99.569 | 0.431 | 0.006 | ||||||||
| fbmy8032_20231221.cy9d2_u | 93.580 | 6.420 | 0.011 |
Delete response time histogram: each cell has the percentage of responses that take <= the time in the header and max is the max response time in seconds. For max values in the top 25% of the range have a red background and in the bottom 25% of the range have a green background. The red background is not used when the min value is within 80% of the max value.
| dbms | 256us | 1ms | 4ms | 16ms | 64ms | 256ms | 1s | 4s | 16s | gt | max |
|---|---|---|---|---|---|---|---|---|---|---|---|
| fbmy5635_20231221.cy9d1_u | 0.001 | 99.611 | 0.388 | 0.007 | |||||||
| fbmy8028_20231221.cy9d1_u | 99.102 | 0.898 | 0.011 | ||||||||
| fbmy8028_20231221.cy9d2_u | 98.198 | 1.802 | 0.012 | ||||||||
| fbmy8032_20231221.cy9d1_u | 99.777 | 0.223 | 0.007 | ||||||||
| fbmy8032_20231221.cy9d2_u | 95.215 | 4.785 | 0.011 |
Performance metrics for the DBMS listed above. Some are normalized by throughput, others are not. Legend for results is here.
ips	qps	rps	rmbps	wps	wmbps	rpq	rkbpq	wpi	wkbpi	csps	cpups	cspq	cpupq	dbgb1	dbgb2	rss	maxop	p50	p99	tag
2381	48188	7	0.0	103.5	11.8	0.000	0.001	0.043	5.078	208079	30.5	4.318	506	35.1	37.1	177.7	0.073	1694	1439	fbmy5635_20231221.cy9d1_u
2382	48684	5	0.0	112.4	6.2	0.000	0.001	0.047	2.651	203208	30.9	4.174	508	35.2	37.3	178.2	0.093	1631	1390	fbmy8028_20231221.cy9d1_u
2382	47982	6	0.0	112.6	6.2	0.000	0.001	0.047	2.646	200605	30.6	4.181	510	35.2	37.3	177.9	0.100	2142	1822	fbmy8028_20231221.cy9d2_u
2381	48907	1	0.0	107.6	5.9	0.000	0.000	0.045	2.551	204058	30.9	4.172	505	35.2	37.3	178.2	0.106	2701	1534	fbmy8032_20231221.cy9d1_u
2382	51105	3	0.0	111.2	6.1	0.000	0.001	0.047	2.634	212542	30.6	4.159	479	35.2	37.3	177.8	0.170	1870	1550	fbmy8032_20231221.cy9d2_u
qp100.L2
qp100.L2: point queries with 100 insert/s per client. Graphs for performance per 1-second interval are here.
Average throughput:
Query response time histogram: each cell has the percentage of responses that take <= the time in the header and max is the max response time in seconds. For max values in the top 25% of the range have a red background and in the bottom 25% of the range have a green background. The red background is not used when the min value is within 80% of the max value.
| dbms | 256us | 1ms | 4ms | 16ms | 64ms | 256ms | 1s | 4s | 16s | gt | max |
|---|---|---|---|---|---|---|---|---|---|---|---|
| fbmy5635_20231221.cy9d1_u | 17.506 | 82.479 | 0.015 | nonzero | nonzero | 0.018 | |||||
| fbmy8028_20231221.cy9d1_u | 2.181 | 97.799 | 0.021 | nonzero | nonzero | 0.017 | |||||
| fbmy8028_20231221.cy9d2_u | 4.386 | 95.596 | 0.018 | nonzero | 0.009 | ||||||
| fbmy8032_20231221.cy9d1_u | 0.861 | 99.115 | 0.024 | nonzero | nonzero | 0.023 | |||||
| fbmy8032_20231221.cy9d2_u | 3.367 | 96.613 | 0.019 | nonzero | nonzero | 0.022 |
Insert response time histogram: each cell has the percentage of responses that take <= the time in the header and max is the max response time in seconds. For max values in the top 25% of the range have a red background and in the bottom 25% of the range have a green background. The red background is not used when the min value is within 80% of the max value.
| dbms | 256us | 1ms | 4ms | 16ms | 64ms | 256ms | 1s | 4s | 16s | gt | max |
|---|---|---|---|---|---|---|---|---|---|---|---|
| fbmy5635_20231221.cy9d1_u | 48.623 | 51.241 | 0.137 | 0.020 | |||||||
| fbmy8028_20231221.cy9d1_u | 34.844 | 63.772 | 1.384 | 0.024 | |||||||
| fbmy8028_20231221.cy9d2_u | 42.002 | 57.751 | 0.236 | 0.012 | 0.087 | ||||||
| fbmy8032_20231221.cy9d1_u | 32.733 | 65.513 | 1.755 | 0.025 | |||||||
| fbmy8032_20231221.cy9d2_u | 36.202 | 62.733 | 1.065 | 0.023 |
Delete response time histogram: each cell has the percentage of responses that take <= the time in the header and max is the max response time in seconds. For max values in the top 25% of the range have a red background and in the bottom 25% of the range have a green background. The red background is not used when the min value is within 80% of the max value.
| dbms | 256us | 1ms | 4ms | 16ms | 64ms | 256ms | 1s | 4s | 16s | gt | max |
|---|---|---|---|---|---|---|---|---|---|---|---|
| fbmy5635_20231221.cy9d1_u | 51.713 | 48.172 | 0.115 | 0.064 | |||||||
| fbmy8028_20231221.cy9d1_u | 38.473 | 60.267 | 1.260 | 0.035 | |||||||
| fbmy8028_20231221.cy9d2_u | 45.948 | 53.846 | 0.194 | 0.012 | 0.085 | ||||||
| fbmy8032_20231221.cy9d1_u | 35.987 | 62.385 | 1.628 | 0.043 | |||||||
| fbmy8032_20231221.cy9d2_u | 39.373 | 59.650 | 0.977 | 0.042 |
Performance metrics for the DBMS listed above. Some are normalized by throughput, others are not. Legend for results is here.
ips	qps	rps	rmbps	wps	wmbps	rpq	rkbpq	wpi	wkbpi	csps	cpups	cspq	cpupq	dbgb1	dbgb2	rss	maxop	p50	p99	tag
2381	68068	320	1.9	99.4	11.3	0.005	0.028	0.042	4.856	502976	30.2	7.389	355	35.3	37.1	179.6	0.018	2686	2158	fbmy5635_20231221.cy9d1_u
2382	63575	358	2.2	108.3	6.6	0.006	0.035	0.045	2.825	344298	30.7	5.416	386	35.1	37.1	180.1	0.017	2589	2238	fbmy8028_20231221.cy9d1_u
2382	63677	346	2.1	105.7	6.3	0.005	0.034	0.044	2.725	365736	30.1	5.744	378	35.2	37.2	179.6	0.009	2573	2222	fbmy8028_20231221.cy9d2_u
2381	62490	343	2.1	110.3	6.7	0.005	0.034	0.046	2.867	340746	30.8	5.453	394	35.1	37.1	180.0	0.023	2525	2174	fbmy8032_20231221.cy9d1_u
2382	63323	336	2.0	104.2	6.4	0.005	0.033	0.044	2.732	362929	30.1	5.731	380	35.1	37.2	179.6	0.022	2557	2142	fbmy8032_20231221.cy9d2_u
qr500.L3
qr500.L3: range queries with 500 insert/s per client. Graphs for performance per 1-second interval are here.
Average throughput:
Query response time histogram: each cell has the percentage of responses that take <= the time in the header and max is the max response time in seconds. For max values in the top 25% of the range have a red background and in the bottom 25% of the range have a green background. The red background is not used when the min value is within 80% of the max value.
| dbms | 256us | 1ms | 4ms | 16ms | 64ms | 256ms | 1s | 4s | 16s | gt | max |
|---|---|---|---|---|---|---|---|---|---|---|---|
| fbmy5635_20231221.cy9d1_u | 52.781 | 31.958 | 15.214 | 0.046 | nonzero | nonzero | 0.120 | ||||
| fbmy8028_20231221.cy9d1_u | 29.782 | 54.703 | 15.449 | 0.066 | nonzero | nonzero | 0.120 | ||||
| fbmy8028_20231221.cy9d2_u | 35.468 | 49.224 | 15.259 | 0.049 | nonzero | nonzero | 0.082 | ||||
| fbmy8032_20231221.cy9d1_u | 45.532 | 38.174 | 16.217 | 0.076 | nonzero | nonzero | 0.080 | ||||
| fbmy8032_20231221.cy9d2_u | 51.196 | 33.673 | 15.100 | 0.031 | nonzero | nonzero | 0.093 |
Insert response time histogram: each cell has the percentage of responses that take <= the time in the header and max is the max response time in seconds. For max values in the top 25% of the range have a red background and in the bottom 25% of the range have a green background. The red background is not used when the min value is within 80% of the max value.
| dbms | 256us | 1ms | 4ms | 16ms | 64ms | 256ms | 1s | 4s | 16s | gt | max |
|---|---|---|---|---|---|---|---|---|---|---|---|
| fbmy5635_20231221.cy9d1_u | 4.884 | 28.728 | 66.388 | 0.045 | |||||||
| fbmy8028_20231221.cy9d1_u | 5.623 | 38.966 | 55.411 | 0.047 | |||||||
| fbmy8028_20231221.cy9d2_u | 4.247 | 40.260 | 55.492 | 0.047 | |||||||
| fbmy8032_20231221.cy9d1_u | 4.794 | 38.622 | 56.584 | 0.061 | |||||||
| fbmy8032_20231221.cy9d2_u | 5.244 | 37.587 | 57.169 | 0.044 |
Delete response time histogram: each cell has the percentage of responses that take <= the time in the header and max is the max response time in seconds. For max values in the top 25% of the range have a red background and in the bottom 25% of the range have a green background. The red background is not used when the min value is within 80% of the max value.
| dbms | 256us | 1ms | 4ms | 16ms | 64ms | 256ms | 1s | 4s | 16s | gt | max |
|---|---|---|---|---|---|---|---|---|---|---|---|
| fbmy5635_20231221.cy9d1_u | 5.330 | 30.064 | 64.606 | nonzero | 0.070 | ||||||
| fbmy8028_20231221.cy9d1_u | 6.467 | 38.625 | 54.908 | 0.050 | |||||||
| fbmy8028_20231221.cy9d2_u | 5.017 | 39.954 | 55.029 | nonzero | 0.067 | ||||||
| fbmy8032_20231221.cy9d1_u | 5.574 | 38.268 | 56.158 | 0.059 | |||||||
| fbmy8032_20231221.cy9d2_u | 6.025 | 37.268 | 56.707 | nonzero | 0.088 |
Performance metrics for the DBMS listed above. Some are normalized by throughput, others are not. Legend for results is here.
ips	qps	rps	rmbps	wps	wmbps	rpq	rkbpq	wpi	wkbpi	csps	cpups	cspq	cpupq	dbgb1	dbgb2	rss	maxop	p50	p99	tag
11907	46730	0	0.0	348.7	40.7	0.000	0.000	0.029	3.500	221630	32.7	4.743	560	35.5	36.8	181.2	0.120	1806	1263	fbmy5635_20231221.cy9d1_u
11907	43723	0	0.0	356.5	21.8	0.000	0.000	0.030	1.877	197616	33.3	4.520	609	35.4	36.9	181.6	0.120	2158	1343	fbmy8028_20231221.cy9d1_u
11907	44337	0	0.0	360.4	22.1	0.000	0.000	0.030	1.903	199987	32.9	4.511	594	35.5	37.0	181.2	0.082	1758	1215	fbmy8028_20231221.cy9d2_u
11907	44306	0	0.0	362.9	22.5	0.000	0.000	0.030	1.935	199704	33.4	4.507	603	35.6	37.1	181.6	0.080	1630	1119	fbmy8032_20231221.cy9d1_u
11911	46543	0	0.0	363.9	22.4	0.000	0.000	0.031	1.922	209164	33.0	4.494	567	35.4	36.9	181.2	0.093	1902	1151	fbmy8032_20231221.cy9d2_u
qp500.L4
qp500.L4: point queries with 500 insert/s per client. Graphs for performance per 1-second interval are here.
Average throughput:
Query response time histogram: each cell has the percentage of responses that take <= the time in the header and max is the max response time in seconds. For max values in the top 25% of the range have a red background and in the bottom 25% of the range have a green background. The red background is not used when the min value is within 80% of the max value.
| dbms | 256us | 1ms | 4ms | 16ms | 64ms | 256ms | 1s | 4s | 16s | gt | max |
|---|---|---|---|---|---|---|---|---|---|---|---|
| fbmy5635_20231221.cy9d1_u | 6.270 | 93.676 | 0.054 | nonzero | nonzero | 0.001 | 0.084 | ||||
| fbmy8028_20231221.cy9d1_u | 0.095 | 99.878 | 0.026 | nonzero | nonzero | 0.001 | 0.082 | ||||
| fbmy8028_20231221.cy9d2_u | 0.899 | 98.971 | 0.129 | nonzero | nonzero | 0.001 | 0.083 | ||||
| fbmy8032_20231221.cy9d1_u | 0.120 | 99.799 | 0.080 | nonzero | nonzero | 0.001 | 0.085 | ||||
| fbmy8032_20231221.cy9d2_u | 0.424 | 99.535 | 0.040 | nonzero | nonzero | 0.001 | 0.083 |
Insert response time histogram: each cell has the percentage of responses that take <= the time in the header and max is the max response time in seconds. For max values in the top 25% of the range have a red background and in the bottom 25% of the range have a green background. The red background is not used when the min value is within 80% of the max value.
| dbms | 256us | 1ms | 4ms | 16ms | 64ms | 256ms | 1s | 4s | 16s | gt | max |
|---|---|---|---|---|---|---|---|---|---|---|---|
| fbmy5635_20231221.cy9d1_u | 35.847 | 63.804 | 0.347 | 0.001 | 0.091 | ||||||
| fbmy8028_20231221.cy9d1_u | 19.523 | 75.287 | 5.190 | nonzero | 0.080 | ||||||
| fbmy8028_20231221.cy9d2_u | 7.327 | 54.768 | 37.899 | 0.005 | 0.099 | ||||||
| fbmy8032_20231221.cy9d1_u | 5.464 | 76.124 | 18.411 | 0.001 | 0.093 | ||||||
| fbmy8032_20231221.cy9d2_u | 27.329 | 71.192 | 1.478 | 0.001 | 0.087 |
Delete response time histogram: each cell has the percentage of responses that take <= the time in the header and max is the max response time in seconds. For max values in the top 25% of the range have a red background and in the bottom 25% of the range have a green background. The red background is not used when the min value is within 80% of the max value.
| dbms | 256us | 1ms | 4ms | 16ms | 64ms | 256ms | 1s | 4s | 16s | gt | max |
|---|---|---|---|---|---|---|---|---|---|---|---|
| fbmy5635_20231221.cy9d1_u | 37.799 | 61.899 | 0.301 | 0.001 | 0.083 | ||||||
| fbmy8028_20231221.cy9d1_u | 21.637 | 73.315 | 5.047 | 0.002 | 0.103 | ||||||
| fbmy8028_20231221.cy9d2_u | 8.896 | 53.658 | 37.440 | 0.006 | 0.099 | ||||||
| fbmy8032_20231221.cy9d1_u | 6.572 | 75.253 | 18.174 | 0.002 | 0.092 | ||||||
| fbmy8032_20231221.cy9d2_u | 28.923 | 69.619 | 1.456 | 0.002 | 0.087 |
Performance metrics for the DBMS listed above. Some are normalized by throughput, others are not. Legend for results is here.
ips	qps	rps	rmbps	wps	wmbps	rpq	rkbpq	wpi	wkbpi	csps	cpups	cspq	cpupq	dbgb1	dbgb2	rss	maxop	p50	p99	tag
11907	59314	0	0.0	358.3	41.9	0.000	0.000	0.030	3.601	582141	32.3	9.815	436	35.6	36.5	183.9	0.084	2414	1343	fbmy5635_20231221.cy9d1_u
11907	56833	0	0.0	362.4	21.5	0.000	0.000	0.030	1.848	375955	32.7	6.615	460	35.8	36.9	183.7	0.082	2318	2014	fbmy8028_20231221.cy9d1_u
11907	57493	0	0.0	361.0	21.5	0.000	0.000	0.030	1.852	391159	32.2	6.804	448	35.4	36.5	183.3	0.083	2334	1471	fbmy8028_20231221.cy9d2_u
11907	57025	0	0.0	369.5	22.3	0.000	0.000	0.031	1.917	361267	32.8	6.335	460	35.5	36.6	183.9	0.085	2365	1455	fbmy8032_20231221.cy9d1_u
11907	57703	0	0.0	374.7	22.5	0.000	0.000	0.031	1.932	384383	32.1	6.661	445	35.3	36.4	183.7	0.083	2382	1966	fbmy8032_20231221.cy9d2_u
qr1000.L5
qr1000.L5: range queries with 1000 insert/s per client. Graphs for performance per 1-second interval are here.
Average throughput:
Query response time histogram: each cell has the percentage of responses that take <= the time in the header and max is the max response time in seconds. For max values in the top 25% of the range have a red background and in the bottom 25% of the range have a green background. The red background is not used when the min value is within 80% of the max value.
| dbms | 256us | 1ms | 4ms | 16ms | 64ms | 256ms | 1s | 4s | 16s | gt | max |
|---|---|---|---|---|---|---|---|---|---|---|---|
| fbmy5635_20231221.cy9d1_u | 40.855 | 39.350 | 19.575 | 0.219 | nonzero | nonzero | 0.207 | ||||
| fbmy8028_20231221.cy9d1_u | 18.461 | 61.433 | 19.856 | 0.249 | nonzero | nonzero | 0.102 | ||||
| fbmy8028_20231221.cy9d2_u | 24.040 | 55.738 | 19.976 | 0.245 | nonzero | nonzero | 0.093 | ||||
| fbmy8032_20231221.cy9d1_u | 34.983 | 44.694 | 20.069 | 0.254 | nonzero | nonzero | 0.127 | ||||
| fbmy8032_20231221.cy9d2_u | 39.730 | 40.928 | 19.133 | 0.209 | nonzero | nonzero | 0.115 |
Insert response time histogram: each cell has the percentage of responses that take <= the time in the header and max is the max response time in seconds. For max values in the top 25% of the range have a red background and in the bottom 25% of the range have a green background. The red background is not used when the min value is within 80% of the max value.
| dbms | 256us | 1ms | 4ms | 16ms | 64ms | 256ms | 1s | 4s | 16s | gt | max |
|---|---|---|---|---|---|---|---|---|---|---|---|
| fbmy5635_20231221.cy9d1_u | 0.991 | 14.133 | 84.876 | 0.062 | |||||||
| fbmy8028_20231221.cy9d1_u | 2.021 | 26.973 | 71.005 | 0.059 | |||||||
| fbmy8028_20231221.cy9d2_u | 2.150 | 16.445 | 81.404 | 0.001 | 0.095 | ||||||
| fbmy8032_20231221.cy9d1_u | 0.841 | 15.966 | 83.193 | 0.053 | |||||||
| fbmy8032_20231221.cy9d2_u | 0.773 | 15.959 | 83.268 | 0.059 |
Delete response time histogram: each cell has the percentage of responses that take <= the time in the header and max is the max response time in seconds. For max values in the top 25% of the range have a red background and in the bottom 25% of the range have a green background. The red background is not used when the min value is within 80% of the max value.
| dbms | 256us | 1ms | 4ms | 16ms | 64ms | 256ms | 1s | 4s | 16s | gt | max |
|---|---|---|---|---|---|---|---|---|---|---|---|
| fbmy5635_20231221.cy9d1_u | 1.084 | 14.985 | 83.931 | nonzero | 0.072 | ||||||
| fbmy8028_20231221.cy9d1_u | 2.255 | 26.865 | 70.880 | nonzero | 0.071 | ||||||
| fbmy8028_20231221.cy9d2_u | 2.331 | 16.378 | 81.290 | 0.001 | 0.095 | ||||||
| fbmy8032_20231221.cy9d1_u | 0.961 | 15.911 | 83.127 | 0.057 | |||||||
| fbmy8032_20231221.cy9d2_u | 0.913 | 15.906 | 83.181 | nonzero | 0.069 |
Performance metrics for the DBMS listed above. Some are normalized by throughput, others are not. Legend for results is here.
ips	qps	rps	rmbps	wps	wmbps	rpq	rkbpq	wpi	wkbpi	csps	cpups	cspq	cpupq	dbgb1	dbgb2	rss	maxop	p50	p99	tag
23828	38913	7	0.0	643.3	75.6	0.000	0.001	0.027	3.249	213127	36.1	5.477	742	36.1	38.1	184.9	0.207	1438	1023	fbmy5635_20231221.cy9d1_u
23828	36931	0	0.0	679.5	41.5	0.000	0.000	0.029	1.783	189826	37.0	5.140	801	36.1	38.2	185.0	0.102	1646	1071	fbmy8028_20231221.cy9d1_u
23828	37380	0	0.0	672.0	40.9	0.000	0.000	0.028	1.759	193927	36.9	5.188	790	36.0	38.2	184.6	0.093	1390	1007	fbmy8028_20231221.cy9d2_u
23828	37938	0	0.0	669.4	40.6	0.000	0.000	0.028	1.744	194210	37.1	5.119	782	36.2	38.3	185.1	0.127	1518	1023	fbmy8032_20231221.cy9d1_u
23828	39496	0	0.0	682.7	41.7	0.000	0.000	0.029	1.792	200330	36.9	5.072	747	36.2	38.4	185.1	0.115	1455	1055	fbmy8032_20231221.cy9d2_u
qp1000.L6
qp1000.L6: point queries with 1000 insert/s per client. Graphs for performance per 1-second interval are here.
Average throughput:
Query response time histogram: each cell has the percentage of responses that take <= the time in the header and max is the max response time in seconds. For max values in the top 25% of the range have a red background and in the bottom 25% of the range have a green background. The red background is not used when the min value is within 80% of the max value.
| dbms | 256us | 1ms | 4ms | 16ms | 64ms | 256ms | 1s | 4s | 16s | gt | max |
|---|---|---|---|---|---|---|---|---|---|---|---|
| fbmy5635_20231221.cy9d1_u | 1.642 | 97.959 | 0.399 | nonzero | nonzero | 0.021 | |||||
| fbmy8028_20231221.cy9d1_u | 0.024 | 99.262 | 0.714 | nonzero | nonzero | 0.025 | |||||
| fbmy8028_20231221.cy9d2_u | 0.088 | 99.281 | 0.631 | nonzero | nonzero | 0.022 | |||||
| fbmy8032_20231221.cy9d1_u | 0.002 | 99.423 | 0.576 | nonzero | 0.012 | ||||||
| fbmy8032_20231221.cy9d2_u | 0.027 | 99.223 | 0.750 | nonzero | 0.012 |
Insert response time histogram: each cell has the percentage of responses that take <= the time in the header and max is the max response time in seconds. For max values in the top 25% of the range have a red background and in the bottom 25% of the range have a green background. The red background is not used when the min value is within 80% of the max value.
| dbms | 256us | 1ms | 4ms | 16ms | 64ms | 256ms | 1s | 4s | 16s | gt | max |
|---|---|---|---|---|---|---|---|---|---|---|---|
| fbmy5635_20231221.cy9d1_u | 1.534 | 10.710 | 87.756 | nonzero | 0.065 | ||||||
| fbmy8028_20231221.cy9d1_u | 1.288 | 14.195 | 84.516 | nonzero | 0.066 | ||||||
| fbmy8028_20231221.cy9d2_u | 1.544 | 11.547 | 86.909 | 0.060 | |||||||
| fbmy8032_20231221.cy9d1_u | 2.426 | 11.253 | 86.321 | nonzero | 0.068 | ||||||
| fbmy8032_20231221.cy9d2_u | 1.005 | 10.352 | 88.642 | 0.001 | 0.079 |
Delete response time histogram: each cell has the percentage of responses that take <= the time in the header and max is the max response time in seconds. For max values in the top 25% of the range have a red background and in the bottom 25% of the range have a green background. The red background is not used when the min value is within 80% of the max value.
| dbms | 256us | 1ms | 4ms | 16ms | 64ms | 256ms | 1s | 4s | 16s | gt | max |
|---|---|---|---|---|---|---|---|---|---|---|---|
| fbmy5635_20231221.cy9d1_u | 1.586 | 11.805 | 86.607 | 0.002 | 0.126 | ||||||
| fbmy8028_20231221.cy9d1_u | 1.515 | 14.165 | 84.319 | 0.001 | 0.101 | ||||||
| fbmy8028_20231221.cy9d2_u | 1.759 | 11.521 | 86.719 | 0.001 | 0.101 | ||||||
| fbmy8032_20231221.cy9d1_u | 2.639 | 11.197 | 86.163 | 0.001 | 0.092 | ||||||
| fbmy8032_20231221.cy9d2_u | 1.188 | 10.335 | 88.474 | 0.002 | 0.098 |
Performance metrics for the DBMS listed above. Some are normalized by throughput, others are not. Legend for results is here.
ips	qps	rps	rmbps	wps	wmbps	rpq	rkbpq	wpi	wkbpi	csps	cpups	cspq	cpupq	dbgb1	dbgb2	rss	maxop	p50	p99	tag
23828	53759	9	0.1	639.7	75.3	0.000	0.001	0.027	3.235	598815	36.9	11.139	549	35.8	36.9	185.7	0.021	2206	1678	fbmy5635_20231221.cy9d1_u
23828	52167	6	0.1	680.8	40.1	0.000	0.001	0.029	1.721	386219	36.3	7.403	557	36.6	37.9	186.0	0.025	2174	1790	fbmy8028_20231221.cy9d1_u
23828	54293	0	0.0	673.1	39.5	0.000	0.000	0.028	1.699	386047	35.8	7.110	528	36.8	38.1	185.3	0.022	2238	1902	fbmy8028_20231221.cy9d2_u
23828	53114	8	0.1	686.2	40.8	0.000	0.001	0.029	1.752	366597	36.5	6.902	550	36.9	38.2	186.2	0.012	2221	1934	fbmy8032_20231221.cy9d1_u
23828	52950	15	0.1	687.0	40.6	0.000	0.002	0.029	1.747	393214	35.9	7.426	542	36.6	37.8	185.8	0.012	2190	1886	fbmy8032_20231221.cy9d2_u
l.i0
l.i0: load without secondary indexes
Performance metrics for all DBMS, not just the ones listed above. Some are normalized by throughput, others are not. Legend for results is here.
ips	qps	rps	rmbps	wps	wmbps	rpq	rkbpq	wpi	wkbpi	csps	cpups	cspq	cpupq	dbgb1	dbgb2	rss	maxop	p50	p99	tag
625815	0	0	0.0	2061.8	247.3	0.000	0.000	0.003	0.405	316415	38.2	0.506	49	14.0	15.1	4.0	0.098	26973	21379	fbmy5635_20231221.cy9d1_u
618557	0	0	0.0	2141.2	149.1	0.000	0.000	0.003	0.247	227541	41.0	0.368	53	13.9	15.3	4.3	0.101	26174	20579	fbmy8028_20231221.cy9d1_u
618557	0	0	0.0	2172.5	150.5	0.000	0.000	0.004	0.249	227815	40.9	0.368	53	13.8	15.2	4.1	0.107	26571	21978	fbmy8028_20231221.cy9d2_u
612245	0	0	0.0	2154.8	149.4	0.000	0.000	0.004	0.250	205560	41.4	0.336	54	13.8	15.2	4.4	0.103	26274	16883	fbmy8032_20231221.cy9d1_u
613811	0	0	0.0	2148.5	151.6	0.000	0.000	0.004	0.253	218594	40.9	0.356	53	13.9	15.3	4.2	0.103	26374	21579	fbmy8032_20231221.cy9d2_u
l.x
l.x: create secondary indexes
Performance metrics for all DBMS, not just the ones listed above. Some are normalized by throughput, others are not. Legend for results is here.
ips	qps	rps	rmbps	wps	wmbps	rpq	rkbpq	wpi	wkbpi	csps	cpups	cspq	cpupq	dbgb1	dbgb2	rss	maxop	p50	p99	tag
1578948	0	33	0.3	2031.9	221.9	0.000	0.000	0.001	0.144	21362	27.6	0.014	14	31.1	32.2	33.4	0.004	NA	NA	fbmy5635_20231221.cy9d1_u
1563518	0	33	0.3	2054.6	143.5	0.000	0.000	0.001	0.094	22866	27.4	0.015	14	31.1	32.5	33.6	0.003	NA	NA	fbmy8028_20231221.cy9d1_u
1605352	0	34	0.3	2089.1	146.2	0.000	0.000	0.001	0.093	23076	27.8	0.014	14	31.1	32.5	33.4	0.004	NA	NA	fbmy8028_20231221.cy9d2_u
1584159	0	33	0.3	2085.9	149.2	0.000	0.000	0.001	0.096	21767	27.0	0.014	14	31.1	32.5	33.7	0.003	NA	NA	fbmy8032_20231221.cy9d1_u
1589404	0	33	0.3	2084.0	149.6	0.000	0.000	0.001	0.096	22348	27.3	0.014	14	31.1	32.4	33.4	0.018	NA	NA	fbmy8032_20231221.cy9d2_u
l.i1
l.i1: continue load after secondary indexes created with 50 inserts per transaction
Performance metrics for all DBMS, not just the ones listed above. Some are normalized by throughput, others are not. Legend for results is here.
ips	qps	rps	rmbps	wps	wmbps	rpq	rkbpq	wpi	wkbpi	csps	cpups	cspq	cpupq	dbgb1	dbgb2	rss	maxop	p50	p99	tag
62926	0	44	1.4	1716.8	204.9	0.001	0.022	0.027	3.334	118283	16.6	1.880	211	36.0	37.5	177.8	0.087	2647	2348	fbmy5635_20231221.cy9d1_u
64612	0	38	1.3	1810.2	119.1	0.001	0.021	0.028	1.887	130790	19.2	2.024	238	39.1	40.6	177.9	0.190	2697	2447	fbmy8028_20231221.cy9d1_u
64795	0	34	1.3	1807.2	119.1	0.001	0.021	0.028	1.883	132319	19.1	2.042	236	37.9	39.5	177.9	0.214	2697	2447	fbmy8028_20231221.cy9d2_u
64703	0	36	1.3	1807.8	119.6	0.001	0.021	0.028	1.892	127173	19.3	1.965	239	35.9	37.5	177.8	0.104	2697	2447	fbmy8032_20231221.cy9d1_u
64790	0	35	1.3	1820.6	120.0	0.001	0.021	0.028	1.897	128885	19.1	1.989	236	35.8	37.4	177.7	0.352	2697	2447	fbmy8032_20231221.cy9d2_u
l.i2
l.i2: continue load after secondary indexes created with 5 inserts per transaction
Performance metrics for all DBMS, not just the ones listed above. Some are normalized by throughput, others are not. Legend for results is here.
ips	qps	rps	rmbps	wps	wmbps	rpq	rkbpq	wpi	wkbpi	csps	cpups	cspq	cpupq	dbgb1	dbgb2	rss	maxop	p50	p99	tag
40977	0	82	0.6	1251.7	146.9	0.002	0.014	0.031	3.672	398912	19.3	9.735	377	38.1	38.2	177.9	0.051	1718	1518	fbmy5635_20231221.cy9d1_u
40228	0	77	0.5	1307.0	81.9	0.002	0.013	0.032	2.085	356591	26.3	8.864	523	35.9	36.2	178.4	0.102	1683	1474	fbmy8028_20231221.cy9d1_u
40356	0	80	0.5	1289.6	80.4	0.002	0.014	0.032	2.040	357169	25.9	8.850	513	36.1	36.4	178.2	0.161	1688	1474	fbmy8028_20231221.cy9d2_u
39610	0	80	0.5	1276.5	79.9	0.002	0.014	0.032	2.067	351702	26.0	8.879	525	38.1	38.4	178.5	0.132	1653	1454	fbmy8032_20231221.cy9d1_u
39821	0	81	0.5	1283.1	80.4	0.002	0.014	0.032	2.067	352665	25.5	8.856	512	35.7	36.0	178.1	0.166	1663	1459	fbmy8032_20231221.cy9d2_u
qr100.L1
qr100.L1: range queries with 100 insert/s per client
Performance metrics for all DBMS, not just the ones listed above. Some are normalized by throughput, others are not. Legend for results is here.
ips	qps	rps	rmbps	wps	wmbps	rpq	rkbpq	wpi	wkbpi	csps	cpups	cspq	cpupq	dbgb1	dbgb2	rss	maxop	p50	p99	tag
2381	48188	7	0.0	103.5	11.8	0.000	0.001	0.043	5.078	208079	30.5	4.318	506	35.1	37.1	177.7	0.073	1694	1439	fbmy5635_20231221.cy9d1_u
2382	48684	5	0.0	112.4	6.2	0.000	0.001	0.047	2.651	203208	30.9	4.174	508	35.2	37.3	178.2	0.093	1631	1390	fbmy8028_20231221.cy9d1_u
2382	47982	6	0.0	112.6	6.2	0.000	0.001	0.047	2.646	200605	30.6	4.181	510	35.2	37.3	177.9	0.100	2142	1822	fbmy8028_20231221.cy9d2_u
2381	48907	1	0.0	107.6	5.9	0.000	0.000	0.045	2.551	204058	30.9	4.172	505	35.2	37.3	178.2	0.106	2701	1534	fbmy8032_20231221.cy9d1_u
2382	51105	3	0.0	111.2	6.1	0.000	0.001	0.047	2.634	212542	30.6	4.159	479	35.2	37.3	177.8	0.170	1870	1550	fbmy8032_20231221.cy9d2_u
qp100.L2
qp100.L2: point queries with 100 insert/s per client
Performance metrics for all DBMS, not just the ones listed above. Some are normalized by throughput, others are not. Legend for results is here.
ips	qps	rps	rmbps	wps	wmbps	rpq	rkbpq	wpi	wkbpi	csps	cpups	cspq	cpupq	dbgb1	dbgb2	rss	maxop	p50	p99	tag
2381	68068	320	1.9	99.4	11.3	0.005	0.028	0.042	4.856	502976	30.2	7.389	355	35.3	37.1	179.6	0.018	2686	2158	fbmy5635_20231221.cy9d1_u
2382	63575	358	2.2	108.3	6.6	0.006	0.035	0.045	2.825	344298	30.7	5.416	386	35.1	37.1	180.1	0.017	2589	2238	fbmy8028_20231221.cy9d1_u
2382	63677	346	2.1	105.7	6.3	0.005	0.034	0.044	2.725	365736	30.1	5.744	378	35.2	37.2	179.6	0.009	2573	2222	fbmy8028_20231221.cy9d2_u
2381	62490	343	2.1	110.3	6.7	0.005	0.034	0.046	2.867	340746	30.8	5.453	394	35.1	37.1	180.0	0.023	2525	2174	fbmy8032_20231221.cy9d1_u
2382	63323	336	2.0	104.2	6.4	0.005	0.033	0.044	2.732	362929	30.1	5.731	380	35.1	37.2	179.6	0.022	2557	2142	fbmy8032_20231221.cy9d2_u
qr500.L3
qr500.L3: range queries with 500 insert/s per client
Performance metrics for all DBMS, not just the ones listed above. Some are normalized by throughput, others are not. Legend for results is here.
ips	qps	rps	rmbps	wps	wmbps	rpq	rkbpq	wpi	wkbpi	csps	cpups	cspq	cpupq	dbgb1	dbgb2	rss	maxop	p50	p99	tag
11907	46730	0	0.0	348.7	40.7	0.000	0.000	0.029	3.500	221630	32.7	4.743	560	35.5	36.8	181.2	0.120	1806	1263	fbmy5635_20231221.cy9d1_u
11907	43723	0	0.0	356.5	21.8	0.000	0.000	0.030	1.877	197616	33.3	4.520	609	35.4	36.9	181.6	0.120	2158	1343	fbmy8028_20231221.cy9d1_u
11907	44337	0	0.0	360.4	22.1	0.000	0.000	0.030	1.903	199987	32.9	4.511	594	35.5	37.0	181.2	0.082	1758	1215	fbmy8028_20231221.cy9d2_u
11907	44306	0	0.0	362.9	22.5	0.000	0.000	0.030	1.935	199704	33.4	4.507	603	35.6	37.1	181.6	0.080	1630	1119	fbmy8032_20231221.cy9d1_u
11911	46543	0	0.0	363.9	22.4	0.000	0.000	0.031	1.922	209164	33.0	4.494	567	35.4	36.9	181.2	0.093	1902	1151	fbmy8032_20231221.cy9d2_u
qp500.L4
qp500.L4: point queries with 500 insert/s per client
Performance metrics for all DBMS, not just the ones listed above. Some are normalized by throughput, others are not. Legend for results is here.
ips	qps	rps	rmbps	wps	wmbps	rpq	rkbpq	wpi	wkbpi	csps	cpups	cspq	cpupq	dbgb1	dbgb2	rss	maxop	p50	p99	tag
11907	59314	0	0.0	358.3	41.9	0.000	0.000	0.030	3.601	582141	32.3	9.815	436	35.6	36.5	183.9	0.084	2414	1343	fbmy5635_20231221.cy9d1_u
11907	56833	0	0.0	362.4	21.5	0.000	0.000	0.030	1.848	375955	32.7	6.615	460	35.8	36.9	183.7	0.082	2318	2014	fbmy8028_20231221.cy9d1_u
11907	57493	0	0.0	361.0	21.5	0.000	0.000	0.030	1.852	391159	32.2	6.804	448	35.4	36.5	183.3	0.083	2334	1471	fbmy8028_20231221.cy9d2_u
11907	57025	0	0.0	369.5	22.3	0.000	0.000	0.031	1.917	361267	32.8	6.335	460	35.5	36.6	183.9	0.085	2365	1455	fbmy8032_20231221.cy9d1_u
11907	57703	0	0.0	374.7	22.5	0.000	0.000	0.031	1.932	384383	32.1	6.661	445	35.3	36.4	183.7	0.083	2382	1966	fbmy8032_20231221.cy9d2_u
qr1000.L5
qr1000.L5: range queries with 1000 insert/s per client
Performance metrics for all DBMS, not just the ones listed above. Some are normalized by throughput, others are not. Legend for results is here.
ips	qps	rps	rmbps	wps	wmbps	rpq	rkbpq	wpi	wkbpi	csps	cpups	cspq	cpupq	dbgb1	dbgb2	rss	maxop	p50	p99	tag
23828	38913	7	0.0	643.3	75.6	0.000	0.001	0.027	3.249	213127	36.1	5.477	742	36.1	38.1	184.9	0.207	1438	1023	fbmy5635_20231221.cy9d1_u
23828	36931	0	0.0	679.5	41.5	0.000	0.000	0.029	1.783	189826	37.0	5.140	801	36.1	38.2	185.0	0.102	1646	1071	fbmy8028_20231221.cy9d1_u
23828	37380	0	0.0	672.0	40.9	0.000	0.000	0.028	1.759	193927	36.9	5.188	790	36.0	38.2	184.6	0.093	1390	1007	fbmy8028_20231221.cy9d2_u
23828	37938	0	0.0	669.4	40.6	0.000	0.000	0.028	1.744	194210	37.1	5.119	782	36.2	38.3	185.1	0.127	1518	1023	fbmy8032_20231221.cy9d1_u
23828	39496	0	0.0	682.7	41.7	0.000	0.000	0.029	1.792	200330	36.9	5.072	747	36.2	38.4	185.1	0.115	1455	1055	fbmy8032_20231221.cy9d2_u
qp1000.L6
qp1000.L6: point queries with 1000 insert/s per client
Performance metrics for all DBMS, not just the ones listed above. Some are normalized by throughput, others are not. Legend for results is here.
ips	qps	rps	rmbps	wps	wmbps	rpq	rkbpq	wpi	wkbpi	csps	cpups	cspq	cpupq	dbgb1	dbgb2	rss	maxop	p50	p99	tag
23828	53759	9	0.1	639.7	75.3	0.000	0.001	0.027	3.235	598815	36.9	11.139	549	35.8	36.9	185.7	0.021	2206	1678	fbmy5635_20231221.cy9d1_u
23828	52167	6	0.1	680.8	40.1	0.000	0.001	0.029	1.721	386219	36.3	7.403	557	36.6	37.9	186.0	0.025	2174	1790	fbmy8028_20231221.cy9d1_u
23828	54293	0	0.0	673.1	39.5	0.000	0.000	0.028	1.699	386047	35.8	7.110	528	36.8	38.1	185.3	0.022	2238	1902	fbmy8028_20231221.cy9d2_u
23828	53114	8	0.1	686.2	40.8	0.000	0.001	0.029	1.752	366597	36.5	6.902	550	36.9	38.2	186.2	0.012	2221	1934	fbmy8032_20231221.cy9d1_u
23828	52950	15	0.1	687.0	40.6	0.000	0.002	0.029	1.747	393214	35.9	7.426	542	36.6	37.8	185.8	0.012	2190	1886	fbmy8032_20231221.cy9d2_u
l.i0
- l.i0: load without secondary indexes
- Legend for results is here.
- Each entry lists the percentage of responses that fit in that bucket (slower than max time for previous bucket, faster than min time for next bucket).
Insert response time histogram
256us	1ms	4ms	16ms	64ms	256ms	1s	4s	16s	gt	max	tag
0.000	0.112	76.511	23.335	nonzero	0.042	0.000	0.000	0.000	0.000	0.098	fbmy5635_20231221.cy9d1_u
0.000	0.000	71.961	27.995	0.001	0.043	0.000	0.000	0.000	0.000	0.101	fbmy8028_20231221.cy9d1_u
0.000	0.000	72.871	27.085	0.001	0.043	0.000	0.000	0.000	0.000	0.107	fbmy8028_20231221.cy9d2_u
0.000	0.000	70.352	29.603	0.003	0.043	0.000	0.000	0.000	0.000	0.103	fbmy8032_20231221.cy9d1_u
0.000	0.000	71.670	28.286	0.001	0.043	0.000	0.000	0.000	0.000	0.103	fbmy8032_20231221.cy9d2_u
l.x
- l.x: create secondary indexes
- Legend for results is here.
- Each entry lists the percentage of responses that fit in that bucket (slower than max time for previous bucket, faster than min time for next bucket).
TODO - determine whether there is data for create index response time
l.i1
- l.i1: continue load after secondary indexes created with 50 inserts per transaction
- Legend for results is here.
- Each entry lists the percentage of responses that fit in that bucket (slower than max time for previous bucket, faster than min time for next bucket).
Insert response time histogram
256us	1ms	4ms	16ms	64ms	256ms	1s	4s	16s	gt	max	tag
0.000	0.000	0.048	15.659	84.292	0.001	0.000	0.000	0.000	0.000	0.087	fbmy5635_20231221.cy9d1_u
0.000	0.000	0.042	18.774	81.183	0.001	0.000	0.000	0.000	0.000	0.190	fbmy8028_20231221.cy9d1_u
0.000	0.000	0.038	18.993	80.967	0.002	0.000	0.000	0.000	0.000	0.214	fbmy8028_20231221.cy9d2_u
0.000	0.000	0.033	18.966	81.001	0.001	0.000	0.000	0.000	0.000	0.104	fbmy8032_20231221.cy9d1_u
0.000	0.000	0.032	19.129	80.835	0.003	nonzero	0.000	0.000	0.000	0.352	fbmy8032_20231221.cy9d2_u
Delete response time histogram
256us	1ms	4ms	16ms	64ms	256ms	1s	4s	16s	gt	max	tag
0.000	0.000	0.049	16.869	83.081	0.001	0.000	0.000	0.000	0.000	0.173	fbmy5635_20231221.cy9d1_u
0.000	0.000	0.043	19.432	80.523	0.001	0.000	0.000	0.000	0.000	0.190	fbmy8028_20231221.cy9d1_u
0.000	0.000	0.040	19.580	80.379	0.002	0.000	0.000	0.000	0.000	0.214	fbmy8028_20231221.cy9d2_u
0.000	0.000	0.034	19.133	80.832	0.001	0.000	0.000	0.000	0.000	0.144	fbmy8032_20231221.cy9d1_u
0.000	0.000	0.034	19.452	80.510	0.003	nonzero	0.000	0.000	0.000	0.352	fbmy8032_20231221.cy9d2_u
l.i2
- l.i2: continue load after secondary indexes created with 5 inserts per transaction
- Legend for results is here.
- Each entry lists the percentage of responses that fit in that bucket (slower than max time for previous bucket, faster than min time for next bucket).
Insert response time histogram
256us	1ms	4ms	16ms	64ms	256ms	1s	4s	16s	gt	max	tag
0.021	0.212	99.690	0.073	0.004	0.000	0.000	0.000	0.000	0.000	0.051	fbmy5635_20231221.cy9d1_u
nonzero	0.154	99.612	0.229	0.001	0.005	0.000	0.000	0.000	0.000	0.102	fbmy8028_20231221.cy9d1_u
0.001	0.166	99.612	0.215	0.001	0.005	0.000	0.000	0.000	0.000	0.161	fbmy8028_20231221.cy9d2_u
0.000	0.163	99.550	0.282	0.001	0.004	0.000	0.000	0.000	0.000	0.132	fbmy8032_20231221.cy9d1_u
nonzero	0.134	99.657	0.204	0.001	0.004	0.000	0.000	0.000	0.000	0.166	fbmy8032_20231221.cy9d2_u
Delete response time histogram
256us	1ms	4ms	16ms	64ms	256ms	1s	4s	16s	gt	max	tag
nonzero	0.175	99.629	0.191	0.004	nonzero	0.000	0.000	0.000	0.000	0.096	fbmy5635_20231221.cy9d1_u
0.000	0.124	99.603	0.266	0.001	0.005	0.000	0.000	0.000	0.000	0.101	fbmy8028_20231221.cy9d1_u
0.000	0.145	99.598	0.252	0.001	0.005	0.000	0.000	0.000	0.000	0.160	fbmy8028_20231221.cy9d2_u
0.000	0.139	99.526	0.330	0.001	0.004	0.000	0.000	0.000	0.000	0.132	fbmy8032_20231221.cy9d1_u
0.000	0.109	99.643	0.242	0.001	0.004	0.000	0.000	0.000	0.000	0.163	fbmy8032_20231221.cy9d2_u
qr100.L1
- qr100.L1: range queries with 100 insert/s per client
- Legend for results is here.
- Each entry lists the percentage of responses that fit in that bucket (slower than max time for previous bucket, faster than min time for next bucket).
Query response time histogram
256us	1ms	4ms	16ms	64ms	256ms	1s	4s	16s	gt	max	tag
61.574	23.829	14.587	0.010	nonzero	nonzero	0.000	0.000	0.000	0.000	0.073	fbmy5635_20231221.cy9d1_u
44.655	42.311	13.017	0.017	nonzero	nonzero	0.000	0.000	0.000	0.000	0.093	fbmy8028_20231221.cy9d1_u
50.052	35.698	14.230	0.020	nonzero	nonzero	0.000	0.000	0.000	0.000	0.100	fbmy8028_20231221.cy9d2_u
58.113	27.443	14.431	0.013	nonzero	nonzero	0.000	0.000	0.000	0.000	0.106	fbmy8032_20231221.cy9d1_u
61.243	25.718	13.016	0.023	nonzero	nonzero	0.000	0.000	0.000	0.000	0.170	fbmy8032_20231221.cy9d2_u
Insert response time histogram
256us	1ms	4ms	16ms	64ms	256ms	1s	4s	16s	gt	max	tag
0.000	0.000	99.412	0.588	0.000	0.000	0.000	0.000	0.000	0.000	0.007	fbmy5635_20231221.cy9d1_u
0.000	0.000	98.365	1.635	0.000	0.000	0.000	0.000	0.000	0.000	0.012	fbmy8028_20231221.cy9d1_u
0.000	0.000	96.838	3.162	0.000	0.000	0.000	0.000	0.000	0.000	0.011	fbmy8028_20231221.cy9d2_u
0.000	0.000	99.569	0.431	0.000	0.000	0.000	0.000	0.000	0.000	0.006	fbmy8032_20231221.cy9d1_u
0.000	0.000	93.580	6.420	0.000	0.000	0.000	0.000	0.000	0.000	0.011	fbmy8032_20231221.cy9d2_u
Delete response time histogram
256us	1ms	4ms	16ms	64ms	256ms	1s	4s	16s	gt	max	tag
0.000	0.001	99.611	0.388	0.000	0.000	0.000	0.000	0.000	0.000	0.007	fbmy5635_20231221.cy9d1_u
0.000	0.000	99.102	0.898	0.000	0.000	0.000	0.000	0.000	0.000	0.011	fbmy8028_20231221.cy9d1_u
0.000	0.000	98.198	1.802	0.000	0.000	0.000	0.000	0.000	0.000	0.012	fbmy8028_20231221.cy9d2_u
0.000	0.000	99.777	0.223	0.000	0.000	0.000	0.000	0.000	0.000	0.007	fbmy8032_20231221.cy9d1_u
0.000	0.000	95.215	4.785	0.000	0.000	0.000	0.000	0.000	0.000	0.011	fbmy8032_20231221.cy9d2_u
qp100.L2
- qp100.L2: point queries with 100 insert/s per client
- Legend for results is here.
- Each entry lists the percentage of responses that fit in that bucket (slower than max time for previous bucket, faster than min time for next bucket).
Query response time histogram
256us	1ms	4ms	16ms	64ms	256ms	1s	4s	16s	gt	max	tag
17.506	82.479	0.015	nonzero	nonzero	0.000	0.000	0.000	0.000	0.000	0.018	fbmy5635_20231221.cy9d1_u
2.181	97.799	0.021	nonzero	nonzero	0.000	0.000	0.000	0.000	0.000	0.017	fbmy8028_20231221.cy9d1_u
4.386	95.596	0.018	nonzero	0.000	0.000	0.000	0.000	0.000	0.000	0.009	fbmy8028_20231221.cy9d2_u
0.861	99.115	0.024	nonzero	nonzero	0.000	0.000	0.000	0.000	0.000	0.023	fbmy8032_20231221.cy9d1_u
3.367	96.613	0.019	nonzero	nonzero	0.000	0.000	0.000	0.000	0.000	0.022	fbmy8032_20231221.cy9d2_u
Insert response time histogram
256us	1ms	4ms	16ms	64ms	256ms	1s	4s	16s	gt	max	tag
0.000	0.000	48.623	51.241	0.137	0.000	0.000	0.000	0.000	0.000	0.020	fbmy5635_20231221.cy9d1_u
0.000	0.000	34.844	63.772	1.384	0.000	0.000	0.000	0.000	0.000	0.024	fbmy8028_20231221.cy9d1_u
0.000	0.000	42.002	57.751	0.236	0.012	0.000	0.000	0.000	0.000	0.087	fbmy8028_20231221.cy9d2_u
0.000	0.000	32.733	65.513	1.755	0.000	0.000	0.000	0.000	0.000	0.025	fbmy8032_20231221.cy9d1_u
0.000	0.000	36.202	62.733	1.065	0.000	0.000	0.000	0.000	0.000	0.023	fbmy8032_20231221.cy9d2_u
Delete response time histogram
256us	1ms	4ms	16ms	64ms	256ms	1s	4s	16s	gt	max	tag
0.000	0.000	51.713	48.172	0.115	0.000	0.000	0.000	0.000	0.000	0.064	fbmy5635_20231221.cy9d1_u
0.000	0.000	38.473	60.267	1.260	0.000	0.000	0.000	0.000	0.000	0.035	fbmy8028_20231221.cy9d1_u
0.000	0.000	45.948	53.846	0.194	0.012	0.000	0.000	0.000	0.000	0.085	fbmy8028_20231221.cy9d2_u
0.000	0.000	35.987	62.385	1.628	0.000	0.000	0.000	0.000	0.000	0.043	fbmy8032_20231221.cy9d1_u
0.000	0.000	39.373	59.650	0.977	0.000	0.000	0.000	0.000	0.000	0.042	fbmy8032_20231221.cy9d2_u
qr500.L3
- qr500.L3: range queries with 500 insert/s per client
- Legend for results is here.
- Each entry lists the percentage of responses that fit in that bucket (slower than max time for previous bucket, faster than min time for next bucket).
Query response time histogram
256us	1ms	4ms	16ms	64ms	256ms	1s	4s	16s	gt	max	tag
52.781	31.958	15.214	0.046	nonzero	nonzero	0.000	0.000	0.000	0.000	0.120	fbmy5635_20231221.cy9d1_u
29.782	54.703	15.449	0.066	nonzero	nonzero	0.000	0.000	0.000	0.000	0.120	fbmy8028_20231221.cy9d1_u
35.468	49.224	15.259	0.049	nonzero	nonzero	0.000	0.000	0.000	0.000	0.082	fbmy8028_20231221.cy9d2_u
45.532	38.174	16.217	0.076	nonzero	nonzero	0.000	0.000	0.000	0.000	0.080	fbmy8032_20231221.cy9d1_u
51.196	33.673	15.100	0.031	nonzero	nonzero	0.000	0.000	0.000	0.000	0.093	fbmy8032_20231221.cy9d2_u
Insert response time histogram
256us	1ms	4ms	16ms	64ms	256ms	1s	4s	16s	gt	max	tag
0.000	0.000	4.884	28.728	66.388	0.000	0.000	0.000	0.000	0.000	0.045	fbmy5635_20231221.cy9d1_u
0.000	0.000	5.623	38.966	55.411	0.000	0.000	0.000	0.000	0.000	0.047	fbmy8028_20231221.cy9d1_u
0.000	0.000	4.247	40.260	55.492	0.000	0.000	0.000	0.000	0.000	0.047	fbmy8028_20231221.cy9d2_u
0.000	0.000	4.794	38.622	56.584	0.000	0.000	0.000	0.000	0.000	0.061	fbmy8032_20231221.cy9d1_u
0.000	0.000	5.244	37.587	57.169	0.000	0.000	0.000	0.000	0.000	0.044	fbmy8032_20231221.cy9d2_u
Delete response time histogram
256us	1ms	4ms	16ms	64ms	256ms	1s	4s	16s	gt	max	tag
0.000	0.000	5.330	30.064	64.606	nonzero	0.000	0.000	0.000	0.000	0.070	fbmy5635_20231221.cy9d1_u
0.000	0.000	6.467	38.625	54.908	0.000	0.000	0.000	0.000	0.000	0.050	fbmy8028_20231221.cy9d1_u
0.000	0.000	5.017	39.954	55.029	nonzero	0.000	0.000	0.000	0.000	0.067	fbmy8028_20231221.cy9d2_u
0.000	0.000	5.574	38.268	56.158	0.000	0.000	0.000	0.000	0.000	0.059	fbmy8032_20231221.cy9d1_u
0.000	0.000	6.025	37.268	56.707	nonzero	0.000	0.000	0.000	0.000	0.088	fbmy8032_20231221.cy9d2_u
qp500.L4
- qp500.L4: point queries with 500 insert/s per client
- Legend for results is here.
- Each entry lists the percentage of responses that fit in that bucket (slower than max time for previous bucket, faster than min time for next bucket).
Query response time histogram
256us	1ms	4ms	16ms	64ms	256ms	1s	4s	16s	gt	max	tag
6.270	93.676	0.054	nonzero	nonzero	0.001	0.000	0.000	0.000	0.000	0.084	fbmy5635_20231221.cy9d1_u
0.095	99.878	0.026	nonzero	nonzero	0.001	0.000	0.000	0.000	0.000	0.082	fbmy8028_20231221.cy9d1_u
0.899	98.971	0.129	nonzero	nonzero	0.001	0.000	0.000	0.000	0.000	0.083	fbmy8028_20231221.cy9d2_u
0.120	99.799	0.080	nonzero	nonzero	0.001	0.000	0.000	0.000	0.000	0.085	fbmy8032_20231221.cy9d1_u
0.424	99.535	0.040	nonzero	nonzero	0.001	0.000	0.000	0.000	0.000	0.083	fbmy8032_20231221.cy9d2_u
Insert response time histogram
256us	1ms	4ms	16ms	64ms	256ms	1s	4s	16s	gt	max	tag
0.000	0.000	35.847	63.804	0.347	0.001	0.000	0.000	0.000	0.000	0.091	fbmy5635_20231221.cy9d1_u
0.000	0.000	19.523	75.287	5.190	nonzero	0.000	0.000	0.000	0.000	0.080	fbmy8028_20231221.cy9d1_u
0.000	0.000	7.327	54.768	37.899	0.005	0.000	0.000	0.000	0.000	0.099	fbmy8028_20231221.cy9d2_u
0.000	0.000	5.464	76.124	18.411	0.001	0.000	0.000	0.000	0.000	0.093	fbmy8032_20231221.cy9d1_u
0.000	0.000	27.329	71.192	1.478	0.001	0.000	0.000	0.000	0.000	0.087	fbmy8032_20231221.cy9d2_u
Delete response time histogram
256us	1ms	4ms	16ms	64ms	256ms	1s	4s	16s	gt	max	tag
0.000	0.000	37.799	61.899	0.301	0.001	0.000	0.000	0.000	0.000	0.083	fbmy5635_20231221.cy9d1_u
0.000	0.000	21.637	73.315	5.047	0.002	0.000	0.000	0.000	0.000	0.103	fbmy8028_20231221.cy9d1_u
0.000	0.000	8.896	53.658	37.440	0.006	0.000	0.000	0.000	0.000	0.099	fbmy8028_20231221.cy9d2_u
0.000	0.000	6.572	75.253	18.174	0.002	0.000	0.000	0.000	0.000	0.092	fbmy8032_20231221.cy9d1_u
0.000	0.000	28.923	69.619	1.456	0.002	0.000	0.000	0.000	0.000	0.087	fbmy8032_20231221.cy9d2_u
qr1000.L5
- qr1000.L5: range queries with 1000 insert/s per client
- Legend for results is here.
- Each entry lists the percentage of responses that fit in that bucket (slower than max time for previous bucket, faster than min time for next bucket).
Query response time histogram
256us	1ms	4ms	16ms	64ms	256ms	1s	4s	16s	gt	max	tag
40.855	39.350	19.575	0.219	nonzero	nonzero	0.000	0.000	0.000	0.000	0.207	fbmy5635_20231221.cy9d1_u
18.461	61.433	19.856	0.249	nonzero	nonzero	0.000	0.000	0.000	0.000	0.102	fbmy8028_20231221.cy9d1_u
24.040	55.738	19.976	0.245	nonzero	nonzero	0.000	0.000	0.000	0.000	0.093	fbmy8028_20231221.cy9d2_u
34.983	44.694	20.069	0.254	nonzero	nonzero	0.000	0.000	0.000	0.000	0.127	fbmy8032_20231221.cy9d1_u
39.730	40.928	19.133	0.209	nonzero	nonzero	0.000	0.000	0.000	0.000	0.115	fbmy8032_20231221.cy9d2_u
Insert response time histogram
256us	1ms	4ms	16ms	64ms	256ms	1s	4s	16s	gt	max	tag
0.000	0.000	0.991	14.133	84.876	0.000	0.000	0.000	0.000	0.000	0.062	fbmy5635_20231221.cy9d1_u
0.000	0.000	2.021	26.973	71.005	0.000	0.000	0.000	0.000	0.000	0.059	fbmy8028_20231221.cy9d1_u
0.000	0.000	2.150	16.445	81.404	0.001	0.000	0.000	0.000	0.000	0.095	fbmy8028_20231221.cy9d2_u
0.000	0.000	0.841	15.966	83.193	0.000	0.000	0.000	0.000	0.000	0.053	fbmy8032_20231221.cy9d1_u
0.000	0.000	0.773	15.959	83.268	0.000	0.000	0.000	0.000	0.000	0.059	fbmy8032_20231221.cy9d2_u
Delete response time histogram
256us	1ms	4ms	16ms	64ms	256ms	1s	4s	16s	gt	max	tag
0.000	0.000	1.084	14.985	83.931	nonzero	0.000	0.000	0.000	0.000	0.072	fbmy5635_20231221.cy9d1_u
0.000	0.000	2.255	26.865	70.880	nonzero	0.000	0.000	0.000	0.000	0.071	fbmy8028_20231221.cy9d1_u
0.000	0.000	2.331	16.378	81.290	0.001	0.000	0.000	0.000	0.000	0.095	fbmy8028_20231221.cy9d2_u
0.000	0.000	0.961	15.911	83.127	0.000	0.000	0.000	0.000	0.000	0.057	fbmy8032_20231221.cy9d1_u
0.000	0.000	0.913	15.906	83.181	nonzero	0.000	0.000	0.000	0.000	0.069	fbmy8032_20231221.cy9d2_u
qp1000.L6
- qp1000.L6: point queries with 1000 insert/s per client
- Legend for results is here.
- Each entry lists the percentage of responses that fit in that bucket (slower than max time for previous bucket, faster than min time for next bucket).
Query response time histogram
256us	1ms	4ms	16ms	64ms	256ms	1s	4s	16s	gt	max	tag
1.642	97.959	0.399	nonzero	nonzero	0.000	0.000	0.000	0.000	0.000	0.021	fbmy5635_20231221.cy9d1_u
0.024	99.262	0.714	nonzero	nonzero	0.000	0.000	0.000	0.000	0.000	0.025	fbmy8028_20231221.cy9d1_u
0.088	99.281	0.631	nonzero	nonzero	0.000	0.000	0.000	0.000	0.000	0.022	fbmy8028_20231221.cy9d2_u
0.002	99.423	0.576	nonzero	0.000	0.000	0.000	0.000	0.000	0.000	0.012	fbmy8032_20231221.cy9d1_u
0.027	99.223	0.750	nonzero	0.000	0.000	0.000	0.000	0.000	0.000	0.012	fbmy8032_20231221.cy9d2_u
Insert response time histogram
256us	1ms	4ms	16ms	64ms	256ms	1s	4s	16s	gt	max	tag
0.000	0.000	1.534	10.710	87.756	nonzero	0.000	0.000	0.000	0.000	0.065	fbmy5635_20231221.cy9d1_u
0.000	0.000	1.288	14.195	84.516	nonzero	0.000	0.000	0.000	0.000	0.066	fbmy8028_20231221.cy9d1_u
0.000	0.000	1.544	11.547	86.909	0.000	0.000	0.000	0.000	0.000	0.060	fbmy8028_20231221.cy9d2_u
0.000	0.000	2.426	11.253	86.321	nonzero	0.000	0.000	0.000	0.000	0.068	fbmy8032_20231221.cy9d1_u
0.000	0.000	1.005	10.352	88.642	0.001	0.000	0.000	0.000	0.000	0.079	fbmy8032_20231221.cy9d2_u
Delete response time histogram
256us	1ms	4ms	16ms	64ms	256ms	1s	4s	16s	gt	max	tag
0.000	0.000	1.586	11.805	86.607	0.002	0.000	0.000	0.000	0.000	0.126	fbmy5635_20231221.cy9d1_u
0.000	0.000	1.515	14.165	84.319	0.001	0.000	0.000	0.000	0.000	0.101	fbmy8028_20231221.cy9d1_u
0.000	0.000	1.759	11.521	86.719	0.001	0.000	0.000	0.000	0.000	0.101	fbmy8028_20231221.cy9d2_u
0.000	0.000	2.639	11.197	86.163	0.001	0.000	0.000	0.000	0.000	0.092	fbmy8032_20231221.cy9d1_u
0.000	0.000	1.188	10.335	88.474	0.002	0.000	0.000	0.000	0.000	0.098	fbmy8032_20231221.cy9d2_u