Introduction
This is a report for the insert benchmark with 20M docs and 1 client(s). It is generated by scripts (bash, awk, sed) and Tufte might not be impressed. An overview of the insert benchmark is here and a short update is here. Below, by DBMS, I mean DBMS+version.config. An example is my8020.c10b40 where my means MySQL, 8020 is version 8.0.20 and c10b40 is the name for the configuration file.
The test server has 8 AMD cores, 16G RAM and an NVMe SSD. It is described here as the Beelink. The benchmark was run with 1 client and there were 1 or 3 connections per client (1 for queries or inserts without rate limits, 1+1 for rate limited inserts+deletes). It uses 1 table. It loads 20M rows per table without secondary indexes, creates secondary indexes, then inserts 50M rows per table with a delete per insert to avoid growing the table. It then does 3 read+write tests for 1800s each that do queries as fast as possible with 100, 500 and then 1000 inserts/second/client concurrent with the queries and 1000 deletes/second to avoid growing the table. The database is cached by InnoDB. Clients and the DBMS share one server. The per-database configs are in the per-database subdirectories here.
The tested DBMS are:
- my8035_rel.cz10a_bee - MySQL 8.0.35 with InnoDB, rel build, cz10a_bee config
- my8035_rel_native.cz10a_bee - MySQL 8.0.35 with InnoDB, rel_native build, cz10a_bee config
- my8035_rel_native_lto.cz10a_bee - MySQL 8.0.35 with InnoDB, rel_native_lto build, cz10a_bee config
- my8035_rel_less.cz10a_bee - MySQL 8.0.35 with InnoDB, rel_less build, cz10a_bee config
- my8035_rel_lessps.cz10a_bee - MySQL 8.0.35 with InnoDB, rel_lessps build, cz10a_bee config
- my8035_rel.cz10aps0_bee - MySQL 8.0.35 with InnoDB, rel build, cz10aps0_bee config
- my8035_rel_lessps.cz10aps0_bee - MySQL 8.0.35 with InnoDB, rel build, cz10aps0_bee config
Contents
- Summary
- l.i0: load without secondary indexes
- l.x: create secondary indexes
- l.i1: continue load after secondary indexes created
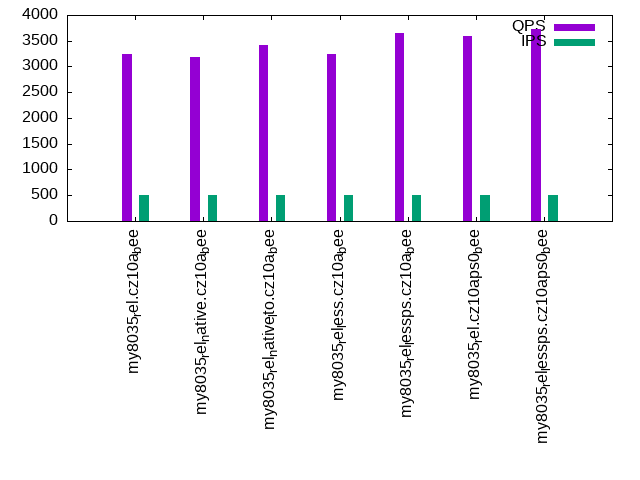
- q100.1: range queries with 100 insert/s per client
- q500.1: range queries with 500 insert/s per client
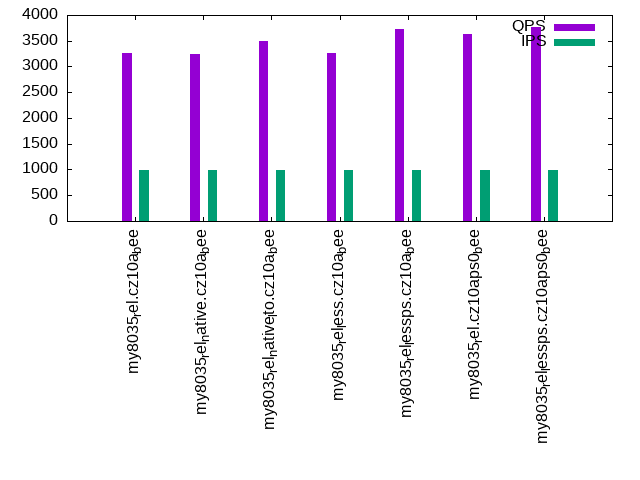
- q1000.1: range queries with 1000 insert/s per client
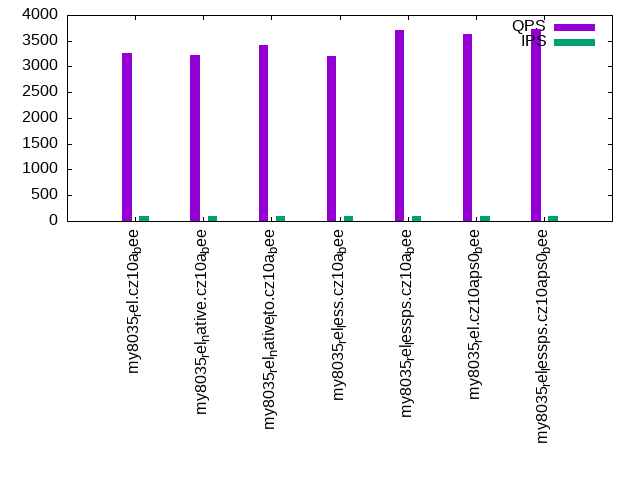
Summary
The numbers are inserts/s for l.i0 and l.i1, indexed docs (or rows) /s for l.x and queries/s for q*.2. The values are the average rate over the entire test for inserts (IPS) and queries (QPS). The range of values for IPS and QPS is split into 3 parts: bottom 25%, middle 50%, top 25%. Values in the bottom 25% have a red background, values in the top 25% have a green background and values in the middle have no color. A gray background is used for values that can be ignored because the DBMS did not sustain the target insert rate. Red backgrounds are not used when the minimum value is within 80% of the max value.
| dbms | l.i0 | l.x | l.i1 | q100.1 | q500.1 | q1000.1 |
|---|---|---|---|---|---|---|
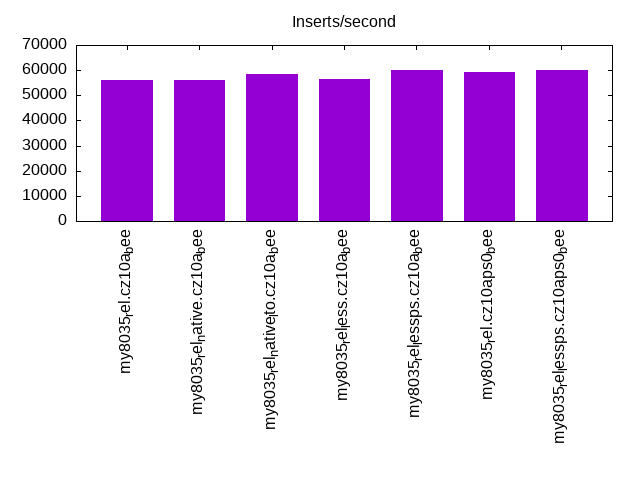
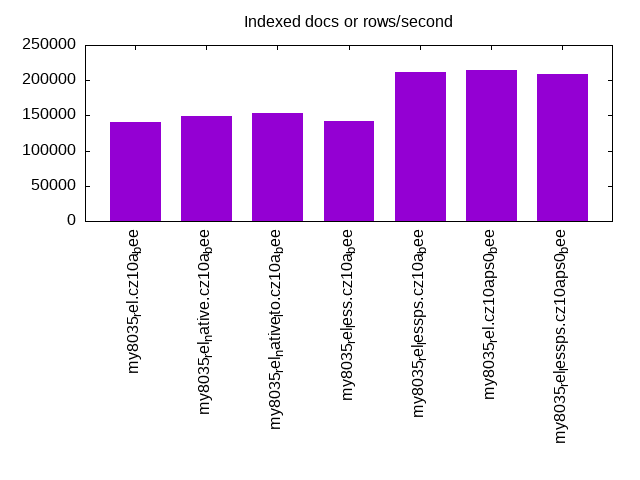
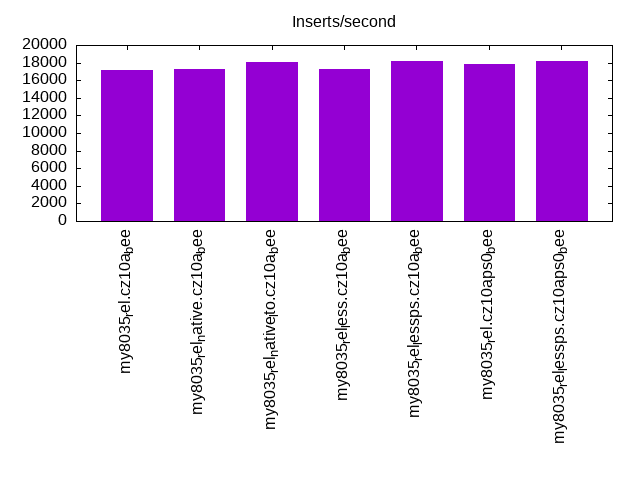
| my8035_rel.cz10a_bee | 56022 | 140559 | 17206 | 3261 | 3246 | 3267 |
| my8035_rel_native.cz10a_bee | 56022 | 148889 | 17271 | 3220 | 3180 | 3239 |
| my8035_rel_native_lto.cz10a_bee | 58480 | 153435 | 18064 | 3422 | 3420 | 3504 |
| my8035_rel_less.cz10a_bee | 56338 | 142553 | 17247 | 3203 | 3234 | 3253 |
| my8035_rel_lessps.cz10a_bee | 60241 | 211579 | 18175 | 3702 | 3660 | 3724 |
| my8035_rel.cz10aps0_bee | 59347 | 213830 | 17813 | 3639 | 3592 | 3628 |
| my8035_rel_lessps.cz10aps0_bee | 60060 | 209375 | 18215 | 3733 | 3725 | 3768 |
This table has relative throughput, throughput for the DBMS relative to the DBMS in the first line, using the absolute throughput from the previous table. Values less than 0.95 have a yellow background. Values greater than 1.05 have a blue background.
| dbms | l.i0 | l.x | l.i1 | q100.1 | q500.1 | q1000.1 |
|---|---|---|---|---|---|---|
| my8035_rel.cz10a_bee | 1.00 | 1.00 | 1.00 | 1.00 | 1.00 | 1.00 |
| my8035_rel_native.cz10a_bee | 1.00 | 1.06 | 1.00 | 0.99 | 0.98 | 0.99 |
| my8035_rel_native_lto.cz10a_bee | 1.04 | 1.09 | 1.05 | 1.05 | 1.05 | 1.07 |
| my8035_rel_less.cz10a_bee | 1.01 | 1.01 | 1.00 | 0.98 | 1.00 | 1.00 |
| my8035_rel_lessps.cz10a_bee | 1.08 | 1.51 | 1.06 | 1.14 | 1.13 | 1.14 |
| my8035_rel.cz10aps0_bee | 1.06 | 1.52 | 1.04 | 1.12 | 1.11 | 1.11 |
| my8035_rel_lessps.cz10aps0_bee | 1.07 | 1.49 | 1.06 | 1.14 | 1.15 | 1.15 |
This lists the average rate of inserts/s for the tests that do inserts concurrent with queries. For such tests the query rate is listed in the table above. The read+write tests are setup so that the insert rate should match the target rate every second. Cells that are not at least 95% of the target have a red background to indicate a failure to satisfy the target.
| dbms | q100.1 | q500.1 | q1000.1 |
|---|---|---|---|
| my8035_rel.cz10a_bee | 100 | 499 | 997 |
| my8035_rel_native.cz10a_bee | 100 | 498 | 997 |
| my8035_rel_native_lto.cz10a_bee | 100 | 499 | 998 |
| my8035_rel_less.cz10a_bee | 100 | 499 | 998 |
| my8035_rel_lessps.cz10a_bee | 100 | 498 | 997 |
| my8035_rel.cz10aps0_bee | 100 | 499 | 997 |
| my8035_rel_lessps.cz10aps0_bee | 100 | 499 | 998 |
| target | 100 | 500 | 1000 |
l.i0
l.i0: load without secondary indexes. Graphs for performance per 1-second interval are here.
Average throughput:
Insert response time histogram: each cell has the percentage of responses that take <= the time in the header and max is the max response time in seconds. For the max column values in the top 25% of the range have a red background and in the bottom 25% of the range have a green background. The red background is not used when the min value is within 80% of the max value.
| dbms | 256us | 1ms | 4ms | 16ms | 64ms | 256ms | 1s | 4s | 16s | gt | max |
|---|---|---|---|---|---|---|---|---|---|---|---|
| my8035_rel.cz10a_bee | 99.406 | 0.454 | 0.137 | 0.003 | 0.071 | ||||||
| my8035_rel_native.cz10a_bee | 99.408 | 0.452 | 0.137 | 0.003 | 0.072 | ||||||
| my8035_rel_native_lto.cz10a_bee | 99.422 | 0.446 | 0.128 | 0.003 | 0.071 | ||||||
| my8035_rel_less.cz10a_bee | 99.409 | 0.444 | 0.144 | 0.003 | 0.070 | ||||||
| my8035_rel_lessps.cz10a_bee | 99.438 | 0.411 | 0.148 | 0.003 | 0.087 | ||||||
| my8035_rel.cz10aps0_bee | 99.436 | 0.417 | 0.146 | 0.002 | 0.069 | ||||||
| my8035_rel_lessps.cz10aps0_bee | 99.443 | 0.404 | 0.151 | 0.003 | 0.071 |
Performance metrics for the DBMS listed above. Some are normalized by throughput, others are not. Legend for results is here.
ips	qps	rps	rmbps	wps	wmbps	rpq	rkbpq	wpi	wkbpi	csps	cpups	cspq	cpupq	dbgb1	dbgb2	rss	maxop	p50	p99	tag
56022	0	0	0.0	189.4	17.3	0.000	0.000	0.003	0.316	6219	20.0	0.111	29	1.3	17.9	2.5	0.071	56414	51444	20m.my8035_rel.cz10a_bee
56022	0	0	0.0	189.4	17.3	0.000	0.000	0.003	0.316	6226	19.9	0.111	28	1.3	17.9	2.5	0.072	56238	50750	20m.my8035_rel_native.cz10a_bee
58480	0	0	0.0	198.6	18.1	0.000	0.000	0.003	0.317	6518	20.4	0.111	28	1.3	17.9	2.4	0.071	58833	53045	20m.my8035_rel_native_lto.cz10a_bee
56338	0	0	0.0	190.7	17.4	0.000	0.000	0.003	0.316	6259	19.9	0.111	28	1.3	17.9	2.4	0.070	56661	51743	20m.my8035_rel_less.cz10a_bee
60241	0	0	0.0	205.0	18.6	0.000	0.000	0.003	0.316	6658	19.9	0.111	26	1.3	17.9	2.1	0.087	60732	54439	20m.my8035_rel_lessps.cz10a_bee
59347	0	0	0.0	201.6	18.3	0.000	0.000	0.003	0.317	6545	20.2	0.110	27	1.3	17.9	2.2	0.069	59846	53876	20m.my8035_rel.cz10aps0_bee
60060	0	0	0.0	201.8	18.5	0.000	0.000	0.003	0.315	6569	20.0	0.109	27	1.3	17.9	2.1	0.071	60234	54442	20m.my8035_rel_lessps.cz10aps0_bee
l.x
l.x: create secondary indexes.
Average throughput:
Performance metrics for the DBMS listed above. Some are normalized by throughput, others are not. Legend for results is here.
ips	qps	rps	rmbps	wps	wmbps	rpq	rkbpq	wpi	wkbpi	csps	cpups	cspq	cpupq	dbgb1	dbgb2	rss	maxop	p50	p99	tag
140559	0	706	45.9	2214.0	138.8	0.005	0.335	0.016	1.011	9323	42.4	0.066	24	3.0	19.5	3.1	0.020	NA	NA	20m.my8035_rel.cz10a_bee
148889	0	732	47.6	2960.7	154.9	0.005	0.328	0.020	1.065	10746	42.0	0.072	23	3.0	19.5	3.4	0.011	NA	NA	20m.my8035_rel_native.cz10a_bee
153435	0	760	49.5	2878.5	157.9	0.005	0.330	0.019	1.054	10729	42.2	0.070	22	3.0	19.5	3.6	0.019	NA	NA	20m.my8035_rel_native_lto.cz10a_bee
142553	0	706	46.0	2866.2	149.6	0.005	0.330	0.020	1.075	10495	42.3	0.074	24	3.0	19.5	3.1	0.012	NA	NA	20m.my8035_rel_less.cz10a_bee
211579	0	1043	67.7	4323.3	221.6	0.005	0.328	0.020	1.072	15207	40.2	0.072	15	3.0	19.5	3.5	0.019	NA	NA	20m.my8035_rel_lessps.cz10a_bee
213830	0	1098	71.5	3093.7	210.9	0.005	0.342	0.014	1.010	13118	41.3	0.061	15	3.0	19.5	3.7	0.019	NA	NA	20m.my8035_rel.cz10aps0_bee
209375	0	1040	67.7	4040.2	217.2	0.005	0.331	0.019	1.062	14688	40.3	0.070	15	3.0	19.5	3.5	0.011	NA	NA	20m.my8035_rel_lessps.cz10aps0_bee
l.i1
l.i1: continue load after secondary indexes created. Graphs for performance per 1-second interval are here.
Average throughput:
Insert response time histogram: each cell has the percentage of responses that take <= the time in the header and max is the max response time in seconds. For the max column values in the top 25% of the range have a red background and in the bottom 25% of the range have a green background. The red background is not used when the min value is within 80% of the max value.
| dbms | 256us | 1ms | 4ms | 16ms | 64ms | 256ms | 1s | 4s | 16s | gt | max |
|---|---|---|---|---|---|---|---|---|---|---|---|
| my8035_rel.cz10a_bee | 96.659 | 3.206 | 0.135 | 0.001 | 0.104 | ||||||
| my8035_rel_native.cz10a_bee | 96.766 | 3.101 | 0.131 | 0.001 | 0.107 | ||||||
| my8035_rel_native_lto.cz10a_bee | 96.808 | 3.057 | 0.135 | 0.001 | 0.104 | ||||||
| my8035_rel_less.cz10a_bee | 96.750 | 3.112 | 0.136 | 0.001 | 0.104 | ||||||
| my8035_rel_lessps.cz10a_bee | 96.864 | 2.997 | 0.138 | 0.001 | 0.106 | ||||||
| my8035_rel.cz10aps0_bee | 96.801 | 3.067 | 0.132 | 0.001 | 0.105 | ||||||
| my8035_rel_lessps.cz10aps0_bee | 96.914 | 2.945 | 0.140 | 0.001 | 0.077 |
Delete response time histogram: each cell has the percentage of responses that take <= the time in the header and max is the max response time in seconds. For the max column values in the top 25% of the range have a red background and in the bottom 25% of the range have a green background. The red background is not used when the min value is within 80% of the max value.
| dbms | 256us | 1ms | 4ms | 16ms | 64ms | 256ms | 1s | 4s | 16s | gt | max |
|---|---|---|---|---|---|---|---|---|---|---|---|
| my8035_rel.cz10a_bee | 97.896 | 2.054 | 0.049 | 0.001 | 0.103 | ||||||
| my8035_rel_native.cz10a_bee | 97.958 | 1.996 | 0.045 | 0.001 | 0.103 | ||||||
| my8035_rel_native_lto.cz10a_bee | 97.919 | 2.036 | 0.044 | nonzero | 0.103 | ||||||
| my8035_rel_less.cz10a_bee | 97.938 | 2.017 | 0.044 | 0.001 | 0.105 | ||||||
| my8035_rel_lessps.cz10a_bee | 97.919 | 2.036 | 0.044 | 0.001 | 0.105 | ||||||
| my8035_rel.cz10aps0_bee | 97.914 | 2.043 | 0.042 | 0.001 | 0.103 | ||||||
| my8035_rel_lessps.cz10aps0_bee | 97.934 | 2.020 | 0.046 | nonzero | 0.071 |
Performance metrics for the DBMS listed above. Some are normalized by throughput, others are not. Legend for results is here.
ips	qps	rps	rmbps	wps	wmbps	rpq	rkbpq	wpi	wkbpi	csps	cpups	cspq	cpupq	dbgb1	dbgb2	rss	maxop	p50	p99	tag
17206	0	32	0.5	2371.3	87.9	0.002	0.030	0.138	5.229	14581	36.3	0.847	169	4.3	21.0	5.6	0.104	17839	4894	20m.my8035_rel.cz10a_bee
17271	0	32	0.5	2270.4	85.5	0.002	0.030	0.131	5.070	14277	36.3	0.827	168	4.3	21.0	5.6	0.107	17930	5044	20m.my8035_rel_native.cz10a_bee
18064	0	33	0.5	2386.2	89.6	0.002	0.030	0.132	5.079	15054	36.6	0.833	162	4.3	21.1	5.6	0.104	18817	4746	20m.my8035_rel_native_lto.cz10a_bee
17247	0	32	0.5	2322.0	86.5	0.002	0.030	0.135	5.138	14435	36.4	0.837	169	4.3	21.1	5.6	0.104	17880	4945	20m.my8035_rel_less.cz10a_bee
18175	0	34	0.5	2446.0	91.0	0.002	0.030	0.135	5.130	15170	36.6	0.835	161	4.3	21.1	5.3	0.106	18929	4743	20m.my8035_rel_lessps.cz10a_bee
17813	0	33	0.5	2392.0	89.2	0.002	0.030	0.134	5.126	14863	36.6	0.834	164	4.3	21.1	5.4	0.105	18488	4644	20m.my8035_rel.cz10aps0_bee
18215	0	34	0.5	2422.1	90.4	0.002	0.030	0.133	5.083	15190	36.6	0.834	161	4.3	21.1	5.3	0.077	18929	4795	20m.my8035_rel_lessps.cz10aps0_bee
q100.1
q100.1: range queries with 100 insert/s per client. Graphs for performance per 1-second interval are here.
Average throughput:
Query response time histogram: each cell has the percentage of responses that take <= the time in the header and max is the max response time in seconds. For max values in the top 25% of the range have a red background and in the bottom 25% of the range have a green background. The red background is not used when the min value is within 80% of the max value.
| dbms | 256us | 1ms | 4ms | 16ms | 64ms | 256ms | 1s | 4s | 16s | gt | max |
|---|---|---|---|---|---|---|---|---|---|---|---|
| my8035_rel.cz10a_bee | 32.401 | 67.599 | nonzero | 0.003 | |||||||
| my8035_rel_native.cz10a_bee | 31.232 | 68.767 | 0.001 | nonzero | 0.005 | ||||||
| my8035_rel_native_lto.cz10a_bee | 43.662 | 56.337 | 0.001 | nonzero | 0.004 | ||||||
| my8035_rel_less.cz10a_bee | 30.007 | 69.993 | 0.001 | 0.003 | |||||||
| my8035_rel_lessps.cz10a_bee | 59.414 | 40.585 | nonzero | nonzero | 0.004 | ||||||
| my8035_rel.cz10aps0_bee | 57.117 | 42.882 | 0.001 | nonzero | 0.005 | ||||||
| my8035_rel_lessps.cz10aps0_bee | 60.846 | 39.153 | nonzero | 0.003 |
Insert response time histogram: each cell has the percentage of responses that take <= the time in the header and max is the max response time in seconds. For max values in the top 25% of the range have a red background and in the bottom 25% of the range have a green background. The red background is not used when the min value is within 80% of the max value.
| dbms | 256us | 1ms | 4ms | 16ms | 64ms | 256ms | 1s | 4s | 16s | gt | max |
|---|---|---|---|---|---|---|---|---|---|---|---|
| my8035_rel.cz10a_bee | 99.639 | 0.333 | 0.028 | 0.016 | |||||||
| my8035_rel_native.cz10a_bee | 99.556 | 0.444 | 0.015 | ||||||||
| my8035_rel_native_lto.cz10a_bee | 99.806 | 0.194 | 0.015 | ||||||||
| my8035_rel_less.cz10a_bee | 99.333 | 0.639 | 0.028 | 0.024 | |||||||
| my8035_rel_lessps.cz10a_bee | 99.833 | 0.167 | 0.015 | ||||||||
| my8035_rel.cz10aps0_bee | 99.750 | 0.250 | 0.010 | ||||||||
| my8035_rel_lessps.cz10aps0_bee | 99.778 | 0.222 | 0.014 |
Delete response time histogram: each cell has the percentage of responses that take <= the time in the header and max is the max response time in seconds. For max values in the top 25% of the range have a red background and in the bottom 25% of the range have a green background. The red background is not used when the min value is within 80% of the max value.
| dbms | 256us | 1ms | 4ms | 16ms | 64ms | 256ms | 1s | 4s | 16s | gt | max |
|---|---|---|---|---|---|---|---|---|---|---|---|
| my8035_rel.cz10a_bee | 99.833 | 0.167 | 0.013 | ||||||||
| my8035_rel_native.cz10a_bee | 99.667 | 0.333 | 0.008 | ||||||||
| my8035_rel_native_lto.cz10a_bee | 99.833 | 0.139 | 0.028 | 0.020 | |||||||
| my8035_rel_less.cz10a_bee | 99.667 | 0.306 | 0.028 | 0.024 | |||||||
| my8035_rel_lessps.cz10a_bee | 99.861 | 0.139 | 0.014 | ||||||||
| my8035_rel.cz10aps0_bee | 99.889 | 0.111 | 0.008 | ||||||||
| my8035_rel_lessps.cz10aps0_bee | 99.889 | 0.111 | 0.014 |
Performance metrics for the DBMS listed above. Some are normalized by throughput, others are not. Legend for results is here.
ips	qps	rps	rmbps	wps	wmbps	rpq	rkbpq	wpi	wkbpi	csps	cpups	cspq	cpupq	dbgb1	dbgb2	rss	maxop	p50	p99	tag
100	3261	0	0.0	89.2	2.2	0.000	0.000	0.894	22.300	13096	12.6	4.015	309	4.3	21.0	5.6	0.003	3244	3018	20m.my8035_rel.cz10a_bee
100	3220	0	0.0	90.4	2.2	0.000	0.000	0.906	22.524	12966	12.6	4.027	313	4.3	21.0	5.6	0.005	3212	2989	20m.my8035_rel_native.cz10a_bee
100	3422	0	0.0	90.5	2.2	0.000	0.000	0.907	22.620	13737	12.9	4.015	302	4.3	21.1	5.6	0.004	3405	3164	20m.my8035_rel_native_lto.cz10a_bee
100	3203	0	0.0	91.9	2.2	0.000	0.000	0.922	22.951	12905	12.6	4.030	315	4.3	21.1	5.6	0.003	3197	2991	20m.my8035_rel_less.cz10a_bee
100	3702	0	0.0	93.1	2.3	0.000	0.000	0.935	23.341	14834	13.1	4.007	283	4.3	21.1	5.3	0.004	3692	3403	20m.my8035_rel_lessps.cz10a_bee
100	3639	0	0.0	92.9	2.3	0.000	0.000	0.931	23.200	14567	13.0	4.003	286	4.3	21.1	5.4	0.005	3625	3356	20m.my8035_rel.cz10aps0_bee
100	3733	0	0.0	91.7	2.2	0.000	0.000	0.919	22.847	14915	13.0	3.996	279	4.3	21.1	5.3	0.003	3722	3435	20m.my8035_rel_lessps.cz10aps0_bee
q500.1
q500.1: range queries with 500 insert/s per client. Graphs for performance per 1-second interval are here.
Average throughput:
Query response time histogram: each cell has the percentage of responses that take <= the time in the header and max is the max response time in seconds. For max values in the top 25% of the range have a red background and in the bottom 25% of the range have a green background. The red background is not used when the min value is within 80% of the max value.
| dbms | 256us | 1ms | 4ms | 16ms | 64ms | 256ms | 1s | 4s | 16s | gt | max |
|---|---|---|---|---|---|---|---|---|---|---|---|
| my8035_rel.cz10a_bee | 31.557 | 68.442 | 0.001 | nonzero | 0.005 | ||||||
| my8035_rel_native.cz10a_bee | 28.881 | 71.118 | nonzero | 0.003 | |||||||
| my8035_rel_native_lto.cz10a_bee | 43.733 | 56.267 | nonzero | 0.004 | |||||||
| my8035_rel_less.cz10a_bee | 30.533 | 69.466 | nonzero | nonzero | 0.004 | ||||||
| my8035_rel_lessps.cz10a_bee | 57.492 | 42.508 | nonzero | 0.003 | |||||||
| my8035_rel.cz10aps0_bee | 55.058 | 44.942 | nonzero | 0.003 | |||||||
| my8035_rel_lessps.cz10aps0_bee | 60.556 | 39.444 | nonzero | 0.003 |
Insert response time histogram: each cell has the percentage of responses that take <= the time in the header and max is the max response time in seconds. For max values in the top 25% of the range have a red background and in the bottom 25% of the range have a green background. The red background is not used when the min value is within 80% of the max value.
| dbms | 256us | 1ms | 4ms | 16ms | 64ms | 256ms | 1s | 4s | 16s | gt | max |
|---|---|---|---|---|---|---|---|---|---|---|---|
| my8035_rel.cz10a_bee | 99.389 | 0.600 | 0.011 | 0.025 | |||||||
| my8035_rel_native.cz10a_bee | 99.300 | 0.683 | 0.017 | 0.036 | |||||||
| my8035_rel_native_lto.cz10a_bee | 99.622 | 0.372 | 0.006 | 0.026 | |||||||
| my8035_rel_less.cz10a_bee | 99.378 | 0.611 | 0.011 | 0.025 | |||||||
| my8035_rel_lessps.cz10a_bee | 99.817 | 0.178 | 0.006 | 0.025 | |||||||
| my8035_rel.cz10aps0_bee | 99.583 | 0.417 | 0.015 | ||||||||
| my8035_rel_lessps.cz10aps0_bee | 99.367 | 0.622 | 0.011 | 0.025 |
Delete response time histogram: each cell has the percentage of responses that take <= the time in the header and max is the max response time in seconds. For max values in the top 25% of the range have a red background and in the bottom 25% of the range have a green background. The red background is not used when the min value is within 80% of the max value.
| dbms | 256us | 1ms | 4ms | 16ms | 64ms | 256ms | 1s | 4s | 16s | gt | max |
|---|---|---|---|---|---|---|---|---|---|---|---|
| my8035_rel.cz10a_bee | 99.733 | 0.256 | 0.011 | 0.024 | |||||||
| my8035_rel_native.cz10a_bee | 99.656 | 0.333 | 0.011 | 0.033 | |||||||
| my8035_rel_native_lto.cz10a_bee | 99.806 | 0.194 | 0.016 | ||||||||
| my8035_rel_less.cz10a_bee | 99.628 | 0.367 | 0.006 | 0.025 | |||||||
| my8035_rel_lessps.cz10a_bee | 99.889 | 0.106 | 0.006 | 0.023 | |||||||
| my8035_rel.cz10aps0_bee | 99.800 | 0.200 | 0.015 | ||||||||
| my8035_rel_lessps.cz10aps0_bee | 99.572 | 0.422 | 0.006 | 0.024 |
Performance metrics for the DBMS listed above. Some are normalized by throughput, others are not. Legend for results is here.
ips	qps	rps	rmbps	wps	wmbps	rpq	rkbpq	wpi	wkbpi	csps	cpups	cspq	cpupq	dbgb1	dbgb2	rss	maxop	p50	p99	tag
499	3246	0	0.0	45.6	1.6	0.000	0.000	0.091	3.337	13021	13.5	4.012	333	4.3	21.0	5.6	0.005	3229	3020	20m.my8035_rel.cz10a_bee
498	3180	0	0.0	35.5	1.4	0.000	0.000	0.071	2.796	12744	13.4	4.007	337	4.3	21.0	5.6	0.003	3180	2989	20m.my8035_rel_native.cz10a_bee
499	3420	0	0.0	35.3	1.4	0.000	0.000	0.071	2.780	13649	13.9	3.990	325	4.3	21.1	5.6	0.004	3407	3180	20m.my8035_rel_native_lto.cz10a_bee
499	3234	0	0.0	36.7	1.4	0.000	0.000	0.074	2.863	12951	13.5	4.004	334	4.3	21.1	5.6	0.004	3228	3021	20m.my8035_rel_less.cz10a_bee
498	3660	0	0.0	37.7	1.4	0.000	0.000	0.076	2.916	14598	13.8	3.989	302	4.3	21.1	5.3	0.003	3645	3372	20m.my8035_rel_lessps.cz10a_bee
499	3592	0	0.0	32.7	1.3	0.000	0.000	0.066	2.646	14307	13.9	3.983	310	4.3	21.1	5.4	0.003	3580	3307	20m.my8035_rel.cz10aps0_bee
499	3725	0	0.0	32.7	1.3	0.000	0.000	0.066	2.623	14798	13.7	3.972	294	4.3	21.1	5.3	0.003	3707	3407	20m.my8035_rel_lessps.cz10aps0_bee
q1000.1
q1000.1: range queries with 1000 insert/s per client. Graphs for performance per 1-second interval are here.
Average throughput:
Query response time histogram: each cell has the percentage of responses that take <= the time in the header and max is the max response time in seconds. For max values in the top 25% of the range have a red background and in the bottom 25% of the range have a green background. The red background is not used when the min value is within 80% of the max value.
| dbms | 256us | 1ms | 4ms | 16ms | 64ms | 256ms | 1s | 4s | 16s | gt | max |
|---|---|---|---|---|---|---|---|---|---|---|---|
| my8035_rel.cz10a_bee | 33.728 | 66.270 | 0.002 | nonzero | 0.004 | ||||||
| my8035_rel_native.cz10a_bee | 31.938 | 68.060 | 0.002 | nonzero | 0.006 | ||||||
| my8035_rel_native_lto.cz10a_bee | 48.224 | 51.774 | 0.002 | nonzero | 0.004 | ||||||
| my8035_rel_less.cz10a_bee | 32.692 | 67.306 | 0.002 | nonzero | 0.006 | ||||||
| my8035_rel_lessps.cz10a_bee | 60.240 | 39.758 | 0.002 | nonzero | 0.006 | ||||||
| my8035_rel.cz10aps0_bee | 56.356 | 43.642 | 0.002 | nonzero | 0.004 | ||||||
| my8035_rel_lessps.cz10aps0_bee | 61.798 | 38.200 | 0.001 | 0.004 |
Insert response time histogram: each cell has the percentage of responses that take <= the time in the header and max is the max response time in seconds. For max values in the top 25% of the range have a red background and in the bottom 25% of the range have a green background. The red background is not used when the min value is within 80% of the max value.
| dbms | 256us | 1ms | 4ms | 16ms | 64ms | 256ms | 1s | 4s | 16s | gt | max |
|---|---|---|---|---|---|---|---|---|---|---|---|
| my8035_rel.cz10a_bee | 97.719 | 2.261 | 0.019 | 0.051 | |||||||
| my8035_rel_native.cz10a_bee | 98.011 | 1.978 | 0.011 | 0.043 | |||||||
| my8035_rel_native_lto.cz10a_bee | 98.411 | 1.564 | 0.025 | 0.050 | |||||||
| my8035_rel_less.cz10a_bee | 97.600 | 2.386 | 0.014 | 0.040 | |||||||
| my8035_rel_lessps.cz10a_bee | 98.597 | 1.392 | 0.011 | 0.055 | |||||||
| my8035_rel.cz10aps0_bee | 98.322 | 1.658 | 0.019 | 0.041 | |||||||
| my8035_rel_lessps.cz10aps0_bee | 98.739 | 1.247 | 0.014 | 0.040 |
Delete response time histogram: each cell has the percentage of responses that take <= the time in the header and max is the max response time in seconds. For max values in the top 25% of the range have a red background and in the bottom 25% of the range have a green background. The red background is not used when the min value is within 80% of the max value.
| dbms | 256us | 1ms | 4ms | 16ms | 64ms | 256ms | 1s | 4s | 16s | gt | max |
|---|---|---|---|---|---|---|---|---|---|---|---|
| my8035_rel.cz10a_bee | 99.547 | 0.450 | 0.003 | 0.024 | |||||||
| my8035_rel_native.cz10a_bee | 99.508 | 0.483 | 0.008 | 0.035 | |||||||
| my8035_rel_native_lto.cz10a_bee | 99.319 | 0.664 | 0.017 | 0.040 | |||||||
| my8035_rel_less.cz10a_bee | 99.694 | 0.294 | 0.011 | 0.049 | |||||||
| my8035_rel_lessps.cz10a_bee | 99.475 | 0.519 | 0.006 | 0.023 | |||||||
| my8035_rel.cz10aps0_bee | 99.656 | 0.339 | 0.006 | 0.049 | |||||||
| my8035_rel_lessps.cz10aps0_bee | 99.614 | 0.378 | 0.008 | 0.049 |
Performance metrics for the DBMS listed above. Some are normalized by throughput, others are not. Legend for results is here.
ips	qps	rps	rmbps	wps	wmbps	rpq	rkbpq	wpi	wkbpi	csps	cpups	cspq	cpupq	dbgb1	dbgb2	rss	maxop	p50	p99	tag
997	3267	0	0.0	188.4	5.9	0.000	0.000	0.189	6.019	13701	14.8	4.193	362	4.3	21.0	5.6	0.004	3260	3021	20m.my8035_rel.cz10a_bee
997	3239	0	0.0	203.8	6.3	0.000	0.000	0.205	6.425	13650	14.8	4.214	366	4.3	21.0	5.6	0.006	3229	3005	20m.my8035_rel_native.cz10a_bee
998	3504	0	0.0	206.8	6.3	0.000	0.000	0.207	6.501	14674	15.0	4.188	342	4.3	21.1	5.6	0.004	3484	3196	20m.my8035_rel_native_lto.cz10a_bee
998	3253	0	0.0	202.2	6.2	0.000	0.000	0.203	6.375	13694	14.9	4.210	366	4.3	21.1	5.6	0.006	3246	3021	20m.my8035_rel_less.cz10a_bee
997	3724	0	0.0	198.1	6.1	0.000	0.000	0.199	6.272	15479	15.0	4.156	322	4.3	21.1	5.3	0.006	3692	3390	20m.my8035_rel_lessps.cz10a_bee
997	3628	0	0.0	205.6	6.3	0.000	0.000	0.206	6.472	15121	15.1	4.168	333	4.3	21.1	5.4	0.004	3611	3307	20m.my8035_rel.cz10aps0_bee
998	3768	0	0.0	207.7	6.4	0.000	0.000	0.208	6.522	15660	15.0	4.156	318	4.3	21.1	5.3	0.004	3727	3419	20m.my8035_rel_lessps.cz10aps0_bee
l.i0
l.i0: load without secondary indexes
Performance metrics for all DBMS, not just the ones listed above. Some are normalized by throughput, others are not. Legend for results is here.
ips	qps	rps	rmbps	wps	wmbps	rpq	rkbpq	wpi	wkbpi	csps	cpups	cspq	cpupq	dbgb1	dbgb2	rss	maxop	p50	p99	tag
56022	0	0	0.0	189.4	17.3	0.000	0.000	0.003	0.316	6219	20.0	0.111	29	1.3	17.9	2.5	0.071	56414	51444	20m.my8035_rel.cz10a_bee
56022	0	0	0.0	189.4	17.3	0.000	0.000	0.003	0.316	6226	19.9	0.111	28	1.3	17.9	2.5	0.072	56238	50750	20m.my8035_rel_native.cz10a_bee
58480	0	0	0.0	198.6	18.1	0.000	0.000	0.003	0.317	6518	20.4	0.111	28	1.3	17.9	2.4	0.071	58833	53045	20m.my8035_rel_native_lto.cz10a_bee
56338	0	0	0.0	190.7	17.4	0.000	0.000	0.003	0.316	6259	19.9	0.111	28	1.3	17.9	2.4	0.070	56661	51743	20m.my8035_rel_less.cz10a_bee
60241	0	0	0.0	205.0	18.6	0.000	0.000	0.003	0.316	6658	19.9	0.111	26	1.3	17.9	2.1	0.087	60732	54439	20m.my8035_rel_lessps.cz10a_bee
59347	0	0	0.0	201.6	18.3	0.000	0.000	0.003	0.317	6545	20.2	0.110	27	1.3	17.9	2.2	0.069	59846	53876	20m.my8035_rel.cz10aps0_bee
60060	0	0	0.0	201.8	18.5	0.000	0.000	0.003	0.315	6569	20.0	0.109	27	1.3	17.9	2.1	0.071	60234	54442	20m.my8035_rel_lessps.cz10aps0_bee
l.x
l.x: create secondary indexes
Performance metrics for all DBMS, not just the ones listed above. Some are normalized by throughput, others are not. Legend for results is here.
ips	qps	rps	rmbps	wps	wmbps	rpq	rkbpq	wpi	wkbpi	csps	cpups	cspq	cpupq	dbgb1	dbgb2	rss	maxop	p50	p99	tag
140559	0	706	45.9	2214.0	138.8	0.005	0.335	0.016	1.011	9323	42.4	0.066	24	3.0	19.5	3.1	0.020	NA	NA	20m.my8035_rel.cz10a_bee
148889	0	732	47.6	2960.7	154.9	0.005	0.328	0.020	1.065	10746	42.0	0.072	23	3.0	19.5	3.4	0.011	NA	NA	20m.my8035_rel_native.cz10a_bee
153435	0	760	49.5	2878.5	157.9	0.005	0.330	0.019	1.054	10729	42.2	0.070	22	3.0	19.5	3.6	0.019	NA	NA	20m.my8035_rel_native_lto.cz10a_bee
142553	0	706	46.0	2866.2	149.6	0.005	0.330	0.020	1.075	10495	42.3	0.074	24	3.0	19.5	3.1	0.012	NA	NA	20m.my8035_rel_less.cz10a_bee
211579	0	1043	67.7	4323.3	221.6	0.005	0.328	0.020	1.072	15207	40.2	0.072	15	3.0	19.5	3.5	0.019	NA	NA	20m.my8035_rel_lessps.cz10a_bee
213830	0	1098	71.5	3093.7	210.9	0.005	0.342	0.014	1.010	13118	41.3	0.061	15	3.0	19.5	3.7	0.019	NA	NA	20m.my8035_rel.cz10aps0_bee
209375	0	1040	67.7	4040.2	217.2	0.005	0.331	0.019	1.062	14688	40.3	0.070	15	3.0	19.5	3.5	0.011	NA	NA	20m.my8035_rel_lessps.cz10aps0_bee
l.i1
l.i1: continue load after secondary indexes created
Performance metrics for all DBMS, not just the ones listed above. Some are normalized by throughput, others are not. Legend for results is here.
ips	qps	rps	rmbps	wps	wmbps	rpq	rkbpq	wpi	wkbpi	csps	cpups	cspq	cpupq	dbgb1	dbgb2	rss	maxop	p50	p99	tag
17206	0	32	0.5	2371.3	87.9	0.002	0.030	0.138	5.229	14581	36.3	0.847	169	4.3	21.0	5.6	0.104	17839	4894	20m.my8035_rel.cz10a_bee
17271	0	32	0.5	2270.4	85.5	0.002	0.030	0.131	5.070	14277	36.3	0.827	168	4.3	21.0	5.6	0.107	17930	5044	20m.my8035_rel_native.cz10a_bee
18064	0	33	0.5	2386.2	89.6	0.002	0.030	0.132	5.079	15054	36.6	0.833	162	4.3	21.1	5.6	0.104	18817	4746	20m.my8035_rel_native_lto.cz10a_bee
17247	0	32	0.5	2322.0	86.5	0.002	0.030	0.135	5.138	14435	36.4	0.837	169	4.3	21.1	5.6	0.104	17880	4945	20m.my8035_rel_less.cz10a_bee
18175	0	34	0.5	2446.0	91.0	0.002	0.030	0.135	5.130	15170	36.6	0.835	161	4.3	21.1	5.3	0.106	18929	4743	20m.my8035_rel_lessps.cz10a_bee
17813	0	33	0.5	2392.0	89.2	0.002	0.030	0.134	5.126	14863	36.6	0.834	164	4.3	21.1	5.4	0.105	18488	4644	20m.my8035_rel.cz10aps0_bee
18215	0	34	0.5	2422.1	90.4	0.002	0.030	0.133	5.083	15190	36.6	0.834	161	4.3	21.1	5.3	0.077	18929	4795	20m.my8035_rel_lessps.cz10aps0_bee
q100.1
q100.1: range queries with 100 insert/s per client
Performance metrics for all DBMS, not just the ones listed above. Some are normalized by throughput, others are not. Legend for results is here.
ips	qps	rps	rmbps	wps	wmbps	rpq	rkbpq	wpi	wkbpi	csps	cpups	cspq	cpupq	dbgb1	dbgb2	rss	maxop	p50	p99	tag
100	3261	0	0.0	89.2	2.2	0.000	0.000	0.894	22.300	13096	12.6	4.015	309	4.3	21.0	5.6	0.003	3244	3018	20m.my8035_rel.cz10a_bee
100	3220	0	0.0	90.4	2.2	0.000	0.000	0.906	22.524	12966	12.6	4.027	313	4.3	21.0	5.6	0.005	3212	2989	20m.my8035_rel_native.cz10a_bee
100	3422	0	0.0	90.5	2.2	0.000	0.000	0.907	22.620	13737	12.9	4.015	302	4.3	21.1	5.6	0.004	3405	3164	20m.my8035_rel_native_lto.cz10a_bee
100	3203	0	0.0	91.9	2.2	0.000	0.000	0.922	22.951	12905	12.6	4.030	315	4.3	21.1	5.6	0.003	3197	2991	20m.my8035_rel_less.cz10a_bee
100	3702	0	0.0	93.1	2.3	0.000	0.000	0.935	23.341	14834	13.1	4.007	283	4.3	21.1	5.3	0.004	3692	3403	20m.my8035_rel_lessps.cz10a_bee
100	3639	0	0.0	92.9	2.3	0.000	0.000	0.931	23.200	14567	13.0	4.003	286	4.3	21.1	5.4	0.005	3625	3356	20m.my8035_rel.cz10aps0_bee
100	3733	0	0.0	91.7	2.2	0.000	0.000	0.919	22.847	14915	13.0	3.996	279	4.3	21.1	5.3	0.003	3722	3435	20m.my8035_rel_lessps.cz10aps0_bee
q500.1
q500.1: range queries with 500 insert/s per client
Performance metrics for all DBMS, not just the ones listed above. Some are normalized by throughput, others are not. Legend for results is here.
ips	qps	rps	rmbps	wps	wmbps	rpq	rkbpq	wpi	wkbpi	csps	cpups	cspq	cpupq	dbgb1	dbgb2	rss	maxop	p50	p99	tag
499	3246	0	0.0	45.6	1.6	0.000	0.000	0.091	3.337	13021	13.5	4.012	333	4.3	21.0	5.6	0.005	3229	3020	20m.my8035_rel.cz10a_bee
498	3180	0	0.0	35.5	1.4	0.000	0.000	0.071	2.796	12744	13.4	4.007	337	4.3	21.0	5.6	0.003	3180	2989	20m.my8035_rel_native.cz10a_bee
499	3420	0	0.0	35.3	1.4	0.000	0.000	0.071	2.780	13649	13.9	3.990	325	4.3	21.1	5.6	0.004	3407	3180	20m.my8035_rel_native_lto.cz10a_bee
499	3234	0	0.0	36.7	1.4	0.000	0.000	0.074	2.863	12951	13.5	4.004	334	4.3	21.1	5.6	0.004	3228	3021	20m.my8035_rel_less.cz10a_bee
498	3660	0	0.0	37.7	1.4	0.000	0.000	0.076	2.916	14598	13.8	3.989	302	4.3	21.1	5.3	0.003	3645	3372	20m.my8035_rel_lessps.cz10a_bee
499	3592	0	0.0	32.7	1.3	0.000	0.000	0.066	2.646	14307	13.9	3.983	310	4.3	21.1	5.4	0.003	3580	3307	20m.my8035_rel.cz10aps0_bee
499	3725	0	0.0	32.7	1.3	0.000	0.000	0.066	2.623	14798	13.7	3.972	294	4.3	21.1	5.3	0.003	3707	3407	20m.my8035_rel_lessps.cz10aps0_bee
q1000.1
q1000.1: range queries with 1000 insert/s per client
Performance metrics for all DBMS, not just the ones listed above. Some are normalized by throughput, others are not. Legend for results is here.
ips	qps	rps	rmbps	wps	wmbps	rpq	rkbpq	wpi	wkbpi	csps	cpups	cspq	cpupq	dbgb1	dbgb2	rss	maxop	p50	p99	tag
997	3267	0	0.0	188.4	5.9	0.000	0.000	0.189	6.019	13701	14.8	4.193	362	4.3	21.0	5.6	0.004	3260	3021	20m.my8035_rel.cz10a_bee
997	3239	0	0.0	203.8	6.3	0.000	0.000	0.205	6.425	13650	14.8	4.214	366	4.3	21.0	5.6	0.006	3229	3005	20m.my8035_rel_native.cz10a_bee
998	3504	0	0.0	206.8	6.3	0.000	0.000	0.207	6.501	14674	15.0	4.188	342	4.3	21.1	5.6	0.004	3484	3196	20m.my8035_rel_native_lto.cz10a_bee
998	3253	0	0.0	202.2	6.2	0.000	0.000	0.203	6.375	13694	14.9	4.210	366	4.3	21.1	5.6	0.006	3246	3021	20m.my8035_rel_less.cz10a_bee
997	3724	0	0.0	198.1	6.1	0.000	0.000	0.199	6.272	15479	15.0	4.156	322	4.3	21.1	5.3	0.006	3692	3390	20m.my8035_rel_lessps.cz10a_bee
997	3628	0	0.0	205.6	6.3	0.000	0.000	0.206	6.472	15121	15.1	4.168	333	4.3	21.1	5.4	0.004	3611	3307	20m.my8035_rel.cz10aps0_bee
998	3768	0	0.0	207.7	6.4	0.000	0.000	0.208	6.522	15660	15.0	4.156	318	4.3	21.1	5.3	0.004	3727	3419	20m.my8035_rel_lessps.cz10aps0_bee
l.i0
- l.i0: load without secondary indexes
- Legend for results is here.
- Each entry lists the percentage of responses that fit in that bucket (slower than max time for previous bucket, faster than min time for next bucket).
Insert response time histogram
256us	1ms	4ms	16ms	64ms	256ms	1s	4s	16s	gt	max	tag
0.000	0.000	99.406	0.454	0.137	0.003	0.000	0.000	0.000	0.000	0.071	my8035_rel.cz10a_bee
0.000	0.000	99.408	0.452	0.137	0.003	0.000	0.000	0.000	0.000	0.072	my8035_rel_native.cz10a_bee
0.000	0.000	99.422	0.446	0.128	0.003	0.000	0.000	0.000	0.000	0.071	my8035_rel_native_lto.cz10a_bee
0.000	0.000	99.409	0.444	0.144	0.003	0.000	0.000	0.000	0.000	0.070	my8035_rel_less.cz10a_bee
0.000	0.000	99.438	0.411	0.148	0.003	0.000	0.000	0.000	0.000	0.087	my8035_rel_lessps.cz10a_bee
0.000	0.000	99.436	0.417	0.146	0.002	0.000	0.000	0.000	0.000	0.069	my8035_rel.cz10aps0_bee
0.000	0.000	99.443	0.404	0.151	0.003	0.000	0.000	0.000	0.000	0.071	my8035_rel_lessps.cz10aps0_bee
l.x
- l.x: create secondary indexes
- Legend for results is here.
- Each entry lists the percentage of responses that fit in that bucket (slower than max time for previous bucket, faster than min time for next bucket).
TODO - determine whether there is data for create index response time
l.i1
- l.i1: continue load after secondary indexes created
- Legend for results is here.
- Each entry lists the percentage of responses that fit in that bucket (slower than max time for previous bucket, faster than min time for next bucket).
Insert response time histogram
256us	1ms	4ms	16ms	64ms	256ms	1s	4s	16s	gt	max	tag
0.000	0.000	96.659	3.206	0.135	0.001	0.000	0.000	0.000	0.000	0.104	my8035_rel.cz10a_bee
0.000	0.000	96.766	3.101	0.131	0.001	0.000	0.000	0.000	0.000	0.107	my8035_rel_native.cz10a_bee
0.000	0.000	96.808	3.057	0.135	0.001	0.000	0.000	0.000	0.000	0.104	my8035_rel_native_lto.cz10a_bee
0.000	0.000	96.750	3.112	0.136	0.001	0.000	0.000	0.000	0.000	0.104	my8035_rel_less.cz10a_bee
0.000	0.000	96.864	2.997	0.138	0.001	0.000	0.000	0.000	0.000	0.106	my8035_rel_lessps.cz10a_bee
0.000	0.000	96.801	3.067	0.132	0.001	0.000	0.000	0.000	0.000	0.105	my8035_rel.cz10aps0_bee
0.000	0.000	96.914	2.945	0.140	0.001	0.000	0.000	0.000	0.000	0.077	my8035_rel_lessps.cz10aps0_bee
Delete response time histogram
256us	1ms	4ms	16ms	64ms	256ms	1s	4s	16s	gt	max	tag
0.000	0.000	97.896	2.054	0.049	0.001	0.000	0.000	0.000	0.000	0.103	my8035_rel.cz10a_bee
0.000	0.000	97.958	1.996	0.045	0.001	0.000	0.000	0.000	0.000	0.103	my8035_rel_native.cz10a_bee
0.000	0.000	97.919	2.036	0.044	nonzero	0.000	0.000	0.000	0.000	0.103	my8035_rel_native_lto.cz10a_bee
0.000	0.000	97.938	2.017	0.044	0.001	0.000	0.000	0.000	0.000	0.105	my8035_rel_less.cz10a_bee
0.000	0.000	97.919	2.036	0.044	0.001	0.000	0.000	0.000	0.000	0.105	my8035_rel_lessps.cz10a_bee
0.000	0.000	97.914	2.043	0.042	0.001	0.000	0.000	0.000	0.000	0.103	my8035_rel.cz10aps0_bee
0.000	0.000	97.934	2.020	0.046	nonzero	0.000	0.000	0.000	0.000	0.071	my8035_rel_lessps.cz10aps0_bee
q100.1
- q100.1: range queries with 100 insert/s per client
- Legend for results is here.
- Each entry lists the percentage of responses that fit in that bucket (slower than max time for previous bucket, faster than min time for next bucket).
Query response time histogram
256us	1ms	4ms	16ms	64ms	256ms	1s	4s	16s	gt	max	tag
32.401	67.599	nonzero	0.000	0.000	0.000	0.000	0.000	0.000	0.000	0.003	my8035_rel.cz10a_bee
31.232	68.767	0.001	nonzero	0.000	0.000	0.000	0.000	0.000	0.000	0.005	my8035_rel_native.cz10a_bee
43.662	56.337	0.001	nonzero	0.000	0.000	0.000	0.000	0.000	0.000	0.004	my8035_rel_native_lto.cz10a_bee
30.007	69.993	0.001	0.000	0.000	0.000	0.000	0.000	0.000	0.000	0.003	my8035_rel_less.cz10a_bee
59.414	40.585	nonzero	nonzero	0.000	0.000	0.000	0.000	0.000	0.000	0.004	my8035_rel_lessps.cz10a_bee
57.117	42.882	0.001	nonzero	0.000	0.000	0.000	0.000	0.000	0.000	0.005	my8035_rel.cz10aps0_bee
60.846	39.153	nonzero	0.000	0.000	0.000	0.000	0.000	0.000	0.000	0.003	my8035_rel_lessps.cz10aps0_bee
Insert response time histogram
256us	1ms	4ms	16ms	64ms	256ms	1s	4s	16s	gt	max	tag
0.000	0.000	99.639	0.333	0.028	0.000	0.000	0.000	0.000	0.000	0.016	my8035_rel.cz10a_bee
0.000	0.000	99.556	0.444	0.000	0.000	0.000	0.000	0.000	0.000	0.015	my8035_rel_native.cz10a_bee
0.000	0.000	99.806	0.194	0.000	0.000	0.000	0.000	0.000	0.000	0.015	my8035_rel_native_lto.cz10a_bee
0.000	0.000	99.333	0.639	0.028	0.000	0.000	0.000	0.000	0.000	0.024	my8035_rel_less.cz10a_bee
0.000	0.000	99.833	0.167	0.000	0.000	0.000	0.000	0.000	0.000	0.015	my8035_rel_lessps.cz10a_bee
0.000	0.000	99.750	0.250	0.000	0.000	0.000	0.000	0.000	0.000	0.010	my8035_rel.cz10aps0_bee
0.000	0.000	99.778	0.222	0.000	0.000	0.000	0.000	0.000	0.000	0.014	my8035_rel_lessps.cz10aps0_bee
Delete response time histogram
256us	1ms	4ms	16ms	64ms	256ms	1s	4s	16s	gt	max	tag
0.000	0.000	99.833	0.167	0.000	0.000	0.000	0.000	0.000	0.000	0.013	my8035_rel.cz10a_bee
0.000	0.000	99.667	0.333	0.000	0.000	0.000	0.000	0.000	0.000	0.008	my8035_rel_native.cz10a_bee
0.000	0.000	99.833	0.139	0.028	0.000	0.000	0.000	0.000	0.000	0.020	my8035_rel_native_lto.cz10a_bee
0.000	0.000	99.667	0.306	0.028	0.000	0.000	0.000	0.000	0.000	0.024	my8035_rel_less.cz10a_bee
0.000	0.000	99.861	0.139	0.000	0.000	0.000	0.000	0.000	0.000	0.014	my8035_rel_lessps.cz10a_bee
0.000	0.000	99.889	0.111	0.000	0.000	0.000	0.000	0.000	0.000	0.008	my8035_rel.cz10aps0_bee
0.000	0.000	99.889	0.111	0.000	0.000	0.000	0.000	0.000	0.000	0.014	my8035_rel_lessps.cz10aps0_bee
q500.1
- q500.1: range queries with 500 insert/s per client
- Legend for results is here.
- Each entry lists the percentage of responses that fit in that bucket (slower than max time for previous bucket, faster than min time for next bucket).
Query response time histogram
256us	1ms	4ms	16ms	64ms	256ms	1s	4s	16s	gt	max	tag
31.557	68.442	0.001	nonzero	0.000	0.000	0.000	0.000	0.000	0.000	0.005	my8035_rel.cz10a_bee
28.881	71.118	nonzero	0.000	0.000	0.000	0.000	0.000	0.000	0.000	0.003	my8035_rel_native.cz10a_bee
43.733	56.267	nonzero	0.000	0.000	0.000	0.000	0.000	0.000	0.000	0.004	my8035_rel_native_lto.cz10a_bee
30.533	69.466	nonzero	nonzero	0.000	0.000	0.000	0.000	0.000	0.000	0.004	my8035_rel_less.cz10a_bee
57.492	42.508	nonzero	0.000	0.000	0.000	0.000	0.000	0.000	0.000	0.003	my8035_rel_lessps.cz10a_bee
55.058	44.942	nonzero	0.000	0.000	0.000	0.000	0.000	0.000	0.000	0.003	my8035_rel.cz10aps0_bee
60.556	39.444	nonzero	0.000	0.000	0.000	0.000	0.000	0.000	0.000	0.003	my8035_rel_lessps.cz10aps0_bee
Insert response time histogram
256us	1ms	4ms	16ms	64ms	256ms	1s	4s	16s	gt	max	tag
0.000	0.000	99.389	0.600	0.011	0.000	0.000	0.000	0.000	0.000	0.025	my8035_rel.cz10a_bee
0.000	0.000	99.300	0.683	0.017	0.000	0.000	0.000	0.000	0.000	0.036	my8035_rel_native.cz10a_bee
0.000	0.000	99.622	0.372	0.006	0.000	0.000	0.000	0.000	0.000	0.026	my8035_rel_native_lto.cz10a_bee
0.000	0.000	99.378	0.611	0.011	0.000	0.000	0.000	0.000	0.000	0.025	my8035_rel_less.cz10a_bee
0.000	0.000	99.817	0.178	0.006	0.000	0.000	0.000	0.000	0.000	0.025	my8035_rel_lessps.cz10a_bee
0.000	0.000	99.583	0.417	0.000	0.000	0.000	0.000	0.000	0.000	0.015	my8035_rel.cz10aps0_bee
0.000	0.000	99.367	0.622	0.011	0.000	0.000	0.000	0.000	0.000	0.025	my8035_rel_lessps.cz10aps0_bee
Delete response time histogram
256us	1ms	4ms	16ms	64ms	256ms	1s	4s	16s	gt	max	tag
0.000	0.000	99.733	0.256	0.011	0.000	0.000	0.000	0.000	0.000	0.024	my8035_rel.cz10a_bee
0.000	0.000	99.656	0.333	0.011	0.000	0.000	0.000	0.000	0.000	0.033	my8035_rel_native.cz10a_bee
0.000	0.000	99.806	0.194	0.000	0.000	0.000	0.000	0.000	0.000	0.016	my8035_rel_native_lto.cz10a_bee
0.000	0.000	99.628	0.367	0.006	0.000	0.000	0.000	0.000	0.000	0.025	my8035_rel_less.cz10a_bee
0.000	0.000	99.889	0.106	0.006	0.000	0.000	0.000	0.000	0.000	0.023	my8035_rel_lessps.cz10a_bee
0.000	0.000	99.800	0.200	0.000	0.000	0.000	0.000	0.000	0.000	0.015	my8035_rel.cz10aps0_bee
0.000	0.000	99.572	0.422	0.006	0.000	0.000	0.000	0.000	0.000	0.024	my8035_rel_lessps.cz10aps0_bee
q1000.1
- q1000.1: range queries with 1000 insert/s per client
- Legend for results is here.
- Each entry lists the percentage of responses that fit in that bucket (slower than max time for previous bucket, faster than min time for next bucket).
Query response time histogram
256us	1ms	4ms	16ms	64ms	256ms	1s	4s	16s	gt	max	tag
33.728	66.270	0.002	nonzero	0.000	0.000	0.000	0.000	0.000	0.000	0.004	my8035_rel.cz10a_bee
31.938	68.060	0.002	nonzero	0.000	0.000	0.000	0.000	0.000	0.000	0.006	my8035_rel_native.cz10a_bee
48.224	51.774	0.002	nonzero	0.000	0.000	0.000	0.000	0.000	0.000	0.004	my8035_rel_native_lto.cz10a_bee
32.692	67.306	0.002	nonzero	0.000	0.000	0.000	0.000	0.000	0.000	0.006	my8035_rel_less.cz10a_bee
60.240	39.758	0.002	nonzero	0.000	0.000	0.000	0.000	0.000	0.000	0.006	my8035_rel_lessps.cz10a_bee
56.356	43.642	0.002	nonzero	0.000	0.000	0.000	0.000	0.000	0.000	0.004	my8035_rel.cz10aps0_bee
61.798	38.200	0.001	0.000	0.000	0.000	0.000	0.000	0.000	0.000	0.004	my8035_rel_lessps.cz10aps0_bee
Insert response time histogram
256us	1ms	4ms	16ms	64ms	256ms	1s	4s	16s	gt	max	tag
0.000	0.000	97.719	2.261	0.019	0.000	0.000	0.000	0.000	0.000	0.051	my8035_rel.cz10a_bee
0.000	0.000	98.011	1.978	0.011	0.000	0.000	0.000	0.000	0.000	0.043	my8035_rel_native.cz10a_bee
0.000	0.000	98.411	1.564	0.025	0.000	0.000	0.000	0.000	0.000	0.050	my8035_rel_native_lto.cz10a_bee
0.000	0.000	97.600	2.386	0.014	0.000	0.000	0.000	0.000	0.000	0.040	my8035_rel_less.cz10a_bee
0.000	0.000	98.597	1.392	0.011	0.000	0.000	0.000	0.000	0.000	0.055	my8035_rel_lessps.cz10a_bee
0.000	0.000	98.322	1.658	0.019	0.000	0.000	0.000	0.000	0.000	0.041	my8035_rel.cz10aps0_bee
0.000	0.000	98.739	1.247	0.014	0.000	0.000	0.000	0.000	0.000	0.040	my8035_rel_lessps.cz10aps0_bee
Delete response time histogram
256us	1ms	4ms	16ms	64ms	256ms	1s	4s	16s	gt	max	tag
0.000	0.000	99.547	0.450	0.003	0.000	0.000	0.000	0.000	0.000	0.024	my8035_rel.cz10a_bee
0.000	0.000	99.508	0.483	0.008	0.000	0.000	0.000	0.000	0.000	0.035	my8035_rel_native.cz10a_bee
0.000	0.000	99.319	0.664	0.017	0.000	0.000	0.000	0.000	0.000	0.040	my8035_rel_native_lto.cz10a_bee
0.000	0.000	99.694	0.294	0.011	0.000	0.000	0.000	0.000	0.000	0.049	my8035_rel_less.cz10a_bee
0.000	0.000	99.475	0.519	0.006	0.000	0.000	0.000	0.000	0.000	0.023	my8035_rel_lessps.cz10a_bee
0.000	0.000	99.656	0.339	0.006	0.000	0.000	0.000	0.000	0.000	0.049	my8035_rel.cz10aps0_bee
0.000	0.000	99.614	0.378	0.008	0.000	0.000	0.000	0.000	0.000	0.049	my8035_rel_lessps.cz10aps0_bee