Introduction
This is a report for the insert benchmark with 20M docs and 1 client(s). It is generated by scripts (bash, awk, sed) and Tufte might not be impressed. An overview of the insert benchmark is here and a short update is here. Below, by DBMS, I mean DBMS+version.config. An example is my8020.c10b40 where my means MySQL, 8020 is version 8.0.20 and c10b40 is the name for the configuration file.
The test server has 8 AMD cores, 16G RAM and an NVMe SSD. It is described here as the Beelink. The benchmark was run with 1 client and there were 1 or 3 connections per client (1 for queries or inserts without rate limits, 1+1 for rate limited inserts+deletes). It uses 1 table. It loads 20M rows per table without secondary indexes, creates secondary indexes, then inserts 50M rows per table with a delete per insert to avoid growing the table. It then does 3 read+write tests for 1800s each that do queries as fast as possible with 100, 500 and then 1000 inserts/second/client concurrent with the queries and 1000 deletes/second to avoid growing the table. The database is cached by InnoDB. Clients and the DBMS share one server. The per-database configs are in the per-database subdirectories here.
The tested DBMS are:
- my5744_rel.cz10a_bee - MySQL 5.7.44 with InnoDB, rel build, cz10a_bee config
- my5744_rel.cz10aps0_bee - MySQL 5.7.44 with InnoDB, rel build, cz10aps0_bee config (perf_schema=0)
Contents
- Summary
- l.i0: load without secondary indexes
- l.x: create secondary indexes
- l.i1: continue load after secondary indexes created
- q100.1: range queries with 100 insert/s per client
- q500.1: range queries with 500 insert/s per client
- q1000.1: range queries with 1000 insert/s per client
Summary
The numbers are inserts/s for l.i0 and l.i1, indexed docs (or rows) /s for l.x and queries/s for q*.2. The values are the average rate over the entire test for inserts (IPS) and queries (QPS). The range of values for IPS and QPS is split into 3 parts: bottom 25%, middle 50%, top 25%. Values in the bottom 25% have a red background, values in the top 25% have a green background and values in the middle have no color. A gray background is used for values that can be ignored because the DBMS did not sustain the target insert rate. Red backgrounds are not used when the minimum value is within 80% of the max value.
| dbms | l.i0 | l.x | l.i1 | q100.1 | q500.1 | q1000.1 |
|---|---|---|---|---|---|---|
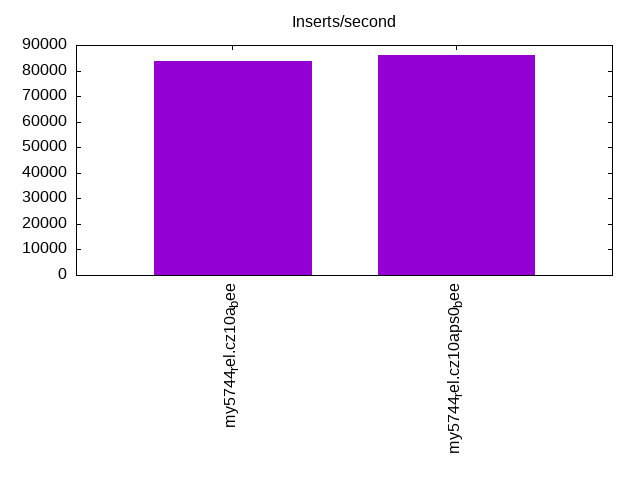
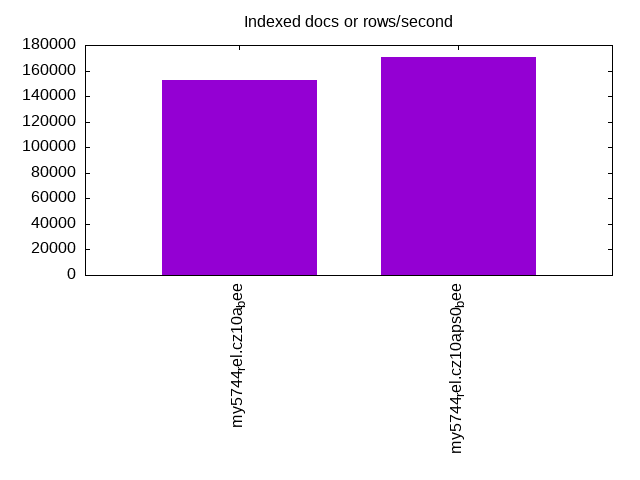
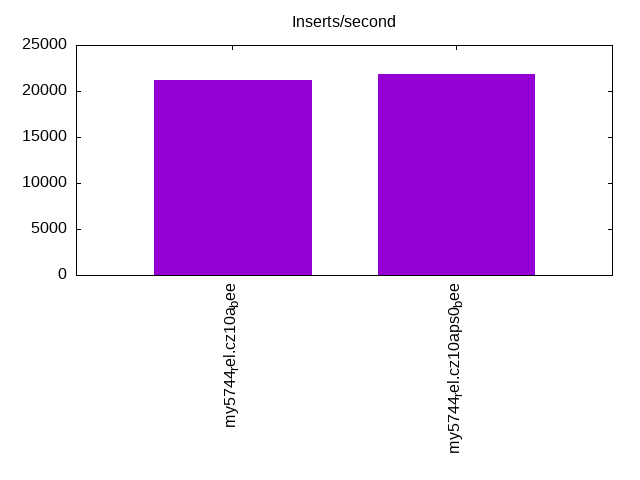
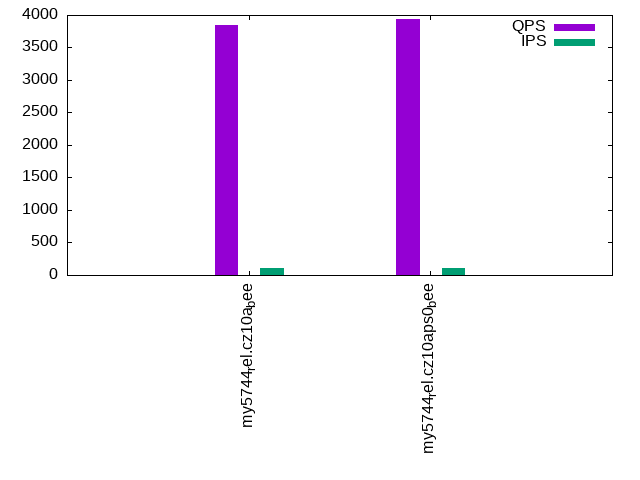
| my5744_rel.cz10a_bee | 83682 | 152273 | 21213 | 3844 | 3814 | 3796 |
| my5744_rel.cz10aps0_bee | 86207 | 170339 | 21815 | 3934 | 3940 | 3935 |
This table has relative throughput, throughput for the DBMS relative to the DBMS in the first line, using the absolute throughput from the previous table. Values less than 0.95 have a yellow background. Values greater than 1.05 have a blue background.
| dbms | l.i0 | l.x | l.i1 | q100.1 | q500.1 | q1000.1 |
|---|---|---|---|---|---|---|
| my5744_rel.cz10a_bee | 1.00 | 1.00 | 1.00 | 1.00 | 1.00 | 1.00 |
| my5744_rel.cz10aps0_bee | 1.03 | 1.12 | 1.03 | 1.02 | 1.03 | 1.04 |
This lists the average rate of inserts/s for the tests that do inserts concurrent with queries. For such tests the query rate is listed in the table above. The read+write tests are setup so that the insert rate should match the target rate every second. Cells that are not at least 95% of the target have a red background to indicate a failure to satisfy the target.
| dbms | q100.1 | q500.1 | q1000.1 |
|---|---|---|---|
| my5744_rel.cz10a_bee | 100 | 499 | 998 |
| my5744_rel.cz10aps0_bee | 100 | 499 | 998 |
| target | 100 | 500 | 1000 |
l.i0
l.i0: load without secondary indexes. Graphs for performance per 1-second interval are here.
Average throughput:
Insert response time histogram: each cell has the percentage of responses that take <= the time in the header and max is the max response time in seconds. For the max column values in the top 25% of the range have a red background and in the bottom 25% of the range have a green background. The red background is not used when the min value is within 80% of the max value.
| dbms | 256us | 1ms | 4ms | 16ms | 64ms | 256ms | 1s | 4s | 16s | gt | max |
|---|---|---|---|---|---|---|---|---|---|---|---|
| my5744_rel.cz10a_bee | 2.107 | 97.543 | 0.205 | 0.144 | 0.002 | 0.106 | |||||
| my5744_rel.cz10aps0_bee | 11.744 | 87.913 | 0.202 | 0.138 | 0.003 | 0.105 |
Performance metrics for the DBMS listed above. Some are normalized by throughput, others are not. Legend for results is here.
ips	qps	rps	rmbps	wps	wmbps	rpq	rkbpq	wpi	wkbpi	csps	cpups	cspq	cpupq	dbgb1	dbgb2	rss	maxop	p50	p99	tag
83682	0	0	0.0	193.5	23.2	0.000	0.000	0.002	0.284	8470	21.2	0.101	20	1.3	17.8	2.3	0.106	84478	73519	20m.my5744_rel.cz10a_bee
86207	0	0	0.0	200.7	23.9	0.000	0.000	0.002	0.284	8690	20.9	0.101	19	1.3	17.8	2.0	0.105	87001	76516	20m.my5744_rel.cz10aps0_bee
l.x
l.x: create secondary indexes.
Average throughput:
Performance metrics for the DBMS listed above. Some are normalized by throughput, others are not. Legend for results is here.
ips	qps	rps	rmbps	wps	wmbps	rpq	rkbpq	wpi	wkbpi	csps	cpups	cspq	cpupq	dbgb1	dbgb2	rss	maxop	p50	p99	tag
152273	0	0	0.0	1480.9	131.3	0.000	0.000	0.010	0.883	8831	12.1	0.058	6	3.0	19.5	3.2	0.019	NA	NA	20m.my5744_rel.cz10a_bee
170339	0	0	0.0	1654.2	146.5	0.000	0.000	0.010	0.881	9295	11.9	0.055	6	3.0	19.5	2.7	0.019	NA	NA	20m.my5744_rel.cz10aps0_bee
l.i1
l.i1: continue load after secondary indexes created. Graphs for performance per 1-second interval are here.
Average throughput:
Insert response time histogram: each cell has the percentage of responses that take <= the time in the header and max is the max response time in seconds. For the max column values in the top 25% of the range have a red background and in the bottom 25% of the range have a green background. The red background is not used when the min value is within 80% of the max value.
| dbms | 256us | 1ms | 4ms | 16ms | 64ms | 256ms | 1s | 4s | 16s | gt | max |
|---|---|---|---|---|---|---|---|---|---|---|---|
| my5744_rel.cz10a_bee | 97.049 | 2.890 | 0.057 | 0.003 | 0.092 | ||||||
| my5744_rel.cz10aps0_bee | 97.147 | 2.796 | 0.054 | 0.003 | 0.089 |
Delete response time histogram: each cell has the percentage of responses that take <= the time in the header and max is the max response time in seconds. For the max column values in the top 25% of the range have a red background and in the bottom 25% of the range have a green background. The red background is not used when the min value is within 80% of the max value.
| dbms | 256us | 1ms | 4ms | 16ms | 64ms | 256ms | 1s | 4s | 16s | gt | max |
|---|---|---|---|---|---|---|---|---|---|---|---|
| my5744_rel.cz10a_bee | 97.685 | 2.299 | 0.012 | 0.003 | 0.091 | ||||||
| my5744_rel.cz10aps0_bee | 97.744 | 2.242 | 0.011 | 0.003 | 0.090 |
Performance metrics for the DBMS listed above. Some are normalized by throughput, others are not. Legend for results is here.
ips	qps	rps	rmbps	wps	wmbps	rpq	rkbpq	wpi	wkbpi	csps	cpups	cspq	cpupq	dbgb1	dbgb2	rss	maxop	p50	p99	tag
21213	0	0	0.0	1850.3	81.5	0.000	0.000	0.087	3.936	13980	37.7	0.659	142	4.3	20.8	5.4	0.092	21785	8091	20m.my5744_rel.cz10a_bee
21815	0	0	0.0	1883.8	83.2	0.000	0.000	0.086	3.907	14376	37.7	0.659	138	4.3	20.9	5.3	0.089	22435	7422	20m.my5744_rel.cz10aps0_bee
q100.1
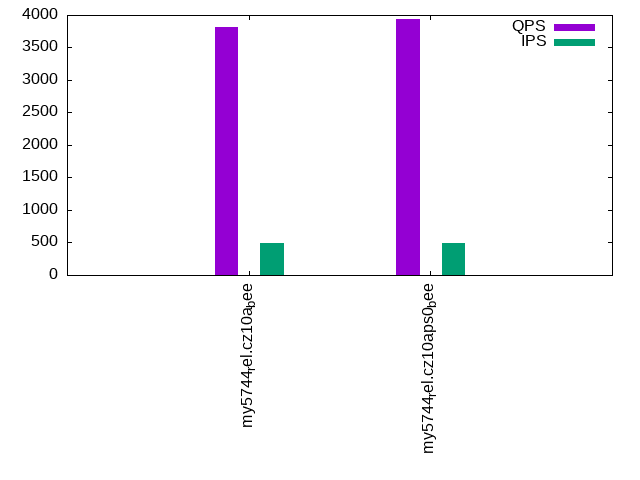
q100.1: range queries with 100 insert/s per client. Graphs for performance per 1-second interval are here.
Average throughput:
Query response time histogram: each cell has the percentage of responses that take <= the time in the header and max is the max response time in seconds. For max values in the top 25% of the range have a red background and in the bottom 25% of the range have a green background. The red background is not used when the min value is within 80% of the max value.
| dbms | 256us | 1ms | 4ms | 16ms | 64ms | 256ms | 1s | 4s | 16s | gt | max |
|---|---|---|---|---|---|---|---|---|---|---|---|
| my5744_rel.cz10a_bee | 63.768 | 36.231 | nonzero | 0.004 | |||||||
| my5744_rel.cz10aps0_bee | 66.798 | 33.201 | 0.001 | nonzero | 0.005 |
Insert response time histogram: each cell has the percentage of responses that take <= the time in the header and max is the max response time in seconds. For max values in the top 25% of the range have a red background and in the bottom 25% of the range have a green background. The red background is not used when the min value is within 80% of the max value.
| dbms | 256us | 1ms | 4ms | 16ms | 64ms | 256ms | 1s | 4s | 16s | gt | max |
|---|---|---|---|---|---|---|---|---|---|---|---|
| my5744_rel.cz10a_bee | 99.583 | 0.417 | 0.011 | ||||||||
| my5744_rel.cz10aps0_bee | 99.667 | 0.333 | 0.011 |
Delete response time histogram: each cell has the percentage of responses that take <= the time in the header and max is the max response time in seconds. For max values in the top 25% of the range have a red background and in the bottom 25% of the range have a green background. The red background is not used when the min value is within 80% of the max value.
| dbms | 256us | 1ms | 4ms | 16ms | 64ms | 256ms | 1s | 4s | 16s | gt | max |
|---|---|---|---|---|---|---|---|---|---|---|---|
| my5744_rel.cz10a_bee | 99.694 | 0.306 | 0.011 | ||||||||
| my5744_rel.cz10aps0_bee | 99.722 | 0.278 | 0.011 |
Performance metrics for the DBMS listed above. Some are normalized by throughput, others are not. Legend for results is here.
ips	qps	rps	rmbps	wps	wmbps	rpq	rkbpq	wpi	wkbpi	csps	cpups	cspq	cpupq	dbgb1	dbgb2	rss	maxop	p50	p99	tag
100	3844	0	0.0	58.4	1.8	0.000	0.000	0.585	18.030	15032	12.8	3.911	266	4.3	20.8	5.4	0.004	3806	3533	20m.my5744_rel.cz10a_bee
100	3934	0	0.0	61.8	1.9	0.000	0.000	0.620	19.126	15399	12.9	3.915	262	4.3	20.9	5.3	0.005	3916	3612	20m.my5744_rel.cz10aps0_bee
q500.1
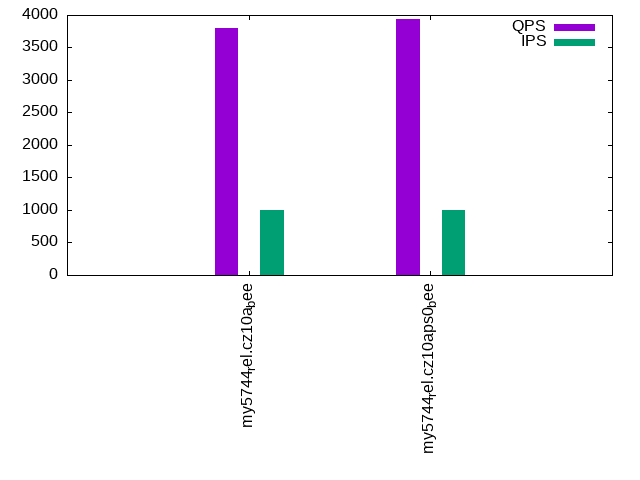
q500.1: range queries with 500 insert/s per client. Graphs for performance per 1-second interval are here.
Average throughput:
Query response time histogram: each cell has the percentage of responses that take <= the time in the header and max is the max response time in seconds. For max values in the top 25% of the range have a red background and in the bottom 25% of the range have a green background. The red background is not used when the min value is within 80% of the max value.
| dbms | 256us | 1ms | 4ms | 16ms | 64ms | 256ms | 1s | 4s | 16s | gt | max |
|---|---|---|---|---|---|---|---|---|---|---|---|
| my5744_rel.cz10a_bee | 62.887 | 37.113 | nonzero | 0.004 | |||||||
| my5744_rel.cz10aps0_bee | 66.701 | 33.299 | nonzero | nonzero | 0.005 |
Insert response time histogram: each cell has the percentage of responses that take <= the time in the header and max is the max response time in seconds. For max values in the top 25% of the range have a red background and in the bottom 25% of the range have a green background. The red background is not used when the min value is within 80% of the max value.
| dbms | 256us | 1ms | 4ms | 16ms | 64ms | 256ms | 1s | 4s | 16s | gt | max |
|---|---|---|---|---|---|---|---|---|---|---|---|
| my5744_rel.cz10a_bee | 99.489 | 0.511 | 0.014 | ||||||||
| my5744_rel.cz10aps0_bee | 99.583 | 0.417 | 0.011 |
Delete response time histogram: each cell has the percentage of responses that take <= the time in the header and max is the max response time in seconds. For max values in the top 25% of the range have a red background and in the bottom 25% of the range have a green background. The red background is not used when the min value is within 80% of the max value.
| dbms | 256us | 1ms | 4ms | 16ms | 64ms | 256ms | 1s | 4s | 16s | gt | max |
|---|---|---|---|---|---|---|---|---|---|---|---|
| my5744_rel.cz10a_bee | 99.678 | 0.322 | 0.012 | ||||||||
| my5744_rel.cz10aps0_bee | 99.728 | 0.272 | 0.011 |
Performance metrics for the DBMS listed above. Some are normalized by throughput, others are not. Legend for results is here.
ips	qps	rps	rmbps	wps	wmbps	rpq	rkbpq	wpi	wkbpi	csps	cpups	cspq	cpupq	dbgb1	dbgb2	rss	maxop	p50	p99	tag
499	3814	0	0.0	29.1	1.2	0.000	0.000	0.058	2.483	14946	13.7	3.919	287	4.3	20.8	5.4	0.004	3788	3516	20m.my5744_rel.cz10a_bee
499	3940	0	0.0	23.8	1.1	0.000	0.000	0.048	2.191	15406	13.3	3.910	270	4.3	20.9	5.3	0.005	3916	3613	20m.my5744_rel.cz10aps0_bee
q1000.1
q1000.1: range queries with 1000 insert/s per client. Graphs for performance per 1-second interval are here.
Average throughput:
Query response time histogram: each cell has the percentage of responses that take <= the time in the header and max is the max response time in seconds. For max values in the top 25% of the range have a red background and in the bottom 25% of the range have a green background. The red background is not used when the min value is within 80% of the max value.
| dbms | 256us | 1ms | 4ms | 16ms | 64ms | 256ms | 1s | 4s | 16s | gt | max |
|---|---|---|---|---|---|---|---|---|---|---|---|
| my5744_rel.cz10a_bee | 62.840 | 37.159 | 0.001 | nonzero | 0.005 | ||||||
| my5744_rel.cz10aps0_bee | 66.583 | 33.417 | 0.001 | 0.004 |
Insert response time histogram: each cell has the percentage of responses that take <= the time in the header and max is the max response time in seconds. For max values in the top 25% of the range have a red background and in the bottom 25% of the range have a green background. The red background is not used when the min value is within 80% of the max value.
| dbms | 256us | 1ms | 4ms | 16ms | 64ms | 256ms | 1s | 4s | 16s | gt | max |
|---|---|---|---|---|---|---|---|---|---|---|---|
| my5744_rel.cz10a_bee | 99.467 | 0.531 | 0.003 | 0.047 | |||||||
| my5744_rel.cz10aps0_bee | 99.436 | 0.558 | 0.006 | 0.048 |
Delete response time histogram: each cell has the percentage of responses that take <= the time in the header and max is the max response time in seconds. For max values in the top 25% of the range have a red background and in the bottom 25% of the range have a green background. The red background is not used when the min value is within 80% of the max value.
| dbms | 256us | 1ms | 4ms | 16ms | 64ms | 256ms | 1s | 4s | 16s | gt | max |
|---|---|---|---|---|---|---|---|---|---|---|---|
| my5744_rel.cz10a_bee | 99.606 | 0.392 | 0.003 | 0.050 | |||||||
| my5744_rel.cz10aps0_bee | 99.575 | 0.422 | 0.003 | 0.046 |
Performance metrics for the DBMS listed above. Some are normalized by throughput, others are not. Legend for results is here.
ips	qps	rps	rmbps	wps	wmbps	rpq	rkbpq	wpi	wkbpi	csps	cpups	cspq	cpupq	dbgb1	dbgb2	rss	maxop	p50	p99	tag
998	3796	0	0.0	112.8	4.2	0.000	0.000	0.113	4.272	15303	14.8	4.031	312	4.3	20.8	5.4	0.005	3772	3499	20m.my5744_rel.cz10a_bee
998	3935	0	0.0	113.0	4.2	0.000	0.000	0.113	4.273	15824	14.3	4.021	291	4.3	20.9	5.3	0.004	3914	3627	20m.my5744_rel.cz10aps0_bee
l.i0
l.i0: load without secondary indexes
Performance metrics for all DBMS, not just the ones listed above. Some are normalized by throughput, others are not. Legend for results is here.
ips	qps	rps	rmbps	wps	wmbps	rpq	rkbpq	wpi	wkbpi	csps	cpups	cspq	cpupq	dbgb1	dbgb2	rss	maxop	p50	p99	tag
83682	0	0	0.0	193.5	23.2	0.000	0.000	0.002	0.284	8470	21.2	0.101	20	1.3	17.8	2.3	0.106	84478	73519	20m.my5744_rel.cz10a_bee
86207	0	0	0.0	200.7	23.9	0.000	0.000	0.002	0.284	8690	20.9	0.101	19	1.3	17.8	2.0	0.105	87001	76516	20m.my5744_rel.cz10aps0_bee
l.x
l.x: create secondary indexes
Performance metrics for all DBMS, not just the ones listed above. Some are normalized by throughput, others are not. Legend for results is here.
ips	qps	rps	rmbps	wps	wmbps	rpq	rkbpq	wpi	wkbpi	csps	cpups	cspq	cpupq	dbgb1	dbgb2	rss	maxop	p50	p99	tag
152273	0	0	0.0	1480.9	131.3	0.000	0.000	0.010	0.883	8831	12.1	0.058	6	3.0	19.5	3.2	0.019	NA	NA	20m.my5744_rel.cz10a_bee
170339	0	0	0.0	1654.2	146.5	0.000	0.000	0.010	0.881	9295	11.9	0.055	6	3.0	19.5	2.7	0.019	NA	NA	20m.my5744_rel.cz10aps0_bee
l.i1
l.i1: continue load after secondary indexes created
Performance metrics for all DBMS, not just the ones listed above. Some are normalized by throughput, others are not. Legend for results is here.
ips	qps	rps	rmbps	wps	wmbps	rpq	rkbpq	wpi	wkbpi	csps	cpups	cspq	cpupq	dbgb1	dbgb2	rss	maxop	p50	p99	tag
21213	0	0	0.0	1850.3	81.5	0.000	0.000	0.087	3.936	13980	37.7	0.659	142	4.3	20.8	5.4	0.092	21785	8091	20m.my5744_rel.cz10a_bee
21815	0	0	0.0	1883.8	83.2	0.000	0.000	0.086	3.907	14376	37.7	0.659	138	4.3	20.9	5.3	0.089	22435	7422	20m.my5744_rel.cz10aps0_bee
q100.1
q100.1: range queries with 100 insert/s per client
Performance metrics for all DBMS, not just the ones listed above. Some are normalized by throughput, others are not. Legend for results is here.
ips	qps	rps	rmbps	wps	wmbps	rpq	rkbpq	wpi	wkbpi	csps	cpups	cspq	cpupq	dbgb1	dbgb2	rss	maxop	p50	p99	tag
100	3844	0	0.0	58.4	1.8	0.000	0.000	0.585	18.030	15032	12.8	3.911	266	4.3	20.8	5.4	0.004	3806	3533	20m.my5744_rel.cz10a_bee
100	3934	0	0.0	61.8	1.9	0.000	0.000	0.620	19.126	15399	12.9	3.915	262	4.3	20.9	5.3	0.005	3916	3612	20m.my5744_rel.cz10aps0_bee
q500.1
q500.1: range queries with 500 insert/s per client
Performance metrics for all DBMS, not just the ones listed above. Some are normalized by throughput, others are not. Legend for results is here.
ips	qps	rps	rmbps	wps	wmbps	rpq	rkbpq	wpi	wkbpi	csps	cpups	cspq	cpupq	dbgb1	dbgb2	rss	maxop	p50	p99	tag
499	3814	0	0.0	29.1	1.2	0.000	0.000	0.058	2.483	14946	13.7	3.919	287	4.3	20.8	5.4	0.004	3788	3516	20m.my5744_rel.cz10a_bee
499	3940	0	0.0	23.8	1.1	0.000	0.000	0.048	2.191	15406	13.3	3.910	270	4.3	20.9	5.3	0.005	3916	3613	20m.my5744_rel.cz10aps0_bee
q1000.1
q1000.1: range queries with 1000 insert/s per client
Performance metrics for all DBMS, not just the ones listed above. Some are normalized by throughput, others are not. Legend for results is here.
ips	qps	rps	rmbps	wps	wmbps	rpq	rkbpq	wpi	wkbpi	csps	cpups	cspq	cpupq	dbgb1	dbgb2	rss	maxop	p50	p99	tag
998	3796	0	0.0	112.8	4.2	0.000	0.000	0.113	4.272	15303	14.8	4.031	312	4.3	20.8	5.4	0.005	3772	3499	20m.my5744_rel.cz10a_bee
998	3935	0	0.0	113.0	4.2	0.000	0.000	0.113	4.273	15824	14.3	4.021	291	4.3	20.9	5.3	0.004	3914	3627	20m.my5744_rel.cz10aps0_bee
l.i0
- l.i0: load without secondary indexes
- Legend for results is here.
- Each entry lists the percentage of responses that fit in that bucket (slower than max time for previous bucket, faster than min time for next bucket).
Insert response time histogram
256us	1ms	4ms	16ms	64ms	256ms	1s	4s	16s	gt	max	tag
0.000	2.107	97.543	0.205	0.144	0.002	0.000	0.000	0.000	0.000	0.106	my5744_rel.cz10a_bee
0.000	11.744	87.913	0.202	0.138	0.003	0.000	0.000	0.000	0.000	0.105	my5744_rel.cz10aps0_bee
l.x
- l.x: create secondary indexes
- Legend for results is here.
- Each entry lists the percentage of responses that fit in that bucket (slower than max time for previous bucket, faster than min time for next bucket).
TODO - determine whether there is data for create index response time
l.i1
- l.i1: continue load after secondary indexes created
- Legend for results is here.
- Each entry lists the percentage of responses that fit in that bucket (slower than max time for previous bucket, faster than min time for next bucket).
Insert response time histogram
256us	1ms	4ms	16ms	64ms	256ms	1s	4s	16s	gt	max	tag
0.000	0.000	97.049	2.890	0.057	0.003	0.000	0.000	0.000	0.000	0.092	my5744_rel.cz10a_bee
0.000	0.000	97.147	2.796	0.054	0.003	0.000	0.000	0.000	0.000	0.089	my5744_rel.cz10aps0_bee
Delete response time histogram
256us	1ms	4ms	16ms	64ms	256ms	1s	4s	16s	gt	max	tag
0.000	0.000	97.685	2.299	0.012	0.003	0.000	0.000	0.000	0.000	0.091	my5744_rel.cz10a_bee
0.000	0.000	97.744	2.242	0.011	0.003	0.000	0.000	0.000	0.000	0.090	my5744_rel.cz10aps0_bee
q100.1
- q100.1: range queries with 100 insert/s per client
- Legend for results is here.
- Each entry lists the percentage of responses that fit in that bucket (slower than max time for previous bucket, faster than min time for next bucket).
Query response time histogram
256us	1ms	4ms	16ms	64ms	256ms	1s	4s	16s	gt	max	tag
63.768	36.231	nonzero	0.000	0.000	0.000	0.000	0.000	0.000	0.000	0.004	my5744_rel.cz10a_bee
66.798	33.201	0.001	nonzero	0.000	0.000	0.000	0.000	0.000	0.000	0.005	my5744_rel.cz10aps0_bee
Insert response time histogram
256us	1ms	4ms	16ms	64ms	256ms	1s	4s	16s	gt	max	tag
0.000	0.000	99.583	0.417	0.000	0.000	0.000	0.000	0.000	0.000	0.011	my5744_rel.cz10a_bee
0.000	0.000	99.667	0.333	0.000	0.000	0.000	0.000	0.000	0.000	0.011	my5744_rel.cz10aps0_bee
Delete response time histogram
256us	1ms	4ms	16ms	64ms	256ms	1s	4s	16s	gt	max	tag
0.000	0.000	99.694	0.306	0.000	0.000	0.000	0.000	0.000	0.000	0.011	my5744_rel.cz10a_bee
0.000	0.000	99.722	0.278	0.000	0.000	0.000	0.000	0.000	0.000	0.011	my5744_rel.cz10aps0_bee
q500.1
- q500.1: range queries with 500 insert/s per client
- Legend for results is here.
- Each entry lists the percentage of responses that fit in that bucket (slower than max time for previous bucket, faster than min time for next bucket).
Query response time histogram
256us	1ms	4ms	16ms	64ms	256ms	1s	4s	16s	gt	max	tag
62.887	37.113	nonzero	0.000	0.000	0.000	0.000	0.000	0.000	0.000	0.004	my5744_rel.cz10a_bee
66.701	33.299	nonzero	nonzero	0.000	0.000	0.000	0.000	0.000	0.000	0.005	my5744_rel.cz10aps0_bee
Insert response time histogram
256us	1ms	4ms	16ms	64ms	256ms	1s	4s	16s	gt	max	tag
0.000	0.000	99.489	0.511	0.000	0.000	0.000	0.000	0.000	0.000	0.014	my5744_rel.cz10a_bee
0.000	0.000	99.583	0.417	0.000	0.000	0.000	0.000	0.000	0.000	0.011	my5744_rel.cz10aps0_bee
Delete response time histogram
256us	1ms	4ms	16ms	64ms	256ms	1s	4s	16s	gt	max	tag
0.000	0.000	99.678	0.322	0.000	0.000	0.000	0.000	0.000	0.000	0.012	my5744_rel.cz10a_bee
0.000	0.000	99.728	0.272	0.000	0.000	0.000	0.000	0.000	0.000	0.011	my5744_rel.cz10aps0_bee
q1000.1
- q1000.1: range queries with 1000 insert/s per client
- Legend for results is here.
- Each entry lists the percentage of responses that fit in that bucket (slower than max time for previous bucket, faster than min time for next bucket).
Query response time histogram
256us	1ms	4ms	16ms	64ms	256ms	1s	4s	16s	gt	max	tag
62.840	37.159	0.001	nonzero	0.000	0.000	0.000	0.000	0.000	0.000	0.005	my5744_rel.cz10a_bee
66.583	33.417	0.001	0.000	0.000	0.000	0.000	0.000	0.000	0.000	0.004	my5744_rel.cz10aps0_bee
Insert response time histogram
256us	1ms	4ms	16ms	64ms	256ms	1s	4s	16s	gt	max	tag
0.000	0.000	99.467	0.531	0.003	0.000	0.000	0.000	0.000	0.000	0.047	my5744_rel.cz10a_bee
0.000	0.000	99.436	0.558	0.006	0.000	0.000	0.000	0.000	0.000	0.048	my5744_rel.cz10aps0_bee
Delete response time histogram
256us	1ms	4ms	16ms	64ms	256ms	1s	4s	16s	gt	max	tag
0.000	0.000	99.606	0.392	0.003	0.000	0.000	0.000	0.000	0.000	0.050	my5744_rel.cz10a_bee
0.000	0.000	99.575	0.422	0.003	0.000	0.000	0.000	0.000	0.000	0.046	my5744_rel.cz10aps0_bee