Introduction
This is a report for the insert benchmark with 20M docs and 1 client(s). It is generated by scripts (bash, awk, sed) and Tufte might not be impressed. An overview of the insert benchmark is here and a short update is here. Below, by DBMS, I mean DBMS+version.config. An example is my8020.c10b40 where my means MySQL, 8020 is version 8.0.20 and c10b40 is the name for the configuration file.
The test server has 8 AMD cores, 16G RAM and an NVMe SSD. It is described here as the Beelink. The benchmark was run with 1 client and there were 1 or 3 connections per client (1 for queries or inserts without rate limits, 1+1 for rate limited inserts+deletes). It uses 1 table. It loads 20M rows per table without secondary indexes, creates secondary indexes, then inserts 50M rows per table with a delete per insert to avoid growing the table. It then does 3 read+write tests for 1800s each that do queries as fast as possible with 100, 500 and then 1000 inserts/second/client concurrent with the queries and 1000 deletes/second to avoid growing the table. The database is cached by InnoDB. Clients and the DBMS share one server. The per-database configs are in the per-database subdirectories here.
The tested DBMS are:
- my575_rel.cz10a_bee - MySQL 5.7.5 with InnoDB, rel build, cz10a_bee config
- my576_rel.cz10a_bee - MySQL 5.7.6 with InnoDB, rel build, cz10a_bee config
- my577_rel.cz10a_bee - MySQL 5.7.7 with InnoDB, rel build, cz10a_bee config
- my578_rel.cz10a_bee - MySQL 5.7.8 with InnoDB, rel build, cz10a_bee config
- my579_rel.cz10a_bee - MySQL 5.7.9 with InnoDB, rel build, cz10a_bee config
- my5710_rel.cz10a_bee - MySQL 5.7.10 with InnoDB, rel build, cz10a_bee config
- my5720_rel.cz10a_bee - MySQL 5.7.20 with InnoDB, rel build, cz10a_bee config
- my5730_rel.cz10a_bee - MySQL 5.7.30 with InnoDB, rel build, cz10a_bee config
- my5744_rel.cz10a_bee - MySQL 5.7.44 with InnoDB, rel build, cz10a_bee config
Contents
- Summary
- l.i0: load without secondary indexes
- l.x: create secondary indexes
- l.i1: continue load after secondary indexes created
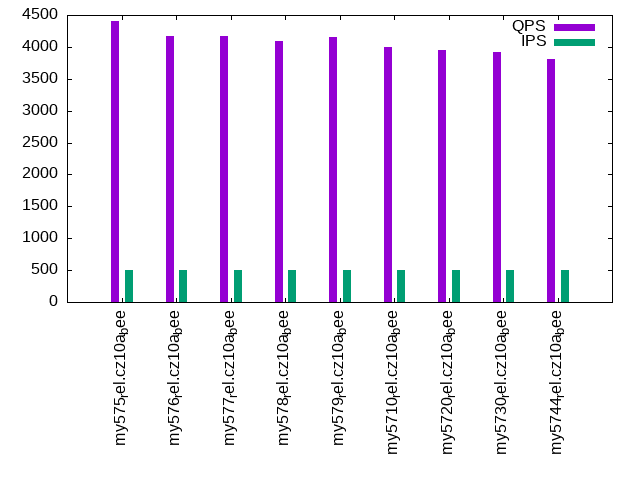
- q100.1: range queries with 100 insert/s per client
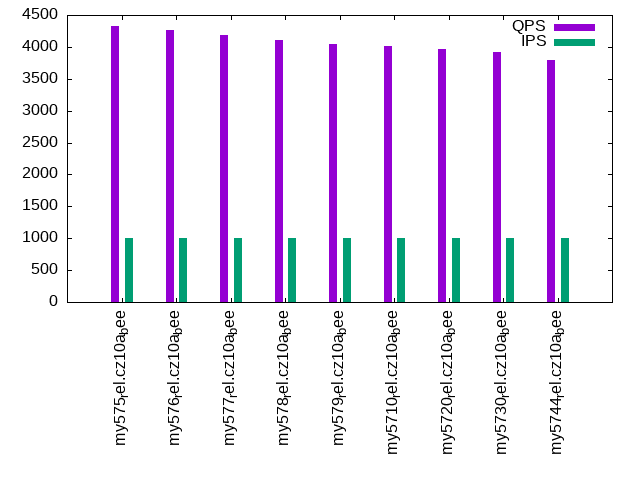
- q500.1: range queries with 500 insert/s per client
- q1000.1: range queries with 1000 insert/s per client
Summary
The numbers are inserts/s for l.i0 and l.i1, indexed docs (or rows) /s for l.x and queries/s for q*.2. The values are the average rate over the entire test for inserts (IPS) and queries (QPS). The range of values for IPS and QPS is split into 3 parts: bottom 25%, middle 50%, top 25%. Values in the bottom 25% have a red background, values in the top 25% have a green background and values in the middle have no color. A gray background is used for values that can be ignored because the DBMS did not sustain the target insert rate. Red backgrounds are not used when the minimum value is within 80% of the max value.
| dbms | l.i0 | l.x | l.i1 | q100.1 | q500.1 | q1000.1 |
|---|---|---|---|---|---|---|
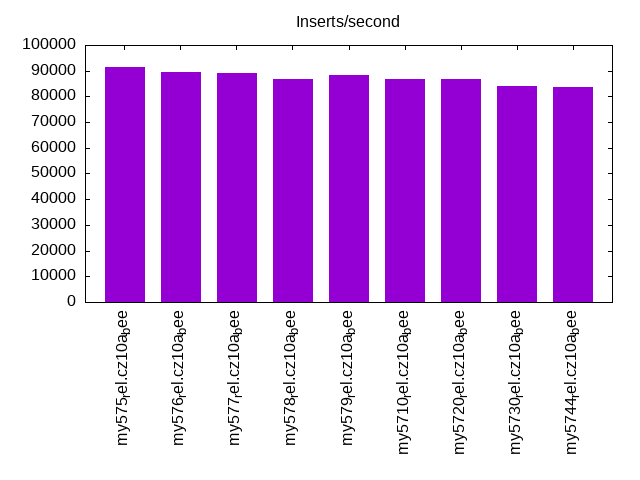
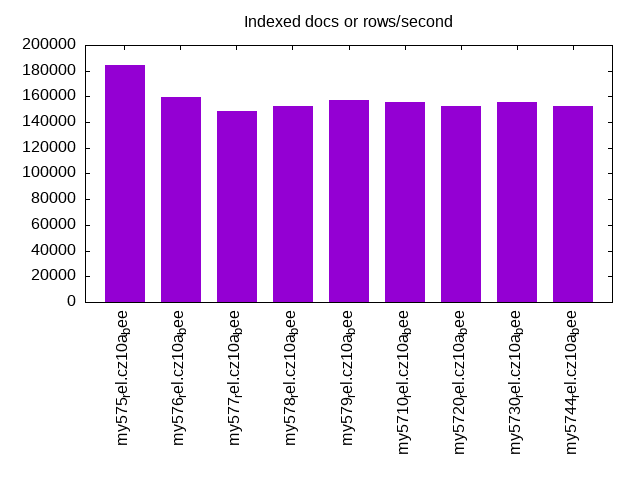
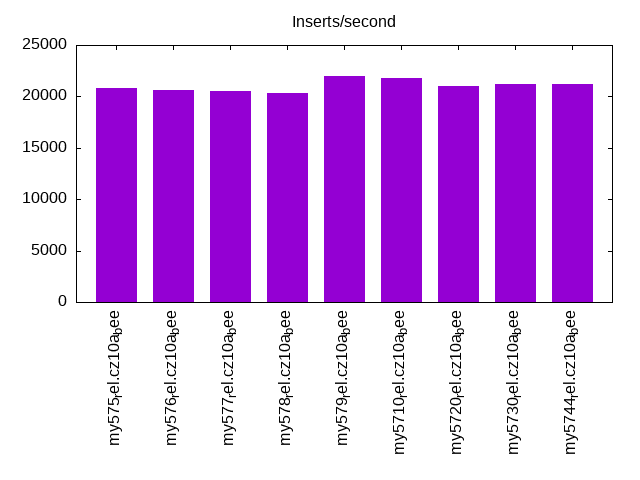
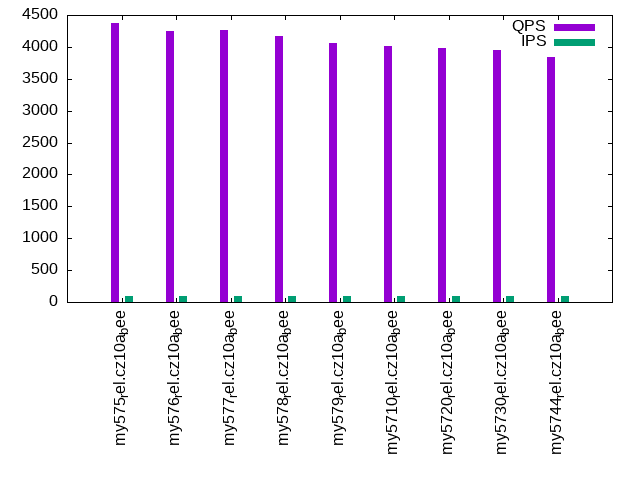
| my575_rel.cz10a_bee | 91324 | 184404 | 20825 | 4381 | 4399 | 4326 |
| my576_rel.cz10a_bee | 89686 | 159524 | 20585 | 4246 | 4175 | 4265 |
| my577_rel.cz10a_bee | 89286 | 148889 | 20542 | 4268 | 4163 | 4193 |
| my578_rel.cz10a_bee | 86956 | 152273 | 20309 | 4168 | 4098 | 4104 |
| my579_rel.cz10a_bee | 88496 | 157031 | 21939 | 4067 | 4161 | 4050 |
| my5710_rel.cz10a_bee | 86580 | 155814 | 21777 | 4013 | 3992 | 4008 |
| my5720_rel.cz10a_bee | 86580 | 152273 | 21053 | 3985 | 3952 | 3972 |
| my5730_rel.cz10a_bee | 84034 | 155814 | 21195 | 3947 | 3925 | 3916 |
| my5744_rel.cz10a_bee | 83682 | 152273 | 21213 | 3844 | 3814 | 3796 |
This table has relative throughput, throughput for the DBMS relative to the DBMS in the first line, using the absolute throughput from the previous table. Values less than 0.95 have a yellow background. Values greater than 1.05 have a blue background.
| dbms | l.i0 | l.x | l.i1 | q100.1 | q500.1 | q1000.1 |
|---|---|---|---|---|---|---|
| my575_rel.cz10a_bee | 1.00 | 1.00 | 1.00 | 1.00 | 1.00 | 1.00 |
| my576_rel.cz10a_bee | 0.98 | 0.87 | 0.99 | 0.97 | 0.95 | 0.99 |
| my577_rel.cz10a_bee | 0.98 | 0.81 | 0.99 | 0.97 | 0.95 | 0.97 |
| my578_rel.cz10a_bee | 0.95 | 0.83 | 0.98 | 0.95 | 0.93 | 0.95 |
| my579_rel.cz10a_bee | 0.97 | 0.85 | 1.05 | 0.93 | 0.95 | 0.94 |
| my5710_rel.cz10a_bee | 0.95 | 0.84 | 1.05 | 0.92 | 0.91 | 0.93 |
| my5720_rel.cz10a_bee | 0.95 | 0.83 | 1.01 | 0.91 | 0.90 | 0.92 |
| my5730_rel.cz10a_bee | 0.92 | 0.84 | 1.02 | 0.90 | 0.89 | 0.91 |
| my5744_rel.cz10a_bee | 0.92 | 0.83 | 1.02 | 0.88 | 0.87 | 0.88 |
This lists the average rate of inserts/s for the tests that do inserts concurrent with queries. For such tests the query rate is listed in the table above. The read+write tests are setup so that the insert rate should match the target rate every second. Cells that are not at least 95% of the target have a red background to indicate a failure to satisfy the target.
| dbms | q100.1 | q500.1 | q1000.1 |
|---|---|---|---|
| my575_rel.cz10a_bee | 100 | 499 | 997 |
| my576_rel.cz10a_bee | 100 | 499 | 998 |
| my577_rel.cz10a_bee | 100 | 499 | 997 |
| my578_rel.cz10a_bee | 100 | 499 | 999 |
| my579_rel.cz10a_bee | 100 | 499 | 998 |
| my5710_rel.cz10a_bee | 100 | 499 | 997 |
| my5720_rel.cz10a_bee | 100 | 499 | 998 |
| my5730_rel.cz10a_bee | 100 | 499 | 997 |
| my5744_rel.cz10a_bee | 100 | 499 | 998 |
| target | 100 | 500 | 1000 |
l.i0
l.i0: load without secondary indexes. Graphs for performance per 1-second interval are here.
Average throughput:
Insert response time histogram: each cell has the percentage of responses that take <= the time in the header and max is the max response time in seconds. For the max column values in the top 25% of the range have a red background and in the bottom 25% of the range have a green background. The red background is not used when the min value is within 80% of the max value.
| dbms | 256us | 1ms | 4ms | 16ms | 64ms | 256ms | 1s | 4s | 16s | gt | max |
|---|---|---|---|---|---|---|---|---|---|---|---|
| my575_rel.cz10a_bee | 49.766 | 49.959 | 0.270 | 0.002 | 0.003 | 0.108 | |||||
| my576_rel.cz10a_bee | 34.914 | 64.806 | 0.274 | 0.003 | 0.003 | 0.102 | |||||
| my577_rel.cz10a_bee | 26.210 | 73.497 | 0.286 | 0.003 | 0.003 | 0.106 | |||||
| my578_rel.cz10a_bee | 7.843 | 91.868 | 0.280 | 0.007 | 0.002 | 0.106 | |||||
| my579_rel.cz10a_bee | 26.339 | 73.367 | 0.288 | 0.003 | 0.003 | 0.108 | |||||
| my5710_rel.cz10a_bee | 5.095 | 94.608 | 0.289 | 0.005 | 0.003 | 0.103 | |||||
| my5720_rel.cz10a_bee | 5.135 | 94.569 | 0.290 | 0.003 | 0.003 | 0.104 | |||||
| my5730_rel.cz10a_bee | 2.620 | 97.029 | 0.210 | 0.138 | 0.003 | 0.105 | |||||
| my5744_rel.cz10a_bee | 2.107 | 97.543 | 0.205 | 0.144 | 0.002 | 0.106 |
Performance metrics for the DBMS listed above. Some are normalized by throughput, others are not. Legend for results is here.
ips	qps	rps	rmbps	wps	wmbps	rpq	rkbpq	wpi	wkbpi	csps	cpups	cspq	cpupq	dbgb1	dbgb2	rss	maxop	p50	p99	tag
91324	0	0	0.0	198.5	25.2	0.000	0.000	0.002	0.282	9049	21.5	0.099	19	1.3	17.8	2.6	0.108	91808	80711	20m.my575_rel.cz10a_bee
89686	0	0	0.0	204.1	24.8	0.000	0.000	0.002	0.283	8951	21.2	0.100	19	1.3	17.8	2.2	0.102	90306	79516	20m.my576_rel.cz10a_bee
89286	0	0	0.0	202.5	24.6	0.000	0.000	0.002	0.283	8849	21.1	0.099	19	1.3	17.8	2.2	0.106	89776	78013	20m.my577_rel.cz10a_bee
86956	0	0	0.0	201.3	24.1	0.000	0.000	0.002	0.283	8682	21.0	0.100	19	1.3	17.8	2.2	0.106	87336	77317	20m.my578_rel.cz10a_bee
88496	0	0	0.0	206.3	24.6	0.000	0.000	0.002	0.285	8841	21.2	0.100	19	1.3	17.8	2.2	0.108	89406	78144	20m.my579_rel.cz10a_bee
86580	0	0	0.0	199.1	23.9	0.000	0.000	0.002	0.283	8687	21.3	0.100	20	1.3	17.8	2.2	0.103	86999	76098	20m.my5710_rel.cz10a_bee
86580	0	0	0.0	199.5	23.9	0.000	0.000	0.002	0.283	8675	21.0	0.100	19	1.3	17.8	2.2	0.104	86797	76248	20m.my5720_rel.cz10a_bee
84034	0	0	0.0	197.3	23.4	0.000	0.000	0.002	0.285	8521	21.2	0.101	20	1.3	17.8	2.3	0.105	85205	60107	20m.my5730_rel.cz10a_bee
83682	0	0	0.0	193.5	23.2	0.000	0.000	0.002	0.284	8470	21.2	0.101	20	1.3	17.8	2.3	0.106	84478	73519	20m.my5744_rel.cz10a_bee
l.x
l.x: create secondary indexes.
Average throughput:
Performance metrics for the DBMS listed above. Some are normalized by throughput, others are not. Legend for results is here.
ips	qps	rps	rmbps	wps	wmbps	rpq	rkbpq	wpi	wkbpi	csps	cpups	cspq	cpupq	dbgb1	dbgb2	rss	maxop	p50	p99	tag
184404	0	0	0.0	1381.3	157.2	0.000	0.000	0.007	0.873	7979	12.3	0.043	5	2.9	19.4	3.6	0.012	NA	NA	20m.my575_rel.cz10a_bee
159524	0	0	0.0	1321.2	140.1	0.000	0.000	0.008	0.899	8936	12.4	0.056	6	3.0	19.5	3.3	0.013	NA	NA	20m.my576_rel.cz10a_bee
148889	0	0	0.0	1326.9	132.8	0.000	0.000	0.009	0.914	8568	12.4	0.058	7	3.0	19.5	3.2	0.014	NA	NA	20m.my577_rel.cz10a_bee
152273	0	0	0.0	1471.9	131.4	0.000	0.000	0.010	0.883	8929	12.4	0.059	7	3.0	19.5	3.2	0.013	NA	NA	20m.my578_rel.cz10a_bee
157031	0	0	0.0	1490.3	134.0	0.000	0.000	0.009	0.874	8529	12.3	0.054	6	3.0	19.5	3.2	0.013	NA	NA	20m.my579_rel.cz10a_bee
155814	0	0	0.0	1492.3	134.0	0.000	0.000	0.010	0.880	8484	12.3	0.054	6	3.0	19.5	3.2	0.013	NA	NA	20m.my5710_rel.cz10a_bee
152273	0	0	0.0	1478.0	131.7	0.000	0.000	0.010	0.885	8926	12.3	0.059	6	3.0	19.5	3.2	0.012	NA	NA	20m.my5720_rel.cz10a_bee
155814	0	0	0.0	1489.1	133.4	0.000	0.000	0.010	0.877	8388	12.1	0.054	6	3.0	19.5	3.2	0.020	NA	NA	20m.my5730_rel.cz10a_bee
152273	0	0	0.0	1480.9	131.3	0.000	0.000	0.010	0.883	8831	12.1	0.058	6	3.0	19.5	3.2	0.019	NA	NA	20m.my5744_rel.cz10a_bee
l.i1
l.i1: continue load after secondary indexes created. Graphs for performance per 1-second interval are here.
Average throughput:
Insert response time histogram: each cell has the percentage of responses that take <= the time in the header and max is the max response time in seconds. For the max column values in the top 25% of the range have a red background and in the bottom 25% of the range have a green background. The red background is not used when the min value is within 80% of the max value.
| dbms | 256us | 1ms | 4ms | 16ms | 64ms | 256ms | 1s | 4s | 16s | gt | max |
|---|---|---|---|---|---|---|---|---|---|---|---|
| my575_rel.cz10a_bee | 97.422 | 2.523 | 0.053 | 0.003 | 0.096 | ||||||
| my576_rel.cz10a_bee | 97.422 | 2.505 | 0.071 | 0.003 | 0.092 | ||||||
| my577_rel.cz10a_bee | 97.439 | 2.496 | 0.062 | 0.003 | 0.089 | ||||||
| my578_rel.cz10a_bee | 97.386 | 2.555 | 0.056 | 0.003 | 0.090 | ||||||
| my579_rel.cz10a_bee | 97.618 | 2.346 | 0.034 | 0.003 | 0.082 | ||||||
| my5710_rel.cz10a_bee | 97.623 | 2.341 | 0.033 | 0.003 | 0.089 | ||||||
| my5720_rel.cz10a_bee | 97.148 | 2.814 | 0.035 | 0.003 | 0.084 | ||||||
| my5730_rel.cz10a_bee | 97.157 | 2.786 | 0.054 | 0.003 | 0.096 | ||||||
| my5744_rel.cz10a_bee | 97.049 | 2.890 | 0.057 | 0.003 | 0.092 |
Delete response time histogram: each cell has the percentage of responses that take <= the time in the header and max is the max response time in seconds. For the max column values in the top 25% of the range have a red background and in the bottom 25% of the range have a green background. The red background is not used when the min value is within 80% of the max value.
| dbms | 256us | 1ms | 4ms | 16ms | 64ms | 256ms | 1s | 4s | 16s | gt | max |
|---|---|---|---|---|---|---|---|---|---|---|---|
| my575_rel.cz10a_bee | 98.266 | 1.714 | 0.017 | 0.003 | 0.095 | ||||||
| my576_rel.cz10a_bee | 98.252 | 1.730 | 0.014 | 0.003 | 0.097 | ||||||
| my577_rel.cz10a_bee | 98.276 | 1.709 | 0.012 | 0.003 | 0.090 | ||||||
| my578_rel.cz10a_bee | 98.254 | 1.728 | 0.014 | 0.003 | 0.085 | ||||||
| my579_rel.cz10a_bee | 98.318 | 1.665 | 0.014 | 0.003 | 0.081 | ||||||
| my5710_rel.cz10a_bee | 98.321 | 1.662 | 0.013 | 0.003 | 0.089 | ||||||
| my5720_rel.cz10a_bee | 97.822 | 2.166 | 0.009 | 0.003 | 0.085 | ||||||
| my5730_rel.cz10a_bee | 97.827 | 2.158 | 0.012 | 0.003 | 0.097 | ||||||
| my5744_rel.cz10a_bee | 97.685 | 2.299 | 0.012 | 0.003 | 0.091 |
Performance metrics for the DBMS listed above. Some are normalized by throughput, others are not. Legend for results is here.
ips	qps	rps	rmbps	wps	wmbps	rpq	rkbpq	wpi	wkbpi	csps	cpups	cspq	cpupq	dbgb1	dbgb2	rss	maxop	p50	p99	tag
20825	0	0	0.0	1700.3	74.2	0.000	0.000	0.082	3.647	13819	38.2	0.664	147	4.5	21.0	5.9	0.096	21238	6443	20m.my575_rel.cz10a_bee
20585	0	0	0.0	1737.4	75.0	0.000	0.000	0.084	3.729	13774	38.1	0.669	148	4.5	21.0	5.6	0.092	21027	5746	20m.my576_rel.cz10a_bee
20542	0	0	0.0	1714.8	74.4	0.000	0.000	0.083	3.708	13735	38.0	0.669	148	4.5	21.0	5.6	0.089	20985	5843	20m.my577_rel.cz10a_bee
20309	0	0	0.0	1719.8	74.5	0.000	0.000	0.085	3.758	13780	38.0	0.679	150	4.5	21.0	5.6	0.090	20777	6393	20m.my578_rel.cz10a_bee
21939	0	0	0.0	1798.2	78.5	0.000	0.000	0.082	3.663	14205	38.6	0.647	141	4.5	21.0	5.6	0.082	22373	7792	20m.my579_rel.cz10a_bee
21777	0	0	0.0	1783.7	78.1	0.000	0.000	0.082	3.675	14098	38.5	0.647	141	4.5	21.0	5.6	0.089	22139	7795	20m.my5710_rel.cz10a_bee
21053	0	0	0.0	1784.5	78.6	0.000	0.000	0.085	3.824	13939	38.3	0.662	146	4.4	20.9	5.5	0.084	21624	7641	20m.my5720_rel.cz10a_bee
21195	0	0	0.0	1800.9	79.5	0.000	0.000	0.085	3.840	14109	38.1	0.666	144	4.4	20.9	5.5	0.096	21786	7841	20m.my5730_rel.cz10a_bee
21213	0	0	0.0	1850.3	81.5	0.000	0.000	0.087	3.936	13980	37.7	0.659	142	4.3	20.8	5.4	0.092	21785	8091	20m.my5744_rel.cz10a_bee
q100.1
q100.1: range queries with 100 insert/s per client. Graphs for performance per 1-second interval are here.
Average throughput:
Query response time histogram: each cell has the percentage of responses that take <= the time in the header and max is the max response time in seconds. For max values in the top 25% of the range have a red background and in the bottom 25% of the range have a green background. The red background is not used when the min value is within 80% of the max value.
| dbms | 256us | 1ms | 4ms | 16ms | 64ms | 256ms | 1s | 4s | 16s | gt | max |
|---|---|---|---|---|---|---|---|---|---|---|---|
| my575_rel.cz10a_bee | 76.576 | 23.424 | nonzero | nonzero | 0.005 | ||||||
| my576_rel.cz10a_bee | 73.823 | 26.177 | nonzero | nonzero | 0.011 | ||||||
| my577_rel.cz10a_bee | 74.299 | 25.700 | 0.001 | 0.003 | |||||||
| my578_rel.cz10a_bee | 72.346 | 27.654 | 0.001 | nonzero | 0.005 | ||||||
| my579_rel.cz10a_bee | 69.142 | 30.858 | nonzero | nonzero | 0.006 | ||||||
| my5710_rel.cz10a_bee | 68.108 | 31.892 | nonzero | nonzero | 0.006 | ||||||
| my5720_rel.cz10a_bee | 68.364 | 31.635 | nonzero | 0.003 | |||||||
| my5730_rel.cz10a_bee | 67.232 | 32.767 | 0.001 | nonzero | 0.004 | ||||||
| my5744_rel.cz10a_bee | 63.768 | 36.231 | nonzero | 0.004 |
Insert response time histogram: each cell has the percentage of responses that take <= the time in the header and max is the max response time in seconds. For max values in the top 25% of the range have a red background and in the bottom 25% of the range have a green background. The red background is not used when the min value is within 80% of the max value.
| dbms | 256us | 1ms | 4ms | 16ms | 64ms | 256ms | 1s | 4s | 16s | gt | max |
|---|---|---|---|---|---|---|---|---|---|---|---|
| my575_rel.cz10a_bee | 99.583 | 0.417 | 0.014 | ||||||||
| my576_rel.cz10a_bee | 99.611 | 0.389 | 0.014 | ||||||||
| my577_rel.cz10a_bee | 99.472 | 0.528 | 0.014 | ||||||||
| my578_rel.cz10a_bee | 99.472 | 0.528 | 0.011 | ||||||||
| my579_rel.cz10a_bee | 99.583 | 0.389 | 0.028 | 0.018 | |||||||
| my5710_rel.cz10a_bee | 99.500 | 0.500 | 0.013 | ||||||||
| my5720_rel.cz10a_bee | 99.694 | 0.306 | 0.012 | ||||||||
| my5730_rel.cz10a_bee | 99.500 | 0.500 | 0.013 | ||||||||
| my5744_rel.cz10a_bee | 99.583 | 0.417 | 0.011 |
Delete response time histogram: each cell has the percentage of responses that take <= the time in the header and max is the max response time in seconds. For max values in the top 25% of the range have a red background and in the bottom 25% of the range have a green background. The red background is not used when the min value is within 80% of the max value.
| dbms | 256us | 1ms | 4ms | 16ms | 64ms | 256ms | 1s | 4s | 16s | gt | max |
|---|---|---|---|---|---|---|---|---|---|---|---|
| my575_rel.cz10a_bee | 99.639 | 0.361 | 0.008 | ||||||||
| my576_rel.cz10a_bee | 99.667 | 0.333 | 0.014 | ||||||||
| my577_rel.cz10a_bee | 99.556 | 0.444 | 0.009 | ||||||||
| my578_rel.cz10a_bee | 99.500 | 0.500 | 0.009 | ||||||||
| my579_rel.cz10a_bee | 99.528 | 0.472 | 0.012 | ||||||||
| my5710_rel.cz10a_bee | 99.528 | 0.472 | 0.009 | ||||||||
| my5720_rel.cz10a_bee | 99.722 | 0.278 | 0.010 | ||||||||
| my5730_rel.cz10a_bee | 99.528 | 0.472 | 0.013 | ||||||||
| my5744_rel.cz10a_bee | 99.694 | 0.306 | 0.011 |
Performance metrics for the DBMS listed above. Some are normalized by throughput, others are not. Legend for results is here.
ips	qps	rps	rmbps	wps	wmbps	rpq	rkbpq	wpi	wkbpi	csps	cpups	cspq	cpupq	dbgb1	dbgb2	rss	maxop	p50	p99	tag
100	4381	0	0.0	54.3	1.6	0.000	0.000	0.545	16.686	17078	12.9	3.898	236	4.5	21.0	5.9	0.005	4346	3980	20m.my575_rel.cz10a_bee
100	4246	0	0.0	63.0	1.9	0.000	0.000	0.632	19.444	16570	12.8	3.902	241	4.5	21.0	5.6	0.011	4202	3899	20m.my576_rel.cz10a_bee
100	4268	0	0.0	58.5	1.8	0.000	0.000	0.586	18.013	16630	12.8	3.896	240	4.5	21.0	5.6	0.003	4218	3899	20m.my577_rel.cz10a_bee
100	4168	0	0.0	58.9	1.8	0.000	0.000	0.590	18.121	16252	12.8	3.899	246	4.5	21.0	5.6	0.005	4123	3804	20m.my578_rel.cz10a_bee
100	4067	0	0.0	62.4	1.9	0.000	0.000	0.625	19.178	15892	13.0	3.907	256	4.5	21.0	5.6	0.006	4046	3758	20m.my579_rel.cz10a_bee
100	4013	0	0.0	67.9	2.0	0.000	0.000	0.681	20.967	15727	12.8	3.919	255	4.5	21.0	5.6	0.006	3981	3661	20m.my5710_rel.cz10a_bee
100	3985	0	0.0	62.0	1.9	0.000	0.000	0.622	19.179	15594	12.9	3.913	259	4.4	20.9	5.5	0.003	3947	3630	20m.my5720_rel.cz10a_bee
100	3947	0	0.0	58.9	1.8	0.000	0.000	0.590	18.202	15423	13.1	3.908	266	4.4	20.9	5.5	0.004	3902	3595	20m.my5730_rel.cz10a_bee
100	3844	0	0.0	58.4	1.8	0.000	0.000	0.585	18.030	15032	12.8	3.911	266	4.3	20.8	5.4	0.004	3806	3533	20m.my5744_rel.cz10a_bee
q500.1
q500.1: range queries with 500 insert/s per client. Graphs for performance per 1-second interval are here.
Average throughput:
Query response time histogram: each cell has the percentage of responses that take <= the time in the header and max is the max response time in seconds. For max values in the top 25% of the range have a red background and in the bottom 25% of the range have a green background. The red background is not used when the min value is within 80% of the max value.
| dbms | 256us | 1ms | 4ms | 16ms | 64ms | 256ms | 1s | 4s | 16s | gt | max |
|---|---|---|---|---|---|---|---|---|---|---|---|
| my575_rel.cz10a_bee | 77.059 | 22.941 | nonzero | nonzero | 0.010 | ||||||
| my576_rel.cz10a_bee | 72.311 | 27.689 | nonzero | nonzero | 0.007 | ||||||
| my577_rel.cz10a_bee | 72.133 | 27.866 | 0.001 | nonzero | 0.012 | ||||||
| my578_rel.cz10a_bee | 70.193 | 29.806 | 0.001 | nonzero | 0.007 | ||||||
| my579_rel.cz10a_bee | 71.818 | 28.181 | nonzero | nonzero | 0.006 | ||||||
| my5710_rel.cz10a_bee | 68.333 | 31.667 | nonzero | nonzero | 0.007 | ||||||
| my5720_rel.cz10a_bee | 67.264 | 32.736 | nonzero | nonzero | 0.005 | ||||||
| my5730_rel.cz10a_bee | 66.840 | 33.160 | nonzero | 0.003 | |||||||
| my5744_rel.cz10a_bee | 62.887 | 37.113 | nonzero | 0.004 |
Insert response time histogram: each cell has the percentage of responses that take <= the time in the header and max is the max response time in seconds. For max values in the top 25% of the range have a red background and in the bottom 25% of the range have a green background. The red background is not used when the min value is within 80% of the max value.
| dbms | 256us | 1ms | 4ms | 16ms | 64ms | 256ms | 1s | 4s | 16s | gt | max |
|---|---|---|---|---|---|---|---|---|---|---|---|
| my575_rel.cz10a_bee | 99.572 | 0.422 | 0.006 | 0.017 | |||||||
| my576_rel.cz10a_bee | 99.489 | 0.511 | 0.015 | ||||||||
| my577_rel.cz10a_bee | 99.572 | 0.428 | 0.015 | ||||||||
| my578_rel.cz10a_bee | 99.539 | 0.461 | 0.015 | ||||||||
| my579_rel.cz10a_bee | 99.522 | 0.478 | 0.015 | ||||||||
| my5710_rel.cz10a_bee | 99.589 | 0.411 | 0.015 | ||||||||
| my5720_rel.cz10a_bee | 99.383 | 0.617 | 0.010 | ||||||||
| my5730_rel.cz10a_bee | 99.489 | 0.511 | 0.014 | ||||||||
| my5744_rel.cz10a_bee | 99.489 | 0.511 | 0.014 |
Delete response time histogram: each cell has the percentage of responses that take <= the time in the header and max is the max response time in seconds. For max values in the top 25% of the range have a red background and in the bottom 25% of the range have a green background. The red background is not used when the min value is within 80% of the max value.
| dbms | 256us | 1ms | 4ms | 16ms | 64ms | 256ms | 1s | 4s | 16s | gt | max |
|---|---|---|---|---|---|---|---|---|---|---|---|
| my575_rel.cz10a_bee | 99.644 | 0.356 | 0.014 | ||||||||
| my576_rel.cz10a_bee | 99.617 | 0.383 | 0.014 | ||||||||
| my577_rel.cz10a_bee | 99.656 | 0.344 | 0.014 | ||||||||
| my578_rel.cz10a_bee | 99.622 | 0.378 | 0.014 | ||||||||
| my579_rel.cz10a_bee | 99.672 | 0.328 | 0.013 | ||||||||
| my5710_rel.cz10a_bee | 99.678 | 0.322 | 0.013 | ||||||||
| my5720_rel.cz10a_bee | 99.639 | 0.361 | 0.011 | ||||||||
| my5730_rel.cz10a_bee | 99.683 | 0.317 | 0.013 | ||||||||
| my5744_rel.cz10a_bee | 99.678 | 0.322 | 0.012 |
Performance metrics for the DBMS listed above. Some are normalized by throughput, others are not. Legend for results is here.
ips	qps	rps	rmbps	wps	wmbps	rpq	rkbpq	wpi	wkbpi	csps	cpups	cspq	cpupq	dbgb1	dbgb2	rss	maxop	p50	p99	tag
499	4399	0	0.0	18.5	1.0	0.000	0.000	0.037	1.960	17133	13.7	3.895	249	4.5	21.0	5.9	0.010	4342	3979	20m.my575_rel.cz10a_bee
499	4175	0	0.0	22.4	1.0	0.000	0.000	0.045	2.095	16297	13.8	3.904	264	4.5	21.0	5.6	0.007	4140	3868	20m.my576_rel.cz10a_bee
499	4163	0	0.0	25.6	1.1	0.000	0.000	0.051	2.331	16264	13.8	3.906	265	4.5	21.0	5.6	0.012	4138	3853	20m.my577_rel.cz10a_bee
499	4098	0	0.0	27.6	1.1	0.000	0.000	0.055	2.348	16018	13.8	3.909	269	4.5	21.0	5.6	0.007	4059	3771	20m.my578_rel.cz10a_bee
499	4161	0	0.0	27.8	1.1	0.000	0.000	0.056	2.358	16288	13.9	3.914	267	4.5	21.0	5.6	0.006	4123	3804	20m.my579_rel.cz10a_bee
499	3992	0	0.0	20.3	1.0	0.000	0.000	0.041	2.044	15588	13.8	3.905	277	4.5	21.0	5.6	0.007	3979	3661	20m.my5710_rel.cz10a_bee
499	3952	0	0.0	26.3	1.1	0.000	0.000	0.053	2.287	15468	13.8	3.914	279	4.4	20.9	5.5	0.005	3927	3628	20m.my5720_rel.cz10a_bee
499	3925	0	0.0	26.2	1.1	0.000	0.000	0.052	2.298	15355	13.9	3.912	283	4.4	20.9	5.5	0.003	3900	3567	20m.my5730_rel.cz10a_bee
499	3814	0	0.0	29.1	1.2	0.000	0.000	0.058	2.483	14946	13.7	3.919	287	4.3	20.8	5.4	0.004	3788	3516	20m.my5744_rel.cz10a_bee
q1000.1
q1000.1: range queries with 1000 insert/s per client. Graphs for performance per 1-second interval are here.
Average throughput:
Query response time histogram: each cell has the percentage of responses that take <= the time in the header and max is the max response time in seconds. For max values in the top 25% of the range have a red background and in the bottom 25% of the range have a green background. The red background is not used when the min value is within 80% of the max value.
| dbms | 256us | 1ms | 4ms | 16ms | 64ms | 256ms | 1s | 4s | 16s | gt | max |
|---|---|---|---|---|---|---|---|---|---|---|---|
| my575_rel.cz10a_bee | 75.811 | 24.188 | 0.001 | nonzero | 0.007 | ||||||
| my576_rel.cz10a_bee | 73.931 | 26.067 | 0.001 | nonzero | 0.013 | ||||||
| my577_rel.cz10a_bee | 72.673 | 27.326 | 0.001 | nonzero | 0.009 | ||||||
| my578_rel.cz10a_bee | 70.427 | 29.571 | 0.001 | nonzero | 0.006 | ||||||
| my579_rel.cz10a_bee | 70.814 | 29.185 | 0.001 | nonzero | 0.006 | ||||||
| my5710_rel.cz10a_bee | 68.743 | 31.256 | 0.001 | nonzero | 0.011 | ||||||
| my5720_rel.cz10a_bee | 67.591 | 32.408 | 0.001 | nonzero | 0.005 | ||||||
| my5730_rel.cz10a_bee | 66.339 | 33.660 | 0.001 | nonzero | 0.005 | ||||||
| my5744_rel.cz10a_bee | 62.840 | 37.159 | 0.001 | nonzero | 0.005 |
Insert response time histogram: each cell has the percentage of responses that take <= the time in the header and max is the max response time in seconds. For max values in the top 25% of the range have a red background and in the bottom 25% of the range have a green background. The red background is not used when the min value is within 80% of the max value.
| dbms | 256us | 1ms | 4ms | 16ms | 64ms | 256ms | 1s | 4s | 16s | gt | max |
|---|---|---|---|---|---|---|---|---|---|---|---|
| my575_rel.cz10a_bee | 99.519 | 0.478 | 0.003 | 0.054 | |||||||
| my576_rel.cz10a_bee | 98.953 | 1.044 | 0.003 | 0.041 | |||||||
| my577_rel.cz10a_bee | 99.486 | 0.511 | 0.003 | 0.048 | |||||||
| my578_rel.cz10a_bee | 99.244 | 0.750 | 0.006 | 0.050 | |||||||
| my579_rel.cz10a_bee | 99.531 | 0.464 | 0.006 | 0.049 | |||||||
| my5710_rel.cz10a_bee | 99.675 | 0.319 | 0.006 | 0.049 | |||||||
| my5720_rel.cz10a_bee | 99.442 | 0.556 | 0.003 | 0.052 | |||||||
| my5730_rel.cz10a_bee | 99.511 | 0.486 | 0.003 | 0.048 | |||||||
| my5744_rel.cz10a_bee | 99.467 | 0.531 | 0.003 | 0.047 |
Delete response time histogram: each cell has the percentage of responses that take <= the time in the header and max is the max response time in seconds. For max values in the top 25% of the range have a red background and in the bottom 25% of the range have a green background. The red background is not used when the min value is within 80% of the max value.
| dbms | 256us | 1ms | 4ms | 16ms | 64ms | 256ms | 1s | 4s | 16s | gt | max |
|---|---|---|---|---|---|---|---|---|---|---|---|
| my575_rel.cz10a_bee | 99.653 | 0.344 | 0.003 | 0.052 | |||||||
| my576_rel.cz10a_bee | 99.272 | 0.722 | 0.006 | 0.039 | |||||||
| my577_rel.cz10a_bee | 99.703 | 0.294 | 0.003 | 0.050 | |||||||
| my578_rel.cz10a_bee | 99.503 | 0.497 | 0.016 | ||||||||
| my579_rel.cz10a_bee | 99.636 | 0.361 | 0.003 | 0.050 | |||||||
| my5710_rel.cz10a_bee | 99.764 | 0.231 | 0.006 | 0.020 | |||||||
| my5720_rel.cz10a_bee | 99.603 | 0.394 | 0.003 | 0.050 | |||||||
| my5730_rel.cz10a_bee | 99.611 | 0.383 | 0.006 | 0.048 | |||||||
| my5744_rel.cz10a_bee | 99.606 | 0.392 | 0.003 | 0.050 |
Performance metrics for the DBMS listed above. Some are normalized by throughput, others are not. Legend for results is here.
ips	qps	rps	rmbps	wps	wmbps	rpq	rkbpq	wpi	wkbpi	csps	cpups	cspq	cpupq	dbgb1	dbgb2	rss	maxop	p50	p99	tag
997	4326	0	0.0	112.1	4.2	0.000	0.000	0.112	4.262	17322	14.9	4.004	276	4.5	21.0	5.9	0.007	4285	3963	20m.my575_rel.cz10a_bee
998	4265	0	0.0	112.9	4.1	0.000	0.000	0.113	4.256	17081	14.9	4.005	279	4.5	21.0	5.6	0.013	4203	3900	20m.my576_rel.cz10a_bee
997	4193	0	0.0	110.0	4.1	0.000	0.000	0.110	4.195	16801	14.9	4.007	284	4.5	21.0	5.6	0.009	4155	3852	20m.my577_rel.cz10a_bee
999	4104	0	0.0	114.6	4.2	0.000	0.000	0.115	4.294	16461	14.9	4.011	290	4.5	21.0	5.6	0.006	4075	3741	20m.my578_rel.cz10a_bee
998	4050	0	0.0	109.0	4.1	0.000	0.000	0.109	4.189	16244	15.0	4.011	296	4.5	21.0	5.6	0.006	4027	3706	20m.my579_rel.cz10a_bee
997	4008	0	0.0	113.7	4.2	0.000	0.000	0.114	4.304	16103	14.9	4.017	297	4.5	21.0	5.6	0.011	3993	3675	20m.my5710_rel.cz10a_bee
998	3972	0	0.0	107.3	4.0	0.000	0.000	0.108	4.098	15953	14.9	4.016	300	4.4	20.9	5.5	0.005	3946	3612	20m.my5720_rel.cz10a_bee
997	3916	0	0.0	111.6	4.1	0.000	0.000	0.112	4.225	15758	14.9	4.024	304	4.4	20.9	5.5	0.005	3883	3580	20m.my5730_rel.cz10a_bee
998	3796	0	0.0	112.8	4.2	0.000	0.000	0.113	4.272	15303	14.8	4.031	312	4.3	20.8	5.4	0.005	3772	3499	20m.my5744_rel.cz10a_bee
l.i0
l.i0: load without secondary indexes
Performance metrics for all DBMS, not just the ones listed above. Some are normalized by throughput, others are not. Legend for results is here.
ips	qps	rps	rmbps	wps	wmbps	rpq	rkbpq	wpi	wkbpi	csps	cpups	cspq	cpupq	dbgb1	dbgb2	rss	maxop	p50	p99	tag
91324	0	0	0.0	198.5	25.2	0.000	0.000	0.002	0.282	9049	21.5	0.099	19	1.3	17.8	2.6	0.108	91808	80711	20m.my575_rel.cz10a_bee
89686	0	0	0.0	204.1	24.8	0.000	0.000	0.002	0.283	8951	21.2	0.100	19	1.3	17.8	2.2	0.102	90306	79516	20m.my576_rel.cz10a_bee
89286	0	0	0.0	202.5	24.6	0.000	0.000	0.002	0.283	8849	21.1	0.099	19	1.3	17.8	2.2	0.106	89776	78013	20m.my577_rel.cz10a_bee
86956	0	0	0.0	201.3	24.1	0.000	0.000	0.002	0.283	8682	21.0	0.100	19	1.3	17.8	2.2	0.106	87336	77317	20m.my578_rel.cz10a_bee
88496	0	0	0.0	206.3	24.6	0.000	0.000	0.002	0.285	8841	21.2	0.100	19	1.3	17.8	2.2	0.108	89406	78144	20m.my579_rel.cz10a_bee
86580	0	0	0.0	199.1	23.9	0.000	0.000	0.002	0.283	8687	21.3	0.100	20	1.3	17.8	2.2	0.103	86999	76098	20m.my5710_rel.cz10a_bee
86580	0	0	0.0	199.5	23.9	0.000	0.000	0.002	0.283	8675	21.0	0.100	19	1.3	17.8	2.2	0.104	86797	76248	20m.my5720_rel.cz10a_bee
84034	0	0	0.0	197.3	23.4	0.000	0.000	0.002	0.285	8521	21.2	0.101	20	1.3	17.8	2.3	0.105	85205	60107	20m.my5730_rel.cz10a_bee
83682	0	0	0.0	193.5	23.2	0.000	0.000	0.002	0.284	8470	21.2	0.101	20	1.3	17.8	2.3	0.106	84478	73519	20m.my5744_rel.cz10a_bee
l.x
l.x: create secondary indexes
Performance metrics for all DBMS, not just the ones listed above. Some are normalized by throughput, others are not. Legend for results is here.
ips	qps	rps	rmbps	wps	wmbps	rpq	rkbpq	wpi	wkbpi	csps	cpups	cspq	cpupq	dbgb1	dbgb2	rss	maxop	p50	p99	tag
184404	0	0	0.0	1381.3	157.2	0.000	0.000	0.007	0.873	7979	12.3	0.043	5	2.9	19.4	3.6	0.012	NA	NA	20m.my575_rel.cz10a_bee
159524	0	0	0.0	1321.2	140.1	0.000	0.000	0.008	0.899	8936	12.4	0.056	6	3.0	19.5	3.3	0.013	NA	NA	20m.my576_rel.cz10a_bee
148889	0	0	0.0	1326.9	132.8	0.000	0.000	0.009	0.914	8568	12.4	0.058	7	3.0	19.5	3.2	0.014	NA	NA	20m.my577_rel.cz10a_bee
152273	0	0	0.0	1471.9	131.4	0.000	0.000	0.010	0.883	8929	12.4	0.059	7	3.0	19.5	3.2	0.013	NA	NA	20m.my578_rel.cz10a_bee
157031	0	0	0.0	1490.3	134.0	0.000	0.000	0.009	0.874	8529	12.3	0.054	6	3.0	19.5	3.2	0.013	NA	NA	20m.my579_rel.cz10a_bee
155814	0	0	0.0	1492.3	134.0	0.000	0.000	0.010	0.880	8484	12.3	0.054	6	3.0	19.5	3.2	0.013	NA	NA	20m.my5710_rel.cz10a_bee
152273	0	0	0.0	1478.0	131.7	0.000	0.000	0.010	0.885	8926	12.3	0.059	6	3.0	19.5	3.2	0.012	NA	NA	20m.my5720_rel.cz10a_bee
155814	0	0	0.0	1489.1	133.4	0.000	0.000	0.010	0.877	8388	12.1	0.054	6	3.0	19.5	3.2	0.020	NA	NA	20m.my5730_rel.cz10a_bee
152273	0	0	0.0	1480.9	131.3	0.000	0.000	0.010	0.883	8831	12.1	0.058	6	3.0	19.5	3.2	0.019	NA	NA	20m.my5744_rel.cz10a_bee
l.i1
l.i1: continue load after secondary indexes created
Performance metrics for all DBMS, not just the ones listed above. Some are normalized by throughput, others are not. Legend for results is here.
ips	qps	rps	rmbps	wps	wmbps	rpq	rkbpq	wpi	wkbpi	csps	cpups	cspq	cpupq	dbgb1	dbgb2	rss	maxop	p50	p99	tag
20825	0	0	0.0	1700.3	74.2	0.000	0.000	0.082	3.647	13819	38.2	0.664	147	4.5	21.0	5.9	0.096	21238	6443	20m.my575_rel.cz10a_bee
20585	0	0	0.0	1737.4	75.0	0.000	0.000	0.084	3.729	13774	38.1	0.669	148	4.5	21.0	5.6	0.092	21027	5746	20m.my576_rel.cz10a_bee
20542	0	0	0.0	1714.8	74.4	0.000	0.000	0.083	3.708	13735	38.0	0.669	148	4.5	21.0	5.6	0.089	20985	5843	20m.my577_rel.cz10a_bee
20309	0	0	0.0	1719.8	74.5	0.000	0.000	0.085	3.758	13780	38.0	0.679	150	4.5	21.0	5.6	0.090	20777	6393	20m.my578_rel.cz10a_bee
21939	0	0	0.0	1798.2	78.5	0.000	0.000	0.082	3.663	14205	38.6	0.647	141	4.5	21.0	5.6	0.082	22373	7792	20m.my579_rel.cz10a_bee
21777	0	0	0.0	1783.7	78.1	0.000	0.000	0.082	3.675	14098	38.5	0.647	141	4.5	21.0	5.6	0.089	22139	7795	20m.my5710_rel.cz10a_bee
21053	0	0	0.0	1784.5	78.6	0.000	0.000	0.085	3.824	13939	38.3	0.662	146	4.4	20.9	5.5	0.084	21624	7641	20m.my5720_rel.cz10a_bee
21195	0	0	0.0	1800.9	79.5	0.000	0.000	0.085	3.840	14109	38.1	0.666	144	4.4	20.9	5.5	0.096	21786	7841	20m.my5730_rel.cz10a_bee
21213	0	0	0.0	1850.3	81.5	0.000	0.000	0.087	3.936	13980	37.7	0.659	142	4.3	20.8	5.4	0.092	21785	8091	20m.my5744_rel.cz10a_bee
q100.1
q100.1: range queries with 100 insert/s per client
Performance metrics for all DBMS, not just the ones listed above. Some are normalized by throughput, others are not. Legend for results is here.
ips	qps	rps	rmbps	wps	wmbps	rpq	rkbpq	wpi	wkbpi	csps	cpups	cspq	cpupq	dbgb1	dbgb2	rss	maxop	p50	p99	tag
100	4381	0	0.0	54.3	1.6	0.000	0.000	0.545	16.686	17078	12.9	3.898	236	4.5	21.0	5.9	0.005	4346	3980	20m.my575_rel.cz10a_bee
100	4246	0	0.0	63.0	1.9	0.000	0.000	0.632	19.444	16570	12.8	3.902	241	4.5	21.0	5.6	0.011	4202	3899	20m.my576_rel.cz10a_bee
100	4268	0	0.0	58.5	1.8	0.000	0.000	0.586	18.013	16630	12.8	3.896	240	4.5	21.0	5.6	0.003	4218	3899	20m.my577_rel.cz10a_bee
100	4168	0	0.0	58.9	1.8	0.000	0.000	0.590	18.121	16252	12.8	3.899	246	4.5	21.0	5.6	0.005	4123	3804	20m.my578_rel.cz10a_bee
100	4067	0	0.0	62.4	1.9	0.000	0.000	0.625	19.178	15892	13.0	3.907	256	4.5	21.0	5.6	0.006	4046	3758	20m.my579_rel.cz10a_bee
100	4013	0	0.0	67.9	2.0	0.000	0.000	0.681	20.967	15727	12.8	3.919	255	4.5	21.0	5.6	0.006	3981	3661	20m.my5710_rel.cz10a_bee
100	3985	0	0.0	62.0	1.9	0.000	0.000	0.622	19.179	15594	12.9	3.913	259	4.4	20.9	5.5	0.003	3947	3630	20m.my5720_rel.cz10a_bee
100	3947	0	0.0	58.9	1.8	0.000	0.000	0.590	18.202	15423	13.1	3.908	266	4.4	20.9	5.5	0.004	3902	3595	20m.my5730_rel.cz10a_bee
100	3844	0	0.0	58.4	1.8	0.000	0.000	0.585	18.030	15032	12.8	3.911	266	4.3	20.8	5.4	0.004	3806	3533	20m.my5744_rel.cz10a_bee
q500.1
q500.1: range queries with 500 insert/s per client
Performance metrics for all DBMS, not just the ones listed above. Some are normalized by throughput, others are not. Legend for results is here.
ips	qps	rps	rmbps	wps	wmbps	rpq	rkbpq	wpi	wkbpi	csps	cpups	cspq	cpupq	dbgb1	dbgb2	rss	maxop	p50	p99	tag
499	4399	0	0.0	18.5	1.0	0.000	0.000	0.037	1.960	17133	13.7	3.895	249	4.5	21.0	5.9	0.010	4342	3979	20m.my575_rel.cz10a_bee
499	4175	0	0.0	22.4	1.0	0.000	0.000	0.045	2.095	16297	13.8	3.904	264	4.5	21.0	5.6	0.007	4140	3868	20m.my576_rel.cz10a_bee
499	4163	0	0.0	25.6	1.1	0.000	0.000	0.051	2.331	16264	13.8	3.906	265	4.5	21.0	5.6	0.012	4138	3853	20m.my577_rel.cz10a_bee
499	4098	0	0.0	27.6	1.1	0.000	0.000	0.055	2.348	16018	13.8	3.909	269	4.5	21.0	5.6	0.007	4059	3771	20m.my578_rel.cz10a_bee
499	4161	0	0.0	27.8	1.1	0.000	0.000	0.056	2.358	16288	13.9	3.914	267	4.5	21.0	5.6	0.006	4123	3804	20m.my579_rel.cz10a_bee
499	3992	0	0.0	20.3	1.0	0.000	0.000	0.041	2.044	15588	13.8	3.905	277	4.5	21.0	5.6	0.007	3979	3661	20m.my5710_rel.cz10a_bee
499	3952	0	0.0	26.3	1.1	0.000	0.000	0.053	2.287	15468	13.8	3.914	279	4.4	20.9	5.5	0.005	3927	3628	20m.my5720_rel.cz10a_bee
499	3925	0	0.0	26.2	1.1	0.000	0.000	0.052	2.298	15355	13.9	3.912	283	4.4	20.9	5.5	0.003	3900	3567	20m.my5730_rel.cz10a_bee
499	3814	0	0.0	29.1	1.2	0.000	0.000	0.058	2.483	14946	13.7	3.919	287	4.3	20.8	5.4	0.004	3788	3516	20m.my5744_rel.cz10a_bee
q1000.1
q1000.1: range queries with 1000 insert/s per client
Performance metrics for all DBMS, not just the ones listed above. Some are normalized by throughput, others are not. Legend for results is here.
ips	qps	rps	rmbps	wps	wmbps	rpq	rkbpq	wpi	wkbpi	csps	cpups	cspq	cpupq	dbgb1	dbgb2	rss	maxop	p50	p99	tag
997	4326	0	0.0	112.1	4.2	0.000	0.000	0.112	4.262	17322	14.9	4.004	276	4.5	21.0	5.9	0.007	4285	3963	20m.my575_rel.cz10a_bee
998	4265	0	0.0	112.9	4.1	0.000	0.000	0.113	4.256	17081	14.9	4.005	279	4.5	21.0	5.6	0.013	4203	3900	20m.my576_rel.cz10a_bee
997	4193	0	0.0	110.0	4.1	0.000	0.000	0.110	4.195	16801	14.9	4.007	284	4.5	21.0	5.6	0.009	4155	3852	20m.my577_rel.cz10a_bee
999	4104	0	0.0	114.6	4.2	0.000	0.000	0.115	4.294	16461	14.9	4.011	290	4.5	21.0	5.6	0.006	4075	3741	20m.my578_rel.cz10a_bee
998	4050	0	0.0	109.0	4.1	0.000	0.000	0.109	4.189	16244	15.0	4.011	296	4.5	21.0	5.6	0.006	4027	3706	20m.my579_rel.cz10a_bee
997	4008	0	0.0	113.7	4.2	0.000	0.000	0.114	4.304	16103	14.9	4.017	297	4.5	21.0	5.6	0.011	3993	3675	20m.my5710_rel.cz10a_bee
998	3972	0	0.0	107.3	4.0	0.000	0.000	0.108	4.098	15953	14.9	4.016	300	4.4	20.9	5.5	0.005	3946	3612	20m.my5720_rel.cz10a_bee
997	3916	0	0.0	111.6	4.1	0.000	0.000	0.112	4.225	15758	14.9	4.024	304	4.4	20.9	5.5	0.005	3883	3580	20m.my5730_rel.cz10a_bee
998	3796	0	0.0	112.8	4.2	0.000	0.000	0.113	4.272	15303	14.8	4.031	312	4.3	20.8	5.4	0.005	3772	3499	20m.my5744_rel.cz10a_bee
l.i0
- l.i0: load without secondary indexes
- Legend for results is here.
- Each entry lists the percentage of responses that fit in that bucket (slower than max time for previous bucket, faster than min time for next bucket).
Insert response time histogram
256us	1ms	4ms	16ms	64ms	256ms	1s	4s	16s	gt	max	tag
0.000	49.766	49.959	0.270	0.002	0.003	0.000	0.000	0.000	0.000	0.108	my575_rel.cz10a_bee
0.000	34.914	64.806	0.274	0.003	0.003	0.000	0.000	0.000	0.000	0.102	my576_rel.cz10a_bee
0.000	26.210	73.497	0.286	0.003	0.003	0.000	0.000	0.000	0.000	0.106	my577_rel.cz10a_bee
0.000	7.843	91.868	0.280	0.007	0.002	0.000	0.000	0.000	0.000	0.106	my578_rel.cz10a_bee
0.000	26.339	73.367	0.288	0.003	0.003	0.000	0.000	0.000	0.000	0.108	my579_rel.cz10a_bee
0.000	5.095	94.608	0.289	0.005	0.003	0.000	0.000	0.000	0.000	0.103	my5710_rel.cz10a_bee
0.000	5.135	94.569	0.290	0.003	0.003	0.000	0.000	0.000	0.000	0.104	my5720_rel.cz10a_bee
0.000	2.620	97.029	0.210	0.138	0.003	0.000	0.000	0.000	0.000	0.105	my5730_rel.cz10a_bee
0.000	2.107	97.543	0.205	0.144	0.002	0.000	0.000	0.000	0.000	0.106	my5744_rel.cz10a_bee
l.x
- l.x: create secondary indexes
- Legend for results is here.
- Each entry lists the percentage of responses that fit in that bucket (slower than max time for previous bucket, faster than min time for next bucket).
TODO - determine whether there is data for create index response time
l.i1
- l.i1: continue load after secondary indexes created
- Legend for results is here.
- Each entry lists the percentage of responses that fit in that bucket (slower than max time for previous bucket, faster than min time for next bucket).
Insert response time histogram
256us	1ms	4ms	16ms	64ms	256ms	1s	4s	16s	gt	max	tag
0.000	0.000	97.422	2.523	0.053	0.003	0.000	0.000	0.000	0.000	0.096	my575_rel.cz10a_bee
0.000	0.000	97.422	2.505	0.071	0.003	0.000	0.000	0.000	0.000	0.092	my576_rel.cz10a_bee
0.000	0.000	97.439	2.496	0.062	0.003	0.000	0.000	0.000	0.000	0.089	my577_rel.cz10a_bee
0.000	0.000	97.386	2.555	0.056	0.003	0.000	0.000	0.000	0.000	0.090	my578_rel.cz10a_bee
0.000	0.000	97.618	2.346	0.034	0.003	0.000	0.000	0.000	0.000	0.082	my579_rel.cz10a_bee
0.000	0.000	97.623	2.341	0.033	0.003	0.000	0.000	0.000	0.000	0.089	my5710_rel.cz10a_bee
0.000	0.000	97.148	2.814	0.035	0.003	0.000	0.000	0.000	0.000	0.084	my5720_rel.cz10a_bee
0.000	0.000	97.157	2.786	0.054	0.003	0.000	0.000	0.000	0.000	0.096	my5730_rel.cz10a_bee
0.000	0.000	97.049	2.890	0.057	0.003	0.000	0.000	0.000	0.000	0.092	my5744_rel.cz10a_bee
Delete response time histogram
256us	1ms	4ms	16ms	64ms	256ms	1s	4s	16s	gt	max	tag
0.000	0.000	98.266	1.714	0.017	0.003	0.000	0.000	0.000	0.000	0.095	my575_rel.cz10a_bee
0.000	0.000	98.252	1.730	0.014	0.003	0.000	0.000	0.000	0.000	0.097	my576_rel.cz10a_bee
0.000	0.000	98.276	1.709	0.012	0.003	0.000	0.000	0.000	0.000	0.090	my577_rel.cz10a_bee
0.000	0.000	98.254	1.728	0.014	0.003	0.000	0.000	0.000	0.000	0.085	my578_rel.cz10a_bee
0.000	0.000	98.318	1.665	0.014	0.003	0.000	0.000	0.000	0.000	0.081	my579_rel.cz10a_bee
0.000	0.000	98.321	1.662	0.013	0.003	0.000	0.000	0.000	0.000	0.089	my5710_rel.cz10a_bee
0.000	0.000	97.822	2.166	0.009	0.003	0.000	0.000	0.000	0.000	0.085	my5720_rel.cz10a_bee
0.000	0.000	97.827	2.158	0.012	0.003	0.000	0.000	0.000	0.000	0.097	my5730_rel.cz10a_bee
0.000	0.000	97.685	2.299	0.012	0.003	0.000	0.000	0.000	0.000	0.091	my5744_rel.cz10a_bee
q100.1
- q100.1: range queries with 100 insert/s per client
- Legend for results is here.
- Each entry lists the percentage of responses that fit in that bucket (slower than max time for previous bucket, faster than min time for next bucket).
Query response time histogram
256us	1ms	4ms	16ms	64ms	256ms	1s	4s	16s	gt	max	tag
76.576	23.424	nonzero	nonzero	0.000	0.000	0.000	0.000	0.000	0.000	0.005	my575_rel.cz10a_bee
73.823	26.177	nonzero	nonzero	0.000	0.000	0.000	0.000	0.000	0.000	0.011	my576_rel.cz10a_bee
74.299	25.700	0.001	0.000	0.000	0.000	0.000	0.000	0.000	0.000	0.003	my577_rel.cz10a_bee
72.346	27.654	0.001	nonzero	0.000	0.000	0.000	0.000	0.000	0.000	0.005	my578_rel.cz10a_bee
69.142	30.858	nonzero	nonzero	0.000	0.000	0.000	0.000	0.000	0.000	0.006	my579_rel.cz10a_bee
68.108	31.892	nonzero	nonzero	0.000	0.000	0.000	0.000	0.000	0.000	0.006	my5710_rel.cz10a_bee
68.364	31.635	nonzero	0.000	0.000	0.000	0.000	0.000	0.000	0.000	0.003	my5720_rel.cz10a_bee
67.232	32.767	0.001	nonzero	0.000	0.000	0.000	0.000	0.000	0.000	0.004	my5730_rel.cz10a_bee
63.768	36.231	nonzero	0.000	0.000	0.000	0.000	0.000	0.000	0.000	0.004	my5744_rel.cz10a_bee
Insert response time histogram
256us	1ms	4ms	16ms	64ms	256ms	1s	4s	16s	gt	max	tag
0.000	0.000	99.583	0.417	0.000	0.000	0.000	0.000	0.000	0.000	0.014	my575_rel.cz10a_bee
0.000	0.000	99.611	0.389	0.000	0.000	0.000	0.000	0.000	0.000	0.014	my576_rel.cz10a_bee
0.000	0.000	99.472	0.528	0.000	0.000	0.000	0.000	0.000	0.000	0.014	my577_rel.cz10a_bee
0.000	0.000	99.472	0.528	0.000	0.000	0.000	0.000	0.000	0.000	0.011	my578_rel.cz10a_bee
0.000	0.000	99.583	0.389	0.028	0.000	0.000	0.000	0.000	0.000	0.018	my579_rel.cz10a_bee
0.000	0.000	99.500	0.500	0.000	0.000	0.000	0.000	0.000	0.000	0.013	my5710_rel.cz10a_bee
0.000	0.000	99.694	0.306	0.000	0.000	0.000	0.000	0.000	0.000	0.012	my5720_rel.cz10a_bee
0.000	0.000	99.500	0.500	0.000	0.000	0.000	0.000	0.000	0.000	0.013	my5730_rel.cz10a_bee
0.000	0.000	99.583	0.417	0.000	0.000	0.000	0.000	0.000	0.000	0.011	my5744_rel.cz10a_bee
Delete response time histogram
256us	1ms	4ms	16ms	64ms	256ms	1s	4s	16s	gt	max	tag
0.000	0.000	99.639	0.361	0.000	0.000	0.000	0.000	0.000	0.000	0.008	my575_rel.cz10a_bee
0.000	0.000	99.667	0.333	0.000	0.000	0.000	0.000	0.000	0.000	0.014	my576_rel.cz10a_bee
0.000	0.000	99.556	0.444	0.000	0.000	0.000	0.000	0.000	0.000	0.009	my577_rel.cz10a_bee
0.000	0.000	99.500	0.500	0.000	0.000	0.000	0.000	0.000	0.000	0.009	my578_rel.cz10a_bee
0.000	0.000	99.528	0.472	0.000	0.000	0.000	0.000	0.000	0.000	0.012	my579_rel.cz10a_bee
0.000	0.000	99.528	0.472	0.000	0.000	0.000	0.000	0.000	0.000	0.009	my5710_rel.cz10a_bee
0.000	0.000	99.722	0.278	0.000	0.000	0.000	0.000	0.000	0.000	0.010	my5720_rel.cz10a_bee
0.000	0.000	99.528	0.472	0.000	0.000	0.000	0.000	0.000	0.000	0.013	my5730_rel.cz10a_bee
0.000	0.000	99.694	0.306	0.000	0.000	0.000	0.000	0.000	0.000	0.011	my5744_rel.cz10a_bee
q500.1
- q500.1: range queries with 500 insert/s per client
- Legend for results is here.
- Each entry lists the percentage of responses that fit in that bucket (slower than max time for previous bucket, faster than min time for next bucket).
Query response time histogram
256us	1ms	4ms	16ms	64ms	256ms	1s	4s	16s	gt	max	tag
77.059	22.941	nonzero	nonzero	0.000	0.000	0.000	0.000	0.000	0.000	0.010	my575_rel.cz10a_bee
72.311	27.689	nonzero	nonzero	0.000	0.000	0.000	0.000	0.000	0.000	0.007	my576_rel.cz10a_bee
72.133	27.866	0.001	nonzero	0.000	0.000	0.000	0.000	0.000	0.000	0.012	my577_rel.cz10a_bee
70.193	29.806	0.001	nonzero	0.000	0.000	0.000	0.000	0.000	0.000	0.007	my578_rel.cz10a_bee
71.818	28.181	nonzero	nonzero	0.000	0.000	0.000	0.000	0.000	0.000	0.006	my579_rel.cz10a_bee
68.333	31.667	nonzero	nonzero	0.000	0.000	0.000	0.000	0.000	0.000	0.007	my5710_rel.cz10a_bee
67.264	32.736	nonzero	nonzero	0.000	0.000	0.000	0.000	0.000	0.000	0.005	my5720_rel.cz10a_bee
66.840	33.160	nonzero	0.000	0.000	0.000	0.000	0.000	0.000	0.000	0.003	my5730_rel.cz10a_bee
62.887	37.113	nonzero	0.000	0.000	0.000	0.000	0.000	0.000	0.000	0.004	my5744_rel.cz10a_bee
Insert response time histogram
256us	1ms	4ms	16ms	64ms	256ms	1s	4s	16s	gt	max	tag
0.000	0.000	99.572	0.422	0.006	0.000	0.000	0.000	0.000	0.000	0.017	my575_rel.cz10a_bee
0.000	0.000	99.489	0.511	0.000	0.000	0.000	0.000	0.000	0.000	0.015	my576_rel.cz10a_bee
0.000	0.000	99.572	0.428	0.000	0.000	0.000	0.000	0.000	0.000	0.015	my577_rel.cz10a_bee
0.000	0.000	99.539	0.461	0.000	0.000	0.000	0.000	0.000	0.000	0.015	my578_rel.cz10a_bee
0.000	0.000	99.522	0.478	0.000	0.000	0.000	0.000	0.000	0.000	0.015	my579_rel.cz10a_bee
0.000	0.000	99.589	0.411	0.000	0.000	0.000	0.000	0.000	0.000	0.015	my5710_rel.cz10a_bee
0.000	0.000	99.383	0.617	0.000	0.000	0.000	0.000	0.000	0.000	0.010	my5720_rel.cz10a_bee
0.000	0.000	99.489	0.511	0.000	0.000	0.000	0.000	0.000	0.000	0.014	my5730_rel.cz10a_bee
0.000	0.000	99.489	0.511	0.000	0.000	0.000	0.000	0.000	0.000	0.014	my5744_rel.cz10a_bee
Delete response time histogram
256us	1ms	4ms	16ms	64ms	256ms	1s	4s	16s	gt	max	tag
0.000	0.000	99.644	0.356	0.000	0.000	0.000	0.000	0.000	0.000	0.014	my575_rel.cz10a_bee
0.000	0.000	99.617	0.383	0.000	0.000	0.000	0.000	0.000	0.000	0.014	my576_rel.cz10a_bee
0.000	0.000	99.656	0.344	0.000	0.000	0.000	0.000	0.000	0.000	0.014	my577_rel.cz10a_bee
0.000	0.000	99.622	0.378	0.000	0.000	0.000	0.000	0.000	0.000	0.014	my578_rel.cz10a_bee
0.000	0.000	99.672	0.328	0.000	0.000	0.000	0.000	0.000	0.000	0.013	my579_rel.cz10a_bee
0.000	0.000	99.678	0.322	0.000	0.000	0.000	0.000	0.000	0.000	0.013	my5710_rel.cz10a_bee
0.000	0.000	99.639	0.361	0.000	0.000	0.000	0.000	0.000	0.000	0.011	my5720_rel.cz10a_bee
0.000	0.000	99.683	0.317	0.000	0.000	0.000	0.000	0.000	0.000	0.013	my5730_rel.cz10a_bee
0.000	0.000	99.678	0.322	0.000	0.000	0.000	0.000	0.000	0.000	0.012	my5744_rel.cz10a_bee
q1000.1
- q1000.1: range queries with 1000 insert/s per client
- Legend for results is here.
- Each entry lists the percentage of responses that fit in that bucket (slower than max time for previous bucket, faster than min time for next bucket).
Query response time histogram
256us	1ms	4ms	16ms	64ms	256ms	1s	4s	16s	gt	max	tag
75.811	24.188	0.001	nonzero	0.000	0.000	0.000	0.000	0.000	0.000	0.007	my575_rel.cz10a_bee
73.931	26.067	0.001	nonzero	0.000	0.000	0.000	0.000	0.000	0.000	0.013	my576_rel.cz10a_bee
72.673	27.326	0.001	nonzero	0.000	0.000	0.000	0.000	0.000	0.000	0.009	my577_rel.cz10a_bee
70.427	29.571	0.001	nonzero	0.000	0.000	0.000	0.000	0.000	0.000	0.006	my578_rel.cz10a_bee
70.814	29.185	0.001	nonzero	0.000	0.000	0.000	0.000	0.000	0.000	0.006	my579_rel.cz10a_bee
68.743	31.256	0.001	nonzero	0.000	0.000	0.000	0.000	0.000	0.000	0.011	my5710_rel.cz10a_bee
67.591	32.408	0.001	nonzero	0.000	0.000	0.000	0.000	0.000	0.000	0.005	my5720_rel.cz10a_bee
66.339	33.660	0.001	nonzero	0.000	0.000	0.000	0.000	0.000	0.000	0.005	my5730_rel.cz10a_bee
62.840	37.159	0.001	nonzero	0.000	0.000	0.000	0.000	0.000	0.000	0.005	my5744_rel.cz10a_bee
Insert response time histogram
256us	1ms	4ms	16ms	64ms	256ms	1s	4s	16s	gt	max	tag
0.000	0.000	99.519	0.478	0.003	0.000	0.000	0.000	0.000	0.000	0.054	my575_rel.cz10a_bee
0.000	0.000	98.953	1.044	0.003	0.000	0.000	0.000	0.000	0.000	0.041	my576_rel.cz10a_bee
0.000	0.000	99.486	0.511	0.003	0.000	0.000	0.000	0.000	0.000	0.048	my577_rel.cz10a_bee
0.000	0.000	99.244	0.750	0.006	0.000	0.000	0.000	0.000	0.000	0.050	my578_rel.cz10a_bee
0.000	0.000	99.531	0.464	0.006	0.000	0.000	0.000	0.000	0.000	0.049	my579_rel.cz10a_bee
0.000	0.000	99.675	0.319	0.006	0.000	0.000	0.000	0.000	0.000	0.049	my5710_rel.cz10a_bee
0.000	0.000	99.442	0.556	0.003	0.000	0.000	0.000	0.000	0.000	0.052	my5720_rel.cz10a_bee
0.000	0.000	99.511	0.486	0.003	0.000	0.000	0.000	0.000	0.000	0.048	my5730_rel.cz10a_bee
0.000	0.000	99.467	0.531	0.003	0.000	0.000	0.000	0.000	0.000	0.047	my5744_rel.cz10a_bee
Delete response time histogram
256us	1ms	4ms	16ms	64ms	256ms	1s	4s	16s	gt	max	tag
0.000	0.000	99.653	0.344	0.003	0.000	0.000	0.000	0.000	0.000	0.052	my575_rel.cz10a_bee
0.000	0.000	99.272	0.722	0.006	0.000	0.000	0.000	0.000	0.000	0.039	my576_rel.cz10a_bee
0.000	0.000	99.703	0.294	0.003	0.000	0.000	0.000	0.000	0.000	0.050	my577_rel.cz10a_bee
0.000	0.000	99.503	0.497	0.000	0.000	0.000	0.000	0.000	0.000	0.016	my578_rel.cz10a_bee
0.000	0.000	99.636	0.361	0.003	0.000	0.000	0.000	0.000	0.000	0.050	my579_rel.cz10a_bee
0.000	0.000	99.764	0.231	0.006	0.000	0.000	0.000	0.000	0.000	0.020	my5710_rel.cz10a_bee
0.000	0.000	99.603	0.394	0.003	0.000	0.000	0.000	0.000	0.000	0.050	my5720_rel.cz10a_bee
0.000	0.000	99.611	0.383	0.006	0.000	0.000	0.000	0.000	0.000	0.048	my5730_rel.cz10a_bee
0.000	0.000	99.606	0.392	0.003	0.000	0.000	0.000	0.000	0.000	0.050	my5744_rel.cz10a_bee