Introduction
This is a report for the insert benchmark with 160M docs and 8 client(s). It is generated by scripts (bash, awk, sed) and Tufte might not be impressed. An overview of the insert benchmark is here and a short update is here. Below, by DBMS, I mean DBMS+version.config. An example is my8020.c10b40 where my means MySQL, 8020 is version 8.0.20 and c10b40 is the name for the configuration file.
The test server is a c2-standard-30 from GCP with 15 cores, hyperthreads disabled, 120G RAM, XFS + SW RAID 0 on 4 NVMe devices (1.5TB). The benchmark was run with 8 client and there were 1 or 3 connections per client (1 for queries or inserts without rate limits, 1+1 for rate limited inserts+deletes). There are 8 tables, client per table. It loads 20M rows per table without secondary indexes, creates secondary indexes, then inserts 100M rows with a delete per insert to avoid growing the table. It then does 3 read+write tests for 1800s each that do queries as fast as possible with 100, 500 and then 1000 inserts/second/client concurrent with the queries and 1000 deletes/second to avoid growing the table. The database is larger than memory.
The tested DBMS are:
- my5621_rel.cy10a22_gcp_c2s30 - MySQL 5.6.21 with InnoDB, rel build, cy10a22_gcp_c2s30 config
- my5631_rel.cy10a22_gcp_c2s30 - MySQL 5.6.31 with InnoDB, rel build, cy10a22_gcp_c2s30 config
- my5641_rel.cy10a22_gcp_c2s30 - MySQL 5.6.41 with InnoDB, rel build, cy10a22_gcp_c2s30 config
- my5651_rel.cy10a22_gcp_c2s30 - MySQL 5.6.51 with InnoDB, rel build, cy10a22_gcp_c2s30 config
Contents
- Summary
- l.i0: load without secondary indexes
- l.x: create secondary indexes
- l.i1: continue load after secondary indexes created
- q100.1: range queries with 100 insert/s per client
- q500.1: range queries with 500 insert/s per client
- q1000.1: range queries with 1000 insert/s per client
Summary
The numbers are inserts/s for l.i0 and l.i1, indexed docs (or rows) /s for l.x and queries/s for q100, q500, q1000. The values are the average rate over the entire test for inserts (IPS) and queries (QPS). The range of values for IPS and QPS is split into 3 parts: bottom 25%, middle 50%, top 25%. Values in the bottom 25% have a red background, values in the top 25% have a green background and values in the middle have no color. A gray background is used for values that can be ignored because the DBMS did not sustain the target insert rate. Red backgrounds are not used when the minimum value is within 80% of the max value.
| dbms | l.i0 | l.x | l.i1 | q100.1 | q500.1 | q1000.1 |
|---|---|---|---|---|---|---|
| my5621_rel.cy10a22_gcp_c2s30 | 428954 | 622957 | 66274 | 76348 | 73983 | 73199 |
| my5631_rel.cy10a22_gcp_c2s30 | 430108 | 630315 | 67148 | 76389 | 74530 | 72235 |
| my5641_rel.cy10a22_gcp_c2s30 | 425532 | 611069 | 66296 | 75727 | 74560 | 72282 |
| my5651_rel.cy10a22_gcp_c2s30 | 428954 | 606439 | 67380 | 75336 | 74238 | 72310 |
This table has relative throughput, throughput for the DBMS relative to the DBMS in the first line, using the absolute throughput from the previous table. Values less than 0.95 have a yellow background. Values greater than 1.05 have a blue background.
| dbms | l.i0 | l.x | l.i1 | q100.1 | q500.1 | q1000.1 |
|---|---|---|---|---|---|---|
| my5621_rel.cy10a22_gcp_c2s30 | 1.00 | 1.00 | 1.00 | 1.00 | 1.00 | 1.00 |
| my5631_rel.cy10a22_gcp_c2s30 | 1.00 | 1.01 | 1.01 | 1.00 | 1.01 | 0.99 |
| my5641_rel.cy10a22_gcp_c2s30 | 0.99 | 0.98 | 1.00 | 0.99 | 1.01 | 0.99 |
| my5651_rel.cy10a22_gcp_c2s30 | 1.00 | 0.97 | 1.02 | 0.99 | 1.00 | 0.99 |
This lists the average rate of inserts/s for the tests that do inserts concurrent with queries. For such tests the query rate is listed in the table above. The read+write tests are setup so that the insert rate should match the target rate every second. Cells that are not at least 95% of the target have a red background to indicate a failure to satisfy the target.
| dbms | q100.1 | q500.1 | q1000.1 |
|---|---|---|---|
| my5621_rel.cy10a22_gcp_c2s30 | 796 | 3978 | 7960 |
| my5631_rel.cy10a22_gcp_c2s30 | 796 | 3978 | 7960 |
| my5641_rel.cy10a22_gcp_c2s30 | 796 | 3978 | 7960 |
| my5651_rel.cy10a22_gcp_c2s30 | 796 | 3980 | 7960 |
| target | 800 | 4000 | 8000 |
l.i0
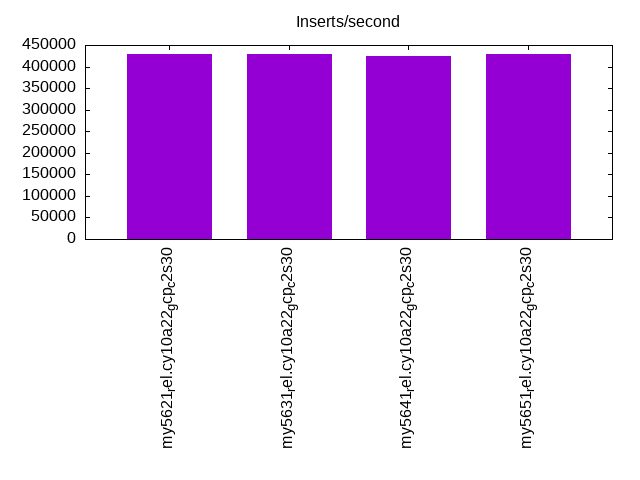
l.i0: load without secondary indexes. Graphs for performance per 1-second interval are here.
Average throughput:
Insert response time histogram: each cell has the percentage of responses that take <= the time in the header and max is the max response time in seconds. For the max column values in the top 25% of the range have a red background and in the bottom 25% of the range have a green background. The red background is not used when the min value is within 80% of the max value.
| dbms | 256us | 1ms | 4ms | 16ms | 64ms | 256ms | 1s | 4s | 16s | gt | max |
|---|---|---|---|---|---|---|---|---|---|---|---|
| my5621_rel.cy10a22_gcp_c2s30 | 2.315 | 97.432 | 0.074 | 0.165 | 0.014 | 0.198 | |||||
| my5631_rel.cy10a22_gcp_c2s30 | 2.362 | 97.399 | 0.062 | 0.163 | 0.014 | 0.205 | |||||
| my5641_rel.cy10a22_gcp_c2s30 | 2.315 | 97.440 | 0.068 | 0.162 | 0.014 | 0.219 | |||||
| my5651_rel.cy10a22_gcp_c2s30 | 2.439 | 97.324 | 0.061 | 0.161 | 0.014 | 0.201 |
Performance metrics for the DBMS listed above. Some are normalized by throughput, others are not. Legend for results is here.
ips	qps	rps	rmbps	wps	wmbps	rpq	rkbpq	wpi	wkbpi	csps	cpups	cspq	cpupq	dbgb1	dbgb2	rss	maxop	p50	p99	tag
428954	0	3372	13.2	539.3	76.0	0.008	0.031	0.001	0.181	88045	43.1	0.205	15	10.6	139.1	15.6	0.198	55241	44053	160m.my5621_rel.cy10a22_gcp_c2s30
430108	0	3398	13.3	574.1	77.2	0.008	0.032	0.001	0.184	87997	43.4	0.205	15	10.6	139.1	15.7	0.205	55540	44752	160m.my5631_rel.cy10a22_gcp_c2s30
425532	0	3352	13.1	567.9	76.6	0.008	0.032	0.001	0.184	87125	43.3	0.205	15	10.6	139.1	15.5	0.219	54559	44465	160m.my5641_rel.cy10a22_gcp_c2s30
428954	0	3378	13.2	561.5	76.9	0.008	0.031	0.001	0.184	87525	44.2	0.204	15	10.6	139.1	15.6	0.201	55156	44752	160m.my5651_rel.cy10a22_gcp_c2s30
l.x
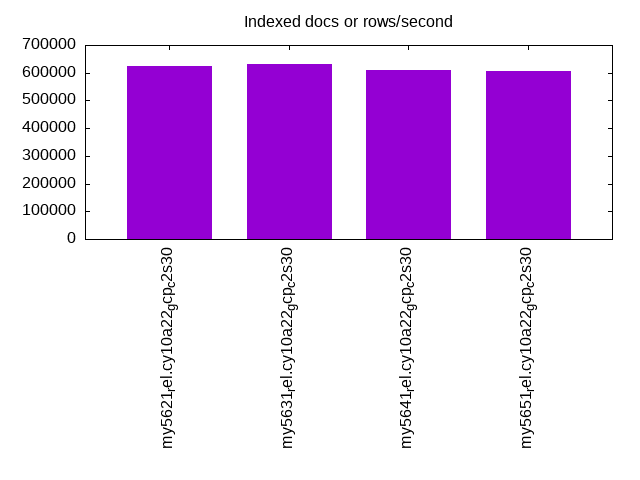
l.x: create secondary indexes.
Average throughput:
Performance metrics for the DBMS listed above. Some are normalized by throughput, others are not. Legend for results is here.
ips	qps	rps	rmbps	wps	wmbps	rpq	rkbpq	wpi	wkbpi	csps	cpups	cspq	cpupq	dbgb1	dbgb2	rss	maxop	p50	p99	tag
622957	0	289	1.1	7905.0	646.7	0.000	0.002	0.013	1.063	18331	38.3	0.029	9	21.7	150.2	26.5	0.001	NA	NA	160m.my5621_rel.cy10a22_gcp_c2s30
630315	0	321	1.3	8194.9	661.7	0.001	0.002	0.013	1.075	19853	38.7	0.031	9	21.7	150.2	26.6	0.001	NA	NA	160m.my5631_rel.cy10a22_gcp_c2s30
611069	0	312	1.2	7959.2	639.6	0.001	0.002	0.013	1.072	19410	38.5	0.032	9	21.7	150.2	26.2	0.001	NA	NA	160m.my5641_rel.cy10a22_gcp_c2s30
606439	0	355	1.4	8268.2	639.4	0.001	0.002	0.014	1.080	21578	39.0	0.036	10	21.7	150.2	26.0	0.002	NA	NA	160m.my5651_rel.cy10a22_gcp_c2s30
l.i1
l.i1: continue load after secondary indexes created. Graphs for performance per 1-second interval are here.
Average throughput:

Insert response time histogram: each cell has the percentage of responses that take <= the time in the header and max is the max response time in seconds. For the max column values in the top 25% of the range have a red background and in the bottom 25% of the range have a green background. The red background is not used when the min value is within 80% of the max value.
| dbms | 256us | 1ms | 4ms | 16ms | 64ms | 256ms | 1s | 4s | 16s | gt | max |
|---|---|---|---|---|---|---|---|---|---|---|---|
| my5621_rel.cy10a22_gcp_c2s30 | nonzero | 21.590 | 77.546 | 0.667 | 0.045 | 0.152 | 0.362 | ||||
| my5631_rel.cy10a22_gcp_c2s30 | 22.200 | 76.963 | 0.658 | 0.045 | 0.135 | 0.338 | |||||
| my5641_rel.cy10a22_gcp_c2s30 | 21.307 | 77.811 | 0.699 | 0.045 | 0.139 | 0.387 | |||||
| my5651_rel.cy10a22_gcp_c2s30 | nonzero | 23.065 | 76.078 | 0.675 | 0.044 | 0.138 | 0.382 |
Delete response time histogram: each cell has the percentage of responses that take <= the time in the header and max is the max response time in seconds. For the max column values in the top 25% of the range have a red background and in the bottom 25% of the range have a green background. The red background is not used when the min value is within 80% of the max value.
| dbms | 256us | 1ms | 4ms | 16ms | 64ms | 256ms | 1s | 4s | 16s | gt | max |
|---|---|---|---|---|---|---|---|---|---|---|---|
| my5621_rel.cy10a22_gcp_c2s30 | 0.001 | 46.233 | 53.049 | 0.525 | 0.040 | 0.151 | 0.361 | ||||
| my5631_rel.cy10a22_gcp_c2s30 | 0.001 | 47.640 | 51.673 | 0.512 | 0.039 | 0.136 | 0.362 | ||||
| my5641_rel.cy10a22_gcp_c2s30 | 0.001 | 46.091 | 53.184 | 0.546 | 0.039 | 0.140 | 0.386 | ||||
| my5651_rel.cy10a22_gcp_c2s30 | 0.001 | 48.421 | 50.868 | 0.534 | 0.039 | 0.138 | 0.373 |
Performance metrics for the DBMS listed above. Some are normalized by throughput, others are not. Legend for results is here.
ips	qps	rps	rmbps	wps	wmbps	rpq	rkbpq	wpi	wkbpi	csps	cpups	cspq	cpupq	dbgb1	dbgb2	rss	maxop	p50	p99	tag
66274	0	2036	8.0	3494.8	136.6	0.031	0.123	0.053	2.111	164426	62.7	2.481	142	36.9	165.7	42.4	0.362	8990	150	160m.my5621_rel.cy10a22_gcp_c2s30
67148	0	2064	8.1	3545.5	138.6	0.031	0.123	0.053	2.113	165971	63.2	2.472	141	36.9	165.7	42.4	0.338	9040	150	160m.my5631_rel.cy10a22_gcp_c2s30
66296	0	2037	8.0	3527.0	137.7	0.031	0.123	0.053	2.127	164105	63.1	2.475	143	36.9	165.7	42.4	0.387	8990	150	160m.my5641_rel.cy10a22_gcp_c2s30
67380	0	2070	8.1	3560.7	139.1	0.031	0.123	0.053	2.114	165480	63.7	2.456	142	36.9	165.7	42.4	0.382	9093	150	160m.my5651_rel.cy10a22_gcp_c2s30
q100.1
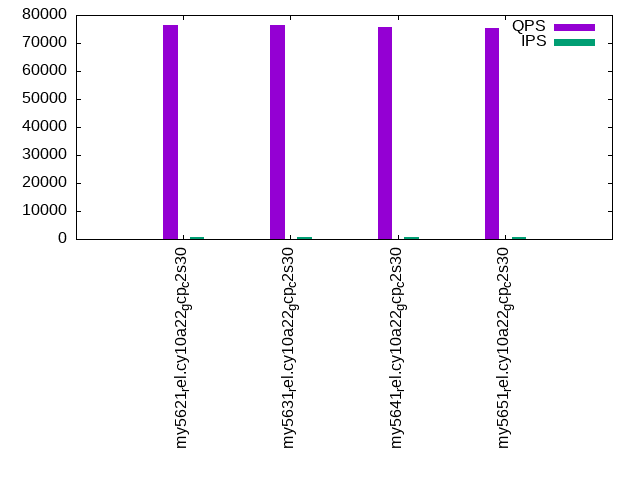
q100.1: range queries with 100 insert/s per client. Graphs for performance per 1-second interval are here.
Average throughput:
Query response time histogram: each cell has the percentage of responses that take <= the time in the header and max is the max response time in seconds. For max values in the top 25% of the range have a red background and in the bottom 25% of the range have a green background. The red background is not used when the min value is within 80% of the max value.
| dbms | 256us | 1ms | 4ms | 16ms | 64ms | 256ms | 1s | 4s | 16s | gt | max |
|---|---|---|---|---|---|---|---|---|---|---|---|
| my5621_rel.cy10a22_gcp_c2s30 | 99.930 | 0.066 | 0.003 | 0.001 | nonzero | 0.026 | |||||
| my5631_rel.cy10a22_gcp_c2s30 | 99.934 | 0.063 | 0.003 | 0.001 | nonzero | 0.028 | |||||
| my5641_rel.cy10a22_gcp_c2s30 | 99.928 | 0.068 | 0.003 | 0.001 | 0.009 | ||||||
| my5651_rel.cy10a22_gcp_c2s30 | 99.928 | 0.069 | 0.003 | 0.001 | 0.012 |
Insert response time histogram: each cell has the percentage of responses that take <= the time in the header and max is the max response time in seconds. For max values in the top 25% of the range have a red background and in the bottom 25% of the range have a green background. The red background is not used when the min value is within 80% of the max value.
| dbms | 256us | 1ms | 4ms | 16ms | 64ms | 256ms | 1s | 4s | 16s | gt | max |
|---|---|---|---|---|---|---|---|---|---|---|---|
| my5621_rel.cy10a22_gcp_c2s30 | 93.708 | 6.052 | 0.240 | 0.040 | |||||||
| my5631_rel.cy10a22_gcp_c2s30 | 95.198 | 4.802 | 0.012 | ||||||||
| my5641_rel.cy10a22_gcp_c2s30 | 90.681 | 9.319 | 0.015 | ||||||||
| my5651_rel.cy10a22_gcp_c2s30 | 95.458 | 4.542 | 0.015 |
Delete response time histogram: each cell has the percentage of responses that take <= the time in the header and max is the max response time in seconds. For max values in the top 25% of the range have a red background and in the bottom 25% of the range have a green background. The red background is not used when the min value is within 80% of the max value.
| dbms | 256us | 1ms | 4ms | 16ms | 64ms | 256ms | 1s | 4s | 16s | gt | max |
|---|---|---|---|---|---|---|---|---|---|---|---|
| my5621_rel.cy10a22_gcp_c2s30 | 0.035 | 97.872 | 1.885 | 0.208 | 0.041 | ||||||
| my5631_rel.cy10a22_gcp_c2s30 | 0.045 | 99.208 | 0.747 | 0.015 | |||||||
| my5641_rel.cy10a22_gcp_c2s30 | 0.031 | 96.493 | 3.476 | 0.011 | |||||||
| my5651_rel.cy10a22_gcp_c2s30 | 0.087 | 98.615 | 1.299 | 0.014 |
Performance metrics for the DBMS listed above. Some are normalized by throughput, others are not. Legend for results is here.
ips	qps	rps	rmbps	wps	wmbps	rpq	rkbpq	wpi	wkbpi	csps	cpups	cspq	cpupq	dbgb1	dbgb2	rss	maxop	p50	p99	tag
796	76348	28	0.1	1681.6	51.5	0.000	0.001	2.114	66.343	293268	53.8	3.841	106	36.9	165.7	42.4	0.026	9685	8119	160m.my5621_rel.cy10a22_gcp_c2s30
796	76389	28	0.1	576.9	18.2	0.000	0.001	0.725	23.349	291400	53.6	3.815	105	36.9	165.7	42.4	0.028	9637	8087	160m.my5631_rel.cy10a22_gcp_c2s30
796	75727	28	0.1	1398.4	43.0	0.000	0.001	1.758	55.307	290581	53.7	3.837	106	36.9	165.7	42.4	0.009	9653	8391	160m.my5641_rel.cy10a22_gcp_c2s30
796	75336	28	0.1	1515.7	46.6	0.000	0.001	1.905	59.940	289297	53.7	3.840	107	36.9	165.7	42.4	0.012	9542	8902	160m.my5651_rel.cy10a22_gcp_c2s30
q500.1
q500.1: range queries with 500 insert/s per client. Graphs for performance per 1-second interval are here.
Average throughput:
Query response time histogram: each cell has the percentage of responses that take <= the time in the header and max is the max response time in seconds. For max values in the top 25% of the range have a red background and in the bottom 25% of the range have a green background. The red background is not used when the min value is within 80% of the max value.
| dbms | 256us | 1ms | 4ms | 16ms | 64ms | 256ms | 1s | 4s | 16s | gt | max |
|---|---|---|---|---|---|---|---|---|---|---|---|
| my5621_rel.cy10a22_gcp_c2s30 | 99.663 | 0.303 | 0.033 | 0.001 | 0.014 | ||||||
| my5631_rel.cy10a22_gcp_c2s30 | 99.672 | 0.295 | 0.032 | 0.001 | 0.012 | ||||||
| my5641_rel.cy10a22_gcp_c2s30 | 99.657 | 0.310 | 0.033 | 0.001 | 0.012 | ||||||
| my5651_rel.cy10a22_gcp_c2s30 | 99.659 | 0.307 | 0.033 | 0.001 | 0.011 |
Insert response time histogram: each cell has the percentage of responses that take <= the time in the header and max is the max response time in seconds. For max values in the top 25% of the range have a red background and in the bottom 25% of the range have a green background. The red background is not used when the min value is within 80% of the max value.
| dbms | 256us | 1ms | 4ms | 16ms | 64ms | 256ms | 1s | 4s | 16s | gt | max |
|---|---|---|---|---|---|---|---|---|---|---|---|
| my5621_rel.cy10a22_gcp_c2s30 | 40.730 | 58.012 | 1.258 | 0.034 | |||||||
| my5631_rel.cy10a22_gcp_c2s30 | 0.001 | 38.822 | 59.960 | 1.217 | 0.032 | ||||||
| my5641_rel.cy10a22_gcp_c2s30 | 32.423 | 66.203 | 1.374 | 0.033 | |||||||
| my5651_rel.cy10a22_gcp_c2s30 | 34.712 | 63.934 | 1.353 | 0.033 |
Delete response time histogram: each cell has the percentage of responses that take <= the time in the header and max is the max response time in seconds. For max values in the top 25% of the range have a red background and in the bottom 25% of the range have a green background. The red background is not used when the min value is within 80% of the max value.
| dbms | 256us | 1ms | 4ms | 16ms | 64ms | 256ms | 1s | 4s | 16s | gt | max |
|---|---|---|---|---|---|---|---|---|---|---|---|
| my5621_rel.cy10a22_gcp_c2s30 | 0.004 | 51.053 | 48.202 | 0.740 | 0.032 | ||||||
| my5631_rel.cy10a22_gcp_c2s30 | 0.010 | 48.583 | 50.735 | 0.672 | 0.030 | ||||||
| my5641_rel.cy10a22_gcp_c2s30 | 0.013 | 40.346 | 58.858 | 0.784 | 0.038 | ||||||
| my5651_rel.cy10a22_gcp_c2s30 | 0.008 | 42.811 | 56.428 | 0.753 | 0.029 |
Performance metrics for the DBMS listed above. Some are normalized by throughput, others are not. Legend for results is here.
ips	qps	rps	rmbps	wps	wmbps	rpq	rkbpq	wpi	wkbpi	csps	cpups	cspq	cpupq	dbgb1	dbgb2	rss	maxop	p50	p99	tag
3978	73983	114	0.4	3359.9	103.2	0.002	0.006	0.845	26.575	289001	55.5	3.906	113	36.9	165.7	42.4	0.014	9370	8842	160m.my5621_rel.cy10a22_gcp_c2s30
3978	74530	114	0.4	1210.3	38.3	0.002	0.006	0.304	9.847	288113	55.2	3.866	111	36.9	165.7	42.4	0.012	9398	8904	160m.my5631_rel.cy10a22_gcp_c2s30
3978	74560	114	0.4	17.7	2.4	0.002	0.006	0.004	0.629	286263	55.1	3.839	111	36.9	165.7	42.4	0.012	9398	9241	160m.my5641_rel.cy10a22_gcp_c2s30
3980	74238	115	0.4	15.9	2.3	0.002	0.006	0.004	0.605	284772	55.1	3.836	111	36.9	165.7	42.4	0.011	9350	9206	160m.my5651_rel.cy10a22_gcp_c2s30
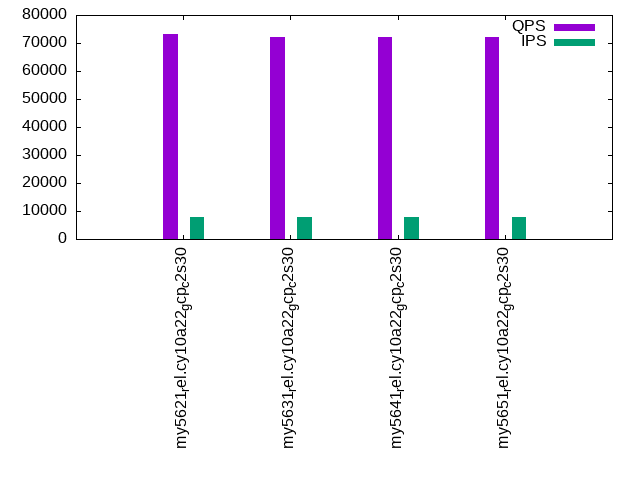
q1000.1
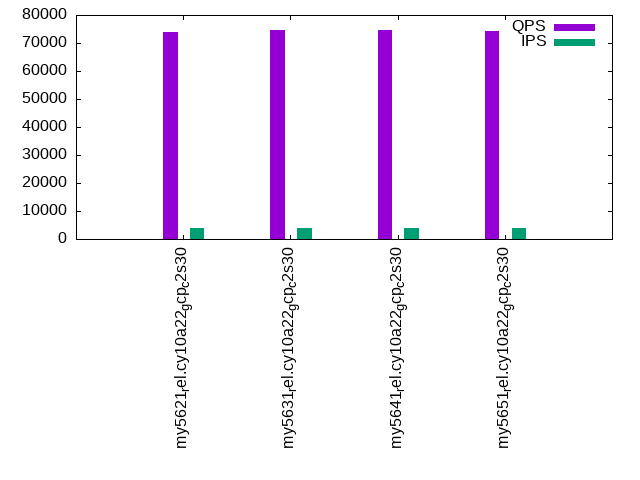
q1000.1: range queries with 1000 insert/s per client. Graphs for performance per 1-second interval are here.
Average throughput:
Query response time histogram: each cell has the percentage of responses that take <= the time in the header and max is the max response time in seconds. For max values in the top 25% of the range have a red background and in the bottom 25% of the range have a green background. The red background is not used when the min value is within 80% of the max value.
| dbms | 256us | 1ms | 4ms | 16ms | 64ms | 256ms | 1s | 4s | 16s | gt | max |
|---|---|---|---|---|---|---|---|---|---|---|---|
| my5621_rel.cy10a22_gcp_c2s30 | 99.397 | 0.541 | 0.061 | 0.001 | 0.012 | ||||||
| my5631_rel.cy10a22_gcp_c2s30 | 99.379 | 0.557 | 0.063 | 0.001 | nonzero | 0.024 | |||||
| my5641_rel.cy10a22_gcp_c2s30 | 99.359 | 0.571 | 0.068 | 0.001 | nonzero | 0.025 | |||||
| my5651_rel.cy10a22_gcp_c2s30 | 99.384 | 0.550 | 0.065 | 0.001 | nonzero | 0.040 |
Insert response time histogram: each cell has the percentage of responses that take <= the time in the header and max is the max response time in seconds. For max values in the top 25% of the range have a red background and in the bottom 25% of the range have a green background. The red background is not used when the min value is within 80% of the max value.
| dbms | 256us | 1ms | 4ms | 16ms | 64ms | 256ms | 1s | 4s | 16s | gt | max |
|---|---|---|---|---|---|---|---|---|---|---|---|
| my5621_rel.cy10a22_gcp_c2s30 | nonzero | 38.816 | 59.737 | 1.447 | 0.036 | ||||||
| my5631_rel.cy10a22_gcp_c2s30 | nonzero | 38.112 | 60.321 | 1.567 | 0.037 | ||||||
| my5641_rel.cy10a22_gcp_c2s30 | 37.244 | 61.060 | 1.696 | 0.037 | |||||||
| my5651_rel.cy10a22_gcp_c2s30 | 38.673 | 59.784 | 1.543 | 0.038 |
Delete response time histogram: each cell has the percentage of responses that take <= the time in the header and max is the max response time in seconds. For max values in the top 25% of the range have a red background and in the bottom 25% of the range have a green background. The red background is not used when the min value is within 80% of the max value.
| dbms | 256us | 1ms | 4ms | 16ms | 64ms | 256ms | 1s | 4s | 16s | gt | max |
|---|---|---|---|---|---|---|---|---|---|---|---|
| my5621_rel.cy10a22_gcp_c2s30 | 0.010 | 47.676 | 51.426 | 0.887 | 0.034 | ||||||
| my5631_rel.cy10a22_gcp_c2s30 | 0.011 | 47.115 | 51.972 | 0.902 | 0.035 | ||||||
| my5641_rel.cy10a22_gcp_c2s30 | 0.011 | 46.461 | 52.527 | 1.000 | 0.040 | ||||||
| my5651_rel.cy10a22_gcp_c2s30 | 0.018 | 47.497 | 51.569 | 0.916 | 0.035 |
Performance metrics for the DBMS listed above. Some are normalized by throughput, others are not. Legend for results is here.
ips	qps	rps	rmbps	wps	wmbps	rpq	rkbpq	wpi	wkbpi	csps	cpups	cspq	cpupq	dbgb1	dbgb2	rss	maxop	p50	p99	tag
7960	73199	230	0.9	676.9	24.0	0.003	0.013	0.085	3.084	279888	57.6	3.824	118	36.9	165.7	42.4	0.012	9193	8998	160m.my5621_rel.cy10a22_gcp_c2s30
7960	72235	229	0.9	824.0	28.5	0.003	0.013	0.104	3.664	276641	57.7	3.830	120	36.9	165.7	42.4	0.024	9114	8694	160m.my5631_rel.cy10a22_gcp_c2s30
7960	72282	227	0.9	779.6	27.2	0.003	0.013	0.098	3.500	276424	57.7	3.824	120	36.9	165.7	42.4	0.025	9126	8889	160m.my5641_rel.cy10a22_gcp_c2s30
7960	72310	228	0.9	781.9	27.3	0.003	0.013	0.098	3.513	276111	57.7	3.818	120	36.9	165.7	42.4	0.040	9097	8870	160m.my5651_rel.cy10a22_gcp_c2s30
l.i0
l.i0: load without secondary indexes
Performance metrics for all DBMS, not just the ones listed above. Some are normalized by throughput, others are not. Legend for results is here.
ips	qps	rps	rmbps	wps	wmbps	rpq	rkbpq	wpi	wkbpi	csps	cpups	cspq	cpupq	dbgb1	dbgb2	rss	maxop	p50	p99	tag
428954	0	3372	13.2	539.3	76.0	0.008	0.031	0.001	0.181	88045	43.1	0.205	15	10.6	139.1	15.6	0.198	55241	44053	160m.my5621_rel.cy10a22_gcp_c2s30
430108	0	3398	13.3	574.1	77.2	0.008	0.032	0.001	0.184	87997	43.4	0.205	15	10.6	139.1	15.7	0.205	55540	44752	160m.my5631_rel.cy10a22_gcp_c2s30
425532	0	3352	13.1	567.9	76.6	0.008	0.032	0.001	0.184	87125	43.3	0.205	15	10.6	139.1	15.5	0.219	54559	44465	160m.my5641_rel.cy10a22_gcp_c2s30
428954	0	3378	13.2	561.5	76.9	0.008	0.031	0.001	0.184	87525	44.2	0.204	15	10.6	139.1	15.6	0.201	55156	44752	160m.my5651_rel.cy10a22_gcp_c2s30
l.x
l.x: create secondary indexes
Performance metrics for all DBMS, not just the ones listed above. Some are normalized by throughput, others are not. Legend for results is here.
ips	qps	rps	rmbps	wps	wmbps	rpq	rkbpq	wpi	wkbpi	csps	cpups	cspq	cpupq	dbgb1	dbgb2	rss	maxop	p50	p99	tag
622957	0	289	1.1	7905.0	646.7	0.000	0.002	0.013	1.063	18331	38.3	0.029	9	21.7	150.2	26.5	0.001	NA	NA	160m.my5621_rel.cy10a22_gcp_c2s30
630315	0	321	1.3	8194.9	661.7	0.001	0.002	0.013	1.075	19853	38.7	0.031	9	21.7	150.2	26.6	0.001	NA	NA	160m.my5631_rel.cy10a22_gcp_c2s30
611069	0	312	1.2	7959.2	639.6	0.001	0.002	0.013	1.072	19410	38.5	0.032	9	21.7	150.2	26.2	0.001	NA	NA	160m.my5641_rel.cy10a22_gcp_c2s30
606439	0	355	1.4	8268.2	639.4	0.001	0.002	0.014	1.080	21578	39.0	0.036	10	21.7	150.2	26.0	0.002	NA	NA	160m.my5651_rel.cy10a22_gcp_c2s30
l.i1
l.i1: continue load after secondary indexes created
Performance metrics for all DBMS, not just the ones listed above. Some are normalized by throughput, others are not. Legend for results is here.
ips	qps	rps	rmbps	wps	wmbps	rpq	rkbpq	wpi	wkbpi	csps	cpups	cspq	cpupq	dbgb1	dbgb2	rss	maxop	p50	p99	tag
66274	0	2036	8.0	3494.8	136.6	0.031	0.123	0.053	2.111	164426	62.7	2.481	142	36.9	165.7	42.4	0.362	8990	150	160m.my5621_rel.cy10a22_gcp_c2s30
67148	0	2064	8.1	3545.5	138.6	0.031	0.123	0.053	2.113	165971	63.2	2.472	141	36.9	165.7	42.4	0.338	9040	150	160m.my5631_rel.cy10a22_gcp_c2s30
66296	0	2037	8.0	3527.0	137.7	0.031	0.123	0.053	2.127	164105	63.1	2.475	143	36.9	165.7	42.4	0.387	8990	150	160m.my5641_rel.cy10a22_gcp_c2s30
67380	0	2070	8.1	3560.7	139.1	0.031	0.123	0.053	2.114	165480	63.7	2.456	142	36.9	165.7	42.4	0.382	9093	150	160m.my5651_rel.cy10a22_gcp_c2s30
q100.1
q100.1: range queries with 100 insert/s per client
Performance metrics for all DBMS, not just the ones listed above. Some are normalized by throughput, others are not. Legend for results is here.
ips	qps	rps	rmbps	wps	wmbps	rpq	rkbpq	wpi	wkbpi	csps	cpups	cspq	cpupq	dbgb1	dbgb2	rss	maxop	p50	p99	tag
796	76348	28	0.1	1681.6	51.5	0.000	0.001	2.114	66.343	293268	53.8	3.841	106	36.9	165.7	42.4	0.026	9685	8119	160m.my5621_rel.cy10a22_gcp_c2s30
796	76389	28	0.1	576.9	18.2	0.000	0.001	0.725	23.349	291400	53.6	3.815	105	36.9	165.7	42.4	0.028	9637	8087	160m.my5631_rel.cy10a22_gcp_c2s30
796	75727	28	0.1	1398.4	43.0	0.000	0.001	1.758	55.307	290581	53.7	3.837	106	36.9	165.7	42.4	0.009	9653	8391	160m.my5641_rel.cy10a22_gcp_c2s30
796	75336	28	0.1	1515.7	46.6	0.000	0.001	1.905	59.940	289297	53.7	3.840	107	36.9	165.7	42.4	0.012	9542	8902	160m.my5651_rel.cy10a22_gcp_c2s30
q500.1
q500.1: range queries with 500 insert/s per client
Performance metrics for all DBMS, not just the ones listed above. Some are normalized by throughput, others are not. Legend for results is here.
ips	qps	rps	rmbps	wps	wmbps	rpq	rkbpq	wpi	wkbpi	csps	cpups	cspq	cpupq	dbgb1	dbgb2	rss	maxop	p50	p99	tag
3978	73983	114	0.4	3359.9	103.2	0.002	0.006	0.845	26.575	289001	55.5	3.906	113	36.9	165.7	42.4	0.014	9370	8842	160m.my5621_rel.cy10a22_gcp_c2s30
3978	74530	114	0.4	1210.3	38.3	0.002	0.006	0.304	9.847	288113	55.2	3.866	111	36.9	165.7	42.4	0.012	9398	8904	160m.my5631_rel.cy10a22_gcp_c2s30
3978	74560	114	0.4	17.7	2.4	0.002	0.006	0.004	0.629	286263	55.1	3.839	111	36.9	165.7	42.4	0.012	9398	9241	160m.my5641_rel.cy10a22_gcp_c2s30
3980	74238	115	0.4	15.9	2.3	0.002	0.006	0.004	0.605	284772	55.1	3.836	111	36.9	165.7	42.4	0.011	9350	9206	160m.my5651_rel.cy10a22_gcp_c2s30
q1000.1
q1000.1: range queries with 1000 insert/s per client
Performance metrics for all DBMS, not just the ones listed above. Some are normalized by throughput, others are not. Legend for results is here.
ips	qps	rps	rmbps	wps	wmbps	rpq	rkbpq	wpi	wkbpi	csps	cpups	cspq	cpupq	dbgb1	dbgb2	rss	maxop	p50	p99	tag
7960	73199	230	0.9	676.9	24.0	0.003	0.013	0.085	3.084	279888	57.6	3.824	118	36.9	165.7	42.4	0.012	9193	8998	160m.my5621_rel.cy10a22_gcp_c2s30
7960	72235	229	0.9	824.0	28.5	0.003	0.013	0.104	3.664	276641	57.7	3.830	120	36.9	165.7	42.4	0.024	9114	8694	160m.my5631_rel.cy10a22_gcp_c2s30
7960	72282	227	0.9	779.6	27.2	0.003	0.013	0.098	3.500	276424	57.7	3.824	120	36.9	165.7	42.4	0.025	9126	8889	160m.my5641_rel.cy10a22_gcp_c2s30
7960	72310	228	0.9	781.9	27.3	0.003	0.013	0.098	3.513	276111	57.7	3.818	120	36.9	165.7	42.4	0.040	9097	8870	160m.my5651_rel.cy10a22_gcp_c2s30
l.i0
- l.i0: load without secondary indexes
- Legend for results is here.
- Each entry lists the percentage of responses that fit in that bucket (slower than max time for previous bucket, faster than min time for next bucket).
Insert response time histogram
256us	1ms	4ms	16ms	64ms	256ms	1s	4s	16s	gt	max	tag
0.000	2.315	97.432	0.074	0.165	0.014	0.000	0.000	0.000	0.000	0.198	my5621_rel.cy10a22_gcp_c2s30
0.000	2.362	97.399	0.062	0.163	0.014	0.000	0.000	0.000	0.000	0.205	my5631_rel.cy10a22_gcp_c2s30
0.000	2.315	97.440	0.068	0.162	0.014	0.000	0.000	0.000	0.000	0.219	my5641_rel.cy10a22_gcp_c2s30
0.000	2.439	97.324	0.061	0.161	0.014	0.000	0.000	0.000	0.000	0.201	my5651_rel.cy10a22_gcp_c2s30
l.x
- l.x: create secondary indexes
- Legend for results is here.
- Each entry lists the percentage of responses that fit in that bucket (slower than max time for previous bucket, faster than min time for next bucket).
TODO - determine whether there is data for create index response time
l.i1
- l.i1: continue load after secondary indexes created
- Legend for results is here.
- Each entry lists the percentage of responses that fit in that bucket (slower than max time for previous bucket, faster than min time for next bucket).
Insert response time histogram
256us	1ms	4ms	16ms	64ms	256ms	1s	4s	16s	gt	max	tag
0.000	nonzero	21.590	77.546	0.667	0.045	0.152	0.000	0.000	0.000	0.362	my5621_rel.cy10a22_gcp_c2s30
0.000	0.000	22.200	76.963	0.658	0.045	0.135	0.000	0.000	0.000	0.338	my5631_rel.cy10a22_gcp_c2s30
0.000	0.000	21.307	77.811	0.699	0.045	0.139	0.000	0.000	0.000	0.387	my5641_rel.cy10a22_gcp_c2s30
0.000	nonzero	23.065	76.078	0.675	0.044	0.138	0.000	0.000	0.000	0.382	my5651_rel.cy10a22_gcp_c2s30
Delete response time histogram
256us	1ms	4ms	16ms	64ms	256ms	1s	4s	16s	gt	max	tag
0.000	0.001	46.233	53.049	0.525	0.040	0.151	0.000	0.000	0.000	0.361	my5621_rel.cy10a22_gcp_c2s30
0.000	0.001	47.640	51.673	0.512	0.039	0.136	0.000	0.000	0.000	0.362	my5631_rel.cy10a22_gcp_c2s30
0.000	0.001	46.091	53.184	0.546	0.039	0.140	0.000	0.000	0.000	0.386	my5641_rel.cy10a22_gcp_c2s30
0.000	0.001	48.421	50.868	0.534	0.039	0.138	0.000	0.000	0.000	0.373	my5651_rel.cy10a22_gcp_c2s30
q100.1
- q100.1: range queries with 100 insert/s per client
- Legend for results is here.
- Each entry lists the percentage of responses that fit in that bucket (slower than max time for previous bucket, faster than min time for next bucket).
Query response time histogram
256us	1ms	4ms	16ms	64ms	256ms	1s	4s	16s	gt	max	tag
99.930	0.066	0.003	0.001	nonzero	0.000	0.000	0.000	0.000	0.000	0.026	my5621_rel.cy10a22_gcp_c2s30
99.934	0.063	0.003	0.001	nonzero	0.000	0.000	0.000	0.000	0.000	0.028	my5631_rel.cy10a22_gcp_c2s30
99.928	0.068	0.003	0.001	0.000	0.000	0.000	0.000	0.000	0.000	0.009	my5641_rel.cy10a22_gcp_c2s30
99.928	0.069	0.003	0.001	0.000	0.000	0.000	0.000	0.000	0.000	0.012	my5651_rel.cy10a22_gcp_c2s30
Insert response time histogram
256us	1ms	4ms	16ms	64ms	256ms	1s	4s	16s	gt	max	tag
0.000	0.000	93.708	6.052	0.240	0.000	0.000	0.000	0.000	0.000	0.040	my5621_rel.cy10a22_gcp_c2s30
0.000	0.000	95.198	4.802	0.000	0.000	0.000	0.000	0.000	0.000	0.012	my5631_rel.cy10a22_gcp_c2s30
0.000	0.000	90.681	9.319	0.000	0.000	0.000	0.000	0.000	0.000	0.015	my5641_rel.cy10a22_gcp_c2s30
0.000	0.000	95.458	4.542	0.000	0.000	0.000	0.000	0.000	0.000	0.015	my5651_rel.cy10a22_gcp_c2s30
Delete response time histogram
256us	1ms	4ms	16ms	64ms	256ms	1s	4s	16s	gt	max	tag
0.000	0.035	97.872	1.885	0.208	0.000	0.000	0.000	0.000	0.000	0.041	my5621_rel.cy10a22_gcp_c2s30
0.000	0.045	99.208	0.747	0.000	0.000	0.000	0.000	0.000	0.000	0.015	my5631_rel.cy10a22_gcp_c2s30
0.000	0.031	96.493	3.476	0.000	0.000	0.000	0.000	0.000	0.000	0.011	my5641_rel.cy10a22_gcp_c2s30
0.000	0.087	98.615	1.299	0.000	0.000	0.000	0.000	0.000	0.000	0.014	my5651_rel.cy10a22_gcp_c2s30
q500.1
- q500.1: range queries with 500 insert/s per client
- Legend for results is here.
- Each entry lists the percentage of responses that fit in that bucket (slower than max time for previous bucket, faster than min time for next bucket).
Query response time histogram
256us	1ms	4ms	16ms	64ms	256ms	1s	4s	16s	gt	max	tag
99.663	0.303	0.033	0.001	0.000	0.000	0.000	0.000	0.000	0.000	0.014	my5621_rel.cy10a22_gcp_c2s30
99.672	0.295	0.032	0.001	0.000	0.000	0.000	0.000	0.000	0.000	0.012	my5631_rel.cy10a22_gcp_c2s30
99.657	0.310	0.033	0.001	0.000	0.000	0.000	0.000	0.000	0.000	0.012	my5641_rel.cy10a22_gcp_c2s30
99.659	0.307	0.033	0.001	0.000	0.000	0.000	0.000	0.000	0.000	0.011	my5651_rel.cy10a22_gcp_c2s30
Insert response time histogram
256us	1ms	4ms	16ms	64ms	256ms	1s	4s	16s	gt	max	tag
0.000	0.000	40.730	58.012	1.258	0.000	0.000	0.000	0.000	0.000	0.034	my5621_rel.cy10a22_gcp_c2s30
0.000	0.001	38.822	59.960	1.217	0.000	0.000	0.000	0.000	0.000	0.032	my5631_rel.cy10a22_gcp_c2s30
0.000	0.000	32.423	66.203	1.374	0.000	0.000	0.000	0.000	0.000	0.033	my5641_rel.cy10a22_gcp_c2s30
0.000	0.000	34.712	63.934	1.353	0.000	0.000	0.000	0.000	0.000	0.033	my5651_rel.cy10a22_gcp_c2s30
Delete response time histogram
256us	1ms	4ms	16ms	64ms	256ms	1s	4s	16s	gt	max	tag
0.000	0.004	51.053	48.202	0.740	0.000	0.000	0.000	0.000	0.000	0.032	my5621_rel.cy10a22_gcp_c2s30
0.000	0.010	48.583	50.735	0.672	0.000	0.000	0.000	0.000	0.000	0.030	my5631_rel.cy10a22_gcp_c2s30
0.000	0.013	40.346	58.858	0.784	0.000	0.000	0.000	0.000	0.000	0.038	my5641_rel.cy10a22_gcp_c2s30
0.000	0.008	42.811	56.428	0.753	0.000	0.000	0.000	0.000	0.000	0.029	my5651_rel.cy10a22_gcp_c2s30
q1000.1
- q1000.1: range queries with 1000 insert/s per client
- Legend for results is here.
- Each entry lists the percentage of responses that fit in that bucket (slower than max time for previous bucket, faster than min time for next bucket).
Query response time histogram
256us	1ms	4ms	16ms	64ms	256ms	1s	4s	16s	gt	max	tag
99.397	0.541	0.061	0.001	0.000	0.000	0.000	0.000	0.000	0.000	0.012	my5621_rel.cy10a22_gcp_c2s30
99.379	0.557	0.063	0.001	nonzero	0.000	0.000	0.000	0.000	0.000	0.024	my5631_rel.cy10a22_gcp_c2s30
99.359	0.571	0.068	0.001	nonzero	0.000	0.000	0.000	0.000	0.000	0.025	my5641_rel.cy10a22_gcp_c2s30
99.384	0.550	0.065	0.001	nonzero	0.000	0.000	0.000	0.000	0.000	0.040	my5651_rel.cy10a22_gcp_c2s30
Insert response time histogram
256us	1ms	4ms	16ms	64ms	256ms	1s	4s	16s	gt	max	tag
0.000	nonzero	38.816	59.737	1.447	0.000	0.000	0.000	0.000	0.000	0.036	my5621_rel.cy10a22_gcp_c2s30
0.000	nonzero	38.112	60.321	1.567	0.000	0.000	0.000	0.000	0.000	0.037	my5631_rel.cy10a22_gcp_c2s30
0.000	0.000	37.244	61.060	1.696	0.000	0.000	0.000	0.000	0.000	0.037	my5641_rel.cy10a22_gcp_c2s30
0.000	0.000	38.673	59.784	1.543	0.000	0.000	0.000	0.000	0.000	0.038	my5651_rel.cy10a22_gcp_c2s30
Delete response time histogram
256us	1ms	4ms	16ms	64ms	256ms	1s	4s	16s	gt	max	tag
0.000	0.010	47.676	51.426	0.887	0.000	0.000	0.000	0.000	0.000	0.034	my5621_rel.cy10a22_gcp_c2s30
0.000	0.011	47.115	51.972	0.902	0.000	0.000	0.000	0.000	0.000	0.035	my5631_rel.cy10a22_gcp_c2s30
0.000	0.011	46.461	52.527	1.000	0.000	0.000	0.000	0.000	0.000	0.040	my5641_rel.cy10a22_gcp_c2s30
0.000	0.018	47.497	51.569	0.916	0.000	0.000	0.000	0.000	0.000	0.035	my5651_rel.cy10a22_gcp_c2s30