Introduction
This is a report for the insert benchmark with 160M docs and 8 client(s). It is generated by scripts (bash, awk, sed) and Tufte might not be impressed. An overview of the insert benchmark is here and a short update is here. Below, by DBMS, I mean DBMS+version.config. An example is my8020.c10b40 where my means MySQL, 8020 is version 8.0.20 and c10b40 is the name for the configuration file.
The test server is a c2-standard-30 with 15 cores, hyperthreads disabled, 120G RAM and XFS with SW RAID 0 across 4 NVMe SSD. The benchmark was run with 8 clients and there were 1 or 3 connections per client (1 for queries or inserts without rate limits, 1+1 for rate limited inserts+deletes). It uses 8 tables, 1 per client. It loads 20M rows per table without secondary indexes, creates secondary indexes, then inserts 300M rows per table with a delete per insert to avoid growing the table. It then does 3 read+write tests for 7200s each that do queries as fast as possible with 100, 500 and then 1000 inserts/second/client concurrent with the queries. There are also deletes to match the inserts and avoid growing the table. The database is cached by Postgres. Clients and the DBMS share one server. The per-database configs are in the per-database subdirectories here.
The tested DBMS are:
- pg160_o2_nofp.cx7a28_gcp_c2s30 - Postgres 16.0, o2_nofp build, cx7a28_gcp_c2s30 config
- pg16oriole_o2_nofp_patches16_18.cx7a28_gcp_c2s30 - OrioleDB with Postgres 16.0 at patches16_18, o2_nofp build, cx7a28_gcp_c2s30 config
Contents
- Summary
- l.i0: load without secondary indexes
- l.x: create secondary indexes
- l.i1: continue load after secondary indexes created
- q100.1: range queries with 100 insert/s per client
- q500.1: range queries with 500 insert/s per client
- q1000.1: range queries with 1000 insert/s per client
Summary
The numbers are inserts/s for l.i0 and l.i1, indexed docs (or rows) /s for l.x and queries/s for q*.2. The values are the average rate over the entire test for inserts (IPS) and queries (QPS). The range of values for IPS and QPS is split into 3 parts: bottom 25%, middle 50%, top 25%. Values in the bottom 25% have a red background, values in the top 25% have a green background and values in the middle have no color. A gray background is used for values that can be ignored because the DBMS did not sustain the target insert rate. Red backgrounds are not used when the minimum value is within 80% of the max value.
| dbms | l.i0 | l.x | l.i1 | q100.1 | q500.1 | q1000.1 |
|---|---|---|---|---|---|---|
| pg160_o2_nofp.cx7a28_gcp_c2s30 | 919540 | 2287143 | 187368 | 105568 | 103207 | 102496 |
| pg16oriole_o2_nofp_patches16_18.cx7a28_gcp_c2s30 | 879121 | 2001250 | 213466 | 109837 | 107352 | 104953 |
This table has relative throughput, throughput for the DBMS relative to the DBMS in the first line, using the absolute throughput from the previous table. Values less than 0.95 have a yellow background. Values greater than 1.05 have a blue background.
| dbms | l.i0 | l.x | l.i1 | q100.1 | q500.1 | q1000.1 |
|---|---|---|---|---|---|---|
| pg160_o2_nofp.cx7a28_gcp_c2s30 | 1.00 | 1.00 | 1.00 | 1.00 | 1.00 | 1.00 |
| pg16oriole_o2_nofp_patches16_18.cx7a28_gcp_c2s30 | 0.96 | 0.87 | 1.14 | 1.04 | 1.04 | 1.02 |
This lists the average rate of inserts/s for the tests that do inserts concurrent with queries. For such tests the query rate is listed in the table above. The read+write tests are setup so that the insert rate should match the target rate every second. Cells that are not at least 95% of the target have a red background to indicate a failure to satisfy the target.
| dbms | q100.1 | q500.1 | q1000.1 |
|---|---|---|---|
| pg160_o2_nofp.cx7a28_gcp_c2s30 | 798 | 3991 | 7984 |
| pg16oriole_o2_nofp_patches16_18.cx7a28_gcp_c2s30 | 798 | 3992 | 7983 |
| target | 800 | 4000 | 8000 |
l.i0
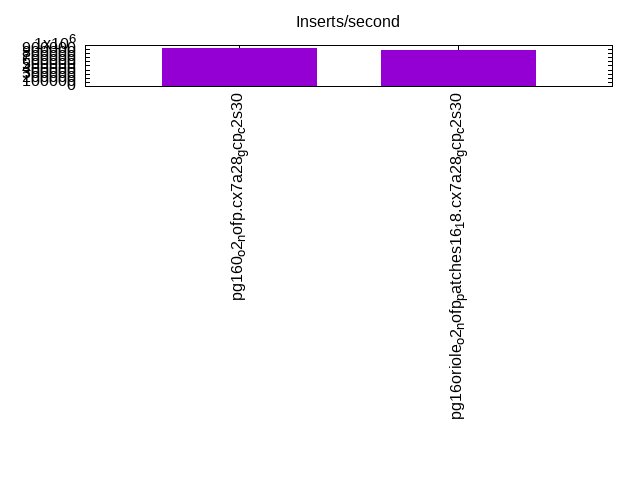
l.i0: load without secondary indexes. Graphs for performance per 1-second interval are here.
Average throughput:
Insert response time histogram: each cell has the percentage of responses that take <= the time in the header and max is the max response time in seconds. For the max column values in the top 25% of the range have a red background and in the bottom 25% of the range have a green background. The red background is not used when the min value is within 80% of the max value.
| dbms | 256us | 1ms | 4ms | 16ms | 64ms | 256ms | 1s | 4s | 16s | gt | max |
|---|---|---|---|---|---|---|---|---|---|---|---|
| pg160_o2_nofp.cx7a28_gcp_c2s30 | 97.948 | 1.995 | 0.040 | 0.009 | 0.006 | 0.002 | 0.342 | ||||
| pg16oriole_o2_nofp_patches16_18.cx7a28_gcp_c2s30 | 98.969 | 0.975 | 0.005 | 0.052 | 0.184 |
Performance metrics for the DBMS listed above. Some are normalized by throughput, others are not. Legend for results is here.
ips	qps	rps	rmbps	wps	wmbps	rpq	rkbpq	wpi	wkbpi	csps	cpups	cspq	cpupq	dbgb1	dbgb2	rss	maxop	p50	p99	tag
919540	0	0	0.0	1065.3	334.2	0.000	0.000	0.001	0.372	82747	75.6	0.090	12	15.3	41.9	3.1	0.342	129157	66627	160m.pg160_o2_nofp.cx7a28_gcp_c2s30
879121	0	0	0.0	232.2	68.8	0.000	0.000	0.000	0.080	89469	71.2	0.102	12	0.0	9.2	12.6	0.184	118911	101890	160m.pg16oriole_o2_nofp_patches16_18.cx7a28_gcp_c2s30
l.x
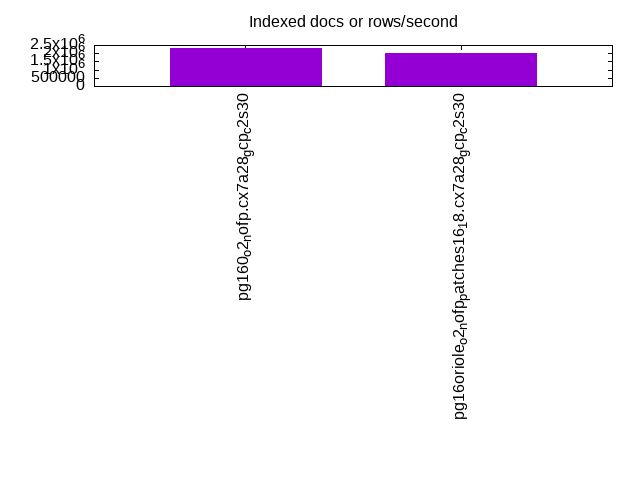
l.x: create secondary indexes.
Average throughput:
Performance metrics for the DBMS listed above. Some are normalized by throughput, others are not. Legend for results is here.
ips	qps	rps	rmbps	wps	wmbps	rpq	rkbpq	wpi	wkbpi	csps	cpups	cspq	cpupq	dbgb1	dbgb2	rss	maxop	p50	p99	tag
2287143	0	0	0.0	1391.2	530.8	0.000	0.000	0.001	0.238	15464	37.9	0.007	2	29.4	61.5	13.2	0.002	NA	NA	160m.pg160_o2_nofp.cx7a28_gcp_c2s30
2001250	0	1	0.0	910.9	289.2	0.000	0.000	0.000	0.148	4501	45.9	0.002	3	0.0	28.7	11.7	0.002	NA	NA	160m.pg16oriole_o2_nofp_patches16_18.cx7a28_gcp_c2s30
l.i1
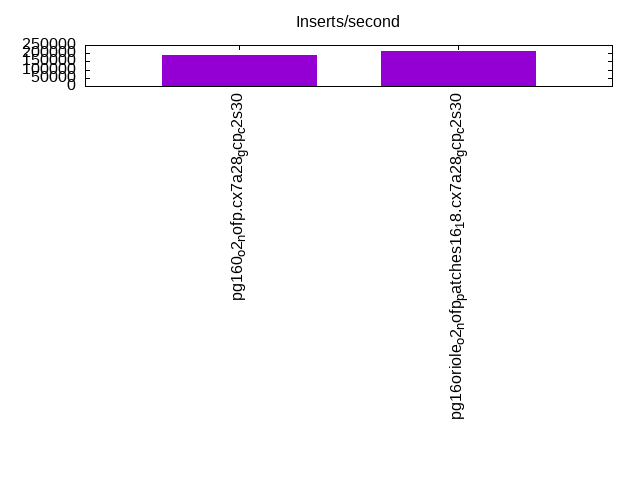
l.i1: continue load after secondary indexes created. Graphs for performance per 1-second interval are here.
Average throughput:
Insert response time histogram: each cell has the percentage of responses that take <= the time in the header and max is the max response time in seconds. For the max column values in the top 25% of the range have a red background and in the bottom 25% of the range have a green background. The red background is not used when the min value is within 80% of the max value.
| dbms | 256us | 1ms | 4ms | 16ms | 64ms | 256ms | 1s | 4s | 16s | gt | max |
|---|---|---|---|---|---|---|---|---|---|---|---|
| pg160_o2_nofp.cx7a28_gcp_c2s30 | 0.057 | 98.873 | 0.441 | 0.575 | 0.053 | 0.001 | nonzero | 20.387 | |||
| pg16oriole_o2_nofp_patches16_18.cx7a28_gcp_c2s30 | nonzero | 97.586 | 2.245 | 0.017 | 0.152 | nonzero | 2.907 |
Delete response time histogram: each cell has the percentage of responses that take <= the time in the header and max is the max response time in seconds. For the max column values in the top 25% of the range have a red background and in the bottom 25% of the range have a green background. The red background is not used when the min value is within 80% of the max value.
| dbms | 256us | 1ms | 4ms | 16ms | 64ms | 256ms | 1s | 4s | 16s | gt | max |
|---|---|---|---|---|---|---|---|---|---|---|---|
| pg160_o2_nofp.cx7a28_gcp_c2s30 | 76.041 | 8.932 | 10.540 | 4.104 | 0.345 | 0.038 | 0.001 | nonzero | 20.388 | ||
| pg16oriole_o2_nofp_patches16_18.cx7a28_gcp_c2s30 | nonzero | 49.228 | 50.222 | 0.508 | 0.017 | 0.025 | nonzero | 2.688 |
Performance metrics for the DBMS listed above. Some are normalized by throughput, others are not. Legend for results is here.
ips	qps	rps	rmbps	wps	wmbps	rpq	rkbpq	wpi	wkbpi	csps	cpups	cspq	cpupq	dbgb1	dbgb2	rss	maxop	p50	p99	tag
187368	0	0	0.0	10281.3	873.0	0.000	0.000	0.055	4.771	73249	69.5	0.391	56	41.6	73.7	28.8	20.387	27420	2299	160m.pg160_o2_nofp.cx7a28_gcp_c2s30
213466	0	1	0.1	19924.1	316.7	0.000	0.000	0.093	1.519	141176	81.1	0.661	57	0.0	305.1	53.2	2.907	27970	15633	160m.pg16oriole_o2_nofp_patches16_18.cx7a28_gcp_c2s30
q100.1
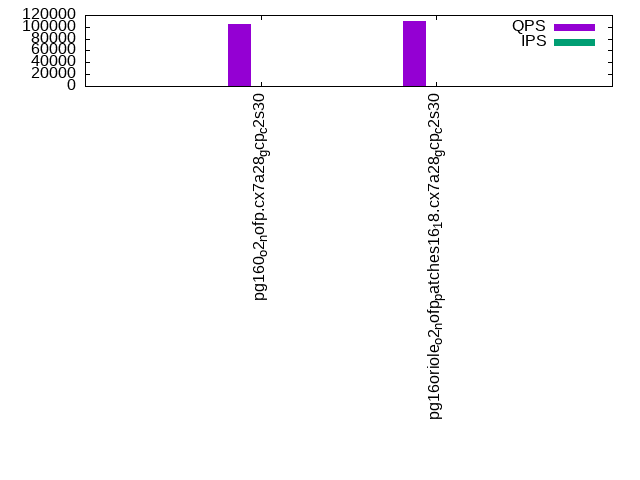
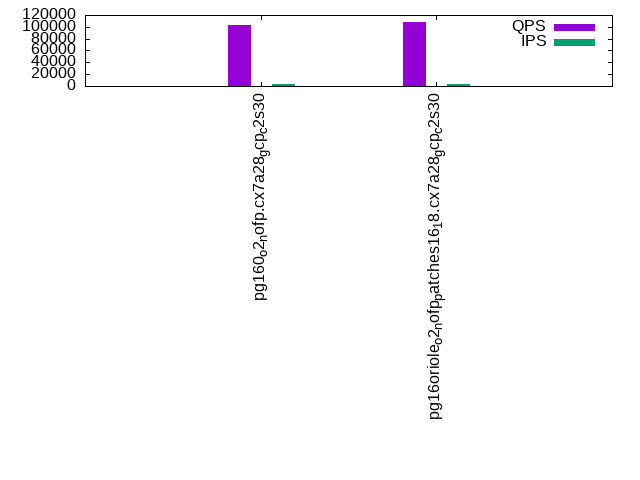
q100.1: range queries with 100 insert/s per client. Graphs for performance per 1-second interval are here.
Average throughput:
Query response time histogram: each cell has the percentage of responses that take <= the time in the header and max is the max response time in seconds. For max values in the top 25% of the range have a red background and in the bottom 25% of the range have a green background. The red background is not used when the min value is within 80% of the max value.
| dbms | 256us | 1ms | 4ms | 16ms | 64ms | 256ms | 1s | 4s | 16s | gt | max |
|---|---|---|---|---|---|---|---|---|---|---|---|
| pg160_o2_nofp.cx7a28_gcp_c2s30 | 99.998 | 0.002 | nonzero | nonzero | 0.008 | ||||||
| pg16oriole_o2_nofp_patches16_18.cx7a28_gcp_c2s30 | 99.997 | 0.002 | 0.001 | nonzero | nonzero | nonzero | nonzero | nonzero | 3.175 |
Insert response time histogram: each cell has the percentage of responses that take <= the time in the header and max is the max response time in seconds. For max values in the top 25% of the range have a red background and in the bottom 25% of the range have a green background. The red background is not used when the min value is within 80% of the max value.
| dbms | 256us | 1ms | 4ms | 16ms | 64ms | 256ms | 1s | 4s | 16s | gt | max |
|---|---|---|---|---|---|---|---|---|---|---|---|
| pg160_o2_nofp.cx7a28_gcp_c2s30 | 99.963 | 0.037 | 0.012 | ||||||||
| pg16oriole_o2_nofp_patches16_18.cx7a28_gcp_c2s30 | 99.982 | 0.012 | 0.003 | 0.001 | 0.003 | 3.175 |
Delete response time histogram: each cell has the percentage of responses that take <= the time in the header and max is the max response time in seconds. For max values in the top 25% of the range have a red background and in the bottom 25% of the range have a green background. The red background is not used when the min value is within 80% of the max value.
| dbms | 256us | 1ms | 4ms | 16ms | 64ms | 256ms | 1s | 4s | 16s | gt | max |
|---|---|---|---|---|---|---|---|---|---|---|---|
| pg160_o2_nofp.cx7a28_gcp_c2s30 | 66.362 | 10.201 | 19.808 | 3.627 | 0.002 | 0.017 | |||||
| pg16oriole_o2_nofp_patches16_18.cx7a28_gcp_c2s30 | 71.835 | 28.161 | 0.003 | 0.001 | 0.016 |
Performance metrics for the DBMS listed above. Some are normalized by throughput, others are not. Legend for results is here.
ips	qps	rps	rmbps	wps	wmbps	rpq	rkbpq	wpi	wkbpi	csps	cpups	cspq	cpupq	dbgb1	dbgb2	rss	maxop	p50	p99	tag
798	105568	0	0.0	336.8	11.9	0.000	0.000	0.422	15.226	403478	53.3	3.822	76	41.6	73.7	4.8	0.008	13266	13042	160m.pg160_o2_nofp.cx7a28_gcp_c2s30
798	109837	0	0.0	291.1	12.2	0.000	0.000	0.365	15.625	419293	53.3	3.817	73	0.0	174.5	53.2	3.175	13670	11859	160m.pg16oriole_o2_nofp_patches16_18.cx7a28_gcp_c2s30
q500.1
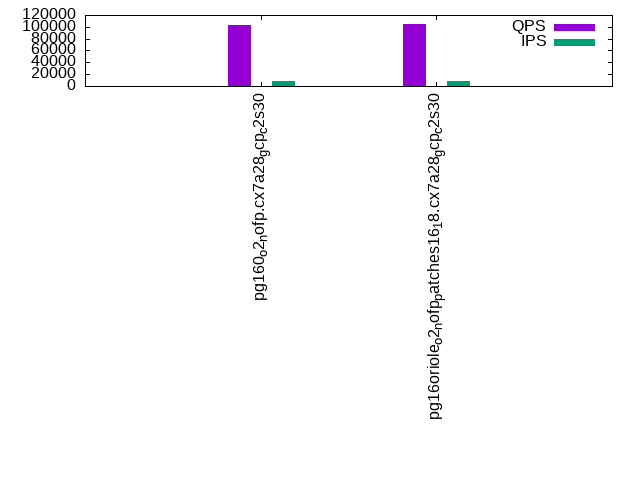
q500.1: range queries with 500 insert/s per client. Graphs for performance per 1-second interval are here.
Average throughput:
Query response time histogram: each cell has the percentage of responses that take <= the time in the header and max is the max response time in seconds. For max values in the top 25% of the range have a red background and in the bottom 25% of the range have a green background. The red background is not used when the min value is within 80% of the max value.
| dbms | 256us | 1ms | 4ms | 16ms | 64ms | 256ms | 1s | 4s | 16s | gt | max |
|---|---|---|---|---|---|---|---|---|---|---|---|
| pg160_o2_nofp.cx7a28_gcp_c2s30 | 99.989 | 0.007 | 0.004 | nonzero | nonzero | nonzero | nonzero | 0.829 | |||
| pg16oriole_o2_nofp_patches16_18.cx7a28_gcp_c2s30 | 99.981 | 0.012 | 0.007 | nonzero | nonzero | nonzero | nonzero | 0.353 |
Insert response time histogram: each cell has the percentage of responses that take <= the time in the header and max is the max response time in seconds. For max values in the top 25% of the range have a red background and in the bottom 25% of the range have a green background. The red background is not used when the min value is within 80% of the max value.
| dbms | 256us | 1ms | 4ms | 16ms | 64ms | 256ms | 1s | 4s | 16s | gt | max |
|---|---|---|---|---|---|---|---|---|---|---|---|
| pg160_o2_nofp.cx7a28_gcp_c2s30 | 99.915 | 0.077 | 0.003 | 0.003 | 0.002 | 0.893 | |||||
| pg16oriole_o2_nofp_patches16_18.cx7a28_gcp_c2s30 | 99.518 | 0.448 | 0.007 | 0.025 | 0.002 | 0.483 |
Delete response time histogram: each cell has the percentage of responses that take <= the time in the header and max is the max response time in seconds. For max values in the top 25% of the range have a red background and in the bottom 25% of the range have a green background. The red background is not used when the min value is within 80% of the max value.
| dbms | 256us | 1ms | 4ms | 16ms | 64ms | 256ms | 1s | 4s | 16s | gt | max |
|---|---|---|---|---|---|---|---|---|---|---|---|
| pg160_o2_nofp.cx7a28_gcp_c2s30 | 77.728 | 11.682 | 10.119 | 0.465 | 0.001 | 0.002 | 0.002 | 0.825 | |||
| pg16oriole_o2_nofp_patches16_18.cx7a28_gcp_c2s30 | 93.991 | 5.730 | 0.277 | 0.001 | 0.001 | nonzero | 0.486 |
Performance metrics for the DBMS listed above. Some are normalized by throughput, others are not. Legend for results is here.
ips	qps	rps	rmbps	wps	wmbps	rpq	rkbpq	wpi	wkbpi	csps	cpups	cspq	cpupq	dbgb1	dbgb2	rss	maxop	p50	p99	tag
3991	103207	0	0.0	254.5	20.6	0.000	0.000	0.064	5.283	394967	54.2	3.827	79	41.6	73.7	12.0	0.829	13042	11124	160m.pg160_o2_nofp.cx7a28_gcp_c2s30
3992	107352	0	0.0	674.4	19.8	0.000	0.000	0.169	5.071	409909	54.1	3.818	76	0.0	178.9	53.2	0.353	13409	11491	160m.pg16oriole_o2_nofp_patches16_18.cx7a28_gcp_c2s30
q1000.1
q1000.1: range queries with 1000 insert/s per client. Graphs for performance per 1-second interval are here.
Average throughput:
Query response time histogram: each cell has the percentage of responses that take <= the time in the header and max is the max response time in seconds. For max values in the top 25% of the range have a red background and in the bottom 25% of the range have a green background. The red background is not used when the min value is within 80% of the max value.
| dbms | 256us | 1ms | 4ms | 16ms | 64ms | 256ms | 1s | 4s | 16s | gt | max |
|---|---|---|---|---|---|---|---|---|---|---|---|
| pg160_o2_nofp.cx7a28_gcp_c2s30 | 99.956 | 0.034 | 0.010 | nonzero | nonzero | nonzero | 0.194 | ||||
| pg16oriole_o2_nofp_patches16_18.cx7a28_gcp_c2s30 | 99.945 | 0.041 | 0.014 | 0.001 | nonzero | nonzero | nonzero | 0.469 |
Insert response time histogram: each cell has the percentage of responses that take <= the time in the header and max is the max response time in seconds. For max values in the top 25% of the range have a red background and in the bottom 25% of the range have a green background. The red background is not used when the min value is within 80% of the max value.
| dbms | 256us | 1ms | 4ms | 16ms | 64ms | 256ms | 1s | 4s | 16s | gt | max |
|---|---|---|---|---|---|---|---|---|---|---|---|
| pg160_o2_nofp.cx7a28_gcp_c2s30 | 99.549 | 0.422 | 0.023 | 0.006 | 0.196 | ||||||
| pg16oriole_o2_nofp_patches16_18.cx7a28_gcp_c2s30 | 98.856 | 1.054 | 0.038 | 0.050 | 0.002 | 0.440 |
Delete response time histogram: each cell has the percentage of responses that take <= the time in the header and max is the max response time in seconds. For max values in the top 25% of the range have a red background and in the bottom 25% of the range have a green background. The red background is not used when the min value is within 80% of the max value.
| dbms | 256us | 1ms | 4ms | 16ms | 64ms | 256ms | 1s | 4s | 16s | gt | max |
|---|---|---|---|---|---|---|---|---|---|---|---|
| pg160_o2_nofp.cx7a28_gcp_c2s30 | 78.338 | 11.943 | 9.530 | 0.181 | 0.006 | 0.003 | 0.194 | ||||
| pg16oriole_o2_nofp_patches16_18.cx7a28_gcp_c2s30 | 91.136 | 8.085 | 0.759 | 0.019 | 0.001 | 0.205 |
Performance metrics for the DBMS listed above. Some are normalized by throughput, others are not. Legend for results is here.
ips	qps	rps	rmbps	wps	wmbps	rpq	rkbpq	wpi	wkbpi	csps	cpups	cspq	cpupq	dbgb1	dbgb2	rss	maxop	p50	p99	tag
7984	102496	0	0.0	394.7	38.3	0.000	0.000	0.049	4.915	391389	55.1	3.819	81	41.5	73.5	22.7	0.194	12866	10932	160m.pg160_o2_nofp.cx7a28_gcp_c2s30
7983	104953	0	0.0	725.7	22.7	0.000	0.000	0.091	2.917	400005	55.1	3.811	79	0.0	184.9	53.2	0.469	13254	11060	160m.pg16oriole_o2_nofp_patches16_18.cx7a28_gcp_c2s30
l.i0
l.i0: load without secondary indexes
Performance metrics for all DBMS, not just the ones listed above. Some are normalized by throughput, others are not. Legend for results is here.
ips	qps	rps	rmbps	wps	wmbps	rpq	rkbpq	wpi	wkbpi	csps	cpups	cspq	cpupq	dbgb1	dbgb2	rss	maxop	p50	p99	tag
919540	0	0	0.0	1065.3	334.2	0.000	0.000	0.001	0.372	82747	75.6	0.090	12	15.3	41.9	3.1	0.342	129157	66627	160m.pg160_o2_nofp.cx7a28_gcp_c2s30
879121	0	0	0.0	232.2	68.8	0.000	0.000	0.000	0.080	89469	71.2	0.102	12	0.0	9.2	12.6	0.184	118911	101890	160m.pg16oriole_o2_nofp_patches16_18.cx7a28_gcp_c2s30
l.x
l.x: create secondary indexes
Performance metrics for all DBMS, not just the ones listed above. Some are normalized by throughput, others are not. Legend for results is here.
ips	qps	rps	rmbps	wps	wmbps	rpq	rkbpq	wpi	wkbpi	csps	cpups	cspq	cpupq	dbgb1	dbgb2	rss	maxop	p50	p99	tag
2287143	0	0	0.0	1391.2	530.8	0.000	0.000	0.001	0.238	15464	37.9	0.007	2	29.4	61.5	13.2	0.002	NA	NA	160m.pg160_o2_nofp.cx7a28_gcp_c2s30
2001250	0	1	0.0	910.9	289.2	0.000	0.000	0.000	0.148	4501	45.9	0.002	3	0.0	28.7	11.7	0.002	NA	NA	160m.pg16oriole_o2_nofp_patches16_18.cx7a28_gcp_c2s30
l.i1
l.i1: continue load after secondary indexes created
Performance metrics for all DBMS, not just the ones listed above. Some are normalized by throughput, others are not. Legend for results is here.
ips	qps	rps	rmbps	wps	wmbps	rpq	rkbpq	wpi	wkbpi	csps	cpups	cspq	cpupq	dbgb1	dbgb2	rss	maxop	p50	p99	tag
187368	0	0	0.0	10281.3	873.0	0.000	0.000	0.055	4.771	73249	69.5	0.391	56	41.6	73.7	28.8	20.387	27420	2299	160m.pg160_o2_nofp.cx7a28_gcp_c2s30
213466	0	1	0.1	19924.1	316.7	0.000	0.000	0.093	1.519	141176	81.1	0.661	57	0.0	305.1	53.2	2.907	27970	15633	160m.pg16oriole_o2_nofp_patches16_18.cx7a28_gcp_c2s30
q100.1
q100.1: range queries with 100 insert/s per client
Performance metrics for all DBMS, not just the ones listed above. Some are normalized by throughput, others are not. Legend for results is here.
ips	qps	rps	rmbps	wps	wmbps	rpq	rkbpq	wpi	wkbpi	csps	cpups	cspq	cpupq	dbgb1	dbgb2	rss	maxop	p50	p99	tag
798	105568	0	0.0	336.8	11.9	0.000	0.000	0.422	15.226	403478	53.3	3.822	76	41.6	73.7	4.8	0.008	13266	13042	160m.pg160_o2_nofp.cx7a28_gcp_c2s30
798	109837	0	0.0	291.1	12.2	0.000	0.000	0.365	15.625	419293	53.3	3.817	73	0.0	174.5	53.2	3.175	13670	11859	160m.pg16oriole_o2_nofp_patches16_18.cx7a28_gcp_c2s30
q500.1
q500.1: range queries with 500 insert/s per client
Performance metrics for all DBMS, not just the ones listed above. Some are normalized by throughput, others are not. Legend for results is here.
ips	qps	rps	rmbps	wps	wmbps	rpq	rkbpq	wpi	wkbpi	csps	cpups	cspq	cpupq	dbgb1	dbgb2	rss	maxop	p50	p99	tag
3991	103207	0	0.0	254.5	20.6	0.000	0.000	0.064	5.283	394967	54.2	3.827	79	41.6	73.7	12.0	0.829	13042	11124	160m.pg160_o2_nofp.cx7a28_gcp_c2s30
3992	107352	0	0.0	674.4	19.8	0.000	0.000	0.169	5.071	409909	54.1	3.818	76	0.0	178.9	53.2	0.353	13409	11491	160m.pg16oriole_o2_nofp_patches16_18.cx7a28_gcp_c2s30
q1000.1
q1000.1: range queries with 1000 insert/s per client
Performance metrics for all DBMS, not just the ones listed above. Some are normalized by throughput, others are not. Legend for results is here.
ips	qps	rps	rmbps	wps	wmbps	rpq	rkbpq	wpi	wkbpi	csps	cpups	cspq	cpupq	dbgb1	dbgb2	rss	maxop	p50	p99	tag
7984	102496	0	0.0	394.7	38.3	0.000	0.000	0.049	4.915	391389	55.1	3.819	81	41.5	73.5	22.7	0.194	12866	10932	160m.pg160_o2_nofp.cx7a28_gcp_c2s30
7983	104953	0	0.0	725.7	22.7	0.000	0.000	0.091	2.917	400005	55.1	3.811	79	0.0	184.9	53.2	0.469	13254	11060	160m.pg16oriole_o2_nofp_patches16_18.cx7a28_gcp_c2s30
l.i0
- l.i0: load without secondary indexes
- Legend for results is here.
- Each entry lists the percentage of responses that fit in that bucket (slower than max time for previous bucket, faster than min time for next bucket).
Insert response time histogram
256us	1ms	4ms	16ms	64ms	256ms	1s	4s	16s	gt	max	tag
0.000	97.948	1.995	0.040	0.009	0.006	0.002	0.000	0.000	0.000	0.342	pg160_o2_nofp.cx7a28_gcp_c2s30
0.000	98.969	0.975	0.005	0.000	0.052	0.000	0.000	0.000	0.000	0.184	pg16oriole_o2_nofp_patches16_18.cx7a28_gcp_c2s30
l.x
- l.x: create secondary indexes
- Legend for results is here.
- Each entry lists the percentage of responses that fit in that bucket (slower than max time for previous bucket, faster than min time for next bucket).
TODO - determine whether there is data for create index response time
l.i1
- l.i1: continue load after secondary indexes created
- Legend for results is here.
- Each entry lists the percentage of responses that fit in that bucket (slower than max time for previous bucket, faster than min time for next bucket).
Insert response time histogram
256us	1ms	4ms	16ms	64ms	256ms	1s	4s	16s	gt	max	tag
0.000	0.057	98.873	0.441	0.575	0.053	0.001	0.000	0.000	nonzero	20.387	pg160_o2_nofp.cx7a28_gcp_c2s30
0.000	nonzero	97.586	2.245	0.017	0.152	0.000	nonzero	0.000	0.000	2.907	pg16oriole_o2_nofp_patches16_18.cx7a28_gcp_c2s30
Delete response time histogram
256us	1ms	4ms	16ms	64ms	256ms	1s	4s	16s	gt	max	tag
76.041	8.932	10.540	4.104	0.345	0.038	0.001	0.000	0.000	nonzero	20.388	pg160_o2_nofp.cx7a28_gcp_c2s30
nonzero	49.228	50.222	0.508	0.017	0.025	0.000	nonzero	0.000	0.000	2.688	pg16oriole_o2_nofp_patches16_18.cx7a28_gcp_c2s30
q100.1
- q100.1: range queries with 100 insert/s per client
- Legend for results is here.
- Each entry lists the percentage of responses that fit in that bucket (slower than max time for previous bucket, faster than min time for next bucket).
Query response time histogram
256us	1ms	4ms	16ms	64ms	256ms	1s	4s	16s	gt	max	tag
99.998	0.002	nonzero	nonzero	0.000	0.000	0.000	0.000	0.000	0.000	0.008	pg160_o2_nofp.cx7a28_gcp_c2s30
99.997	0.002	0.001	nonzero	nonzero	nonzero	nonzero	nonzero	0.000	0.000	3.175	pg16oriole_o2_nofp_patches16_18.cx7a28_gcp_c2s30
Insert response time histogram
256us	1ms	4ms	16ms	64ms	256ms	1s	4s	16s	gt	max	tag
0.000	0.000	99.963	0.037	0.000	0.000	0.000	0.000	0.000	0.000	0.012	pg160_o2_nofp.cx7a28_gcp_c2s30
0.000	0.000	99.982	0.012	0.000	0.003	0.001	0.003	0.000	0.000	3.175	pg16oriole_o2_nofp_patches16_18.cx7a28_gcp_c2s30
Delete response time histogram
256us	1ms	4ms	16ms	64ms	256ms	1s	4s	16s	gt	max	tag
66.362	10.201	19.808	3.627	0.002	0.000	0.000	0.000	0.000	0.000	0.017	pg160_o2_nofp.cx7a28_gcp_c2s30
0.000	71.835	28.161	0.003	0.001	0.000	0.000	0.000	0.000	0.000	0.016	pg16oriole_o2_nofp_patches16_18.cx7a28_gcp_c2s30
q500.1
- q500.1: range queries with 500 insert/s per client
- Legend for results is here.
- Each entry lists the percentage of responses that fit in that bucket (slower than max time for previous bucket, faster than min time for next bucket).
Query response time histogram
256us	1ms	4ms	16ms	64ms	256ms	1s	4s	16s	gt	max	tag
99.989	0.007	0.004	nonzero	nonzero	nonzero	nonzero	0.000	0.000	0.000	0.829	pg160_o2_nofp.cx7a28_gcp_c2s30
99.981	0.012	0.007	nonzero	nonzero	nonzero	nonzero	0.000	0.000	0.000	0.353	pg16oriole_o2_nofp_patches16_18.cx7a28_gcp_c2s30
Insert response time histogram
256us	1ms	4ms	16ms	64ms	256ms	1s	4s	16s	gt	max	tag
0.000	0.000	99.915	0.077	0.003	0.003	0.002	0.000	0.000	0.000	0.893	pg160_o2_nofp.cx7a28_gcp_c2s30
0.000	0.000	99.518	0.448	0.007	0.025	0.002	0.000	0.000	0.000	0.483	pg16oriole_o2_nofp_patches16_18.cx7a28_gcp_c2s30
Delete response time histogram
256us	1ms	4ms	16ms	64ms	256ms	1s	4s	16s	gt	max	tag
77.728	11.682	10.119	0.465	0.001	0.002	0.002	0.000	0.000	0.000	0.825	pg160_o2_nofp.cx7a28_gcp_c2s30
0.000	93.991	5.730	0.277	0.001	0.001	nonzero	0.000	0.000	0.000	0.486	pg16oriole_o2_nofp_patches16_18.cx7a28_gcp_c2s30
q1000.1
- q1000.1: range queries with 1000 insert/s per client
- Legend for results is here.
- Each entry lists the percentage of responses that fit in that bucket (slower than max time for previous bucket, faster than min time for next bucket).
Query response time histogram
256us	1ms	4ms	16ms	64ms	256ms	1s	4s	16s	gt	max	tag
99.956	0.034	0.010	nonzero	nonzero	nonzero	0.000	0.000	0.000	0.000	0.194	pg160_o2_nofp.cx7a28_gcp_c2s30
99.945	0.041	0.014	0.001	nonzero	nonzero	nonzero	0.000	0.000	0.000	0.469	pg16oriole_o2_nofp_patches16_18.cx7a28_gcp_c2s30
Insert response time histogram
256us	1ms	4ms	16ms	64ms	256ms	1s	4s	16s	gt	max	tag
0.000	0.000	99.549	0.422	0.023	0.006	0.000	0.000	0.000	0.000	0.196	pg160_o2_nofp.cx7a28_gcp_c2s30
0.000	0.000	98.856	1.054	0.038	0.050	0.002	0.000	0.000	0.000	0.440	pg16oriole_o2_nofp_patches16_18.cx7a28_gcp_c2s30
Delete response time histogram
256us	1ms	4ms	16ms	64ms	256ms	1s	4s	16s	gt	max	tag
78.338	11.943	9.530	0.181	0.006	0.003	0.000	0.000	0.000	0.000	0.194	pg160_o2_nofp.cx7a28_gcp_c2s30
0.000	91.136	8.085	0.759	0.019	0.001	0.000	0.000	0.000	0.000	0.205	pg16oriole_o2_nofp_patches16_18.cx7a28_gcp_c2s30