Introduction
This is a report for the insert benchmark with 20M docs and 1 client(s). It is generated by scripts (bash, awk, sed) and Tufte might not be impressed. An overview of the insert benchmark is here and a short update is here. Below, by DBMS, I mean DBMS+version.config. An example is my8020.c10b40 where my means MySQL, 8020 is version 8.0.20 and c10b40 is the name for the configuration file.
The test server has 8 AMD cores, 16G RAM and an NVMe SSD. It is described here as the Beelink. The benchmark was run with 1 client and there were 1 or 3 connections per client (1 for queries or inserts without rate limits, 1+1 for rate limited inserts+deletes). It uses 1 table. It loads 20M rows per table without secondary indexes, creates secondary indexes, then inserts 300M rows per table with a delete per insert to avoid growing the table. It then does 3 read+write tests for 7200s each that do queries as fast as possible with 100, 500 and then 1000 inserts/second/client concurrent with the queries and 1000 deletes/second to avoid growing the table. The database is cached by Postgres. Clients and the DBMS share one server. The per-database configs are in the per-database subdirectories here.
The tested DBMS are:
- pg160_o2_nofp.cx9a2_bee - Postgres 16.0, o2_nofp build that used -O2 -nofp and the a2 config
- pg16oriole_o2_nofp_patches16_18.cx9a2_bee - OrioleDB with Postgres 16 at patches16_18, o2_nofp build that used -O2 -nofp and the a2 config
Contents
- Summary
- l.i0: load without secondary indexes
- l.x: create secondary indexes
- l.i1: continue load after secondary indexes created
- q100.1: range queries with 100 insert/s per client
- q500.1: range queries with 500 insert/s per client
- q1000.1: range queries with 1000 insert/s per client
Summary
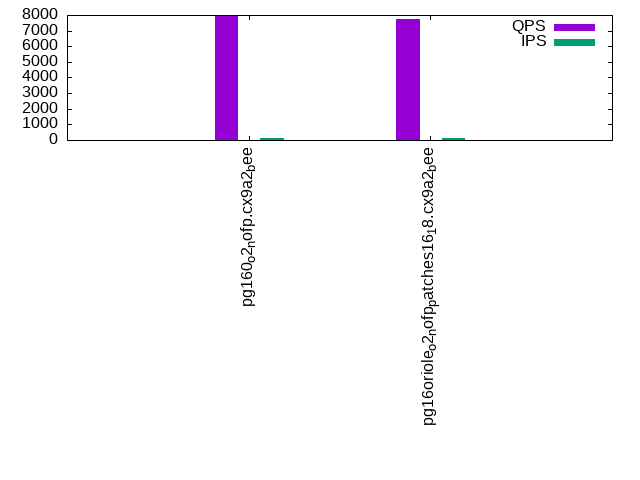
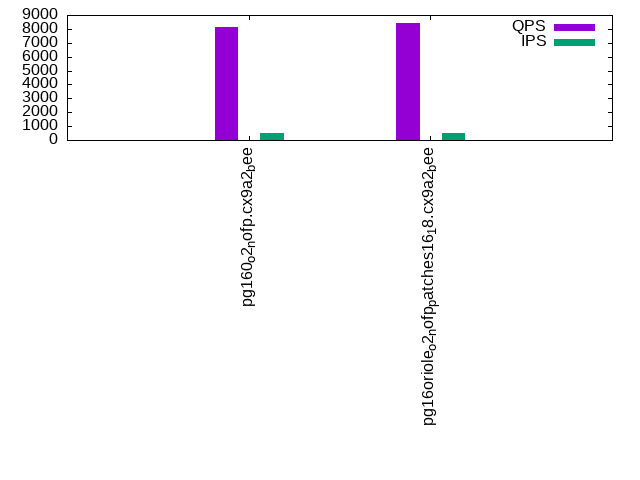
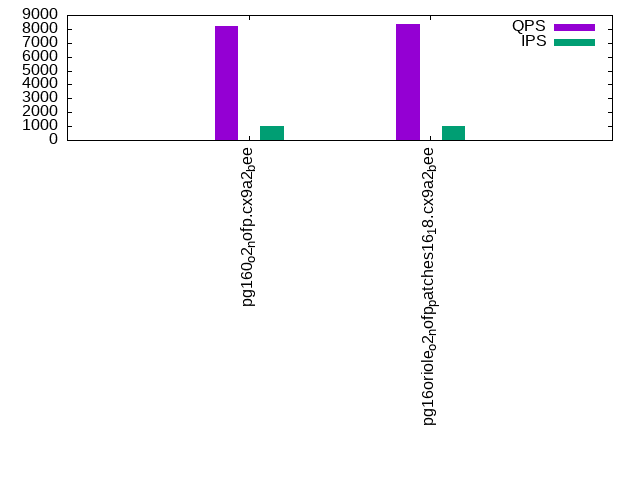
The numbers are inserts/s for l.i0 and l.i1, indexed docs (or rows) /s for l.x and queries/s for q*.2. The values are the average rate over the entire test for inserts (IPS) and queries (QPS). The range of values for IPS and QPS is split into 3 parts: bottom 25%, middle 50%, top 25%. Values in the bottom 25% have a red background, values in the top 25% have a green background and values in the middle have no color. A gray background is used for values that can be ignored because the DBMS did not sustain the target insert rate. Red backgrounds are not used when the minimum value is within 80% of the max value.
| dbms | l.i0 | l.x | l.i1 | q100.1 | q500.1 | q1000.1 |
|---|---|---|---|---|---|---|
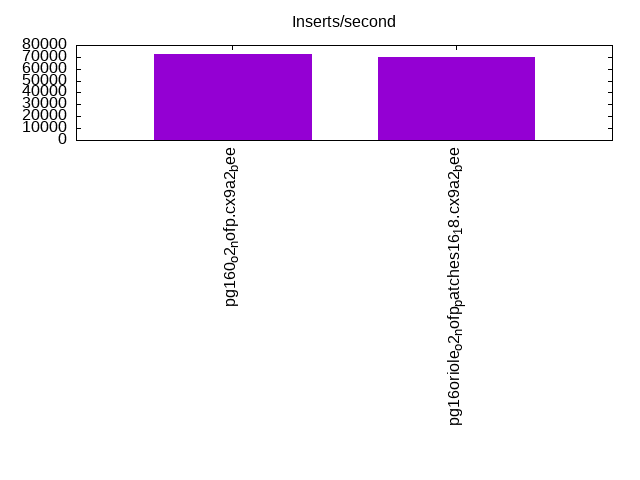
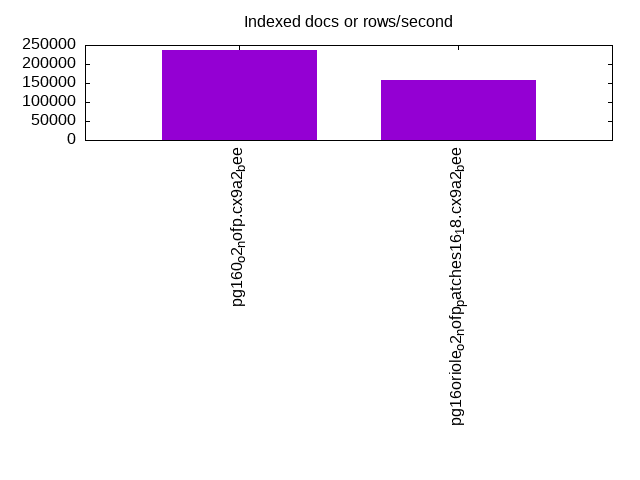
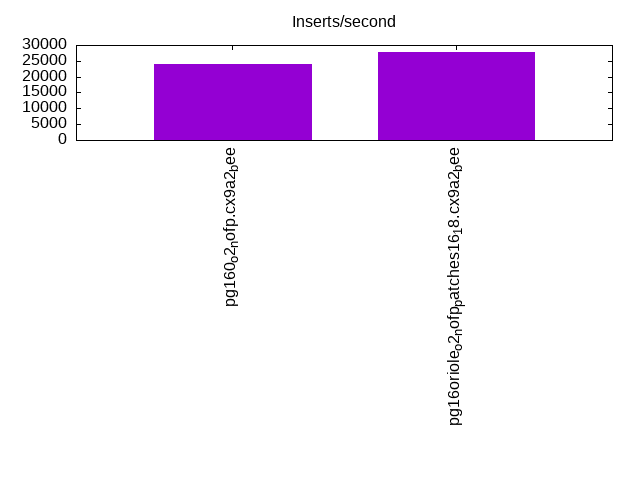
| pg160_o2_nofp.cx9a2_bee | 72727 | 236470 | 24031 | 7922 | 8123 | 8175 |
| pg16oriole_o2_nofp_patches16_18.cx9a2_bee | 70175 | 157031 | 27855 | 7744 | 8415 | 8335 |
This table has relative throughput, throughput for the DBMS relative to the DBMS in the first line, using the absolute throughput from the previous table. Values less than 0.95 have a yellow background. Values greater than 1.05 have a blue background.
| dbms | l.i0 | l.x | l.i1 | q100.1 | q500.1 | q1000.1 |
|---|---|---|---|---|---|---|
| pg160_o2_nofp.cx9a2_bee | 1.00 | 1.00 | 1.00 | 1.00 | 1.00 | 1.00 |
| pg16oriole_o2_nofp_patches16_18.cx9a2_bee | 0.96 | 0.66 | 1.16 | 0.98 | 1.04 | 1.02 |
This lists the average rate of inserts/s for the tests that do inserts concurrent with queries. For such tests the query rate is listed in the table above. The read+write tests are setup so that the insert rate should match the target rate every second. Cells that are not at least 95% of the target have a red background to indicate a failure to satisfy the target.
| dbms | q100.1 | q500.1 | q1000.1 |
|---|---|---|---|
| pg160_o2_nofp.cx9a2_bee | 100 | 499 | 998 |
| pg16oriole_o2_nofp_patches16_18.cx9a2_bee | 100 | 499 | 998 |
| target | 100 | 500 | 1000 |
l.i0
l.i0: load without secondary indexes. Graphs for performance per 1-second interval are here.
Average throughput:
Insert response time histogram: each cell has the percentage of responses that take <= the time in the header and max is the max response time in seconds. For the max column values in the top 25% of the range have a red background and in the bottom 25% of the range have a green background. The red background is not used when the min value is within 80% of the max value.
| dbms | 256us | 1ms | 4ms | 16ms | 64ms | 256ms | 1s | 4s | 16s | gt | max |
|---|---|---|---|---|---|---|---|---|---|---|---|
| pg160_o2_nofp.cx9a2_bee | 100.000 | 0.003 | |||||||||
| pg16oriole_o2_nofp_patches16_18.cx9a2_bee | 99.972 | 0.001 | 0.027 | 0.036 |
Performance metrics for the DBMS listed above. Some are normalized by throughput, others are not. Legend for results is here.
ips	qps	rps	rmbps	wps	wmbps	rpq	rkbpq	wpi	wkbpi	csps	cpups	cspq	cpupq	dbgb1	dbgb2	rss	maxop	p50	p99	tag
72727	0	0	0.0	83.4	30.6	0.000	0.000	0.001	0.431	8920	22.4	0.123	25	1.9	5.2	0.2	0.003	73018	70725	20m.pg160_o2_nofp.cx9a2_bee
70175	0	0	0.0	25.1	8.2	0.000	0.000	0.000	0.119	8113	22.1	0.116	25	0.0	1.2	0.6	0.036	70619	67723	20m.pg16oriole_o2_nofp_patches16_18.cx9a2_bee
l.x
l.x: create secondary indexes.
Average throughput:
Performance metrics for the DBMS listed above. Some are normalized by throughput, others are not. Legend for results is here.
ips	qps	rps	rmbps	wps	wmbps	rpq	rkbpq	wpi	wkbpi	csps	cpups	cspq	cpupq	dbgb1	dbgb2	rss	maxop	p50	p99	tag
236470	0	0	0.0	98.2	46.1	0.000	0.000	0.000	0.199	711	11.6	0.003	4	3.7	8.6	2.1	0.003	NA	NA	20m.pg160_o2_nofp.cx9a2_bee
157031	0	0	0.0	70.9	34.5	0.000	0.000	0.000	0.225	494	12.1	0.003	6	0.0	3.7	2.3	0.004	NA	NA	20m.pg16oriole_o2_nofp_patches16_18.cx9a2_bee
l.i1
l.i1: continue load after secondary indexes created. Graphs for performance per 1-second interval are here.
Average throughput:
Insert response time histogram: each cell has the percentage of responses that take <= the time in the header and max is the max response time in seconds. For the max column values in the top 25% of the range have a red background and in the bottom 25% of the range have a green background. The red background is not used when the min value is within 80% of the max value.
| dbms | 256us | 1ms | 4ms | 16ms | 64ms | 256ms | 1s | 4s | 16s | gt | max |
|---|---|---|---|---|---|---|---|---|---|---|---|
| pg160_o2_nofp.cx9a2_bee | 99.999 | 0.001 | nonzero | 0.054 | |||||||
| pg16oriole_o2_nofp_patches16_18.cx9a2_bee | 99.876 | 0.077 | 0.046 | nonzero | 0.897 |
Delete response time histogram: each cell has the percentage of responses that take <= the time in the header and max is the max response time in seconds. For the max column values in the top 25% of the range have a red background and in the bottom 25% of the range have a green background. The red background is not used when the min value is within 80% of the max value.
| dbms | 256us | 1ms | 4ms | 16ms | 64ms | 256ms | 1s | 4s | 16s | gt | max |
|---|---|---|---|---|---|---|---|---|---|---|---|
| pg160_o2_nofp.cx9a2_bee | 0.127 | 84.011 | 8.235 | 7.627 | nonzero | 0.020 | |||||
| pg16oriole_o2_nofp_patches16_18.cx9a2_bee | 10.638 | 89.342 | 0.001 | 0.019 | nonzero | 0.884 |
Performance metrics for the DBMS listed above. Some are normalized by throughput, others are not. Legend for results is here.
ips	qps	rps	rmbps	wps	wmbps	rpq	rkbpq	wpi	wkbpi	csps	cpups	cspq	cpupq	dbgb1	dbgb2	rss	maxop	p50	p99	tag
24031	0	0	0.0	69.5	19.3	0.000	0.000	0.003	0.823	11449	23.7	0.476	79	5.1	45.2	5.2	0.054	29279	7841	20m.pg160_o2_nofp.cx9a2_bee
27855	0	2	0.0	1999.4	37.9	0.000	0.001	0.072	1.395	13954	28.7	0.501	82	0.0	65.2	6.6	0.897	28917	21335	20m.pg16oriole_o2_nofp_patches16_18.cx9a2_bee
q100.1
q100.1: range queries with 100 insert/s per client. Graphs for performance per 1-second interval are here.
Average throughput:
Query response time histogram: each cell has the percentage of responses that take <= the time in the header and max is the max response time in seconds. For max values in the top 25% of the range have a red background and in the bottom 25% of the range have a green background. The red background is not used when the min value is within 80% of the max value.
| dbms | 256us | 1ms | 4ms | 16ms | 64ms | 256ms | 1s | 4s | 16s | gt | max |
|---|---|---|---|---|---|---|---|---|---|---|---|
| pg160_o2_nofp.cx9a2_bee | 99.927 | 0.073 | nonzero | nonzero | 0.005 | ||||||
| pg16oriole_o2_nofp_patches16_18.cx9a2_bee | 97.698 | 2.301 | nonzero | nonzero | nonzero | nonzero | nonzero | 0.907 |
Insert response time histogram: each cell has the percentage of responses that take <= the time in the header and max is the max response time in seconds. For max values in the top 25% of the range have a red background and in the bottom 25% of the range have a green background. The red background is not used when the min value is within 80% of the max value.
| dbms | 256us | 1ms | 4ms | 16ms | 64ms | 256ms | 1s | 4s | 16s | gt | max |
|---|---|---|---|---|---|---|---|---|---|---|---|
| pg160_o2_nofp.cx9a2_bee | 99.931 | 0.069 | 0.005 | ||||||||
| pg16oriole_o2_nofp_patches16_18.cx9a2_bee | 99.792 | 0.201 | 0.007 | 0.080 |
Delete response time histogram: each cell has the percentage of responses that take <= the time in the header and max is the max response time in seconds. For max values in the top 25% of the range have a red background and in the bottom 25% of the range have a green background. The red background is not used when the min value is within 80% of the max value.
| dbms | 256us | 1ms | 4ms | 16ms | 64ms | 256ms | 1s | 4s | 16s | gt | max |
|---|---|---|---|---|---|---|---|---|---|---|---|
| pg160_o2_nofp.cx9a2_bee | 0.375 | 74.479 | 25.076 | 0.069 | 0.007 | ||||||
| pg16oriole_o2_nofp_patches16_18.cx9a2_bee | 0.264 | 99.722 | 0.014 | 0.006 |
Performance metrics for the DBMS listed above. Some are normalized by throughput, others are not. Legend for results is here.
ips	qps	rps	rmbps	wps	wmbps	rpq	rkbpq	wpi	wkbpi	csps	cpups	cspq	cpupq	dbgb1	dbgb2	rss	maxop	p50	p99	tag
100	7922	0	0.0	50.3	2.1	0.000	0.000	0.505	21.134	30568	12.7	3.858	128	5.1	42.3	2.9	0.005	7622	7478	20m.pg160_o2_nofp.cx9a2_bee
100	7744	0	0.0	50.6	2.5	0.000	0.000	0.507	25.392	29848	12.7	3.854	131	0.0	27.3	7.2	0.907	7894	4991	20m.pg16oriole_o2_nofp_patches16_18.cx9a2_bee
q500.1
q500.1: range queries with 500 insert/s per client. Graphs for performance per 1-second interval are here.
Average throughput:
Query response time histogram: each cell has the percentage of responses that take <= the time in the header and max is the max response time in seconds. For max values in the top 25% of the range have a red background and in the bottom 25% of the range have a green background. The red background is not used when the min value is within 80% of the max value.
| dbms | 256us | 1ms | 4ms | 16ms | 64ms | 256ms | 1s | 4s | 16s | gt | max |
|---|---|---|---|---|---|---|---|---|---|---|---|
| pg160_o2_nofp.cx9a2_bee | 99.935 | 0.065 | nonzero | nonzero | 0.009 | ||||||
| pg16oriole_o2_nofp_patches16_18.cx9a2_bee | 99.936 | 0.064 | nonzero | nonzero | nonzero | nonzero | 0.068 |
Insert response time histogram: each cell has the percentage of responses that take <= the time in the header and max is the max response time in seconds. For max values in the top 25% of the range have a red background and in the bottom 25% of the range have a green background. The red background is not used when the min value is within 80% of the max value.
| dbms | 256us | 1ms | 4ms | 16ms | 64ms | 256ms | 1s | 4s | 16s | gt | max |
|---|---|---|---|---|---|---|---|---|---|---|---|
| pg160_o2_nofp.cx9a2_bee | 99.974 | 0.025 | 0.001 | 0.022 | |||||||
| pg16oriole_o2_nofp_patches16_18.cx9a2_bee | 99.968 | 0.022 | 0.008 | 0.001 | 0.064 |
Delete response time histogram: each cell has the percentage of responses that take <= the time in the header and max is the max response time in seconds. For max values in the top 25% of the range have a red background and in the bottom 25% of the range have a green background. The red background is not used when the min value is within 80% of the max value.
| dbms | 256us | 1ms | 4ms | 16ms | 64ms | 256ms | 1s | 4s | 16s | gt | max |
|---|---|---|---|---|---|---|---|---|---|---|---|
| pg160_o2_nofp.cx9a2_bee | 5.267 | 76.431 | 18.288 | 0.014 | 0.001 | 0.020 | |||||
| pg16oriole_o2_nofp_patches16_18.cx9a2_bee | 0.483 | 99.513 | 0.001 | 0.003 | 0.049 |
Performance metrics for the DBMS listed above. Some are normalized by throughput, others are not. Legend for results is here.
ips	qps	rps	rmbps	wps	wmbps	rpq	rkbpq	wpi	wkbpi	csps	cpups	cspq	cpupq	dbgb1	dbgb2	rss	maxop	p50	p99	tag
499	8123	0	0.0	36.8	2.9	0.000	0.000	0.074	5.900	31393	12.9	3.865	127	5.1	34.4	1.1	0.009	7720	7559	20m.pg160_o2_nofp.cx9a2_bee
499	8415	0	0.0	82.9	2.8	0.000	0.000	0.166	5.775	32521	12.9	3.864	123	0.0	27.8	7.2	0.068	7877	7687	20m.pg16oriole_o2_nofp_patches16_18.cx9a2_bee
q1000.1
q1000.1: range queries with 1000 insert/s per client. Graphs for performance per 1-second interval are here.
Average throughput:
Query response time histogram: each cell has the percentage of responses that take <= the time in the header and max is the max response time in seconds. For max values in the top 25% of the range have a red background and in the bottom 25% of the range have a green background. The red background is not used when the min value is within 80% of the max value.
| dbms | 256us | 1ms | 4ms | 16ms | 64ms | 256ms | 1s | 4s | 16s | gt | max |
|---|---|---|---|---|---|---|---|---|---|---|---|
| pg160_o2_nofp.cx9a2_bee | 99.936 | 0.064 | nonzero | nonzero | nonzero | 0.019 | |||||
| pg16oriole_o2_nofp_patches16_18.cx9a2_bee | 99.914 | 0.086 | nonzero | nonzero | nonzero | 0.072 |
Insert response time histogram: each cell has the percentage of responses that take <= the time in the header and max is the max response time in seconds. For max values in the top 25% of the range have a red background and in the bottom 25% of the range have a green background. The red background is not used when the min value is within 80% of the max value.
| dbms | 256us | 1ms | 4ms | 16ms | 64ms | 256ms | 1s | 4s | 16s | gt | max |
|---|---|---|---|---|---|---|---|---|---|---|---|
| pg160_o2_nofp.cx9a2_bee | 99.985 | 0.009 | 0.006 | 0.023 | |||||||
| pg16oriole_o2_nofp_patches16_18.cx9a2_bee | 99.973 | 0.018 | 0.008 | 0.001 | 0.083 |
Delete response time histogram: each cell has the percentage of responses that take <= the time in the header and max is the max response time in seconds. For max values in the top 25% of the range have a red background and in the bottom 25% of the range have a green background. The red background is not used when the min value is within 80% of the max value.
| dbms | 256us | 1ms | 4ms | 16ms | 64ms | 256ms | 1s | 4s | 16s | gt | max |
|---|---|---|---|---|---|---|---|---|---|---|---|
| pg160_o2_nofp.cx9a2_bee | 3.530 | 79.550 | 16.913 | 0.003 | 0.004 | 0.021 | |||||
| pg16oriole_o2_nofp_patches16_18.cx9a2_bee | 1.428 | 98.568 | 0.002 | 0.001 | 0.001 | 0.079 |
Performance metrics for the DBMS listed above. Some are normalized by throughput, others are not. Legend for results is here.
ips	qps	rps	rmbps	wps	wmbps	rpq	rkbpq	wpi	wkbpi	csps	cpups	cspq	cpupq	dbgb1	dbgb2	rss	maxop	p50	p99	tag
998	8175	0	0.0	28.5	3.3	0.000	0.000	0.029	3.412	31797	13.6	3.889	133	5.1	25.2	5.2	0.019	7655	7464	20m.pg160_o2_nofp.cx9a2_bee
998	8335	0	0.0	77.7	3.3	0.000	0.000	0.078	3.348	32436	13.9	3.892	133	0.0	28.6	7.2	0.072	7879	7383	20m.pg16oriole_o2_nofp_patches16_18.cx9a2_bee
l.i0
l.i0: load without secondary indexes
Performance metrics for all DBMS, not just the ones listed above. Some are normalized by throughput, others are not. Legend for results is here.
ips	qps	rps	rmbps	wps	wmbps	rpq	rkbpq	wpi	wkbpi	csps	cpups	cspq	cpupq	dbgb1	dbgb2	rss	maxop	p50	p99	tag
72727	0	0	0.0	83.4	30.6	0.000	0.000	0.001	0.431	8920	22.4	0.123	25	1.9	5.2	0.2	0.003	73018	70725	20m.pg160_o2_nofp.cx9a2_bee
70175	0	0	0.0	25.1	8.2	0.000	0.000	0.000	0.119	8113	22.1	0.116	25	0.0	1.2	0.6	0.036	70619	67723	20m.pg16oriole_o2_nofp_patches16_18.cx9a2_bee
l.x
l.x: create secondary indexes
Performance metrics for all DBMS, not just the ones listed above. Some are normalized by throughput, others are not. Legend for results is here.
ips	qps	rps	rmbps	wps	wmbps	rpq	rkbpq	wpi	wkbpi	csps	cpups	cspq	cpupq	dbgb1	dbgb2	rss	maxop	p50	p99	tag
236470	0	0	0.0	98.2	46.1	0.000	0.000	0.000	0.199	711	11.6	0.003	4	3.7	8.6	2.1	0.003	NA	NA	20m.pg160_o2_nofp.cx9a2_bee
157031	0	0	0.0	70.9	34.5	0.000	0.000	0.000	0.225	494	12.1	0.003	6	0.0	3.7	2.3	0.004	NA	NA	20m.pg16oriole_o2_nofp_patches16_18.cx9a2_bee
l.i1
l.i1: continue load after secondary indexes created
Performance metrics for all DBMS, not just the ones listed above. Some are normalized by throughput, others are not. Legend for results is here.
ips	qps	rps	rmbps	wps	wmbps	rpq	rkbpq	wpi	wkbpi	csps	cpups	cspq	cpupq	dbgb1	dbgb2	rss	maxop	p50	p99	tag
24031	0	0	0.0	69.5	19.3	0.000	0.000	0.003	0.823	11449	23.7	0.476	79	5.1	45.2	5.2	0.054	29279	7841	20m.pg160_o2_nofp.cx9a2_bee
27855	0	2	0.0	1999.4	37.9	0.000	0.001	0.072	1.395	13954	28.7	0.501	82	0.0	65.2	6.6	0.897	28917	21335	20m.pg16oriole_o2_nofp_patches16_18.cx9a2_bee
q100.1
q100.1: range queries with 100 insert/s per client
Performance metrics for all DBMS, not just the ones listed above. Some are normalized by throughput, others are not. Legend for results is here.
ips	qps	rps	rmbps	wps	wmbps	rpq	rkbpq	wpi	wkbpi	csps	cpups	cspq	cpupq	dbgb1	dbgb2	rss	maxop	p50	p99	tag
100	7922	0	0.0	50.3	2.1	0.000	0.000	0.505	21.134	30568	12.7	3.858	128	5.1	42.3	2.9	0.005	7622	7478	20m.pg160_o2_nofp.cx9a2_bee
100	7744	0	0.0	50.6	2.5	0.000	0.000	0.507	25.392	29848	12.7	3.854	131	0.0	27.3	7.2	0.907	7894	4991	20m.pg16oriole_o2_nofp_patches16_18.cx9a2_bee
q500.1
q500.1: range queries with 500 insert/s per client
Performance metrics for all DBMS, not just the ones listed above. Some are normalized by throughput, others are not. Legend for results is here.
ips	qps	rps	rmbps	wps	wmbps	rpq	rkbpq	wpi	wkbpi	csps	cpups	cspq	cpupq	dbgb1	dbgb2	rss	maxop	p50	p99	tag
499	8123	0	0.0	36.8	2.9	0.000	0.000	0.074	5.900	31393	12.9	3.865	127	5.1	34.4	1.1	0.009	7720	7559	20m.pg160_o2_nofp.cx9a2_bee
499	8415	0	0.0	82.9	2.8	0.000	0.000	0.166	5.775	32521	12.9	3.864	123	0.0	27.8	7.2	0.068	7877	7687	20m.pg16oriole_o2_nofp_patches16_18.cx9a2_bee
q1000.1
q1000.1: range queries with 1000 insert/s per client
Performance metrics for all DBMS, not just the ones listed above. Some are normalized by throughput, others are not. Legend for results is here.
ips	qps	rps	rmbps	wps	wmbps	rpq	rkbpq	wpi	wkbpi	csps	cpups	cspq	cpupq	dbgb1	dbgb2	rss	maxop	p50	p99	tag
998	8175	0	0.0	28.5	3.3	0.000	0.000	0.029	3.412	31797	13.6	3.889	133	5.1	25.2	5.2	0.019	7655	7464	20m.pg160_o2_nofp.cx9a2_bee
998	8335	0	0.0	77.7	3.3	0.000	0.000	0.078	3.348	32436	13.9	3.892	133	0.0	28.6	7.2	0.072	7879	7383	20m.pg16oriole_o2_nofp_patches16_18.cx9a2_bee
l.i0
- l.i0: load without secondary indexes
- Legend for results is here.
- Each entry lists the percentage of responses that fit in that bucket (slower than max time for previous bucket, faster than min time for next bucket).
Insert response time histogram
256us	1ms	4ms	16ms	64ms	256ms	1s	4s	16s	gt	max	tag
0.000	0.000	100.000	0.000	0.000	0.000	0.000	0.000	0.000	0.000	0.003	pg160_o2_nofp.cx9a2_bee
0.000	0.000	99.972	0.001	0.027	0.000	0.000	0.000	0.000	0.000	0.036	pg16oriole_o2_nofp_patches16_18.cx9a2_bee
l.x
- l.x: create secondary indexes
- Legend for results is here.
- Each entry lists the percentage of responses that fit in that bucket (slower than max time for previous bucket, faster than min time for next bucket).
TODO - determine whether there is data for create index response time
l.i1
- l.i1: continue load after secondary indexes created
- Legend for results is here.
- Each entry lists the percentage of responses that fit in that bucket (slower than max time for previous bucket, faster than min time for next bucket).
Insert response time histogram
256us	1ms	4ms	16ms	64ms	256ms	1s	4s	16s	gt	max	tag
0.000	0.000	99.999	0.001	nonzero	0.000	0.000	0.000	0.000	0.000	0.054	pg160_o2_nofp.cx9a2_bee
0.000	0.000	99.876	0.077	0.046	0.000	nonzero	0.000	0.000	0.000	0.897	pg16oriole_o2_nofp_patches16_18.cx9a2_bee
Delete response time histogram
256us	1ms	4ms	16ms	64ms	256ms	1s	4s	16s	gt	max	tag
0.127	84.011	8.235	7.627	nonzero	0.000	0.000	0.000	0.000	0.000	0.020	pg160_o2_nofp.cx9a2_bee
0.000	10.638	89.342	0.001	0.019	0.000	nonzero	0.000	0.000	0.000	0.884	pg16oriole_o2_nofp_patches16_18.cx9a2_bee
q100.1
- q100.1: range queries with 100 insert/s per client
- Legend for results is here.
- Each entry lists the percentage of responses that fit in that bucket (slower than max time for previous bucket, faster than min time for next bucket).
Query response time histogram
256us	1ms	4ms	16ms	64ms	256ms	1s	4s	16s	gt	max	tag
99.927	0.073	nonzero	nonzero	0.000	0.000	0.000	0.000	0.000	0.000	0.005	pg160_o2_nofp.cx9a2_bee
97.698	2.301	nonzero	nonzero	nonzero	nonzero	nonzero	0.000	0.000	0.000	0.907	pg16oriole_o2_nofp_patches16_18.cx9a2_bee
Insert response time histogram
256us	1ms	4ms	16ms	64ms	256ms	1s	4s	16s	gt	max	tag
0.000	0.000	99.931	0.069	0.000	0.000	0.000	0.000	0.000	0.000	0.005	pg160_o2_nofp.cx9a2_bee
0.000	0.000	99.792	0.201	0.000	0.007	0.000	0.000	0.000	0.000	0.080	pg16oriole_o2_nofp_patches16_18.cx9a2_bee
Delete response time histogram
256us	1ms	4ms	16ms	64ms	256ms	1s	4s	16s	gt	max	tag
0.375	74.479	25.076	0.069	0.000	0.000	0.000	0.000	0.000	0.000	0.007	pg160_o2_nofp.cx9a2_bee
0.000	0.264	99.722	0.014	0.000	0.000	0.000	0.000	0.000	0.000	0.006	pg16oriole_o2_nofp_patches16_18.cx9a2_bee
q500.1
- q500.1: range queries with 500 insert/s per client
- Legend for results is here.
- Each entry lists the percentage of responses that fit in that bucket (slower than max time for previous bucket, faster than min time for next bucket).
Query response time histogram
256us	1ms	4ms	16ms	64ms	256ms	1s	4s	16s	gt	max	tag
99.935	0.065	nonzero	nonzero	0.000	0.000	0.000	0.000	0.000	0.000	0.009	pg160_o2_nofp.cx9a2_bee
99.936	0.064	nonzero	nonzero	nonzero	nonzero	0.000	0.000	0.000	0.000	0.068	pg16oriole_o2_nofp_patches16_18.cx9a2_bee
Insert response time histogram
256us	1ms	4ms	16ms	64ms	256ms	1s	4s	16s	gt	max	tag
0.000	0.000	99.974	0.025	0.001	0.000	0.000	0.000	0.000	0.000	0.022	pg160_o2_nofp.cx9a2_bee
0.000	0.000	99.968	0.022	0.008	0.001	0.000	0.000	0.000	0.000	0.064	pg16oriole_o2_nofp_patches16_18.cx9a2_bee
Delete response time histogram
256us	1ms	4ms	16ms	64ms	256ms	1s	4s	16s	gt	max	tag
5.267	76.431	18.288	0.014	0.001	0.000	0.000	0.000	0.000	0.000	0.020	pg160_o2_nofp.cx9a2_bee
0.000	0.483	99.513	0.001	0.003	0.000	0.000	0.000	0.000	0.000	0.049	pg16oriole_o2_nofp_patches16_18.cx9a2_bee
q1000.1
- q1000.1: range queries with 1000 insert/s per client
- Legend for results is here.
- Each entry lists the percentage of responses that fit in that bucket (slower than max time for previous bucket, faster than min time for next bucket).
Query response time histogram
256us	1ms	4ms	16ms	64ms	256ms	1s	4s	16s	gt	max	tag
99.936	0.064	nonzero	nonzero	nonzero	0.000	0.000	0.000	0.000	0.000	0.019	pg160_o2_nofp.cx9a2_bee
99.914	0.086	nonzero	0.000	nonzero	nonzero	0.000	0.000	0.000	0.000	0.072	pg16oriole_o2_nofp_patches16_18.cx9a2_bee
Insert response time histogram
256us	1ms	4ms	16ms	64ms	256ms	1s	4s	16s	gt	max	tag
0.000	0.000	99.985	0.009	0.006	0.000	0.000	0.000	0.000	0.000	0.023	pg160_o2_nofp.cx9a2_bee
0.000	0.000	99.973	0.018	0.008	0.001	0.000	0.000	0.000	0.000	0.083	pg16oriole_o2_nofp_patches16_18.cx9a2_bee
Delete response time histogram
256us	1ms	4ms	16ms	64ms	256ms	1s	4s	16s	gt	max	tag
3.530	79.550	16.913	0.003	0.004	0.000	0.000	0.000	0.000	0.000	0.021	pg160_o2_nofp.cx9a2_bee
0.000	1.428	98.568	0.002	0.001	0.001	0.000	0.000	0.000	0.000	0.079	pg16oriole_o2_nofp_patches16_18.cx9a2_bee