Introduction
This is a report for the insert benchmark with 800M docs and 1 client(s). It is generated by scripts (bash, awk, sed) and Tufte might not be impressed. An overview of the insert benchmark is here and a short update is here. Below, by DBMS, I mean DBMS+version.config. An example is my8020.c10b40 where my means MySQL, 8020 is version 8.0.20 and c10b40 is the name for the configuration file.
The test server has 8 AMD cores, 16G RAM and an NVMe SSD. It is described here as the Beelink. The benchmark was run with 1 client and there were 1 or 3 connections per client (1 for queries or inserts without rate limits, 1+1 for rate limited inserts+deletes). There is 1 table. It loads 800M rows without secondary indexes, creates secondary indexes, then inserts 5M rows with a delete per insert to avoid growing the table. It then does 3 read+write tests for 1200s each that do queries as fast as possible with 100, 500 and then 1000 inserts/second/client concurrent with the queries and 1000 deletes/second to avoid growing the table. The database is larger than memory.
The tested DBMS are:
- my5621_rel.cy10a_bee - InnoDB and MySQL 5.6.21, rel build, cy10a_bee config, compiled with CMAKE_BUILD_TYPE=Release, base config
my5641_rel.cy10a_bee - InnoDB and MySQL 5.6.41, rel build, cy10a_bee config, compiled with CMAKE_BUILD_TYPE=Release, base config - my5651_rel.cy10a_bee - InnoDB and MySQL 5.6.51, rel build, cy10a_bee config, compiled with CMAKE_BUILD_TYPE=Release, base config
Contents
- Summary
- l.i0: load without secondary indexes
- l.x: create secondary indexes
- l.i1: continue load after secondary indexes created
- q100.1: range queries with 100 insert/s per client
- q500.1: range queries with 500 insert/s per client
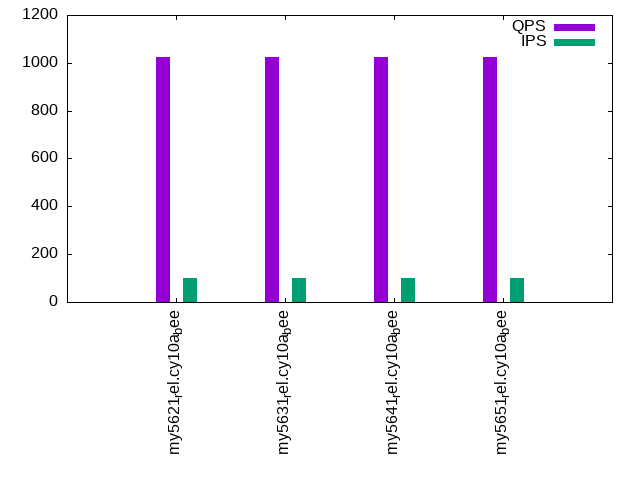
- q1000.1: range queries with 1000 insert/s per client
Summary
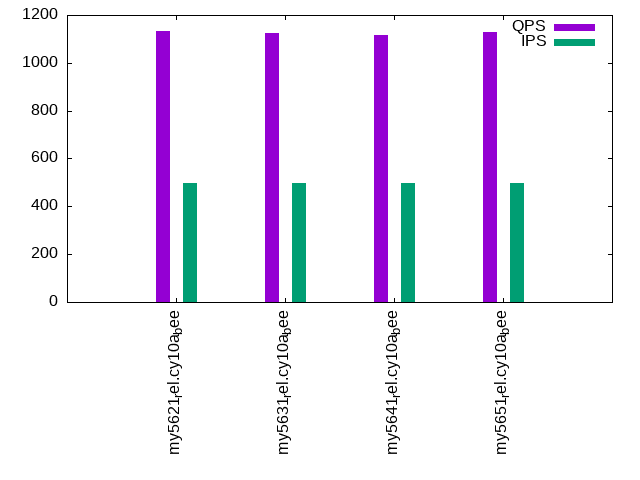
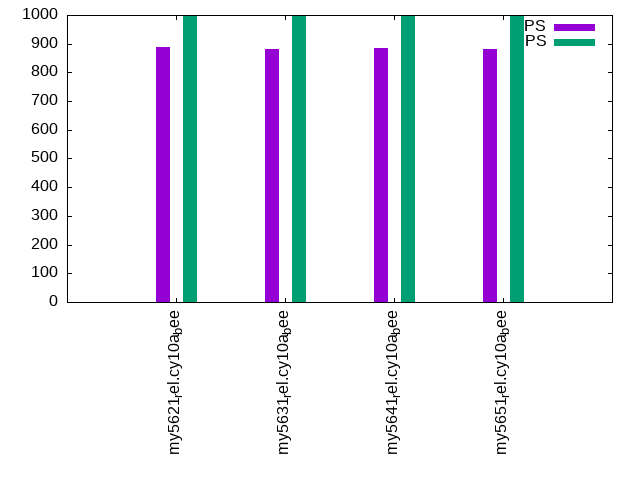
The numbers are inserts/s for l.i0 and l.i1, indexed docs (or rows) /s for l.x and queries/s for q100, q500, q1000. The values are the average rate over the entire test for inserts (IPS) and queries (QPS). The range of values for IPS and QPS is split into 3 parts: bottom 25%, middle 50%, top 25%. Values in the bottom 25% have a red background, values in the top 25% have a green background and values in the middle have no color. A gray background is used for values that can be ignored because the DBMS did not sustain the target insert rate. Red backgrounds are not used when the minimum value is within 80% of the max value.
| dbms | l.i0 | l.x | l.i1 | q100.1 | q500.1 | q1000.1 |
|---|---|---|---|---|---|---|
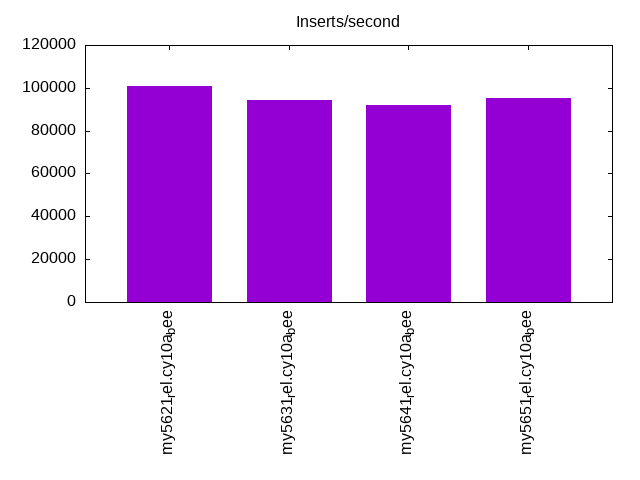
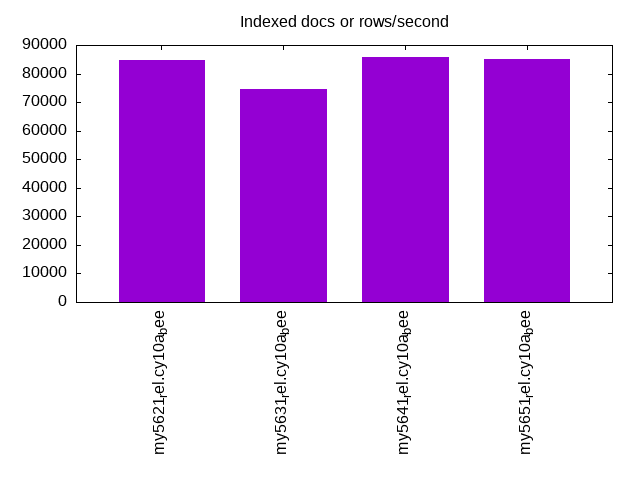
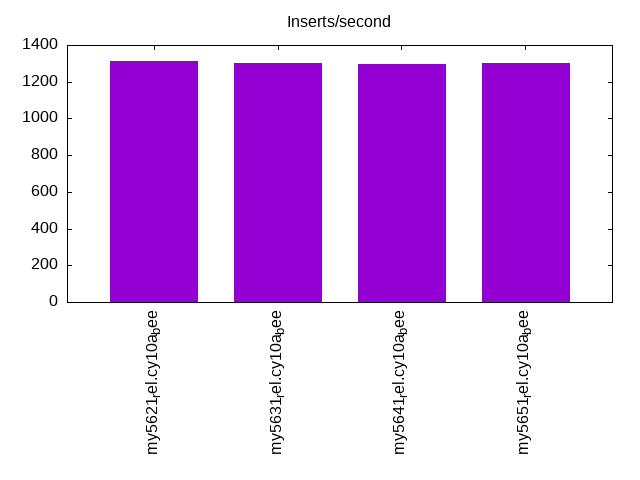
| my5621_rel.cy10a_bee | 101087 | 84918 | 1315 | 1024 | 1132 | 888 |
| my5631_rel.cy10a_bee | 94206 | 74553 | 1300 | 1024 | 1124 | 883 |
| my5641_rel.cy10a_bee | 92049 | 85931 | 1296 | 1024 | 1118 | 886 |
| my5651_rel.cy10a_bee | 95181 | 85226 | 1304 | 1026 | 1127 | 880 |
This table has relative throughput, throughput for the DBMS relative to the DBMS in the first line, using the absolute throughput from the previous table. Values less than 0.95 have a yellow background. Values greater than 1.05 have a blue background.
| dbms | l.i0 | l.x | l.i1 | q100.1 | q500.1 | q1000.1 |
|---|---|---|---|---|---|---|
| my5621_rel.cy10a_bee | 1.00 | 1.00 | 1.00 | 1.00 | 1.00 | 1.00 |
| my5631_rel.cy10a_bee | 0.93 | 0.88 | 0.99 | 1.00 | 0.99 | 0.99 |
| my5641_rel.cy10a_bee | 0.91 | 1.01 | 0.99 | 1.00 | 0.99 | 1.00 |
| my5651_rel.cy10a_bee | 0.94 | 1.00 | 0.99 | 1.00 | 1.00 | 0.99 |
This lists the average rate of inserts/s for the tests that do inserts concurrent with queries. For such tests the query rate is listed in the table above. The read+write tests are setup so that the insert rate should match the target rate every second. Cells that are not at least 95% of the target have a red background to indicate a failure to satisfy the target.
| dbms | q100.1 | q500.1 | q1000.1 |
|---|---|---|---|
| my5621_rel.cy10a_bee | 100 | 499 | 998 |
| my5631_rel.cy10a_bee | 100 | 499 | 998 |
| my5641_rel.cy10a_bee | 100 | 498 | 998 |
| my5651_rel.cy10a_bee | 100 | 499 | 998 |
| target | 100 | 500 | 1000 |
l.i0
l.i0: load without secondary indexes. Graphs for performance per 1-second interval are here.
Average throughput:
Insert response time histogram: each cell has the percentage of responses that take <= the time in the header and max is the max response time in seconds. For the max column values in the top 25% of the range have a red background and in the bottom 25% of the range have a green background. The red background is not used when the min value is within 80% of the max value.
| dbms | 256us | 1ms | 4ms | 16ms | 64ms | 256ms | 1s | 4s | 16s | gt | max |
|---|---|---|---|---|---|---|---|---|---|---|---|
| my5621_rel.cy10a_bee | 92.981 | 6.891 | 0.107 | 0.017 | 0.004 | 0.176 | |||||
| my5631_rel.cy10a_bee | 79.019 | 20.837 | 0.071 | 0.070 | 0.004 | 0.230 | |||||
| my5641_rel.cy10a_bee | 62.595 | 37.260 | 0.075 | 0.065 | 0.004 | 0.212 | |||||
| my5651_rel.cy10a_bee | 83.653 | 16.205 | 0.069 | 0.070 | 0.004 | 0.246 |
Performance metrics for the DBMS listed above. Some are normalized by throughput, others are not. Legend for results is here.
ips	qps	rps	rmbps	wps	wmbps	rpq	rkbpq	wpi	wkbpi	csps	cpups	cspq	cpupq	dbgb1	dbgb2	rss	maxop	p50	p99	tag
101087	0	886	3.5	491.7	36.1	0.009	0.035	0.005	0.366	12846	21.8	0.127	17	52.6	93.1	10.6	0.176	101587	85053	800m.my5621_rel.cy10a_bee
94206	0	825	3.2	455.9	33.6	0.009	0.035	0.005	0.366	11965	21.5	0.127	18	52.6	93.1	10.6	0.230	94622	77310	800m.my5631_rel.cy10a_bee
92049	0	806	3.1	447.2	32.9	0.009	0.035	0.005	0.366	11754	21.4	0.128	19	52.6	93.1	10.6	0.212	92501	75713	800m.my5641_rel.cy10a_bee
95181	0	834	3.3	461.3	34.0	0.009	0.035	0.005	0.366	12099	21.5	0.127	18	52.6	93.1	10.6	0.246	95630	77190	800m.my5651_rel.cy10a_bee
l.x
l.x: create secondary indexes.
Average throughput:
Performance metrics for the DBMS listed above. Some are normalized by throughput, others are not. Legend for results is here.
ips	qps	rps	rmbps	wps	wmbps	rpq	rkbpq	wpi	wkbpi	csps	cpups	cspq	cpupq	dbgb1	dbgb2	rss	maxop	p50	p99	tag
84918	0	559	80.9	699.7	102.5	0.007	0.975	0.008	1.236	1963	11.3	0.023	11	108.4	148.9	10.8	0.015	NA	NA	800m.my5621_rel.cy10a_bee
74553	0	484	71.1	609.6	90.1	0.006	0.976	0.008	1.237	1781	11.2	0.024	12	108.4	148.9	10.8	0.016	NA	NA	800m.my5631_rel.cy10a_bee
85931	0	566	82.0	701.5	103.7	0.007	0.977	0.008	1.236	1926	11.4	0.022	11	108.4	148.9	10.8	0.010	NA	NA	800m.my5641_rel.cy10a_bee
85226	0	559	81.2	701.0	102.9	0.007	0.976	0.008	1.236	1939	11.2	0.023	11	108.4	148.9	10.8	0.011	NA	NA	800m.my5651_rel.cy10a_bee
l.i1
l.i1: continue load after secondary indexes created. Graphs for performance per 1-second interval are here.
Average throughput:
Insert response time histogram: each cell has the percentage of responses that take <= the time in the header and max is the max response time in seconds. For the max column values in the top 25% of the range have a red background and in the bottom 25% of the range have a green background. The red background is not used when the min value is within 80% of the max value.
| dbms | 256us | 1ms | 4ms | 16ms | 64ms | 256ms | 1s | 4s | 16s | gt | max |
|---|---|---|---|---|---|---|---|---|---|---|---|
| my5621_rel.cy10a_bee | 1.828 | 87.643 | 10.527 | 0.002 | 0.873 | ||||||
| my5631_rel.cy10a_bee | 1.481 | 87.369 | 11.142 | 0.008 | 0.812 | ||||||
| my5641_rel.cy10a_bee | 1.633 | 87.319 | 11.041 | 0.007 | 0.822 | ||||||
| my5651_rel.cy10a_bee | 1.815 | 87.164 | 11.016 | 0.005 | 0.777 |
Delete response time histogram: each cell has the percentage of responses that take <= the time in the header and max is the max response time in seconds. For the max column values in the top 25% of the range have a red background and in the bottom 25% of the range have a green background. The red background is not used when the min value is within 80% of the max value.
| dbms | 256us | 1ms | 4ms | 16ms | 64ms | 256ms | 1s | 4s | 16s | gt | max |
|---|---|---|---|---|---|---|---|---|---|---|---|
| my5621_rel.cy10a_bee | 2.951 | 91.090 | 5.955 | 0.003 | 0.001 | 0.733 | |||||
| my5631_rel.cy10a_bee | 3.075 | 90.934 | 5.979 | 0.011 | 0.001 | 0.592 | |||||
| my5641_rel.cy10a_bee | 2.861 | 91.264 | 5.868 | 0.006 | 0.001 | 0.657 | |||||
| my5651_rel.cy10a_bee | 3.295 | 90.845 | 5.853 | 0.006 | 0.001 | 0.598 |
Performance metrics for the DBMS listed above. Some are normalized by throughput, others are not. Legend for results is here.
ips	qps	rps	rmbps	wps	wmbps	rpq	rkbpq	wpi	wkbpi	csps	cpups	cspq	cpupq	dbgb1	dbgb2	rss	maxop	p50	p99	tag
1315	0	7588	118.0	9832.8	315.7	5.771	91.885	7.479	245.927	46337	14.7	35.245	894	146.1	186.7	10.5	0.873	1249	699	800m.my5621_rel.cy10a_bee
1300	0	7527	117.0	9755.4	313.2	5.790	92.185	7.504	246.743	45775	14.6	35.212	898	146.0	186.7	10.5	0.812	1249	690	800m.my5631_rel.cy10a_bee
1296	0	7512	116.8	9819.6	312.6	5.795	92.268	7.575	246.896	45936	14.7	35.436	907	146.0	186.6	10.5	0.822	1249	697	800m.my5641_rel.cy10a_bee
1304	0	7551	117.4	9869.9	314.1	5.790	92.183	7.568	246.645	45958	14.7	35.242	902	146.0	186.7	10.5	0.777	1249	649	800m.my5651_rel.cy10a_bee
q100.1
q100.1: range queries with 100 insert/s per client. Graphs for performance per 1-second interval are here.
Average throughput:
Query response time histogram: each cell has the percentage of responses that take <= the time in the header and max is the max response time in seconds. For max values in the top 25% of the range have a red background and in the bottom 25% of the range have a green background. The red background is not used when the min value is within 80% of the max value.
| dbms | 256us | 1ms | 4ms | 16ms | 64ms | 256ms | 1s | 4s | 16s | gt | max |
|---|---|---|---|---|---|---|---|---|---|---|---|
| my5621_rel.cy10a_bee | 28.918 | 16.794 | 52.799 | 1.480 | 0.009 | 0.048 | |||||
| my5631_rel.cy10a_bee | 28.670 | 16.965 | 52.839 | 1.517 | 0.009 | 0.040 | |||||
| my5641_rel.cy10a_bee | 28.123 | 17.609 | 52.727 | 1.532 | 0.009 | 0.047 | |||||
| my5651_rel.cy10a_bee | 28.636 | 17.047 | 52.782 | 1.527 | 0.009 | 0.048 |
Insert response time histogram: each cell has the percentage of responses that take <= the time in the header and max is the max response time in seconds. For max values in the top 25% of the range have a red background and in the bottom 25% of the range have a green background. The red background is not used when the min value is within 80% of the max value.
| dbms | 256us | 1ms | 4ms | 16ms | 64ms | 256ms | 1s | 4s | 16s | gt | max |
|---|---|---|---|---|---|---|---|---|---|---|---|
| my5621_rel.cy10a_bee | 0.917 | 78.708 | 20.375 | 0.125 | |||||||
| my5631_rel.cy10a_bee | 2.083 | 58.833 | 39.083 | 0.132 | |||||||
| my5641_rel.cy10a_bee | 1.000 | 72.375 | 26.625 | 0.141 | |||||||
| my5651_rel.cy10a_bee | 2.708 | 60.875 | 36.417 | 0.125 |
Delete response time histogram: each cell has the percentage of responses that take <= the time in the header and max is the max response time in seconds. For max values in the top 25% of the range have a red background and in the bottom 25% of the range have a green background. The red background is not used when the min value is within 80% of the max value.
| dbms | 256us | 1ms | 4ms | 16ms | 64ms | 256ms | 1s | 4s | 16s | gt | max |
|---|---|---|---|---|---|---|---|---|---|---|---|
| my5621_rel.cy10a_bee | 9.542 | 68.542 | 21.917 | 0.060 | |||||||
| my5631_rel.cy10a_bee | 9.250 | 68.917 | 21.833 | 0.057 | |||||||
| my5641_rel.cy10a_bee | 10.917 | 64.208 | 24.875 | 0.054 | |||||||
| my5651_rel.cy10a_bee | 11.167 | 67.708 | 21.125 | 0.052 |
Performance metrics for the DBMS listed above. Some are normalized by throughput, others are not. Legend for results is here.
ips	qps	rps	rmbps	wps	wmbps	rpq	rkbpq	wpi	wkbpi	csps	cpups	cspq	cpupq	dbgb1	dbgb2	rss	maxop	p50	p99	tag
100	1024	9884	154.4	5678.3	174.8	9.649	154.317	56.897	1793.718	39389	10.6	38.451	828	146.1	186.7	10.5	0.048	927	751	800m.my5621_rel.cy10a_bee
100	1024	9852	153.9	5638.3	173.4	9.617	153.814	56.553	1781.168	39188	10.6	38.255	828	146.0	186.7	10.5	0.040	927	735	800m.my5631_rel.cy10a_bee
100	1024	9829	153.5	5678.2	173.1	9.598	153.505	57.010	1779.154	39312	10.6	38.391	828	146.0	186.6	10.5	0.047	927	750	800m.my5641_rel.cy10a_bee
100	1026	9823	153.4	5659.0	172.6	9.574	153.116	56.704	1771.365	39216	10.5	38.222	819	146.0	186.7	10.5	0.048	911	751	800m.my5651_rel.cy10a_bee
q500.1
q500.1: range queries with 500 insert/s per client. Graphs for performance per 1-second interval are here.
Average throughput:
Query response time histogram: each cell has the percentage of responses that take <= the time in the header and max is the max response time in seconds. For max values in the top 25% of the range have a red background and in the bottom 25% of the range have a green background. The red background is not used when the min value is within 80% of the max value.
| dbms | 256us | 1ms | 4ms | 16ms | 64ms | 256ms | 1s | 4s | 16s | gt | max |
|---|---|---|---|---|---|---|---|---|---|---|---|
| my5621_rel.cy10a_bee | 32.561 | 15.008 | 51.658 | 0.768 | 0.004 | 0.040 | |||||
| my5631_rel.cy10a_bee | 31.724 | 15.636 | 51.915 | 0.721 | 0.005 | nonzero | 0.067 | ||||
| my5641_rel.cy10a_bee | 31.912 | 15.407 | 51.821 | 0.855 | 0.005 | 0.045 | |||||
| my5651_rel.cy10a_bee | 32.191 | 15.226 | 51.790 | 0.789 | 0.004 | 0.042 |
Insert response time histogram: each cell has the percentage of responses that take <= the time in the header and max is the max response time in seconds. For max values in the top 25% of the range have a red background and in the bottom 25% of the range have a green background. The red background is not used when the min value is within 80% of the max value.
| dbms | 256us | 1ms | 4ms | 16ms | 64ms | 256ms | 1s | 4s | 16s | gt | max |
|---|---|---|---|---|---|---|---|---|---|---|---|
| my5621_rel.cy10a_bee | 1.625 | 94.658 | 3.717 | 0.112 | |||||||
| my5631_rel.cy10a_bee | 1.283 | 96.033 | 2.683 | 0.113 | |||||||
| my5641_rel.cy10a_bee | 0.975 | 93.633 | 5.392 | 0.152 | |||||||
| my5651_rel.cy10a_bee | 1.275 | 94.208 | 4.517 | 0.127 |
Delete response time histogram: each cell has the percentage of responses that take <= the time in the header and max is the max response time in seconds. For max values in the top 25% of the range have a red background and in the bottom 25% of the range have a green background. The red background is not used when the min value is within 80% of the max value.
| dbms | 256us | 1ms | 4ms | 16ms | 64ms | 256ms | 1s | 4s | 16s | gt | max |
|---|---|---|---|---|---|---|---|---|---|---|---|
| my5621_rel.cy10a_bee | 14.617 | 80.033 | 5.342 | 0.008 | 0.071 | ||||||
| my5631_rel.cy10a_bee | 13.642 | 81.308 | 5.033 | 0.017 | 0.074 | ||||||
| my5641_rel.cy10a_bee | 14.233 | 79.908 | 5.858 | 0.055 | |||||||
| my5651_rel.cy10a_bee | 15.250 | 79.033 | 5.700 | 0.017 | 0.087 |
Performance metrics for the DBMS listed above. Some are normalized by throughput, others are not. Legend for results is here.
ips	qps	rps	rmbps	wps	wmbps	rpq	rkbpq	wpi	wkbpi	csps	cpups	cspq	cpupq	dbgb1	dbgb2	rss	maxop	p50	p99	tag
499	1132	9376	146.3	4071.5	125.5	8.279	132.264	8.164	257.719	34456	10.4	30.425	735	146.1	186.7	10.5	0.040	1135	1054	800m.my5621_rel.cy10a_bee
499	1124	9345	145.8	4062.7	125.2	8.311	132.783	8.147	257.132	34210	10.4	30.425	740	146.0	186.7	10.5	0.067	1119	1055	800m.my5631_rel.cy10a_bee
498	1118	9317	145.4	4108.6	125.3	8.333	133.129	8.245	257.564	34294	10.4	30.671	744	146.0	186.6	10.5	0.045	1119	447	800m.my5641_rel.cy10a_bee
499	1127	9338	145.7	4104.8	125.2	8.288	132.405	8.224	256.931	34312	10.4	30.451	738	146.0	186.7	10.5	0.042	1119	1055	800m.my5651_rel.cy10a_bee
q1000.1
q1000.1: range queries with 1000 insert/s per client. Graphs for performance per 1-second interval are here.
Average throughput:
Query response time histogram: each cell has the percentage of responses that take <= the time in the header and max is the max response time in seconds. For max values in the top 25% of the range have a red background and in the bottom 25% of the range have a green background. The red background is not used when the min value is within 80% of the max value.
| dbms | 256us | 1ms | 4ms | 16ms | 64ms | 256ms | 1s | 4s | 16s | gt | max |
|---|---|---|---|---|---|---|---|---|---|---|---|
| my5621_rel.cy10a_bee | 22.007 | 18.855 | 56.819 | 2.309 | 0.011 | 0.044 | |||||
| my5631_rel.cy10a_bee | 20.569 | 20.185 | 56.805 | 2.429 | 0.012 | 0.047 | |||||
| my5641_rel.cy10a_bee | 20.621 | 20.113 | 57.036 | 2.218 | 0.012 | nonzero | 0.066 | ||||
| my5651_rel.cy10a_bee | 20.336 | 20.390 | 56.918 | 2.344 | 0.011 | 0.044 |
Insert response time histogram: each cell has the percentage of responses that take <= the time in the header and max is the max response time in seconds. For max values in the top 25% of the range have a red background and in the bottom 25% of the range have a green background. The red background is not used when the min value is within 80% of the max value.
| dbms | 256us | 1ms | 4ms | 16ms | 64ms | 256ms | 1s | 4s | 16s | gt | max |
|---|---|---|---|---|---|---|---|---|---|---|---|
| my5621_rel.cy10a_bee | 12.858 | 80.308 | 6.833 | 0.129 | |||||||
| my5631_rel.cy10a_bee | 11.213 | 80.837 | 7.950 | 0.136 | |||||||
| my5641_rel.cy10a_bee | 10.350 | 82.721 | 6.929 | 0.138 | |||||||
| my5651_rel.cy10a_bee | 12.304 | 81.117 | 6.579 | 0.131 |
Delete response time histogram: each cell has the percentage of responses that take <= the time in the header and max is the max response time in seconds. For max values in the top 25% of the range have a red background and in the bottom 25% of the range have a green background. The red background is not used when the min value is within 80% of the max value.
| dbms | 256us | 1ms | 4ms | 16ms | 64ms | 256ms | 1s | 4s | 16s | gt | max |
|---|---|---|---|---|---|---|---|---|---|---|---|
| my5621_rel.cy10a_bee | 7.025 | 89.154 | 3.821 | 0.060 | |||||||
| my5631_rel.cy10a_bee | 6.217 | 89.608 | 4.175 | 0.057 | |||||||
| my5641_rel.cy10a_bee | 6.058 | 89.921 | 4.017 | 0.004 | 0.077 | ||||||
| my5651_rel.cy10a_bee | 7.037 | 89.079 | 3.883 | 0.052 |
Performance metrics for the DBMS listed above. Some are normalized by throughput, others are not. Legend for results is here.
ips	qps	rps	rmbps	wps	wmbps	rpq	rkbpq	wpi	wkbpi	csps	cpups	cspq	cpupq	dbgb1	dbgb2	rss	maxop	p50	p99	tag
998	888	11453	178.5	7526.3	232.2	12.905	205.988	7.545	238.369	49378	15.6	55.637	1406	146.1	186.7	10.5	0.044	880	800	800m.my5621_rel.cy10a_bee
998	883	11419	178.0	7516.8	231.9	12.929	206.375	7.536	238.032	49140	15.7	55.638	1422	146.0	186.7	10.5	0.047	879	815	800m.my5631_rel.cy10a_bee
998	886	11439	178.3	7592.8	232.1	12.916	206.161	7.612	238.219	49319	15.7	55.683	1418	146.0	186.6	10.5	0.066	879	815	800m.my5641_rel.cy10a_bee
998	880	11408	177.8	7588.3	231.9	12.958	206.836	7.601	237.898	49126	15.5	55.800	1408	146.0	186.7	10.5	0.044	879	815	800m.my5651_rel.cy10a_bee
l.i0
l.i0: load without secondary indexes
Performance metrics for all DBMS, not just the ones listed above. Some are normalized by throughput, others are not. Legend for results is here.
ips	qps	rps	rmbps	wps	wmbps	rpq	rkbpq	wpi	wkbpi	csps	cpups	cspq	cpupq	dbgb1	dbgb2	rss	maxop	p50	p99	tag
101087	0	886	3.5	491.7	36.1	0.009	0.035	0.005	0.366	12846	21.8	0.127	17	52.6	93.1	10.6	0.176	101587	85053	800m.my5621_rel.cy10a_bee
94206	0	825	3.2	455.9	33.6	0.009	0.035	0.005	0.366	11965	21.5	0.127	18	52.6	93.1	10.6	0.230	94622	77310	800m.my5631_rel.cy10a_bee
92049	0	806	3.1	447.2	32.9	0.009	0.035	0.005	0.366	11754	21.4	0.128	19	52.6	93.1	10.6	0.212	92501	75713	800m.my5641_rel.cy10a_bee
95181	0	834	3.3	461.3	34.0	0.009	0.035	0.005	0.366	12099	21.5	0.127	18	52.6	93.1	10.6	0.246	95630	77190	800m.my5651_rel.cy10a_bee
l.x
l.x: create secondary indexes
Performance metrics for all DBMS, not just the ones listed above. Some are normalized by throughput, others are not. Legend for results is here.
ips	qps	rps	rmbps	wps	wmbps	rpq	rkbpq	wpi	wkbpi	csps	cpups	cspq	cpupq	dbgb1	dbgb2	rss	maxop	p50	p99	tag
84918	0	559	80.9	699.7	102.5	0.007	0.975	0.008	1.236	1963	11.3	0.023	11	108.4	148.9	10.8	0.015	NA	NA	800m.my5621_rel.cy10a_bee
74553	0	484	71.1	609.6	90.1	0.006	0.976	0.008	1.237	1781	11.2	0.024	12	108.4	148.9	10.8	0.016	NA	NA	800m.my5631_rel.cy10a_bee
85931	0	566	82.0	701.5	103.7	0.007	0.977	0.008	1.236	1926	11.4	0.022	11	108.4	148.9	10.8	0.010	NA	NA	800m.my5641_rel.cy10a_bee
85226	0	559	81.2	701.0	102.9	0.007	0.976	0.008	1.236	1939	11.2	0.023	11	108.4	148.9	10.8	0.011	NA	NA	800m.my5651_rel.cy10a_bee
l.i1
l.i1: continue load after secondary indexes created
Performance metrics for all DBMS, not just the ones listed above. Some are normalized by throughput, others are not. Legend for results is here.
ips	qps	rps	rmbps	wps	wmbps	rpq	rkbpq	wpi	wkbpi	csps	cpups	cspq	cpupq	dbgb1	dbgb2	rss	maxop	p50	p99	tag
1315	0	7588	118.0	9832.8	315.7	5.771	91.885	7.479	245.927	46337	14.7	35.245	894	146.1	186.7	10.5	0.873	1249	699	800m.my5621_rel.cy10a_bee
1300	0	7527	117.0	9755.4	313.2	5.790	92.185	7.504	246.743	45775	14.6	35.212	898	146.0	186.7	10.5	0.812	1249	690	800m.my5631_rel.cy10a_bee
1296	0	7512	116.8	9819.6	312.6	5.795	92.268	7.575	246.896	45936	14.7	35.436	907	146.0	186.6	10.5	0.822	1249	697	800m.my5641_rel.cy10a_bee
1304	0	7551	117.4	9869.9	314.1	5.790	92.183	7.568	246.645	45958	14.7	35.242	902	146.0	186.7	10.5	0.777	1249	649	800m.my5651_rel.cy10a_bee
q100.1
q100.1: range queries with 100 insert/s per client
Performance metrics for all DBMS, not just the ones listed above. Some are normalized by throughput, others are not. Legend for results is here.
ips	qps	rps	rmbps	wps	wmbps	rpq	rkbpq	wpi	wkbpi	csps	cpups	cspq	cpupq	dbgb1	dbgb2	rss	maxop	p50	p99	tag
100	1024	9884	154.4	5678.3	174.8	9.649	154.317	56.897	1793.718	39389	10.6	38.451	828	146.1	186.7	10.5	0.048	927	751	800m.my5621_rel.cy10a_bee
100	1024	9852	153.9	5638.3	173.4	9.617	153.814	56.553	1781.168	39188	10.6	38.255	828	146.0	186.7	10.5	0.040	927	735	800m.my5631_rel.cy10a_bee
100	1024	9829	153.5	5678.2	173.1	9.598	153.505	57.010	1779.154	39312	10.6	38.391	828	146.0	186.6	10.5	0.047	927	750	800m.my5641_rel.cy10a_bee
100	1026	9823	153.4	5659.0	172.6	9.574	153.116	56.704	1771.365	39216	10.5	38.222	819	146.0	186.7	10.5	0.048	911	751	800m.my5651_rel.cy10a_bee
q500.1
q500.1: range queries with 500 insert/s per client
Performance metrics for all DBMS, not just the ones listed above. Some are normalized by throughput, others are not. Legend for results is here.
ips	qps	rps	rmbps	wps	wmbps	rpq	rkbpq	wpi	wkbpi	csps	cpups	cspq	cpupq	dbgb1	dbgb2	rss	maxop	p50	p99	tag
499	1132	9376	146.3	4071.5	125.5	8.279	132.264	8.164	257.719	34456	10.4	30.425	735	146.1	186.7	10.5	0.040	1135	1054	800m.my5621_rel.cy10a_bee
499	1124	9345	145.8	4062.7	125.2	8.311	132.783	8.147	257.132	34210	10.4	30.425	740	146.0	186.7	10.5	0.067	1119	1055	800m.my5631_rel.cy10a_bee
498	1118	9317	145.4	4108.6	125.3	8.333	133.129	8.245	257.564	34294	10.4	30.671	744	146.0	186.6	10.5	0.045	1119	447	800m.my5641_rel.cy10a_bee
499	1127	9338	145.7	4104.8	125.2	8.288	132.405	8.224	256.931	34312	10.4	30.451	738	146.0	186.7	10.5	0.042	1119	1055	800m.my5651_rel.cy10a_bee
q1000.1
q1000.1: range queries with 1000 insert/s per client
Performance metrics for all DBMS, not just the ones listed above. Some are normalized by throughput, others are not. Legend for results is here.
ips	qps	rps	rmbps	wps	wmbps	rpq	rkbpq	wpi	wkbpi	csps	cpups	cspq	cpupq	dbgb1	dbgb2	rss	maxop	p50	p99	tag
998	888	11453	178.5	7526.3	232.2	12.905	205.988	7.545	238.369	49378	15.6	55.637	1406	146.1	186.7	10.5	0.044	880	800	800m.my5621_rel.cy10a_bee
998	883	11419	178.0	7516.8	231.9	12.929	206.375	7.536	238.032	49140	15.7	55.638	1422	146.0	186.7	10.5	0.047	879	815	800m.my5631_rel.cy10a_bee
998	886	11439	178.3	7592.8	232.1	12.916	206.161	7.612	238.219	49319	15.7	55.683	1418	146.0	186.6	10.5	0.066	879	815	800m.my5641_rel.cy10a_bee
998	880	11408	177.8	7588.3	231.9	12.958	206.836	7.601	237.898	49126	15.5	55.800	1408	146.0	186.7	10.5	0.044	879	815	800m.my5651_rel.cy10a_bee
l.i0
- l.i0: load without secondary indexes
- Legend for results is here.
- Each entry lists the percentage of responses that fit in that bucket (slower than max time for previous bucket, faster than min time for next bucket).
Insert response time histogram
256us	1ms	4ms	16ms	64ms	256ms	1s	4s	16s	gt	max	tag
0.000	92.981	6.891	0.107	0.017	0.004	0.000	0.000	0.000	0.000	0.176	my5621_rel.cy10a_bee
0.000	79.019	20.837	0.071	0.070	0.004	0.000	0.000	0.000	0.000	0.230	my5631_rel.cy10a_bee
0.000	62.595	37.260	0.075	0.065	0.004	0.000	0.000	0.000	0.000	0.212	my5641_rel.cy10a_bee
0.000	83.653	16.205	0.069	0.070	0.004	0.000	0.000	0.000	0.000	0.246	my5651_rel.cy10a_bee
l.x
- l.x: create secondary indexes
- Legend for results is here.
- Each entry lists the percentage of responses that fit in that bucket (slower than max time for previous bucket, faster than min time for next bucket).
TODO - determine whether there is data for create index response time
l.i1
- l.i1: continue load after secondary indexes created
- Legend for results is here.
- Each entry lists the percentage of responses that fit in that bucket (slower than max time for previous bucket, faster than min time for next bucket).
Insert response time histogram
256us	1ms	4ms	16ms	64ms	256ms	1s	4s	16s	gt	max	tag
0.000	0.000	0.000	1.828	87.643	10.527	0.002	0.000	0.000	0.000	0.873	my5621_rel.cy10a_bee
0.000	0.000	0.000	1.481	87.369	11.142	0.008	0.000	0.000	0.000	0.812	my5631_rel.cy10a_bee
0.000	0.000	0.000	1.633	87.319	11.041	0.007	0.000	0.000	0.000	0.822	my5641_rel.cy10a_bee
0.000	0.000	0.000	1.815	87.164	11.016	0.005	0.000	0.000	0.000	0.777	my5651_rel.cy10a_bee
Delete response time histogram
256us	1ms	4ms	16ms	64ms	256ms	1s	4s	16s	gt	max	tag
0.000	0.000	2.951	91.090	5.955	0.003	0.001	0.000	0.000	0.000	0.733	my5621_rel.cy10a_bee
0.000	0.000	3.075	90.934	5.979	0.011	0.001	0.000	0.000	0.000	0.592	my5631_rel.cy10a_bee
0.000	0.000	2.861	91.264	5.868	0.006	0.001	0.000	0.000	0.000	0.657	my5641_rel.cy10a_bee
0.000	0.000	3.295	90.845	5.853	0.006	0.001	0.000	0.000	0.000	0.598	my5651_rel.cy10a_bee
q100.1
- q100.1: range queries with 100 insert/s per client
- Legend for results is here.
- Each entry lists the percentage of responses that fit in that bucket (slower than max time for previous bucket, faster than min time for next bucket).
Query response time histogram
256us	1ms	4ms	16ms	64ms	256ms	1s	4s	16s	gt	max	tag
28.918	16.794	52.799	1.480	0.009	0.000	0.000	0.000	0.000	0.000	0.048	my5621_rel.cy10a_bee
28.670	16.965	52.839	1.517	0.009	0.000	0.000	0.000	0.000	0.000	0.040	my5631_rel.cy10a_bee
28.123	17.609	52.727	1.532	0.009	0.000	0.000	0.000	0.000	0.000	0.047	my5641_rel.cy10a_bee
28.636	17.047	52.782	1.527	0.009	0.000	0.000	0.000	0.000	0.000	0.048	my5651_rel.cy10a_bee
Insert response time histogram
256us	1ms	4ms	16ms	64ms	256ms	1s	4s	16s	gt	max	tag
0.000	0.000	0.000	0.917	78.708	20.375	0.000	0.000	0.000	0.000	0.125	my5621_rel.cy10a_bee
0.000	0.000	0.000	2.083	58.833	39.083	0.000	0.000	0.000	0.000	0.132	my5631_rel.cy10a_bee
0.000	0.000	0.000	1.000	72.375	26.625	0.000	0.000	0.000	0.000	0.141	my5641_rel.cy10a_bee
0.000	0.000	0.000	2.708	60.875	36.417	0.000	0.000	0.000	0.000	0.125	my5651_rel.cy10a_bee
Delete response time histogram
256us	1ms	4ms	16ms	64ms	256ms	1s	4s	16s	gt	max	tag
0.000	0.000	9.542	68.542	21.917	0.000	0.000	0.000	0.000	0.000	0.060	my5621_rel.cy10a_bee
0.000	0.000	9.250	68.917	21.833	0.000	0.000	0.000	0.000	0.000	0.057	my5631_rel.cy10a_bee
0.000	0.000	10.917	64.208	24.875	0.000	0.000	0.000	0.000	0.000	0.054	my5641_rel.cy10a_bee
0.000	0.000	11.167	67.708	21.125	0.000	0.000	0.000	0.000	0.000	0.052	my5651_rel.cy10a_bee
q500.1
- q500.1: range queries with 500 insert/s per client
- Legend for results is here.
- Each entry lists the percentage of responses that fit in that bucket (slower than max time for previous bucket, faster than min time for next bucket).
Query response time histogram
256us	1ms	4ms	16ms	64ms	256ms	1s	4s	16s	gt	max	tag
32.561	15.008	51.658	0.768	0.004	0.000	0.000	0.000	0.000	0.000	0.040	my5621_rel.cy10a_bee
31.724	15.636	51.915	0.721	0.005	nonzero	0.000	0.000	0.000	0.000	0.067	my5631_rel.cy10a_bee
31.912	15.407	51.821	0.855	0.005	0.000	0.000	0.000	0.000	0.000	0.045	my5641_rel.cy10a_bee
32.191	15.226	51.790	0.789	0.004	0.000	0.000	0.000	0.000	0.000	0.042	my5651_rel.cy10a_bee
Insert response time histogram
256us	1ms	4ms	16ms	64ms	256ms	1s	4s	16s	gt	max	tag
0.000	0.000	0.000	1.625	94.658	3.717	0.000	0.000	0.000	0.000	0.112	my5621_rel.cy10a_bee
0.000	0.000	0.000	1.283	96.033	2.683	0.000	0.000	0.000	0.000	0.113	my5631_rel.cy10a_bee
0.000	0.000	0.000	0.975	93.633	5.392	0.000	0.000	0.000	0.000	0.152	my5641_rel.cy10a_bee
0.000	0.000	0.000	1.275	94.208	4.517	0.000	0.000	0.000	0.000	0.127	my5651_rel.cy10a_bee
Delete response time histogram
256us	1ms	4ms	16ms	64ms	256ms	1s	4s	16s	gt	max	tag
0.000	0.000	14.617	80.033	5.342	0.008	0.000	0.000	0.000	0.000	0.071	my5621_rel.cy10a_bee
0.000	0.000	13.642	81.308	5.033	0.017	0.000	0.000	0.000	0.000	0.074	my5631_rel.cy10a_bee
0.000	0.000	14.233	79.908	5.858	0.000	0.000	0.000	0.000	0.000	0.055	my5641_rel.cy10a_bee
0.000	0.000	15.250	79.033	5.700	0.017	0.000	0.000	0.000	0.000	0.087	my5651_rel.cy10a_bee
q1000.1
- q1000.1: range queries with 1000 insert/s per client
- Legend for results is here.
- Each entry lists the percentage of responses that fit in that bucket (slower than max time for previous bucket, faster than min time for next bucket).
Query response time histogram
256us	1ms	4ms	16ms	64ms	256ms	1s	4s	16s	gt	max	tag
22.007	18.855	56.819	2.309	0.011	0.000	0.000	0.000	0.000	0.000	0.044	my5621_rel.cy10a_bee
20.569	20.185	56.805	2.429	0.012	0.000	0.000	0.000	0.000	0.000	0.047	my5631_rel.cy10a_bee
20.621	20.113	57.036	2.218	0.012	nonzero	0.000	0.000	0.000	0.000	0.066	my5641_rel.cy10a_bee
20.336	20.390	56.918	2.344	0.011	0.000	0.000	0.000	0.000	0.000	0.044	my5651_rel.cy10a_bee
Insert response time histogram
256us	1ms	4ms	16ms	64ms	256ms	1s	4s	16s	gt	max	tag
0.000	0.000	0.000	12.858	80.308	6.833	0.000	0.000	0.000	0.000	0.129	my5621_rel.cy10a_bee
0.000	0.000	0.000	11.213	80.837	7.950	0.000	0.000	0.000	0.000	0.136	my5631_rel.cy10a_bee
0.000	0.000	0.000	10.350	82.721	6.929	0.000	0.000	0.000	0.000	0.138	my5641_rel.cy10a_bee
0.000	0.000	0.000	12.304	81.117	6.579	0.000	0.000	0.000	0.000	0.131	my5651_rel.cy10a_bee
Delete response time histogram
256us	1ms	4ms	16ms	64ms	256ms	1s	4s	16s	gt	max	tag
0.000	0.000	7.025	89.154	3.821	0.000	0.000	0.000	0.000	0.000	0.060	my5621_rel.cy10a_bee
0.000	0.000	6.217	89.608	4.175	0.000	0.000	0.000	0.000	0.000	0.057	my5631_rel.cy10a_bee
0.000	0.000	6.058	89.921	4.017	0.004	0.000	0.000	0.000	0.000	0.077	my5641_rel.cy10a_bee
0.000	0.000	7.037	89.079	3.883	0.000	0.000	0.000	0.000	0.000	0.052	my5651_rel.cy10a_bee