Introduction
This is a report for the insert benchmark with 4000M docs and 8 client(s). It is generated by scripts (bash, awk, sed) and Tufte might not be impressed. An overview of the insert benchmark is here and a short update is here. Below, by DBMS, I mean DBMS+version.config. An example is my8020.c10b40 where my means MySQL, 8020 is version 8.0.20 and c10b40 is the name for the configuration file.
The test server is a c2-standard-30 with 15 cores, hyperthreads disabled, 120G RAM and XFS with SW RAID 0 across 4 NVMe SSD. The benchmark was run with 8 clients and there were 1 or 3 connections per client (1 for queries or inserts without rate limits, 1+1 for rate limited inserts+deletes). It uses 8 tables, 1 per client. It loads 500M rows per table without secondary indexes, creates secondary indexes, then inserts 60M rows per table with a delete per insert to avoid growing the table. It then does 3 read+write tests for 7200s each that do queries as fast as possible with 100, 500 and then 1000 inserts/second/client concurrent with the queries. There are also deletes to match the inserts and avoid growing the table. The database is larger than memory. Clients and the DBMS share one server. The per-database configs are in the per-database subdirectories here.
The tested DBMS are:
- pg152_o3_native_lto.cx7a27_gcp_c2s30 - Postgres 15.2, o3_native_lto build, cx7a27_gcp_c2s30 config
- pg153_o3_native_lto.cx7a27_gcp_c2s30 - Postgres 15.3, o3_native_lto build, cx7a27_gcp_c2s30 config
- pg154_o3_native_lto.cx7a27_gcp_c2s30 - Postgres 15.4, o3_native_lto build, cx7a27_gcp_c2s30 config
- pg16beta1_o3_native_lto.cx7a27_gcp_c2s30 - Postgres 16 beta1, o3_native_lto build, cx7a27_gcp_c2s30 config
- pg16beta2_o3_native_lto.cx7a27_gcp_c2s30 - Postgres 16 beta2, o3_native_lto build, cx7a27_gcp_c2s30 config
- pg16beta3_o3_native_lto.cx7a27_gcp_c2s30 - Postgres 16 beta3, o3_native_lto build, cx7a27_gcp_c2s30 config
- pg16rc1_o3_native_lto.cx7a27_gcp_c2s30 - Postgres 16 rc1, o3_native_lto build, cx7a27_gcp_c2s30 config
- pg160_o3_native_lto.cx7a27_gcp_c2s30 - Postgres 16.0, o3_native_lto build, cx7a27_gcp_c2s30 config
Contents
- Summary
- l.i0: load without secondary indexes
- l.x: create secondary indexes
- l.i1: continue load after secondary indexes created
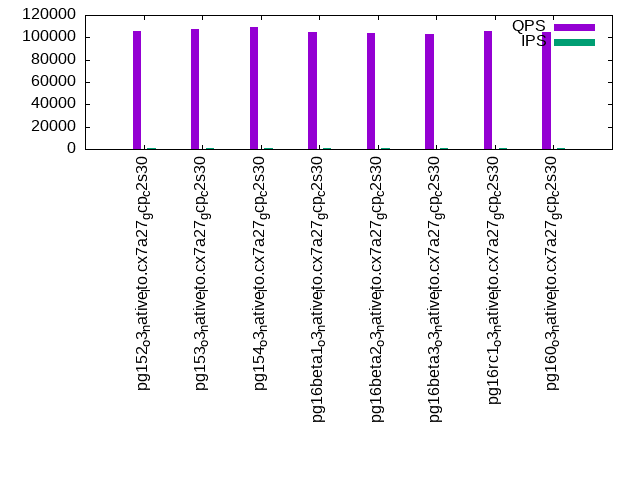
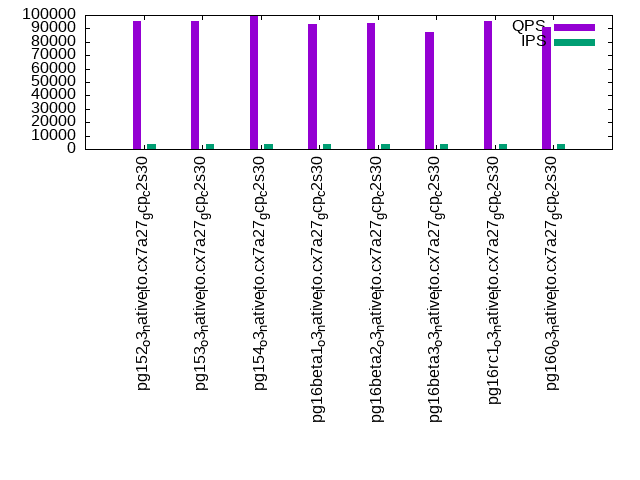
- q100.1: range queries with 100 insert/s per client
- q500.1: range queries with 500 insert/s per client
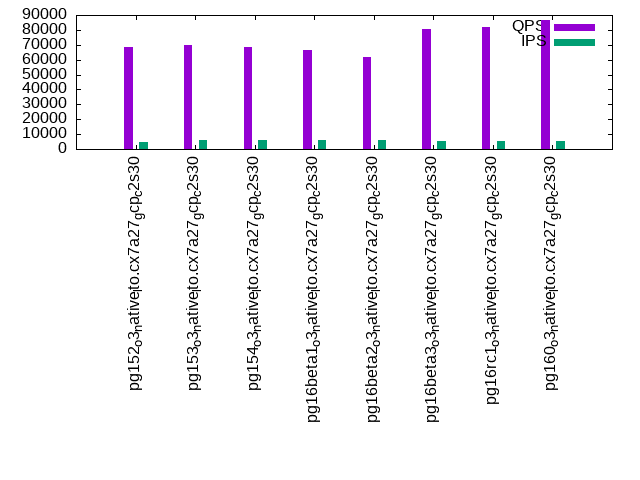
- q1000.1: range queries with 1000 insert/s per client
Summary
The numbers are inserts/s for l.i0 and l.i1, indexed docs (or rows) /s for l.x and queries/s for q*.2. The values are the average rate over the entire test for inserts (IPS) and queries (QPS). The range of values for IPS and QPS is split into 3 parts: bottom 25%, middle 50%, top 25%. Values in the bottom 25% have a red background, values in the top 25% have a green background and values in the middle have no color. A gray background is used for values that can be ignored because the DBMS did not sustain the target insert rate. Red backgrounds are not used when the minimum value is within 80% of the max value.
| dbms | l.i0 | l.x | l.i1 | q100.1 | q500.1 | q1000.1 |
|---|---|---|---|---|---|---|
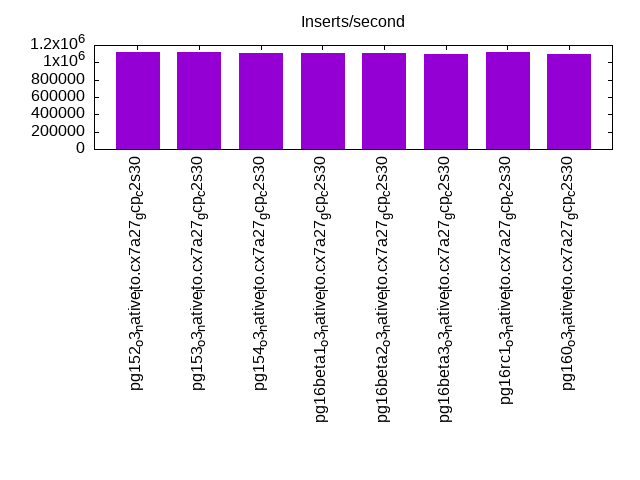
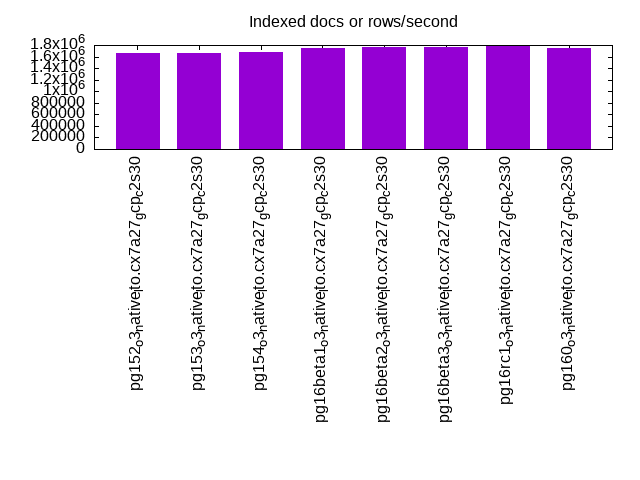
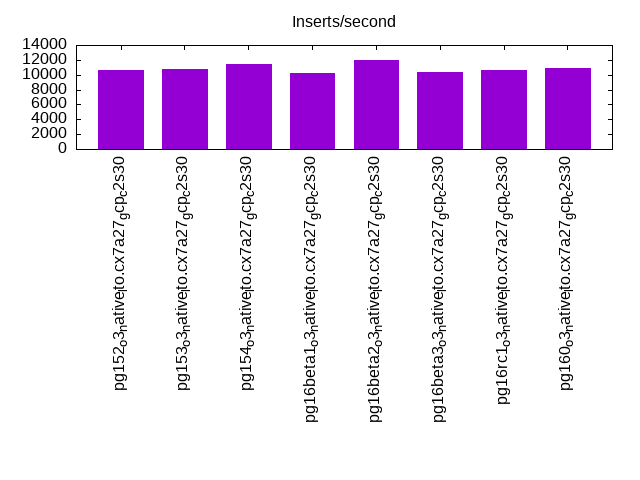
| pg152_o3_native_lto.cx7a27_gcp_c2s30 | 1124227 | 1656356 | 10698 | 106073 | 95458 | 68320 |
| pg153_o3_native_lto.cx7a27_gcp_c2s30 | 1119194 | 1668794 | 10816 | 107042 | 95549 | 69868 |
| pg154_o3_native_lto.cx7a27_gcp_c2s30 | 1108340 | 1675084 | 11508 | 109008 | 99230 | 68500 |
| pg16beta1_o3_native_lto.cx7a27_gcp_c2s30 | 1110802 | 1741445 | 10279 | 104975 | 93500 | 66806 |
| pg16beta2_o3_native_lto.cx7a27_gcp_c2s30 | 1103448 | 1766048 | 12046 | 104145 | 94028 | 61780 |
| pg16beta3_o3_native_lto.cx7a27_gcp_c2s30 | 1099203 | 1765269 | 10420 | 103432 | 87501 | 80311 |
| pg16rc1_o3_native_lto.cx7a27_gcp_c2s30 | 1114206 | 1784962 | 10579 | 105571 | 95385 | 81866 |
| pg160_o3_native_lto.cx7a27_gcp_c2s30 | 1099203 | 1746768 | 10938 | 104804 | 90848 | 86807 |
This table has relative throughput, throughput for the DBMS relative to the DBMS in the first line, using the absolute throughput from the previous table. Values less than 0.95 have a yellow background. Values greater than 1.05 have a blue background.
| dbms | l.i0 | l.x | l.i1 | q100.1 | q500.1 | q1000.1 |
|---|---|---|---|---|---|---|
| pg152_o3_native_lto.cx7a27_gcp_c2s30 | 1.00 | 1.00 | 1.00 | 1.00 | 1.00 | 1.00 |
| pg153_o3_native_lto.cx7a27_gcp_c2s30 | 1.00 | 1.01 | 1.01 | 1.01 | 1.00 | 1.02 |
| pg154_o3_native_lto.cx7a27_gcp_c2s30 | 0.99 | 1.01 | 1.08 | 1.03 | 1.04 | 1.00 |
| pg16beta1_o3_native_lto.cx7a27_gcp_c2s30 | 0.99 | 1.05 | 0.96 | 0.99 | 0.98 | 0.98 |
| pg16beta2_o3_native_lto.cx7a27_gcp_c2s30 | 0.98 | 1.07 | 1.13 | 0.98 | 0.99 | 0.90 |
| pg16beta3_o3_native_lto.cx7a27_gcp_c2s30 | 0.98 | 1.07 | 0.97 | 0.98 | 0.92 | 1.18 |
| pg16rc1_o3_native_lto.cx7a27_gcp_c2s30 | 0.99 | 1.08 | 0.99 | 1.00 | 1.00 | 1.20 |
| pg160_o3_native_lto.cx7a27_gcp_c2s30 | 0.98 | 1.05 | 1.02 | 0.99 | 0.95 | 1.27 |
This lists the average rate of inserts/s for the tests that do inserts concurrent with queries. For such tests the query rate is listed in the table above. The read+write tests are setup so that the insert rate should match the target rate every second. Cells that are not at least 95% of the target have a red background to indicate a failure to satisfy the target.
| dbms | q100.1 | q500.1 | q1000.1 |
|---|---|---|---|
| pg152_o3_native_lto.cx7a27_gcp_c2s30 | 798 | 3992 | 4491 |
| pg153_o3_native_lto.cx7a27_gcp_c2s30 | 798 | 3992 | 6177 |
| pg154_o3_native_lto.cx7a27_gcp_c2s30 | 798 | 3992 | 5976 |
| pg16beta1_o3_native_lto.cx7a27_gcp_c2s30 | 798 | 3992 | 5712 |
| pg16beta2_o3_native_lto.cx7a27_gcp_c2s30 | 798 | 3992 | 6012 |
| pg16beta3_o3_native_lto.cx7a27_gcp_c2s30 | 798 | 3992 | 5545 |
| pg16rc1_o3_native_lto.cx7a27_gcp_c2s30 | 798 | 3992 | 5273 |
| pg160_o3_native_lto.cx7a27_gcp_c2s30 | 798 | 3991 | 5446 |
| target | 800 | 4000 | 8000 |
l.i0
l.i0: load without secondary indexes. Graphs for performance per 1-second interval are here.
Average throughput:
Insert response time histogram: each cell has the percentage of responses that take <= the time in the header and max is the max response time in seconds. For the max column values in the top 25% of the range have a red background and in the bottom 25% of the range have a green background. The red background is not used when the min value is within 80% of the max value.
| dbms | 256us | 1ms | 4ms | 16ms | 64ms | 256ms | 1s | 4s | 16s | gt | max |
|---|---|---|---|---|---|---|---|---|---|---|---|
| pg152_o3_native_lto.cx7a27_gcp_c2s30 | 97.623 | 2.342 | 0.028 | 0.003 | 0.004 | 0.001 | 0.588 | ||||
| pg153_o3_native_lto.cx7a27_gcp_c2s30 | 97.538 | 2.426 | 0.028 | 0.004 | 0.004 | nonzero | 0.409 | ||||
| pg154_o3_native_lto.cx7a27_gcp_c2s30 | 97.325 | 2.641 | 0.027 | 0.003 | 0.003 | nonzero | 0.551 | ||||
| pg16beta1_o3_native_lto.cx7a27_gcp_c2s30 | 97.561 | 2.403 | 0.027 | 0.004 | 0.004 | nonzero | 0.449 | ||||
| pg16beta2_o3_native_lto.cx7a27_gcp_c2s30 | 97.656 | 2.309 | 0.029 | 0.003 | 0.003 | nonzero | 0.409 | ||||
| pg16beta3_o3_native_lto.cx7a27_gcp_c2s30 | 97.538 | 2.428 | 0.026 | 0.004 | 0.004 | nonzero | 0.401 | ||||
| pg16rc1_o3_native_lto.cx7a27_gcp_c2s30 | 97.636 | 2.330 | 0.028 | 0.003 | 0.003 | nonzero | 0.502 | ||||
| pg160_o3_native_lto.cx7a27_gcp_c2s30 | 97.569 | 2.393 | 0.029 | 0.004 | 0.004 | 0.001 | 0.953 |
Performance metrics for the DBMS listed above. Some are normalized by throughput, others are not. Legend for results is here.
ips	qps	rps	rmbps	wps	wmbps	rpq	rkbpq	wpi	wkbpi	csps	cpups	cspq	cpupq	dbgb1	dbgb2	rss	maxop	p50	p99	tag
1124227	0	562	4.4	1397.1	258.5	0.000	0.004	0.001	0.235	92574	85.3	0.082	11	382.7	452.8	19.0	0.588	143344	89237	4000m.pg152_o3_native_lto.cx7a27_gcp_c2s30
1119194	0	555	4.4	1396.3	258.1	0.000	0.004	0.001	0.236	93021	85.0	0.083	11	382.7	452.8	3.4	0.409	142446	96594	4000m.pg153_o3_native_lto.cx7a27_gcp_c2s30
1108340	0	542	4.3	1384.0	252.3	0.000	0.004	0.001	0.233	92380	84.8	0.083	11	382.7	452.8	8.9	0.551	141147	101223	4000m.pg154_o3_native_lto.cx7a27_gcp_c2s30
1110802	0	556	4.4	1402.2	253.6	0.001	0.004	0.001	0.234	92227	84.9	0.083	11	382.7	452.8	9.1	0.449	141696	97525	4000m.pg16beta1_o3_native_lto.cx7a27_gcp_c2s30
1103448	0	546	4.3	1395.1	251.4	0.000	0.004	0.001	0.233	92151	84.8	0.084	12	382.7	452.8	4.5	0.409	140547	97829	4000m.pg16beta2_o3_native_lto.cx7a27_gcp_c2s30
1099203	0	550	4.3	1375.2	248.7	0.001	0.004	0.001	0.232	92516	84.7	0.084	12	382.7	452.8	4.5	0.401	139894	94497	4000m.pg16beta3_o3_native_lto.cx7a27_gcp_c2s30
1114206	0	559	4.4	1381.9	254.3	0.001	0.004	0.001	0.234	92259	85.2	0.083	11	382.7	452.8	17.8	0.502	141946	95695	4000m.pg16rc1_o3_native_lto.cx7a27_gcp_c2s30
1099203	0	543	4.3	1383.5	249.5	0.000	0.004	0.001	0.232	91593	84.6	0.083	12	382.7	452.8	10.5	0.953	140847	72820	4000m.pg160_o3_native_lto.cx7a27_gcp_c2s30
l.x
l.x: create secondary indexes.
Average throughput:
Performance metrics for the DBMS listed above. Some are normalized by throughput, others are not. Legend for results is here.
ips	qps	rps	rmbps	wps	wmbps	rpq	rkbpq	wpi	wkbpi	csps	cpups	cspq	cpupq	dbgb1	dbgb2	rss	maxop	p50	p99	tag
1656356	0	3490	760.8	1279.1	285.9	0.002	0.470	0.001	0.177	12648	37.2	0.008	3	735.2	805.2	56.9	0.002	NA	NA	4000m.pg152_o3_native_lto.cx7a27_gcp_c2s30
1668794	0	3576	777.7	1286.6	287.0	0.002	0.477	0.001	0.176	12684	37.2	0.008	3	735.2	805.2	56.9	0.002	NA	NA	4000m.pg153_o3_native_lto.cx7a27_gcp_c2s30
1675084	0	3384	742.3	1281.3	287.6	0.002	0.454	0.001	0.176	12025	38.2	0.007	3	735.2	805.2	56.7	0.010	NA	NA	4000m.pg154_o3_native_lto.cx7a27_gcp_c2s30
1741445	0	2945	672.4	1327.8	302.5	0.002	0.395	0.001	0.178	17410	39.0	0.010	3	735.2	804.9	56.8	0.002	NA	NA	4000m.pg16beta1_o3_native_lto.cx7a27_gcp_c2s30
1766048	0	2974	681.6	1342.1	305.2	0.002	0.395	0.001	0.177	17733	39.2	0.010	3	735.2	804.8	56.8	0.002	NA	NA	4000m.pg16beta2_o3_native_lto.cx7a27_gcp_c2s30
1765269	0	2962	676.7	1360.5	305.6	0.002	0.393	0.001	0.177	18205	39.4	0.010	3	735.2	804.9	56.8	0.024	NA	NA	4000m.pg16beta3_o3_native_lto.cx7a27_gcp_c2s30
1784962	0	2839	658.6	1356.0	309.5	0.002	0.378	0.001	0.178	17389	39.6	0.010	3	735.2	805.2	56.8	0.002	NA	NA	4000m.pg16rc1_o3_native_lto.cx7a27_gcp_c2s30
1746768	0	2886	667.8	1337.0	303.1	0.002	0.391	0.001	0.178	17624	38.9	0.010	3	735.2	804.9	57.0	0.002	NA	NA	4000m.pg160_o3_native_lto.cx7a27_gcp_c2s30
l.i1
l.i1: continue load after secondary indexes created. Graphs for performance per 1-second interval are here.
Average throughput:
Insert response time histogram: each cell has the percentage of responses that take <= the time in the header and max is the max response time in seconds. For the max column values in the top 25% of the range have a red background and in the bottom 25% of the range have a green background. The red background is not used when the min value is within 80% of the max value.
| dbms | 256us | 1ms | 4ms | 16ms | 64ms | 256ms | 1s | 4s | 16s | gt | max |
|---|---|---|---|---|---|---|---|---|---|---|---|
| pg152_o3_native_lto.cx7a27_gcp_c2s30 | 34.624 | 40.909 | 24.439 | 0.027 | 0.002 | nonzero | 1.654 | ||||
| pg153_o3_native_lto.cx7a27_gcp_c2s30 | 51.676 | 25.635 | 22.678 | 0.010 | 0.001 | 0.780 | |||||
| pg154_o3_native_lto.cx7a27_gcp_c2s30 | 40.787 | 41.197 | 17.995 | 0.020 | 0.001 | 0.952 | |||||
| pg16beta1_o3_native_lto.cx7a27_gcp_c2s30 | 31.566 | 47.289 | 21.124 | 0.020 | 0.001 | 0.884 | |||||
| pg16beta2_o3_native_lto.cx7a27_gcp_c2s30 | 46.238 | 33.627 | 20.119 | 0.014 | 0.002 | 0.800 | |||||
| pg16beta3_o3_native_lto.cx7a27_gcp_c2s30 | 51.105 | 28.142 | 20.740 | 0.012 | 0.001 | 0.794 | |||||
| pg16rc1_o3_native_lto.cx7a27_gcp_c2s30 | 46.615 | 27.383 | 25.989 | 0.012 | 0.001 | nonzero | 1.272 | ||||
| pg160_o3_native_lto.cx7a27_gcp_c2s30 | 42.877 | 39.241 | 17.867 | 0.014 | 0.001 | 0.737 |
Delete response time histogram: each cell has the percentage of responses that take <= the time in the header and max is the max response time in seconds. For the max column values in the top 25% of the range have a red background and in the bottom 25% of the range have a green background. The red background is not used when the min value is within 80% of the max value.
| dbms | 256us | 1ms | 4ms | 16ms | 64ms | 256ms | 1s | 4s | 16s | gt | max |
|---|---|---|---|---|---|---|---|---|---|---|---|
| pg152_o3_native_lto.cx7a27_gcp_c2s30 | 69.341 | 6.121 | 0.598 | 1.996 | 6.395 | 15.548 | nonzero | 0.671 | |||
| pg153_o3_native_lto.cx7a27_gcp_c2s30 | 72.355 | 4.073 | 0.793 | 2.240 | 7.851 | 12.688 | nonzero | 0.302 | |||
| pg154_o3_native_lto.cx7a27_gcp_c2s30 | 69.471 | 5.804 | 0.486 | 1.607 | 11.367 | 11.260 | 0.005 | 0.421 | |||
| pg16beta1_o3_native_lto.cx7a27_gcp_c2s30 | 68.022 | 7.214 | 0.906 | 2.714 | 7.518 | 13.615 | 0.011 | 0.553 | |||
| pg16beta2_o3_native_lto.cx7a27_gcp_c2s30 | 68.638 | 6.037 | 0.497 | 1.742 | 11.487 | 11.597 | nonzero | 0.532 | |||
| pg16beta3_o3_native_lto.cx7a27_gcp_c2s30 | 69.710 | 6.616 | 1.017 | 2.555 | 6.610 | 13.386 | 0.107 | 0.475 | |||
| pg16rc1_o3_native_lto.cx7a27_gcp_c2s30 | 67.573 | 8.014 | 0.681 | 2.134 | 8.913 | 12.642 | 0.042 | nonzero | 1.208 | ||
| pg160_o3_native_lto.cx7a27_gcp_c2s30 | 71.105 | 3.464 | 0.728 | 2.239 | 7.972 | 14.486 | 0.006 | 0.369 |
Performance metrics for the DBMS listed above. Some are normalized by throughput, others are not. Legend for results is here.
ips	qps	rps	rmbps	wps	wmbps	rpq	rkbpq	wpi	wkbpi	csps	cpups	cspq	cpupq	dbgb1	dbgb2	rss	maxop	p50	p99	tag
10698	0	8974	105.0	11848.5	163.4	0.839	10.055	1.108	15.639	23056	42.5	2.155	596	781.9	852.0	69.2	1.654	350	250	4000m.pg152_o3_native_lto.cx7a27_gcp_c2s30
10816	0	7467	90.1	9424.3	132.0	0.690	8.528	0.871	12.494	20165	36.3	1.864	503	782.7	839.8	60.3	0.780	450	300	4000m.pg153_o3_native_lto.cx7a27_gcp_c2s30
11508	0	8292	97.3	11320.2	155.0	0.721	8.660	0.984	13.794	21921	34.4	1.905	448	781.9	851.9	70.4	0.952	250	200	4000m.pg154_o3_native_lto.cx7a27_gcp_c2s30
10279	0	8560	102.0	11696.8	163.1	0.833	10.159	1.138	16.245	22097	41.3	2.150	603	779.6	846.8	23.5	0.884	350	200	4000m.pg16beta1_o3_native_lto.cx7a27_gcp_c2s30
12046	0	8187	93.9	10914.8	152.1	0.680	7.984	0.906	12.930	22077	35.0	1.833	436	780.6	842.2	69.6	0.800	849	450	4000m.pg16beta2_o3_native_lto.cx7a27_gcp_c2s30
10420	0	7188	89.3	9118.1	133.0	0.690	8.779	0.875	13.069	19404	42.6	1.862	613	780.0	850.1	55.6	0.794	250	200	4000m.pg16beta3_o3_native_lto.cx7a27_gcp_c2s30
10579	0	7889	90.9	9804.9	134.1	0.746	8.799	0.927	12.984	20718	37.6	1.958	533	781.5	847.1	27.8	1.272	499	250	4000m.pg16rc1_o3_native_lto.cx7a27_gcp_c2s30
10938	0	7416	88.4	9966.8	138.1	0.678	8.273	0.911	12.931	19913	39.0	1.821	535	780.6	849.3	35.4	0.737	649	400	4000m.pg160_o3_native_lto.cx7a27_gcp_c2s30
q100.1
q100.1: range queries with 100 insert/s per client. Graphs for performance per 1-second interval are here.
Average throughput:
Query response time histogram: each cell has the percentage of responses that take <= the time in the header and max is the max response time in seconds. For max values in the top 25% of the range have a red background and in the bottom 25% of the range have a green background. The red background is not used when the min value is within 80% of the max value.
| dbms | 256us | 1ms | 4ms | 16ms | 64ms | 256ms | 1s | 4s | 16s | gt | max |
|---|---|---|---|---|---|---|---|---|---|---|---|
| pg152_o3_native_lto.cx7a27_gcp_c2s30 | 99.902 | 0.097 | 0.001 | nonzero | nonzero | nonzero | 0.149 | ||||
| pg153_o3_native_lto.cx7a27_gcp_c2s30 | 99.895 | 0.104 | 0.001 | nonzero | nonzero | nonzero | 0.154 | ||||
| pg154_o3_native_lto.cx7a27_gcp_c2s30 | 99.920 | 0.079 | 0.001 | nonzero | nonzero | 0.058 | |||||
| pg16beta1_o3_native_lto.cx7a27_gcp_c2s30 | 99.923 | 0.076 | 0.001 | nonzero | nonzero | nonzero | 0.188 | ||||
| pg16beta2_o3_native_lto.cx7a27_gcp_c2s30 | 99.911 | 0.089 | nonzero | nonzero | nonzero | nonzero | 0.157 | ||||
| pg16beta3_o3_native_lto.cx7a27_gcp_c2s30 | 99.909 | 0.090 | 0.001 | nonzero | nonzero | nonzero | 0.154 | ||||
| pg16rc1_o3_native_lto.cx7a27_gcp_c2s30 | 99.922 | 0.078 | 0.001 | nonzero | nonzero | nonzero | 0.071 | ||||
| pg160_o3_native_lto.cx7a27_gcp_c2s30 | 99.909 | 0.090 | 0.001 | nonzero | nonzero | nonzero | 0.146 |
Insert response time histogram: each cell has the percentage of responses that take <= the time in the header and max is the max response time in seconds. For max values in the top 25% of the range have a red background and in the bottom 25% of the range have a green background. The red background is not used when the min value is within 80% of the max value.
| dbms | 256us | 1ms | 4ms | 16ms | 64ms | 256ms | 1s | 4s | 16s | gt | max |
|---|---|---|---|---|---|---|---|---|---|---|---|
| pg152_o3_native_lto.cx7a27_gcp_c2s30 | 4.447 | 11.063 | 84.487 | 0.003 | 0.072 | ||||||
| pg153_o3_native_lto.cx7a27_gcp_c2s30 | 0.004 | 14.098 | 85.888 | 0.009 | 0.001 | 0.460 | |||||
| pg154_o3_native_lto.cx7a27_gcp_c2s30 | 4.647 | 10.548 | 84.786 | 0.020 | 0.158 | ||||||
| pg16beta1_o3_native_lto.cx7a27_gcp_c2s30 | 0.162 | 15.101 | 84.734 | 0.003 | 0.119 | ||||||
| pg16beta2_o3_native_lto.cx7a27_gcp_c2s30 | 5.382 | 7.401 | 87.216 | 0.001 | 0.084 | ||||||
| pg16beta3_o3_native_lto.cx7a27_gcp_c2s30 | 3.018 | 11.003 | 85.973 | 0.006 | 0.106 | ||||||
| pg16rc1_o3_native_lto.cx7a27_gcp_c2s30 | 0.006 | 16.148 | 83.840 | 0.005 | 0.132 | ||||||
| pg160_o3_native_lto.cx7a27_gcp_c2s30 | 0.952 | 13.109 | 85.926 | 0.013 | 0.254 |
Delete response time histogram: each cell has the percentage of responses that take <= the time in the header and max is the max response time in seconds. For max values in the top 25% of the range have a red background and in the bottom 25% of the range have a green background. The red background is not used when the min value is within 80% of the max value.
| dbms | 256us | 1ms | 4ms | 16ms | 64ms | 256ms | 1s | 4s | 16s | gt | max |
|---|---|---|---|---|---|---|---|---|---|---|---|
| pg152_o3_native_lto.cx7a27_gcp_c2s30 | 56.229 | 37.779 | 1.849 | 4.142 | 0.001 | 0.019 | |||||
| pg153_o3_native_lto.cx7a27_gcp_c2s30 | 40.080 | 27.979 | 18.944 | 12.997 | 0.001 | 0.019 | |||||
| pg154_o3_native_lto.cx7a27_gcp_c2s30 | 58.477 | 30.595 | 6.216 | 4.707 | 0.004 | 0.022 | |||||
| pg16beta1_o3_native_lto.cx7a27_gcp_c2s30 | 48.469 | 33.853 | 10.627 | 7.049 | 0.003 | 0.024 | |||||
| pg16beta2_o3_native_lto.cx7a27_gcp_c2s30 | 35.272 | 31.615 | 16.049 | 17.058 | 0.005 | 0.027 | |||||
| pg16beta3_o3_native_lto.cx7a27_gcp_c2s30 | 41.202 | 35.166 | 5.500 | 15.615 | 2.517 | 0.029 | |||||
| pg16rc1_o3_native_lto.cx7a27_gcp_c2s30 | 63.411 | 36.403 | 0.185 | 0.001 | 0.016 | ||||||
| pg160_o3_native_lto.cx7a27_gcp_c2s30 | 41.762 | 36.163 | 10.860 | 11.210 | 0.004 | 0.020 |
Performance metrics for the DBMS listed above. Some are normalized by throughput, others are not. Legend for results is here.
ips	qps	rps	rmbps	wps	wmbps	rpq	rkbpq	wpi	wkbpi	csps	cpups	cspq	cpupq	dbgb1	dbgb2	rss	maxop	p50	p99	tag
798	106073	1421	11.9	1554.0	18.6	0.013	0.115	1.947	23.917	406806	53.2	3.835	75	782.0	850.3	71.0	0.149	13265	12882	4000m.pg152_o3_native_lto.cx7a27_gcp_c2s30
798	107042	1382	11.7	1552.3	19.1	0.013	0.112	1.945	24.549	410248	53.2	3.833	75	782.8	851.6	71.0	0.154	13345	8458	4000m.pg153_o3_native_lto.cx7a27_gcp_c2s30
798	109008	1373	11.6	1547.7	20.9	0.013	0.109	1.939	26.825	417734	53.2	3.832	73	782.1	847.4	71.0	0.058	13393	13154	4000m.pg154_o3_native_lto.cx7a27_gcp_c2s30
798	104975	1344	11.4	1485.4	18.4	0.013	0.112	1.861	23.557	402328	53.2	3.833	76	779.9	845.5	71.0	0.188	12999	12290	4000m.pg16beta1_o3_native_lto.cx7a27_gcp_c2s30
798	104145	1368	11.7	1491.3	18.6	0.013	0.115	1.868	23.815	399312	53.3	3.834	77	780.8	846.1	71.0	0.157	13042	9494	4000m.pg16beta2_o3_native_lto.cx7a27_gcp_c2s30
798	103432	1375	11.7	1498.9	18.5	0.013	0.116	1.878	23.746	396647	53.4	3.835	77	780.2	847.6	71.0	0.154	12834	12248	4000m.pg16beta3_o3_native_lto.cx7a27_gcp_c2s30
798	105571	1337	11.4	1549.2	20.4	0.013	0.111	1.941	26.199	404666	53.1	3.833	75	781.6	850.4	71.0	0.071	13170	12482	4000m.pg16rc1_o3_native_lto.cx7a27_gcp_c2s30
798	104804	1363	11.6	1488.4	18.8	0.013	0.113	1.864	24.160	401660	53.3	3.832	76	780.8	847.9	71.0	0.146	13127	12722	4000m.pg160_o3_native_lto.cx7a27_gcp_c2s30
q500.1
q500.1: range queries with 500 insert/s per client. Graphs for performance per 1-second interval are here.
Average throughput:
Query response time histogram: each cell has the percentage of responses that take <= the time in the header and max is the max response time in seconds. For max values in the top 25% of the range have a red background and in the bottom 25% of the range have a green background. The red background is not used when the min value is within 80% of the max value.
| dbms | 256us | 1ms | 4ms | 16ms | 64ms | 256ms | 1s | 4s | 16s | gt | max |
|---|---|---|---|---|---|---|---|---|---|---|---|
| pg152_o3_native_lto.cx7a27_gcp_c2s30 | 99.867 | 0.128 | 0.004 | 0.001 | nonzero | 0.027 | |||||
| pg153_o3_native_lto.cx7a27_gcp_c2s30 | 99.861 | 0.133 | 0.004 | 0.001 | nonzero | 0.024 | |||||
| pg154_o3_native_lto.cx7a27_gcp_c2s30 | 99.878 | 0.117 | 0.004 | 0.001 | nonzero | 0.024 | |||||
| pg16beta1_o3_native_lto.cx7a27_gcp_c2s30 | 99.836 | 0.159 | 0.004 | 0.001 | nonzero | 0.025 | |||||
| pg16beta2_o3_native_lto.cx7a27_gcp_c2s30 | 99.902 | 0.096 | 0.002 | nonzero | nonzero | 0.024 | |||||
| pg16beta3_o3_native_lto.cx7a27_gcp_c2s30 | 99.801 | 0.193 | 0.005 | 0.001 | nonzero | 0.025 | |||||
| pg16rc1_o3_native_lto.cx7a27_gcp_c2s30 | 99.878 | 0.120 | 0.002 | nonzero | nonzero | 0.026 | |||||
| pg160_o3_native_lto.cx7a27_gcp_c2s30 | 99.872 | 0.125 | 0.003 | 0.001 | nonzero | 0.023 |
Insert response time histogram: each cell has the percentage of responses that take <= the time in the header and max is the max response time in seconds. For max values in the top 25% of the range have a red background and in the bottom 25% of the range have a green background. The red background is not used when the min value is within 80% of the max value.
| dbms | 256us | 1ms | 4ms | 16ms | 64ms | 256ms | 1s | 4s | 16s | gt | max |
|---|---|---|---|---|---|---|---|---|---|---|---|
| pg152_o3_native_lto.cx7a27_gcp_c2s30 | 11.170 | 88.830 | 0.001 | 0.071 | |||||||
| pg153_o3_native_lto.cx7a27_gcp_c2s30 | 14.407 | 85.592 | nonzero | 0.080 | |||||||
| pg154_o3_native_lto.cx7a27_gcp_c2s30 | 18.431 | 81.568 | nonzero | 0.067 | |||||||
| pg16beta1_o3_native_lto.cx7a27_gcp_c2s30 | 12.186 | 87.814 | 0.059 | ||||||||
| pg16beta2_o3_native_lto.cx7a27_gcp_c2s30 | 5.110 | 94.890 | 0.058 | ||||||||
| pg16beta3_o3_native_lto.cx7a27_gcp_c2s30 | 8.037 | 91.963 | 0.062 | ||||||||
| pg16rc1_o3_native_lto.cx7a27_gcp_c2s30 | 4.414 | 95.586 | nonzero | 0.065 | |||||||
| pg160_o3_native_lto.cx7a27_gcp_c2s30 | 6.451 | 93.549 | 0.062 |
Delete response time histogram: each cell has the percentage of responses that take <= the time in the header and max is the max response time in seconds. For max values in the top 25% of the range have a red background and in the bottom 25% of the range have a green background. The red background is not used when the min value is within 80% of the max value.
| dbms | 256us | 1ms | 4ms | 16ms | 64ms | 256ms | 1s | 4s | 16s | gt | max |
|---|---|---|---|---|---|---|---|---|---|---|---|
| pg152_o3_native_lto.cx7a27_gcp_c2s30 | 55.251 | 9.609 | 0.165 | 3.745 | 31.224 | 0.006 | 0.086 | ||||
| pg153_o3_native_lto.cx7a27_gcp_c2s30 | 43.493 | 8.169 | 0.124 | 10.147 | 38.060 | 0.006 | 0.080 | ||||
| pg154_o3_native_lto.cx7a27_gcp_c2s30 | 50.390 | 8.203 | 0.173 | 6.323 | 34.910 | 0.001 | 0.078 | ||||
| pg16beta1_o3_native_lto.cx7a27_gcp_c2s30 | 50.678 | 10.140 | 0.154 | 5.808 | 33.216 | 0.004 | 0.082 | ||||
| pg16beta2_o3_native_lto.cx7a27_gcp_c2s30 | 82.760 | 11.738 | 0.173 | 5.281 | 0.048 | 0.033 | |||||
| pg16beta3_o3_native_lto.cx7a27_gcp_c2s30 | 48.445 | 8.999 | 0.138 | 3.863 | 38.547 | 0.008 | 0.082 | ||||
| pg16rc1_o3_native_lto.cx7a27_gcp_c2s30 | 85.633 | 10.142 | 0.205 | 0.010 | 4.010 | 0.051 | |||||
| pg160_o3_native_lto.cx7a27_gcp_c2s30 | 69.432 | 10.276 | 0.143 | 5.422 | 14.727 | 0.053 |
Performance metrics for the DBMS listed above. Some are normalized by throughput, others are not. Legend for results is here.
ips	qps	rps	rmbps	wps	wmbps	rpq	rkbpq	wpi	wkbpi	csps	cpups	cspq	cpupq	dbgb1	dbgb2	rss	maxop	p50	p99	tag
3992	95458	5949	49.4	7813.6	86.8	0.062	0.530	1.958	22.274	350130	60.7	3.668	95	782.5	852.6	71.0	0.027	11795	11092	4000m.pg152_o3_native_lto.cx7a27_gcp_c2s30
3992	95549	5924	49.3	7684.1	85.6	0.062	0.528	1.925	21.955	349512	61.5	3.658	97	783.3	853.4	71.0	0.024	11930	10740	4000m.pg153_o3_native_lto.cx7a27_gcp_c2s30
3992	99230	5907	49.0	7822.2	96.4	0.060	0.505	1.959	24.730	360258	60.8	3.631	92	783.5	853.5	71.0	0.024	12295	11140	4000m.pg154_o3_native_lto.cx7a27_gcp_c2s30
3992	93500	5909	49.1	7902.1	87.2	0.063	0.538	1.980	22.375	343430	61.1	3.673	98	781.2	851.2	71.0	0.025	11571	10341	4000m.pg16beta1_o3_native_lto.cx7a27_gcp_c2s30
3992	94028	5901	49.1	7889.8	88.7	0.063	0.535	1.977	22.746	367919	56.5	3.913	90	781.8	851.9	71.0	0.024	11683	11172	4000m.pg16beta2_o3_native_lto.cx7a27_gcp_c2s30
3992	87501	5924	49.2	7864.9	86.7	0.068	0.576	1.970	22.246	326548	62.2	3.732	107	781.0	851.1	71.0	0.025	11124	9541	4000m.pg16beta3_o3_native_lto.cx7a27_gcp_c2s30
3992	95385	5896	49.0	7705.6	100.5	0.062	0.526	1.930	25.781	371745	56.9	3.897	89	782.7	852.8	71.0	0.026	11811	10809	4000m.pg16rc1_o3_native_lto.cx7a27_gcp_c2s30
3991	90848	5914	49.2	7846.6	86.9	0.065	0.554	1.966	22.295	352013	58.8	3.875	97	781.9	851.9	71.0	0.023	11315	10105	4000m.pg160_o3_native_lto.cx7a27_gcp_c2s30
q1000.1
q1000.1: range queries with 1000 insert/s per client. Graphs for performance per 1-second interval are here.
Average throughput:
Query response time histogram: each cell has the percentage of responses that take <= the time in the header and max is the max response time in seconds. For max values in the top 25% of the range have a red background and in the bottom 25% of the range have a green background. The red background is not used when the min value is within 80% of the max value.
| dbms | 256us | 1ms | 4ms | 16ms | 64ms | 256ms | 1s | 4s | 16s | gt | max |
|---|---|---|---|---|---|---|---|---|---|---|---|
| pg152_o3_native_lto.cx7a27_gcp_c2s30 | 99.771 | 0.218 | 0.009 | 0.003 | nonzero | 0.036 | |||||
| pg153_o3_native_lto.cx7a27_gcp_c2s30 | 99.667 | 0.321 | 0.009 | 0.003 | nonzero | 0.026 | |||||
| pg154_o3_native_lto.cx7a27_gcp_c2s30 | 99.714 | 0.275 | 0.008 | 0.003 | nonzero | nonzero | nonzero | nonzero | 1.184 | ||
| pg16beta1_o3_native_lto.cx7a27_gcp_c2s30 | 99.572 | 0.418 | 0.008 | 0.002 | nonzero | 0.026 | |||||
| pg16beta2_o3_native_lto.cx7a27_gcp_c2s30 | 99.525 | 0.467 | 0.006 | 0.001 | nonzero | 0.027 | |||||
| pg16beta3_o3_native_lto.cx7a27_gcp_c2s30 | 99.734 | 0.256 | 0.008 | 0.003 | nonzero | 0.032 | |||||
| pg16rc1_o3_native_lto.cx7a27_gcp_c2s30 | 99.715 | 0.274 | 0.008 | 0.003 | nonzero | 0.036 | |||||
| pg160_o3_native_lto.cx7a27_gcp_c2s30 | 99.804 | 0.187 | 0.007 | 0.002 | nonzero | 0.032 |
Insert response time histogram: each cell has the percentage of responses that take <= the time in the header and max is the max response time in seconds. For max values in the top 25% of the range have a red background and in the bottom 25% of the range have a green background. The red background is not used when the min value is within 80% of the max value.
| dbms | 256us | 1ms | 4ms | 16ms | 64ms | 256ms | 1s | 4s | 16s | gt | max |
|---|---|---|---|---|---|---|---|---|---|---|---|
| pg152_o3_native_lto.cx7a27_gcp_c2s30 | nonzero | 29.928 | 70.071 | 0.001 | 0.080 | ||||||
| pg153_o3_native_lto.cx7a27_gcp_c2s30 | 15.694 | 84.306 | 0.063 | ||||||||
| pg154_o3_native_lto.cx7a27_gcp_c2s30 | 16.532 | 83.452 | 0.009 | 0.005 | 0.001 | 1.223 | |||||
| pg16beta1_o3_native_lto.cx7a27_gcp_c2s30 | 13.830 | 86.170 | 0.062 | ||||||||
| pg16beta2_o3_native_lto.cx7a27_gcp_c2s30 | 0.042 | 5.563 | 94.395 | nonzero | 0.071 | ||||||
| pg16beta3_o3_native_lto.cx7a27_gcp_c2s30 | 24.749 | 75.251 | nonzero | 0.071 | |||||||
| pg16rc1_o3_native_lto.cx7a27_gcp_c2s30 | 20.297 | 79.702 | 0.001 | 0.092 | |||||||
| pg160_o3_native_lto.cx7a27_gcp_c2s30 | 34.028 | 65.972 | 0.001 | 0.070 |
Delete response time histogram: each cell has the percentage of responses that take <= the time in the header and max is the max response time in seconds. For max values in the top 25% of the range have a red background and in the bottom 25% of the range have a green background. The red background is not used when the min value is within 80% of the max value.
| dbms | 256us | 1ms | 4ms | 16ms | 64ms | 256ms | 1s | 4s | 16s | gt | max |
|---|---|---|---|---|---|---|---|---|---|---|---|
| pg152_o3_native_lto.cx7a27_gcp_c2s30 | 40.406 | 18.234 | 0.143 | 0.023 | 16.606 | 24.589 | nonzero | 0.432 | |||
| pg153_o3_native_lto.cx7a27_gcp_c2s30 | 56.969 | 17.796 | 0.134 | 0.024 | 11.606 | 13.470 | 0.229 | ||||
| pg154_o3_native_lto.cx7a27_gcp_c2s30 | 61.245 | 15.558 | 0.123 | 0.025 | 10.639 | 12.407 | 0.003 | 0.001 | 1.225 | ||
| pg16beta1_o3_native_lto.cx7a27_gcp_c2s30 | 49.779 | 25.168 | 0.178 | 0.029 | 9.345 | 15.500 | 0.159 | ||||
| pg16beta2_o3_native_lto.cx7a27_gcp_c2s30 | 60.849 | 30.248 | 0.189 | 0.023 | 2.477 | 6.214 | 0.158 | ||||
| pg16beta3_o3_native_lto.cx7a27_gcp_c2s30 | 41.258 | 25.646 | 0.174 | 0.035 | 8.055 | 24.831 | 0.176 | ||||
| pg16rc1_o3_native_lto.cx7a27_gcp_c2s30 | 37.965 | 22.054 | 0.191 | 0.033 | 5.184 | 34.572 | 0.254 | ||||
| pg160_o3_native_lto.cx7a27_gcp_c2s30 | 37.103 | 23.281 | 0.191 | 0.036 | 9.183 | 30.206 | 0.208 |
Performance metrics for the DBMS listed above. Some are normalized by throughput, others are not. Legend for results is here.
ips	qps	rps	rmbps	wps	wmbps	rpq	rkbpq	wpi	wkbpi	csps	cpups	cspq	cpupq	dbgb1	dbgb2	rss	maxop	p50	p99	tag
4491	68320	6596	55.6	8921.5	97.4	0.097	0.833	1.986	22.213	198827	54.7	2.910	120	784.2	854.2	71.0	0.036	12386	8838	4000m.pg152_o3_native_lto.cx7a27_gcp_c2s30
6177	69868	9225	77.0	12367.0	133.9	0.132	1.129	2.002	22.195	250487	61.4	3.585	132	785.4	855.5	71.0	0.026	9222	8778	4000m.pg153_o3_native_lto.cx7a27_gcp_c2s30
5976	68500	8901	74.2	11837.6	142.9	0.130	1.110	1.981	24.477	249036	58.3	3.636	128	786.3	856.4	71.0	1.184	9462	8902	4000m.pg154_o3_native_lto.cx7a27_gcp_c2s30
5712	66806	8448	70.7	11325.9	123.7	0.126	1.084	1.983	22.174	233506	58.5	3.495	131	784.6	854.7	71.0	0.026	9126	8586	4000m.pg16beta1_o3_native_lto.cx7a27_gcp_c2s30
6012	61780	8908	74.6	11989.0	132.6	0.144	1.237	1.994	22.586	242402	51.2	3.924	124	785.4	855.5	71.0	0.027	9238	8694	4000m.pg16beta2_o3_native_lto.cx7a27_gcp_c2s30
5545	80311	8163	68.4	10953.8	119.1	0.102	0.872	1.976	21.988	247716	66.5	3.084	124	784.2	854.2	71.0	0.032	10820	8519	4000m.pg16beta3_o3_native_lto.cx7a27_gcp_c2s30
5273	81866	7751	64.9	10384.4	132.5	0.095	0.812	1.969	25.722	245463	70.8	2.998	130	786.1	856.1	71.0	0.036	12322	8774	4000m.pg16rc1_o3_native_lto.cx7a27_gcp_c2s30
5446	86807	7975	67.0	10620.4	115.6	0.092	0.790	1.950	21.744	242019	69.0	2.788	119	785.4	855.4	71.0	0.032	12935	8854	4000m.pg160_o3_native_lto.cx7a27_gcp_c2s30
l.i0
l.i0: load without secondary indexes
Performance metrics for all DBMS, not just the ones listed above. Some are normalized by throughput, others are not. Legend for results is here.
ips	qps	rps	rmbps	wps	wmbps	rpq	rkbpq	wpi	wkbpi	csps	cpups	cspq	cpupq	dbgb1	dbgb2	rss	maxop	p50	p99	tag
1124227	0	562	4.4	1397.1	258.5	0.000	0.004	0.001	0.235	92574	85.3	0.082	11	382.7	452.8	19.0	0.588	143344	89237	4000m.pg152_o3_native_lto.cx7a27_gcp_c2s30
1119194	0	555	4.4	1396.3	258.1	0.000	0.004	0.001	0.236	93021	85.0	0.083	11	382.7	452.8	3.4	0.409	142446	96594	4000m.pg153_o3_native_lto.cx7a27_gcp_c2s30
1108340	0	542	4.3	1384.0	252.3	0.000	0.004	0.001	0.233	92380	84.8	0.083	11	382.7	452.8	8.9	0.551	141147	101223	4000m.pg154_o3_native_lto.cx7a27_gcp_c2s30
1110802	0	556	4.4	1402.2	253.6	0.001	0.004	0.001	0.234	92227	84.9	0.083	11	382.7	452.8	9.1	0.449	141696	97525	4000m.pg16beta1_o3_native_lto.cx7a27_gcp_c2s30
1103448	0	546	4.3	1395.1	251.4	0.000	0.004	0.001	0.233	92151	84.8	0.084	12	382.7	452.8	4.5	0.409	140547	97829	4000m.pg16beta2_o3_native_lto.cx7a27_gcp_c2s30
1099203	0	550	4.3	1375.2	248.7	0.001	0.004	0.001	0.232	92516	84.7	0.084	12	382.7	452.8	4.5	0.401	139894	94497	4000m.pg16beta3_o3_native_lto.cx7a27_gcp_c2s30
1114206	0	559	4.4	1381.9	254.3	0.001	0.004	0.001	0.234	92259	85.2	0.083	11	382.7	452.8	17.8	0.502	141946	95695	4000m.pg16rc1_o3_native_lto.cx7a27_gcp_c2s30
1099203	0	543	4.3	1383.5	249.5	0.000	0.004	0.001	0.232	91593	84.6	0.083	12	382.7	452.8	10.5	0.953	140847	72820	4000m.pg160_o3_native_lto.cx7a27_gcp_c2s30
l.x
l.x: create secondary indexes
Performance metrics for all DBMS, not just the ones listed above. Some are normalized by throughput, others are not. Legend for results is here.
ips	qps	rps	rmbps	wps	wmbps	rpq	rkbpq	wpi	wkbpi	csps	cpups	cspq	cpupq	dbgb1	dbgb2	rss	maxop	p50	p99	tag
1656356	0	3490	760.8	1279.1	285.9	0.002	0.470	0.001	0.177	12648	37.2	0.008	3	735.2	805.2	56.9	0.002	NA	NA	4000m.pg152_o3_native_lto.cx7a27_gcp_c2s30
1668794	0	3576	777.7	1286.6	287.0	0.002	0.477	0.001	0.176	12684	37.2	0.008	3	735.2	805.2	56.9	0.002	NA	NA	4000m.pg153_o3_native_lto.cx7a27_gcp_c2s30
1675084	0	3384	742.3	1281.3	287.6	0.002	0.454	0.001	0.176	12025	38.2	0.007	3	735.2	805.2	56.7	0.010	NA	NA	4000m.pg154_o3_native_lto.cx7a27_gcp_c2s30
1741445	0	2945	672.4	1327.8	302.5	0.002	0.395	0.001	0.178	17410	39.0	0.010	3	735.2	804.9	56.8	0.002	NA	NA	4000m.pg16beta1_o3_native_lto.cx7a27_gcp_c2s30
1766048	0	2974	681.6	1342.1	305.2	0.002	0.395	0.001	0.177	17733	39.2	0.010	3	735.2	804.8	56.8	0.002	NA	NA	4000m.pg16beta2_o3_native_lto.cx7a27_gcp_c2s30
1765269	0	2962	676.7	1360.5	305.6	0.002	0.393	0.001	0.177	18205	39.4	0.010	3	735.2	804.9	56.8	0.024	NA	NA	4000m.pg16beta3_o3_native_lto.cx7a27_gcp_c2s30
1784962	0	2839	658.6	1356.0	309.5	0.002	0.378	0.001	0.178	17389	39.6	0.010	3	735.2	805.2	56.8	0.002	NA	NA	4000m.pg16rc1_o3_native_lto.cx7a27_gcp_c2s30
1746768	0	2886	667.8	1337.0	303.1	0.002	0.391	0.001	0.178	17624	38.9	0.010	3	735.2	804.9	57.0	0.002	NA	NA	4000m.pg160_o3_native_lto.cx7a27_gcp_c2s30
l.i1
l.i1: continue load after secondary indexes created
Performance metrics for all DBMS, not just the ones listed above. Some are normalized by throughput, others are not. Legend for results is here.
ips	qps	rps	rmbps	wps	wmbps	rpq	rkbpq	wpi	wkbpi	csps	cpups	cspq	cpupq	dbgb1	dbgb2	rss	maxop	p50	p99	tag
10698	0	8974	105.0	11848.5	163.4	0.839	10.055	1.108	15.639	23056	42.5	2.155	596	781.9	852.0	69.2	1.654	350	250	4000m.pg152_o3_native_lto.cx7a27_gcp_c2s30
10816	0	7467	90.1	9424.3	132.0	0.690	8.528	0.871	12.494	20165	36.3	1.864	503	782.7	839.8	60.3	0.780	450	300	4000m.pg153_o3_native_lto.cx7a27_gcp_c2s30
11508	0	8292	97.3	11320.2	155.0	0.721	8.660	0.984	13.794	21921	34.4	1.905	448	781.9	851.9	70.4	0.952	250	200	4000m.pg154_o3_native_lto.cx7a27_gcp_c2s30
10279	0	8560	102.0	11696.8	163.1	0.833	10.159	1.138	16.245	22097	41.3	2.150	603	779.6	846.8	23.5	0.884	350	200	4000m.pg16beta1_o3_native_lto.cx7a27_gcp_c2s30
12046	0	8187	93.9	10914.8	152.1	0.680	7.984	0.906	12.930	22077	35.0	1.833	436	780.6	842.2	69.6	0.800	849	450	4000m.pg16beta2_o3_native_lto.cx7a27_gcp_c2s30
10420	0	7188	89.3	9118.1	133.0	0.690	8.779	0.875	13.069	19404	42.6	1.862	613	780.0	850.1	55.6	0.794	250	200	4000m.pg16beta3_o3_native_lto.cx7a27_gcp_c2s30
10579	0	7889	90.9	9804.9	134.1	0.746	8.799	0.927	12.984	20718	37.6	1.958	533	781.5	847.1	27.8	1.272	499	250	4000m.pg16rc1_o3_native_lto.cx7a27_gcp_c2s30
10938	0	7416	88.4	9966.8	138.1	0.678	8.273	0.911	12.931	19913	39.0	1.821	535	780.6	849.3	35.4	0.737	649	400	4000m.pg160_o3_native_lto.cx7a27_gcp_c2s30
q100.1
q100.1: range queries with 100 insert/s per client
Performance metrics for all DBMS, not just the ones listed above. Some are normalized by throughput, others are not. Legend for results is here.
ips	qps	rps	rmbps	wps	wmbps	rpq	rkbpq	wpi	wkbpi	csps	cpups	cspq	cpupq	dbgb1	dbgb2	rss	maxop	p50	p99	tag
798	106073	1421	11.9	1554.0	18.6	0.013	0.115	1.947	23.917	406806	53.2	3.835	75	782.0	850.3	71.0	0.149	13265	12882	4000m.pg152_o3_native_lto.cx7a27_gcp_c2s30
798	107042	1382	11.7	1552.3	19.1	0.013	0.112	1.945	24.549	410248	53.2	3.833	75	782.8	851.6	71.0	0.154	13345	8458	4000m.pg153_o3_native_lto.cx7a27_gcp_c2s30
798	109008	1373	11.6	1547.7	20.9	0.013	0.109	1.939	26.825	417734	53.2	3.832	73	782.1	847.4	71.0	0.058	13393	13154	4000m.pg154_o3_native_lto.cx7a27_gcp_c2s30
798	104975	1344	11.4	1485.4	18.4	0.013	0.112	1.861	23.557	402328	53.2	3.833	76	779.9	845.5	71.0	0.188	12999	12290	4000m.pg16beta1_o3_native_lto.cx7a27_gcp_c2s30
798	104145	1368	11.7	1491.3	18.6	0.013	0.115	1.868	23.815	399312	53.3	3.834	77	780.8	846.1	71.0	0.157	13042	9494	4000m.pg16beta2_o3_native_lto.cx7a27_gcp_c2s30
798	103432	1375	11.7	1498.9	18.5	0.013	0.116	1.878	23.746	396647	53.4	3.835	77	780.2	847.6	71.0	0.154	12834	12248	4000m.pg16beta3_o3_native_lto.cx7a27_gcp_c2s30
798	105571	1337	11.4	1549.2	20.4	0.013	0.111	1.941	26.199	404666	53.1	3.833	75	781.6	850.4	71.0	0.071	13170	12482	4000m.pg16rc1_o3_native_lto.cx7a27_gcp_c2s30
798	104804	1363	11.6	1488.4	18.8	0.013	0.113	1.864	24.160	401660	53.3	3.832	76	780.8	847.9	71.0	0.146	13127	12722	4000m.pg160_o3_native_lto.cx7a27_gcp_c2s30
q500.1
q500.1: range queries with 500 insert/s per client
Performance metrics for all DBMS, not just the ones listed above. Some are normalized by throughput, others are not. Legend for results is here.
ips	qps	rps	rmbps	wps	wmbps	rpq	rkbpq	wpi	wkbpi	csps	cpups	cspq	cpupq	dbgb1	dbgb2	rss	maxop	p50	p99	tag
3992	95458	5949	49.4	7813.6	86.8	0.062	0.530	1.958	22.274	350130	60.7	3.668	95	782.5	852.6	71.0	0.027	11795	11092	4000m.pg152_o3_native_lto.cx7a27_gcp_c2s30
3992	95549	5924	49.3	7684.1	85.6	0.062	0.528	1.925	21.955	349512	61.5	3.658	97	783.3	853.4	71.0	0.024	11930	10740	4000m.pg153_o3_native_lto.cx7a27_gcp_c2s30
3992	99230	5907	49.0	7822.2	96.4	0.060	0.505	1.959	24.730	360258	60.8	3.631	92	783.5	853.5	71.0	0.024	12295	11140	4000m.pg154_o3_native_lto.cx7a27_gcp_c2s30
3992	93500	5909	49.1	7902.1	87.2	0.063	0.538	1.980	22.375	343430	61.1	3.673	98	781.2	851.2	71.0	0.025	11571	10341	4000m.pg16beta1_o3_native_lto.cx7a27_gcp_c2s30
3992	94028	5901	49.1	7889.8	88.7	0.063	0.535	1.977	22.746	367919	56.5	3.913	90	781.8	851.9	71.0	0.024	11683	11172	4000m.pg16beta2_o3_native_lto.cx7a27_gcp_c2s30
3992	87501	5924	49.2	7864.9	86.7	0.068	0.576	1.970	22.246	326548	62.2	3.732	107	781.0	851.1	71.0	0.025	11124	9541	4000m.pg16beta3_o3_native_lto.cx7a27_gcp_c2s30
3992	95385	5896	49.0	7705.6	100.5	0.062	0.526	1.930	25.781	371745	56.9	3.897	89	782.7	852.8	71.0	0.026	11811	10809	4000m.pg16rc1_o3_native_lto.cx7a27_gcp_c2s30
3991	90848	5914	49.2	7846.6	86.9	0.065	0.554	1.966	22.295	352013	58.8	3.875	97	781.9	851.9	71.0	0.023	11315	10105	4000m.pg160_o3_native_lto.cx7a27_gcp_c2s30
q1000.1
q1000.1: range queries with 1000 insert/s per client
Performance metrics for all DBMS, not just the ones listed above. Some are normalized by throughput, others are not. Legend for results is here.
ips	qps	rps	rmbps	wps	wmbps	rpq	rkbpq	wpi	wkbpi	csps	cpups	cspq	cpupq	dbgb1	dbgb2	rss	maxop	p50	p99	tag
4491	68320	6596	55.6	8921.5	97.4	0.097	0.833	1.986	22.213	198827	54.7	2.910	120	784.2	854.2	71.0	0.036	12386	8838	4000m.pg152_o3_native_lto.cx7a27_gcp_c2s30
6177	69868	9225	77.0	12367.0	133.9	0.132	1.129	2.002	22.195	250487	61.4	3.585	132	785.4	855.5	71.0	0.026	9222	8778	4000m.pg153_o3_native_lto.cx7a27_gcp_c2s30
5976	68500	8901	74.2	11837.6	142.9	0.130	1.110	1.981	24.477	249036	58.3	3.636	128	786.3	856.4	71.0	1.184	9462	8902	4000m.pg154_o3_native_lto.cx7a27_gcp_c2s30
5712	66806	8448	70.7	11325.9	123.7	0.126	1.084	1.983	22.174	233506	58.5	3.495	131	784.6	854.7	71.0	0.026	9126	8586	4000m.pg16beta1_o3_native_lto.cx7a27_gcp_c2s30
6012	61780	8908	74.6	11989.0	132.6	0.144	1.237	1.994	22.586	242402	51.2	3.924	124	785.4	855.5	71.0	0.027	9238	8694	4000m.pg16beta2_o3_native_lto.cx7a27_gcp_c2s30
5545	80311	8163	68.4	10953.8	119.1	0.102	0.872	1.976	21.988	247716	66.5	3.084	124	784.2	854.2	71.0	0.032	10820	8519	4000m.pg16beta3_o3_native_lto.cx7a27_gcp_c2s30
5273	81866	7751	64.9	10384.4	132.5	0.095	0.812	1.969	25.722	245463	70.8	2.998	130	786.1	856.1	71.0	0.036	12322	8774	4000m.pg16rc1_o3_native_lto.cx7a27_gcp_c2s30
5446	86807	7975	67.0	10620.4	115.6	0.092	0.790	1.950	21.744	242019	69.0	2.788	119	785.4	855.4	71.0	0.032	12935	8854	4000m.pg160_o3_native_lto.cx7a27_gcp_c2s30
l.i0
- l.i0: load without secondary indexes
- Legend for results is here.
- Each entry lists the percentage of responses that fit in that bucket (slower than max time for previous bucket, faster than min time for next bucket).
Insert response time histogram
256us	1ms	4ms	16ms	64ms	256ms	1s	4s	16s	gt	max	tag
0.000	97.623	2.342	0.028	0.003	0.004	0.001	0.000	0.000	0.000	0.588	pg152_o3_native_lto.cx7a27_gcp_c2s30
0.000	97.538	2.426	0.028	0.004	0.004	nonzero	0.000	0.000	0.000	0.409	pg153_o3_native_lto.cx7a27_gcp_c2s30
0.000	97.325	2.641	0.027	0.003	0.003	nonzero	0.000	0.000	0.000	0.551	pg154_o3_native_lto.cx7a27_gcp_c2s30
0.000	97.561	2.403	0.027	0.004	0.004	nonzero	0.000	0.000	0.000	0.449	pg16beta1_o3_native_lto.cx7a27_gcp_c2s30
0.000	97.656	2.309	0.029	0.003	0.003	nonzero	0.000	0.000	0.000	0.409	pg16beta2_o3_native_lto.cx7a27_gcp_c2s30
0.000	97.538	2.428	0.026	0.004	0.004	nonzero	0.000	0.000	0.000	0.401	pg16beta3_o3_native_lto.cx7a27_gcp_c2s30
0.000	97.636	2.330	0.028	0.003	0.003	nonzero	0.000	0.000	0.000	0.502	pg16rc1_o3_native_lto.cx7a27_gcp_c2s30
0.000	97.569	2.393	0.029	0.004	0.004	0.001	0.000	0.000	0.000	0.953	pg160_o3_native_lto.cx7a27_gcp_c2s30
l.x
- l.x: create secondary indexes
- Legend for results is here.
- Each entry lists the percentage of responses that fit in that bucket (slower than max time for previous bucket, faster than min time for next bucket).
TODO - determine whether there is data for create index response time
l.i1
- l.i1: continue load after secondary indexes created
- Legend for results is here.
- Each entry lists the percentage of responses that fit in that bucket (slower than max time for previous bucket, faster than min time for next bucket).
Insert response time histogram
256us	1ms	4ms	16ms	64ms	256ms	1s	4s	16s	gt	max	tag
0.000	0.000	34.624	40.909	24.439	0.027	0.002	nonzero	0.000	0.000	1.654	pg152_o3_native_lto.cx7a27_gcp_c2s30
0.000	0.000	51.676	25.635	22.678	0.010	0.001	0.000	0.000	0.000	0.780	pg153_o3_native_lto.cx7a27_gcp_c2s30
0.000	0.000	40.787	41.197	17.995	0.020	0.001	0.000	0.000	0.000	0.952	pg154_o3_native_lto.cx7a27_gcp_c2s30
0.000	0.000	31.566	47.289	21.124	0.020	0.001	0.000	0.000	0.000	0.884	pg16beta1_o3_native_lto.cx7a27_gcp_c2s30
0.000	0.000	46.238	33.627	20.119	0.014	0.002	0.000	0.000	0.000	0.800	pg16beta2_o3_native_lto.cx7a27_gcp_c2s30
0.000	0.000	51.105	28.142	20.740	0.012	0.001	0.000	0.000	0.000	0.794	pg16beta3_o3_native_lto.cx7a27_gcp_c2s30
0.000	0.000	46.615	27.383	25.989	0.012	0.001	nonzero	0.000	0.000	1.272	pg16rc1_o3_native_lto.cx7a27_gcp_c2s30
0.000	0.000	42.877	39.241	17.867	0.014	0.001	0.000	0.000	0.000	0.737	pg160_o3_native_lto.cx7a27_gcp_c2s30
Delete response time histogram
256us	1ms	4ms	16ms	64ms	256ms	1s	4s	16s	gt	max	tag
69.341	6.121	0.598	1.996	6.395	15.548	nonzero	0.000	0.000	0.000	0.671	pg152_o3_native_lto.cx7a27_gcp_c2s30
72.355	4.073	0.793	2.240	7.851	12.688	nonzero	0.000	0.000	0.000	0.302	pg153_o3_native_lto.cx7a27_gcp_c2s30
69.471	5.804	0.486	1.607	11.367	11.260	0.005	0.000	0.000	0.000	0.421	pg154_o3_native_lto.cx7a27_gcp_c2s30
68.022	7.214	0.906	2.714	7.518	13.615	0.011	0.000	0.000	0.000	0.553	pg16beta1_o3_native_lto.cx7a27_gcp_c2s30
68.638	6.037	0.497	1.742	11.487	11.597	nonzero	0.000	0.000	0.000	0.532	pg16beta2_o3_native_lto.cx7a27_gcp_c2s30
69.710	6.616	1.017	2.555	6.610	13.386	0.107	0.000	0.000	0.000	0.475	pg16beta3_o3_native_lto.cx7a27_gcp_c2s30
67.573	8.014	0.681	2.134	8.913	12.642	0.042	nonzero	0.000	0.000	1.208	pg16rc1_o3_native_lto.cx7a27_gcp_c2s30
71.105	3.464	0.728	2.239	7.972	14.486	0.006	0.000	0.000	0.000	0.369	pg160_o3_native_lto.cx7a27_gcp_c2s30
q100.1
- q100.1: range queries with 100 insert/s per client
- Legend for results is here.
- Each entry lists the percentage of responses that fit in that bucket (slower than max time for previous bucket, faster than min time for next bucket).
Query response time histogram
256us	1ms	4ms	16ms	64ms	256ms	1s	4s	16s	gt	max	tag
99.902	0.097	0.001	nonzero	nonzero	nonzero	0.000	0.000	0.000	0.000	0.149	pg152_o3_native_lto.cx7a27_gcp_c2s30
99.895	0.104	0.001	nonzero	nonzero	nonzero	0.000	0.000	0.000	0.000	0.154	pg153_o3_native_lto.cx7a27_gcp_c2s30
99.920	0.079	0.001	nonzero	nonzero	0.000	0.000	0.000	0.000	0.000	0.058	pg154_o3_native_lto.cx7a27_gcp_c2s30
99.923	0.076	0.001	nonzero	nonzero	nonzero	0.000	0.000	0.000	0.000	0.188	pg16beta1_o3_native_lto.cx7a27_gcp_c2s30
99.911	0.089	nonzero	nonzero	nonzero	nonzero	0.000	0.000	0.000	0.000	0.157	pg16beta2_o3_native_lto.cx7a27_gcp_c2s30
99.909	0.090	0.001	nonzero	nonzero	nonzero	0.000	0.000	0.000	0.000	0.154	pg16beta3_o3_native_lto.cx7a27_gcp_c2s30
99.922	0.078	0.001	nonzero	nonzero	nonzero	0.000	0.000	0.000	0.000	0.071	pg16rc1_o3_native_lto.cx7a27_gcp_c2s30
99.909	0.090	0.001	nonzero	nonzero	nonzero	0.000	0.000	0.000	0.000	0.146	pg160_o3_native_lto.cx7a27_gcp_c2s30
Insert response time histogram
256us	1ms	4ms	16ms	64ms	256ms	1s	4s	16s	gt	max	tag
0.000	0.000	4.447	11.063	84.487	0.003	0.000	0.000	0.000	0.000	0.072	pg152_o3_native_lto.cx7a27_gcp_c2s30
0.000	0.000	0.004	14.098	85.888	0.009	0.001	0.000	0.000	0.000	0.460	pg153_o3_native_lto.cx7a27_gcp_c2s30
0.000	0.000	4.647	10.548	84.786	0.020	0.000	0.000	0.000	0.000	0.158	pg154_o3_native_lto.cx7a27_gcp_c2s30
0.000	0.000	0.162	15.101	84.734	0.003	0.000	0.000	0.000	0.000	0.119	pg16beta1_o3_native_lto.cx7a27_gcp_c2s30
0.000	0.000	5.382	7.401	87.216	0.001	0.000	0.000	0.000	0.000	0.084	pg16beta2_o3_native_lto.cx7a27_gcp_c2s30
0.000	0.000	3.018	11.003	85.973	0.006	0.000	0.000	0.000	0.000	0.106	pg16beta3_o3_native_lto.cx7a27_gcp_c2s30
0.000	0.000	0.006	16.148	83.840	0.005	0.000	0.000	0.000	0.000	0.132	pg16rc1_o3_native_lto.cx7a27_gcp_c2s30
0.000	0.000	0.952	13.109	85.926	0.013	0.000	0.000	0.000	0.000	0.254	pg160_o3_native_lto.cx7a27_gcp_c2s30
Delete response time histogram
256us	1ms	4ms	16ms	64ms	256ms	1s	4s	16s	gt	max	tag
56.229	37.779	1.849	4.142	0.001	0.000	0.000	0.000	0.000	0.000	0.019	pg152_o3_native_lto.cx7a27_gcp_c2s30
40.080	27.979	18.944	12.997	0.001	0.000	0.000	0.000	0.000	0.000	0.019	pg153_o3_native_lto.cx7a27_gcp_c2s30
58.477	30.595	6.216	4.707	0.004	0.000	0.000	0.000	0.000	0.000	0.022	pg154_o3_native_lto.cx7a27_gcp_c2s30
48.469	33.853	10.627	7.049	0.003	0.000	0.000	0.000	0.000	0.000	0.024	pg16beta1_o3_native_lto.cx7a27_gcp_c2s30
35.272	31.615	16.049	17.058	0.005	0.000	0.000	0.000	0.000	0.000	0.027	pg16beta2_o3_native_lto.cx7a27_gcp_c2s30
41.202	35.166	5.500	15.615	2.517	0.000	0.000	0.000	0.000	0.000	0.029	pg16beta3_o3_native_lto.cx7a27_gcp_c2s30
63.411	36.403	0.185	0.000	0.001	0.000	0.000	0.000	0.000	0.000	0.016	pg16rc1_o3_native_lto.cx7a27_gcp_c2s30
41.762	36.163	10.860	11.210	0.004	0.000	0.000	0.000	0.000	0.000	0.020	pg160_o3_native_lto.cx7a27_gcp_c2s30
q500.1
- q500.1: range queries with 500 insert/s per client
- Legend for results is here.
- Each entry lists the percentage of responses that fit in that bucket (slower than max time for previous bucket, faster than min time for next bucket).
Query response time histogram
256us	1ms	4ms	16ms	64ms	256ms	1s	4s	16s	gt	max	tag
99.867	0.128	0.004	0.001	nonzero	0.000	0.000	0.000	0.000	0.000	0.027	pg152_o3_native_lto.cx7a27_gcp_c2s30
99.861	0.133	0.004	0.001	nonzero	0.000	0.000	0.000	0.000	0.000	0.024	pg153_o3_native_lto.cx7a27_gcp_c2s30
99.878	0.117	0.004	0.001	nonzero	0.000	0.000	0.000	0.000	0.000	0.024	pg154_o3_native_lto.cx7a27_gcp_c2s30
99.836	0.159	0.004	0.001	nonzero	0.000	0.000	0.000	0.000	0.000	0.025	pg16beta1_o3_native_lto.cx7a27_gcp_c2s30
99.902	0.096	0.002	nonzero	nonzero	0.000	0.000	0.000	0.000	0.000	0.024	pg16beta2_o3_native_lto.cx7a27_gcp_c2s30
99.801	0.193	0.005	0.001	nonzero	0.000	0.000	0.000	0.000	0.000	0.025	pg16beta3_o3_native_lto.cx7a27_gcp_c2s30
99.878	0.120	0.002	nonzero	nonzero	0.000	0.000	0.000	0.000	0.000	0.026	pg16rc1_o3_native_lto.cx7a27_gcp_c2s30
99.872	0.125	0.003	0.001	nonzero	0.000	0.000	0.000	0.000	0.000	0.023	pg160_o3_native_lto.cx7a27_gcp_c2s30
Insert response time histogram
256us	1ms	4ms	16ms	64ms	256ms	1s	4s	16s	gt	max	tag
0.000	0.000	0.000	11.170	88.830	0.001	0.000	0.000	0.000	0.000	0.071	pg152_o3_native_lto.cx7a27_gcp_c2s30
0.000	0.000	0.000	14.407	85.592	nonzero	0.000	0.000	0.000	0.000	0.080	pg153_o3_native_lto.cx7a27_gcp_c2s30
0.000	0.000	0.000	18.431	81.568	nonzero	0.000	0.000	0.000	0.000	0.067	pg154_o3_native_lto.cx7a27_gcp_c2s30
0.000	0.000	0.000	12.186	87.814	0.000	0.000	0.000	0.000	0.000	0.059	pg16beta1_o3_native_lto.cx7a27_gcp_c2s30
0.000	0.000	0.000	5.110	94.890	0.000	0.000	0.000	0.000	0.000	0.058	pg16beta2_o3_native_lto.cx7a27_gcp_c2s30
0.000	0.000	0.000	8.037	91.963	0.000	0.000	0.000	0.000	0.000	0.062	pg16beta3_o3_native_lto.cx7a27_gcp_c2s30
0.000	0.000	0.000	4.414	95.586	nonzero	0.000	0.000	0.000	0.000	0.065	pg16rc1_o3_native_lto.cx7a27_gcp_c2s30
0.000	0.000	0.000	6.451	93.549	0.000	0.000	0.000	0.000	0.000	0.062	pg160_o3_native_lto.cx7a27_gcp_c2s30
Delete response time histogram
256us	1ms	4ms	16ms	64ms	256ms	1s	4s	16s	gt	max	tag
55.251	9.609	0.165	3.745	31.224	0.006	0.000	0.000	0.000	0.000	0.086	pg152_o3_native_lto.cx7a27_gcp_c2s30
43.493	8.169	0.124	10.147	38.060	0.006	0.000	0.000	0.000	0.000	0.080	pg153_o3_native_lto.cx7a27_gcp_c2s30
50.390	8.203	0.173	6.323	34.910	0.001	0.000	0.000	0.000	0.000	0.078	pg154_o3_native_lto.cx7a27_gcp_c2s30
50.678	10.140	0.154	5.808	33.216	0.004	0.000	0.000	0.000	0.000	0.082	pg16beta1_o3_native_lto.cx7a27_gcp_c2s30
82.760	11.738	0.173	5.281	0.048	0.000	0.000	0.000	0.000	0.000	0.033	pg16beta2_o3_native_lto.cx7a27_gcp_c2s30
48.445	8.999	0.138	3.863	38.547	0.008	0.000	0.000	0.000	0.000	0.082	pg16beta3_o3_native_lto.cx7a27_gcp_c2s30
85.633	10.142	0.205	0.010	4.010	0.000	0.000	0.000	0.000	0.000	0.051	pg16rc1_o3_native_lto.cx7a27_gcp_c2s30
69.432	10.276	0.143	5.422	14.727	0.000	0.000	0.000	0.000	0.000	0.053	pg160_o3_native_lto.cx7a27_gcp_c2s30
q1000.1
- q1000.1: range queries with 1000 insert/s per client
- Legend for results is here.
- Each entry lists the percentage of responses that fit in that bucket (slower than max time for previous bucket, faster than min time for next bucket).
Query response time histogram
256us	1ms	4ms	16ms	64ms	256ms	1s	4s	16s	gt	max	tag
99.771	0.218	0.009	0.003	nonzero	0.000	0.000	0.000	0.000	0.000	0.036	pg152_o3_native_lto.cx7a27_gcp_c2s30
99.667	0.321	0.009	0.003	nonzero	0.000	0.000	0.000	0.000	0.000	0.026	pg153_o3_native_lto.cx7a27_gcp_c2s30
99.714	0.275	0.008	0.003	nonzero	nonzero	nonzero	nonzero	0.000	0.000	1.184	pg154_o3_native_lto.cx7a27_gcp_c2s30
99.572	0.418	0.008	0.002	nonzero	0.000	0.000	0.000	0.000	0.000	0.026	pg16beta1_o3_native_lto.cx7a27_gcp_c2s30
99.525	0.467	0.006	0.001	nonzero	0.000	0.000	0.000	0.000	0.000	0.027	pg16beta2_o3_native_lto.cx7a27_gcp_c2s30
99.734	0.256	0.008	0.003	nonzero	0.000	0.000	0.000	0.000	0.000	0.032	pg16beta3_o3_native_lto.cx7a27_gcp_c2s30
99.715	0.274	0.008	0.003	nonzero	0.000	0.000	0.000	0.000	0.000	0.036	pg16rc1_o3_native_lto.cx7a27_gcp_c2s30
99.804	0.187	0.007	0.002	nonzero	0.000	0.000	0.000	0.000	0.000	0.032	pg160_o3_native_lto.cx7a27_gcp_c2s30
Insert response time histogram
256us	1ms	4ms	16ms	64ms	256ms	1s	4s	16s	gt	max	tag
0.000	0.000	nonzero	29.928	70.071	0.001	0.000	0.000	0.000	0.000	0.080	pg152_o3_native_lto.cx7a27_gcp_c2s30
0.000	0.000	0.000	15.694	84.306	0.000	0.000	0.000	0.000	0.000	0.063	pg153_o3_native_lto.cx7a27_gcp_c2s30
0.000	0.000	0.000	16.532	83.452	0.009	0.005	0.001	0.000	0.000	1.223	pg154_o3_native_lto.cx7a27_gcp_c2s30
0.000	0.000	0.000	13.830	86.170	0.000	0.000	0.000	0.000	0.000	0.062	pg16beta1_o3_native_lto.cx7a27_gcp_c2s30
0.000	0.000	0.042	5.563	94.395	nonzero	0.000	0.000	0.000	0.000	0.071	pg16beta2_o3_native_lto.cx7a27_gcp_c2s30
0.000	0.000	0.000	24.749	75.251	nonzero	0.000	0.000	0.000	0.000	0.071	pg16beta3_o3_native_lto.cx7a27_gcp_c2s30
0.000	0.000	0.000	20.297	79.702	0.001	0.000	0.000	0.000	0.000	0.092	pg16rc1_o3_native_lto.cx7a27_gcp_c2s30
0.000	0.000	0.000	34.028	65.972	0.001	0.000	0.000	0.000	0.000	0.070	pg160_o3_native_lto.cx7a27_gcp_c2s30
Delete response time histogram
256us	1ms	4ms	16ms	64ms	256ms	1s	4s	16s	gt	max	tag
40.406	18.234	0.143	0.023	16.606	24.589	nonzero	0.000	0.000	0.000	0.432	pg152_o3_native_lto.cx7a27_gcp_c2s30
56.969	17.796	0.134	0.024	11.606	13.470	0.000	0.000	0.000	0.000	0.229	pg153_o3_native_lto.cx7a27_gcp_c2s30
61.245	15.558	0.123	0.025	10.639	12.407	0.003	0.001	0.000	0.000	1.225	pg154_o3_native_lto.cx7a27_gcp_c2s30
49.779	25.168	0.178	0.029	9.345	15.500	0.000	0.000	0.000	0.000	0.159	pg16beta1_o3_native_lto.cx7a27_gcp_c2s30
60.849	30.248	0.189	0.023	2.477	6.214	0.000	0.000	0.000	0.000	0.158	pg16beta2_o3_native_lto.cx7a27_gcp_c2s30
41.258	25.646	0.174	0.035	8.055	24.831	0.000	0.000	0.000	0.000	0.176	pg16beta3_o3_native_lto.cx7a27_gcp_c2s30
37.965	22.054	0.191	0.033	5.184	34.572	0.000	0.000	0.000	0.000	0.254	pg16rc1_o3_native_lto.cx7a27_gcp_c2s30
37.103	23.281	0.191	0.036	9.183	30.206	0.000	0.000	0.000	0.000	0.208	pg160_o3_native_lto.cx7a27_gcp_c2s30