Introduction
This is a report for the insert benchmark with 160M docs and 8 client(s). It is generated by scripts (bash, awk, sed) and Tufte might not be impressed. An overview of the insert benchmark is here and a short update is here. Below, by DBMS, I mean DBMS+version.config. An example is my8020.c10b40 where my means MySQL, 8020 is version 8.0.20 and c10b40 is the name for the configuration file.
The test server is a c2-standard-30 with 15 cores, hyperthreads disabled, 120G RAM and XFS with SW RAID 0 across 4 NVMe SSD. The benchmark was run with 8 clients and there were 1 or 3 connections per client (1 for queries or inserts without rate limits, 1+1 for rate limited inserts+deletes). It uses 8 tables, 1 per client. It loads 20M rows per table without secondary indexes, creates secondary indexes, then inserts 300M rows per table with a delete per insert to avoid growing the table. It then does 3 read+write tests for 7200s each that do queries as fast as possible with 100, 500 and then 1000 inserts/second/client concurrent with the queries. There are also deletes to match the inserts and avoid growing the table. The database is cached by Postgres. Clients and the DBMS share one server. The per-database configs are in the per-database subdirectories here.
The tested DBMS are:
- pg152_o3_native_lto.cx7a27_gcp_c2s30 - Postgres 15.2, o3_native_lto build, cx7a27_gcp_c2s30 config
- pg153_o3_native_lto.cx7a27_gcp_c2s30 - Postgres 15.3, o3_native_lto build, cx7a27_gcp_c2s30 config
- pg154_o3_native_lto.cx7a27_gcp_c2s30 - Postgres 15.4, o3_native_lto build, cx7a27_gcp_c2s30 config
- pg16beta1_o3_native_lto.cx7a27_gcp_c2s30 - Postgres 16 beta1, o3_native_lto build, cx7a27_gcp_c2s30 config
- pg16beta2_o3_native_lto.cx7a27_gcp_c2s30 - Postgres 16 beta2, o3_native_lto build, cx7a27_gcp_c2s30 config
- pg16beta3_o3_native_lto.cx7a27_gcp_c2s30 - Postgres 16 beta3, o3_native_lto build, cx7a27_gcp_c2s30 config
- pg16rc1_o3_native_lto.cx7a27_gcp_c2s30 - Postgres 16 rc1, o3_native_lto build, cx7a27_gcp_c2s30 config
- pg160_o3_native_lto.cx7a27_gcp_c2s30 - Postgres 16.0, o3_native_lto build, cx7a27_gcp_c2s30 config
Contents
- Summary
- l.i0: load without secondary indexes
- l.x: create secondary indexes
- l.i1: continue load after secondary indexes created
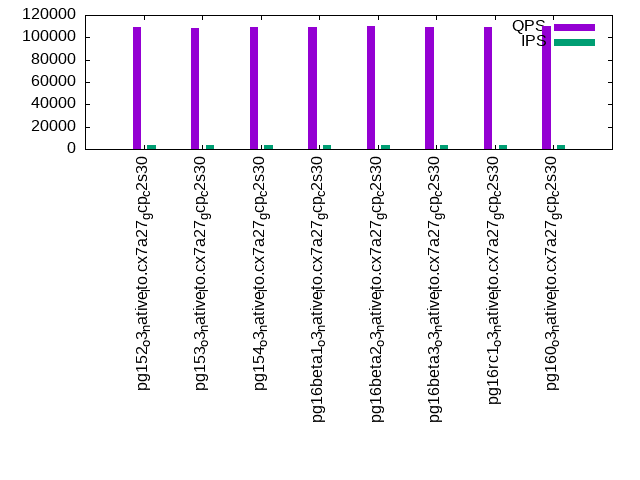
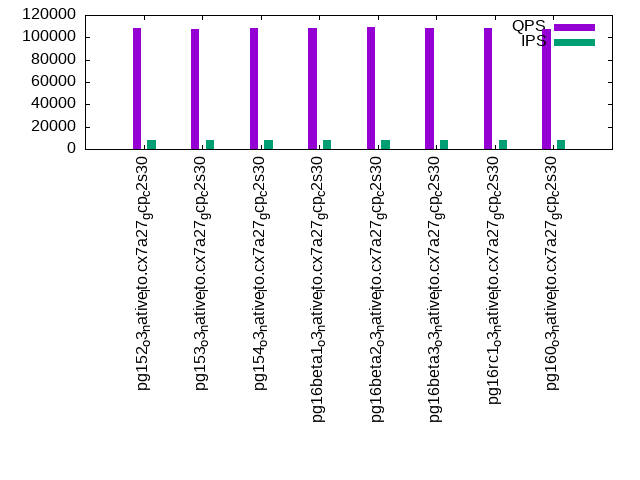
- q100.1: range queries with 100 insert/s per client
- q500.1: range queries with 500 insert/s per client
- q1000.1: range queries with 1000 insert/s per client
Summary
The numbers are inserts/s for l.i0 and l.i1, indexed docs (or rows) /s for l.x and queries/s for q*.2. The values are the average rate over the entire test for inserts (IPS) and queries (QPS). The range of values for IPS and QPS is split into 3 parts: bottom 25%, middle 50%, top 25%. Values in the bottom 25% have a red background, values in the top 25% have a green background and values in the middle have no color. A gray background is used for values that can be ignored because the DBMS did not sustain the target insert rate. Red backgrounds are not used when the minimum value is within 80% of the max value.
| dbms | l.i0 | l.x | l.i1 | q100.1 | q500.1 | q1000.1 |
|---|---|---|---|---|---|---|
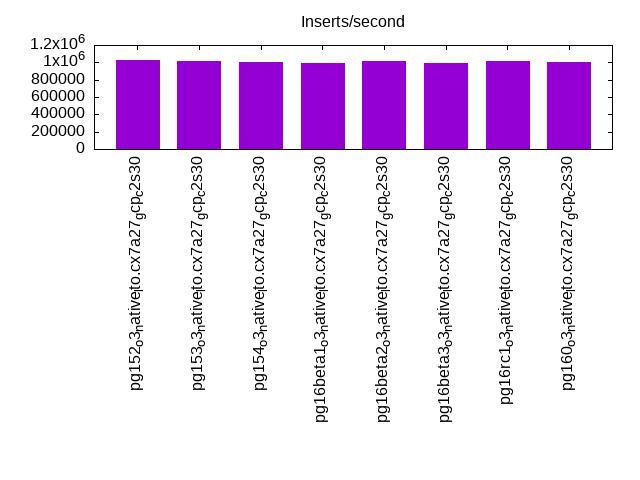
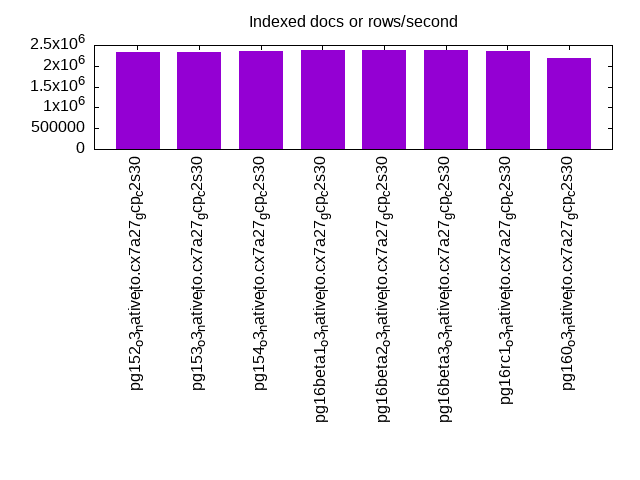
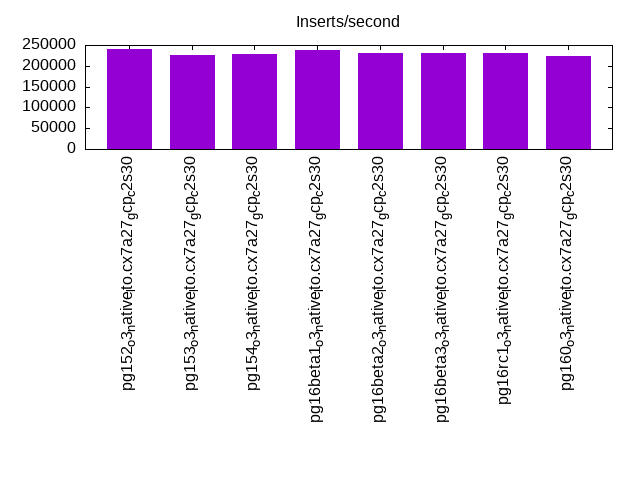
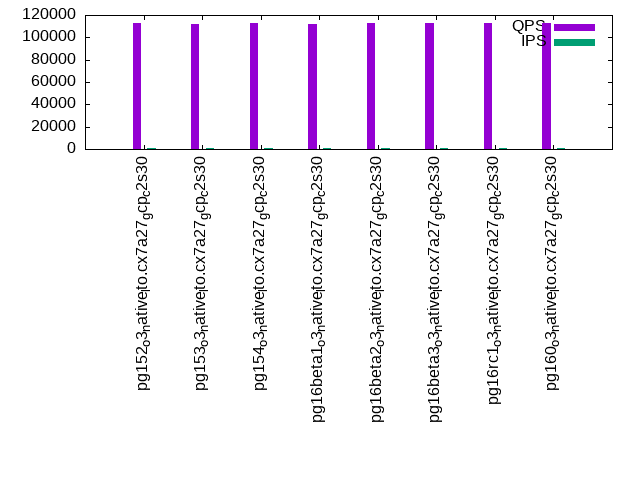
| pg152_o3_native_lto.cx7a27_gcp_c2s30 | 1025641 | 2320290 | 240577 | 113260 | 109208 | 108046 |
| pg153_o3_native_lto.cx7a27_gcp_c2s30 | 1012658 | 2320290 | 225225 | 112255 | 108780 | 107108 |
| pg154_o3_native_lto.cx7a27_gcp_c2s30 | 1000000 | 2354412 | 228397 | 112526 | 109057 | 107912 |
| pg16beta1_o3_native_lto.cx7a27_gcp_c2s30 | 987654 | 2389552 | 237624 | 111648 | 109118 | 108317 |
| pg16beta2_o3_native_lto.cx7a27_gcp_c2s30 | 1012658 | 2389552 | 231080 | 113283 | 109922 | 109074 |
| pg16beta3_o3_native_lto.cx7a27_gcp_c2s30 | 993789 | 2389552 | 231481 | 112842 | 109647 | 108294 |
| pg16rc1_o3_native_lto.cx7a27_gcp_c2s30 | 1012658 | 2354412 | 231258 | 113090 | 109345 | 108139 |
| pg160_o3_native_lto.cx7a27_gcp_c2s30 | 1000000 | 2193151 | 224278 | 113084 | 110163 | 107879 |
This table has relative throughput, throughput for the DBMS relative to the DBMS in the first line, using the absolute throughput from the previous table. Values less than 0.95 have a yellow background. Values greater than 1.05 have a blue background.
| dbms | l.i0 | l.x | l.i1 | q100.1 | q500.1 | q1000.1 |
|---|---|---|---|---|---|---|
| pg152_o3_native_lto.cx7a27_gcp_c2s30 | 1.00 | 1.00 | 1.00 | 1.00 | 1.00 | 1.00 |
| pg153_o3_native_lto.cx7a27_gcp_c2s30 | 0.99 | 1.00 | 0.94 | 0.99 | 1.00 | 0.99 |
| pg154_o3_native_lto.cx7a27_gcp_c2s30 | 0.98 | 1.01 | 0.95 | 0.99 | 1.00 | 1.00 |
| pg16beta1_o3_native_lto.cx7a27_gcp_c2s30 | 0.96 | 1.03 | 0.99 | 0.99 | 1.00 | 1.00 |
| pg16beta2_o3_native_lto.cx7a27_gcp_c2s30 | 0.99 | 1.03 | 0.96 | 1.00 | 1.01 | 1.01 |
| pg16beta3_o3_native_lto.cx7a27_gcp_c2s30 | 0.97 | 1.03 | 0.96 | 1.00 | 1.00 | 1.00 |
| pg16rc1_o3_native_lto.cx7a27_gcp_c2s30 | 0.99 | 1.01 | 0.96 | 1.00 | 1.00 | 1.00 |
| pg160_o3_native_lto.cx7a27_gcp_c2s30 | 0.98 | 0.95 | 0.93 | 1.00 | 1.01 | 1.00 |
This lists the average rate of inserts/s for the tests that do inserts concurrent with queries. For such tests the query rate is listed in the table above. The read+write tests are setup so that the insert rate should match the target rate every second. Cells that are not at least 95% of the target have a red background to indicate a failure to satisfy the target.
| dbms | q100.1 | q500.1 | q1000.1 |
|---|---|---|---|
| pg152_o3_native_lto.cx7a27_gcp_c2s30 | 798 | 3991 | 7984 |
| pg153_o3_native_lto.cx7a27_gcp_c2s30 | 798 | 3992 | 7983 |
| pg154_o3_native_lto.cx7a27_gcp_c2s30 | 798 | 3992 | 7984 |
| pg16beta1_o3_native_lto.cx7a27_gcp_c2s30 | 798 | 3992 | 7983 |
| pg16beta2_o3_native_lto.cx7a27_gcp_c2s30 | 798 | 3991 | 7984 |
| pg16beta3_o3_native_lto.cx7a27_gcp_c2s30 | 798 | 3992 | 7983 |
| pg16rc1_o3_native_lto.cx7a27_gcp_c2s30 | 798 | 3992 | 7984 |
| pg160_o3_native_lto.cx7a27_gcp_c2s30 | 798 | 3991 | 7984 |
| target | 800 | 4000 | 8000 |
l.i0
l.i0: load without secondary indexes. Graphs for performance per 1-second interval are here.
Average throughput:
Insert response time histogram: each cell has the percentage of responses that take <= the time in the header and max is the max response time in seconds. For the max column values in the top 25% of the range have a red background and in the bottom 25% of the range have a green background. The red background is not used when the min value is within 80% of the max value.
| dbms | 256us | 1ms | 4ms | 16ms | 64ms | 256ms | 1s | 4s | 16s | gt | max |
|---|---|---|---|---|---|---|---|---|---|---|---|
| pg152_o3_native_lto.cx7a27_gcp_c2s30 | 97.886 | 2.062 | 0.043 | 0.001 | 0.006 | 0.002 | 0.299 | ||||
| pg153_o3_native_lto.cx7a27_gcp_c2s30 | 97.944 | 2.002 | 0.043 | 0.002 | 0.008 | 0.001 | 0.274 | ||||
| pg154_o3_native_lto.cx7a27_gcp_c2s30 | 97.788 | 2.160 | 0.044 | 0.007 | 0.001 | 0.311 | |||||
| pg16beta1_o3_native_lto.cx7a27_gcp_c2s30 | 98.021 | 1.925 | 0.043 | nonzero | 0.010 | 0.001 | 0.332 | ||||
| pg16beta2_o3_native_lto.cx7a27_gcp_c2s30 | 98.200 | 1.746 | 0.044 | 0.002 | 0.007 | 0.001 | 0.726 | ||||
| pg16beta3_o3_native_lto.cx7a27_gcp_c2s30 | 98.140 | 1.805 | 0.046 | 0.002 | 0.004 | 0.002 | 0.286 | ||||
| pg16rc1_o3_native_lto.cx7a27_gcp_c2s30 | 98.256 | 1.691 | 0.045 | 0.001 | 0.007 | 0.201 | |||||
| pg160_o3_native_lto.cx7a27_gcp_c2s30 | 98.101 | 1.830 | 0.055 | 0.003 | 0.008 | 0.002 | 0.397 |
Performance metrics for the DBMS listed above. Some are normalized by throughput, others are not. Legend for results is here.
ips	qps	rps	rmbps	wps	wmbps	rpq	rkbpq	wpi	wkbpi	csps	cpups	cspq	cpupq	dbgb1	dbgb2	rss	maxop	p50	p99	tag
1025641	0	0	0.0	1003.5	334.3	0.000	0.000	0.001	0.334	85489	77.5	0.083	11	15.3	41.4	1.7	0.299	145242	38857	160m.pg152_o3_native_lto.cx7a27_gcp_c2s30
1012658	0	0	0.0	1000.2	335.3	0.000	0.000	0.001	0.339	85948	77.8	0.085	12	15.3	41.4	4.8	0.274	143745	53341	160m.pg153_o3_native_lto.cx7a27_gcp_c2s30
1000000	0	0	0.0	970.9	326.5	0.000	0.000	0.001	0.334	84913	76.5	0.085	11	15.3	41.4	5.3	0.311	141047	46550	160m.pg154_o3_native_lto.cx7a27_gcp_c2s30
987654	0	0	0.0	972.8	325.9	0.000	0.000	0.001	0.338	83564	77.1	0.085	12	15.3	41.4	1.7	0.332	140946	55459	160m.pg16beta1_o3_native_lto.cx7a27_gcp_c2s30
1012658	0	0	0.0	997.4	335.5	0.000	0.000	0.001	0.339	85279	77.9	0.084	12	15.3	41.4	1.7	0.726	143144	54940	160m.pg16beta2_o3_native_lto.cx7a27_gcp_c2s30
993789	0	0	0.0	972.3	326.2	0.000	0.000	0.001	0.336	84087	76.9	0.085	12	15.3	41.4	1.7	0.286	141041	63930	160m.pg16beta3_o3_native_lto.cx7a27_gcp_c2s30
1012658	0	0	0.0	1000.9	336.5	0.000	0.000	0.001	0.340	84990	78.2	0.084	12	15.3	41.4	1.7	0.201	143040	76143	160m.pg16rc1_o3_native_lto.cx7a27_gcp_c2s30
1000000	0	0	0.0	968.2	331.3	0.000	0.000	0.001	0.339	81914	76.6	0.082	11	15.3	41.4	1.4	0.397	142147	81512	160m.pg160_o3_native_lto.cx7a27_gcp_c2s30
l.x
l.x: create secondary indexes.
Average throughput:
Performance metrics for the DBMS listed above. Some are normalized by throughput, others are not. Legend for results is here.
ips	qps	rps	rmbps	wps	wmbps	rpq	rkbpq	wpi	wkbpi	csps	cpups	cspq	cpupq	dbgb1	dbgb2	rss	maxop	p50	p99	tag
2320290	0	0	0.0	882.2	399.2	0.000	0.000	0.000	0.176	7473	41.9	0.003	3	29.4	63.3	13.2	0.002	NA	NA	160m.pg152_o3_native_lto.cx7a27_gcp_c2s30
2320290	0	0	0.0	888.0	401.5	0.000	0.000	0.000	0.177	7643	41.9	0.003	3	29.4	63.3	13.2	0.002	NA	NA	160m.pg153_o3_native_lto.cx7a27_gcp_c2s30
2354412	0	0	0.0	903.1	405.5	0.000	0.000	0.000	0.176	7981	41.4	0.003	3	29.4	63.4	13.2	0.002	NA	NA	160m.pg154_o3_native_lto.cx7a27_gcp_c2s30
2389552	0	0	0.0	941.8	417.7	0.000	0.000	0.000	0.179	8339	41.1	0.003	3	29.4	63.4	13.2	0.002	NA	NA	160m.pg16beta1_o3_native_lto.cx7a27_gcp_c2s30
2389552	0	0	0.0	968.8	426.8	0.000	0.000	0.000	0.183	7975	40.7	0.003	3	29.4	63.4	13.2	0.002	NA	NA	160m.pg16beta2_o3_native_lto.cx7a27_gcp_c2s30
2389552	0	0	0.0	946.6	415.2	0.000	0.000	0.000	0.178	8347	41.2	0.003	3	29.4	63.4	13.2	0.002	NA	NA	160m.pg16beta3_o3_native_lto.cx7a27_gcp_c2s30
2354412	0	0	0.0	934.2	413.8	0.000	0.000	0.000	0.180	7090	41.3	0.003	3	29.4	63.3	13.2	0.002	NA	NA	160m.pg16rc1_o3_native_lto.cx7a27_gcp_c2s30
2193151	0	0	0.0	871.6	387.2	0.000	0.000	0.000	0.181	7188	38.6	0.003	3	29.4	63.4	13.2	0.002	NA	NA	160m.pg160_o3_native_lto.cx7a27_gcp_c2s30
l.i1
l.i1: continue load after secondary indexes created. Graphs for performance per 1-second interval are here.
Average throughput:
Insert response time histogram: each cell has the percentage of responses that take <= the time in the header and max is the max response time in seconds. For the max column values in the top 25% of the range have a red background and in the bottom 25% of the range have a green background. The red background is not used when the min value is within 80% of the max value.
| dbms | 256us | 1ms | 4ms | 16ms | 64ms | 256ms | 1s | 4s | 16s | gt | max |
|---|---|---|---|---|---|---|---|---|---|---|---|
| pg152_o3_native_lto.cx7a27_gcp_c2s30 | 0.015 | 99.768 | 0.155 | 0.058 | 0.004 | nonzero | 0.385 | ||||
| pg153_o3_native_lto.cx7a27_gcp_c2s30 | 0.264 | 99.512 | 0.168 | 0.053 | 0.003 | nonzero | 0.911 | ||||
| pg154_o3_native_lto.cx7a27_gcp_c2s30 | 0.036 | 99.742 | 0.170 | 0.048 | 0.003 | nonzero | 0.335 | ||||
| pg16beta1_o3_native_lto.cx7a27_gcp_c2s30 | 0.248 | 99.526 | 0.164 | 0.058 | 0.004 | 0.218 | |||||
| pg16beta2_o3_native_lto.cx7a27_gcp_c2s30 | 0.252 | 99.527 | 0.164 | 0.054 | 0.003 | nonzero | 0.772 | ||||
| pg16beta3_o3_native_lto.cx7a27_gcp_c2s30 | 0.288 | 99.496 | 0.164 | 0.048 | 0.003 | 0.202 | |||||
| pg16rc1_o3_native_lto.cx7a27_gcp_c2s30 | 0.349 | 99.431 | 0.163 | 0.053 | 0.003 | 0.191 | |||||
| pg160_o3_native_lto.cx7a27_gcp_c2s30 | 0.392 | 99.390 | 0.168 | 0.046 | 0.003 | nonzero | 0.262 |
Delete response time histogram: each cell has the percentage of responses that take <= the time in the header and max is the max response time in seconds. For the max column values in the top 25% of the range have a red background and in the bottom 25% of the range have a green background. The red background is not used when the min value is within 80% of the max value.
| dbms | 256us | 1ms | 4ms | 16ms | 64ms | 256ms | 1s | 4s | 16s | gt | max |
|---|---|---|---|---|---|---|---|---|---|---|---|
| pg152_o3_native_lto.cx7a27_gcp_c2s30 | 78.178 | 8.165 | 11.483 | 2.153 | 0.018 | 0.002 | nonzero | 0.383 | |||
| pg153_o3_native_lto.cx7a27_gcp_c2s30 | 77.857 | 8.726 | 10.595 | 2.806 | 0.015 | 0.002 | nonzero | 0.697 | |||
| pg154_o3_native_lto.cx7a27_gcp_c2s30 | 78.645 | 7.580 | 10.625 | 3.132 | 0.016 | 0.002 | nonzero | 0.280 | |||
| pg16beta1_o3_native_lto.cx7a27_gcp_c2s30 | 76.510 | 9.534 | 11.945 | 1.992 | 0.017 | 0.002 | 0.219 | ||||
| pg16beta2_o3_native_lto.cx7a27_gcp_c2s30 | 78.345 | 8.067 | 10.740 | 2.829 | 0.018 | 0.002 | nonzero | 0.770 | |||
| pg16beta3_o3_native_lto.cx7a27_gcp_c2s30 | 78.202 | 7.923 | 11.219 | 2.636 | 0.017 | 0.002 | 0.230 | ||||
| pg16rc1_o3_native_lto.cx7a27_gcp_c2s30 | 78.159 | 7.970 | 11.051 | 2.801 | 0.017 | 0.002 | 0.243 | ||||
| pg160_o3_native_lto.cx7a27_gcp_c2s30 | 78.367 | 7.777 | 10.766 | 3.069 | 0.019 | 0.002 | nonzero | 0.262 |
Performance metrics for the DBMS listed above. Some are normalized by throughput, others are not. Legend for results is here.
ips	qps	rps	rmbps	wps	wmbps	rpq	rkbpq	wpi	wkbpi	csps	cpups	cspq	cpupq	dbgb1	dbgb2	rss	maxop	p50	p99	tag
240577	0	0	0.0	1146.5	187.5	0.000	0.000	0.005	0.798	93513	78.9	0.389	49	41.8	111.9	30.5	0.385	35117	6842	160m.pg152_o3_native_lto.cx7a27_gcp_c2s30
225225	0	0	0.0	1087.0	175.0	0.000	0.000	0.005	0.796	88071	75.2	0.391	50	42.1	112.1	29.4	0.911	34812	5094	160m.pg153_o3_native_lto.cx7a27_gcp_c2s30
228397	0	0	0.0	1086.1	176.8	0.000	0.000	0.005	0.793	88476	77.4	0.387	51	41.9	112.0	32.1	0.335	35124	5996	160m.pg154_o3_native_lto.cx7a27_gcp_c2s30
237624	0	0	0.0	1136.5	184.8	0.000	0.000	0.005	0.796	92527	76.8	0.389	48	41.8	111.9	24.5	0.218	34862	6797	160m.pg16beta1_o3_native_lto.cx7a27_gcp_c2s30
231080	0	0	0.0	1100.2	178.2	0.000	0.000	0.005	0.790	90916	76.7	0.393	50	41.9	112.0	19.4	0.772	35412	5096	160m.pg16beta2_o3_native_lto.cx7a27_gcp_c2s30
231481	0	0	0.0	1102.6	178.4	0.000	0.000	0.005	0.789	91011	76.3	0.393	49	41.9	111.9	25.9	0.202	35412	6193	160m.pg16beta3_o3_native_lto.cx7a27_gcp_c2s30
231258	0	0	0.0	1107.3	178.6	0.000	0.000	0.005	0.791	91150	76.4	0.394	50	41.8	111.9	29.5	0.191	35561	5194	160m.pg16rc1_o3_native_lto.cx7a27_gcp_c2s30
224278	0	0	0.0	1066.3	173.2	0.000	0.000	0.005	0.791	88176	74.5	0.393	50	41.8	111.9	27.8	0.262	35511	4845	160m.pg160_o3_native_lto.cx7a27_gcp_c2s30
q100.1
q100.1: range queries with 100 insert/s per client. Graphs for performance per 1-second interval are here.
Average throughput:
Query response time histogram: each cell has the percentage of responses that take <= the time in the header and max is the max response time in seconds. For max values in the top 25% of the range have a red background and in the bottom 25% of the range have a green background. The red background is not used when the min value is within 80% of the max value.
| dbms | 256us | 1ms | 4ms | 16ms | 64ms | 256ms | 1s | 4s | 16s | gt | max |
|---|---|---|---|---|---|---|---|---|---|---|---|
| pg152_o3_native_lto.cx7a27_gcp_c2s30 | 99.997 | 0.003 | nonzero | nonzero | 0.008 | ||||||
| pg153_o3_native_lto.cx7a27_gcp_c2s30 | 99.996 | 0.003 | 0.001 | nonzero | 0.009 | ||||||
| pg154_o3_native_lto.cx7a27_gcp_c2s30 | 99.996 | 0.003 | 0.001 | nonzero | 0.010 | ||||||
| pg16beta1_o3_native_lto.cx7a27_gcp_c2s30 | 99.996 | 0.003 | 0.001 | nonzero | 0.010 | ||||||
| pg16beta2_o3_native_lto.cx7a27_gcp_c2s30 | 99.996 | 0.003 | 0.001 | nonzero | 0.009 | ||||||
| pg16beta3_o3_native_lto.cx7a27_gcp_c2s30 | 99.997 | 0.003 | 0.001 | nonzero | 0.008 | ||||||
| pg16rc1_o3_native_lto.cx7a27_gcp_c2s30 | 99.996 | 0.003 | 0.001 | nonzero | 0.006 | ||||||
| pg160_o3_native_lto.cx7a27_gcp_c2s30 | 99.996 | 0.003 | 0.001 | nonzero | 0.009 |
Insert response time histogram: each cell has the percentage of responses that take <= the time in the header and max is the max response time in seconds. For max values in the top 25% of the range have a red background and in the bottom 25% of the range have a green background. The red background is not used when the min value is within 80% of the max value.
| dbms | 256us | 1ms | 4ms | 16ms | 64ms | 256ms | 1s | 4s | 16s | gt | max |
|---|---|---|---|---|---|---|---|---|---|---|---|
| pg152_o3_native_lto.cx7a27_gcp_c2s30 | 99.921 | 0.079 | 0.013 | ||||||||
| pg153_o3_native_lto.cx7a27_gcp_c2s30 | 99.841 | 0.159 | 0.015 | ||||||||
| pg154_o3_native_lto.cx7a27_gcp_c2s30 | 99.852 | 0.148 | 0.012 | ||||||||
| pg16beta1_o3_native_lto.cx7a27_gcp_c2s30 | 99.878 | 0.122 | 0.013 | ||||||||
| pg16beta2_o3_native_lto.cx7a27_gcp_c2s30 | 99.810 | 0.190 | 0.012 | ||||||||
| pg16beta3_o3_native_lto.cx7a27_gcp_c2s30 | 99.869 | 0.131 | 0.012 | ||||||||
| pg16rc1_o3_native_lto.cx7a27_gcp_c2s30 | 99.872 | 0.128 | 0.001 | 0.019 | |||||||
| pg160_o3_native_lto.cx7a27_gcp_c2s30 | 99.736 | 0.264 | 0.010 |
Delete response time histogram: each cell has the percentage of responses that take <= the time in the header and max is the max response time in seconds. For max values in the top 25% of the range have a red background and in the bottom 25% of the range have a green background. The red background is not used when the min value is within 80% of the max value.
| dbms | 256us | 1ms | 4ms | 16ms | 64ms | 256ms | 1s | 4s | 16s | gt | max |
|---|---|---|---|---|---|---|---|---|---|---|---|
| pg152_o3_native_lto.cx7a27_gcp_c2s30 | 66.461 | 15.448 | 14.718 | 3.373 | 0.013 | ||||||
| pg153_o3_native_lto.cx7a27_gcp_c2s30 | 57.270 | 23.173 | 17.409 | 2.148 | 0.008 | ||||||
| pg154_o3_native_lto.cx7a27_gcp_c2s30 | 62.187 | 14.806 | 15.054 | 7.953 | 0.013 | ||||||
| pg16beta1_o3_native_lto.cx7a27_gcp_c2s30 | 55.911 | 20.905 | 21.876 | 1.307 | 0.008 | ||||||
| pg16beta2_o3_native_lto.cx7a27_gcp_c2s30 | 59.968 | 23.069 | 13.876 | 3.087 | 0.010 | ||||||
| pg16beta3_o3_native_lto.cx7a27_gcp_c2s30 | 65.770 | 22.024 | 9.612 | 2.594 | 0.009 | ||||||
| pg16rc1_o3_native_lto.cx7a27_gcp_c2s30 | 63.451 | 19.562 | 14.059 | 2.927 | 0.008 | ||||||
| pg160_o3_native_lto.cx7a27_gcp_c2s30 | 61.826 | 27.021 | 10.772 | 0.381 | 0.011 |
Performance metrics for the DBMS listed above. Some are normalized by throughput, others are not. Legend for results is here.
ips	qps	rps	rmbps	wps	wmbps	rpq	rkbpq	wpi	wkbpi	csps	cpups	cspq	cpupq	dbgb1	dbgb2	rss	maxop	p50	p99	tag
798	113260	0	0.0	319.3	10.6	0.000	0.000	0.400	13.567	431260	52.8	3.808	70	41.8	102.5	11.7	0.008	14289	14006	160m.pg152_o3_native_lto.cx7a27_gcp_c2s30
798	112255	0	0.0	377.2	11.2	0.000	0.000	0.473	14.394	427510	53.0	3.808	71	42.1	102.3	13.9	0.009	13985	13729	160m.pg153_o3_native_lto.cx7a27_gcp_c2s30
798	112526	0	0.0	316.0	10.7	0.000	0.000	0.396	13.738	428483	52.9	3.808	71	41.9	102.3	7.9	0.010	14065	13793	160m.pg154_o3_native_lto.cx7a27_gcp_c2s30
798	111648	0	0.0	378.4	11.4	0.000	0.000	0.474	14.586	425250	53.0	3.809	71	41.8	107.1	1.0	0.010	13953	13713	160m.pg16beta1_o3_native_lto.cx7a27_gcp_c2s30
798	113283	0	0.0	309.9	10.3	0.000	0.000	0.388	13.193	431512	52.9	3.809	70	41.9	107.1	11.3	0.009	13990	13697	160m.pg16beta2_o3_native_lto.cx7a27_gcp_c2s30
798	112842	0	0.0	313.9	10.4	0.000	0.000	0.393	13.357	429724	53.0	3.808	70	41.9	107.0	11.8	0.008	14129	13862	160m.pg16beta3_o3_native_lto.cx7a27_gcp_c2s30
798	113090	0	0.0	330.1	10.6	0.000	0.000	0.413	13.612	430612	53.0	3.808	70	41.8	107.1	7.3	0.006	14033	13777	160m.pg16rc1_o3_native_lto.cx7a27_gcp_c2s30
798	113084	0	0.0	341.1	10.5	0.000	0.000	0.427	13.472	430595	52.8	3.808	70	41.8	107.0	7.4	0.009	14049	13761	160m.pg160_o3_native_lto.cx7a27_gcp_c2s30
q500.1
q500.1: range queries with 500 insert/s per client. Graphs for performance per 1-second interval are here.
Average throughput:
Query response time histogram: each cell has the percentage of responses that take <= the time in the header and max is the max response time in seconds. For max values in the top 25% of the range have a red background and in the bottom 25% of the range have a green background. The red background is not used when the min value is within 80% of the max value.
| dbms | 256us | 1ms | 4ms | 16ms | 64ms | 256ms | 1s | 4s | 16s | gt | max |
|---|---|---|---|---|---|---|---|---|---|---|---|
| pg152_o3_native_lto.cx7a27_gcp_c2s30 | 99.989 | 0.008 | 0.003 | nonzero | nonzero | 0.024 | |||||
| pg153_o3_native_lto.cx7a27_gcp_c2s30 | 99.988 | 0.008 | 0.004 | nonzero | nonzero | nonzero | 0.073 | ||||
| pg154_o3_native_lto.cx7a27_gcp_c2s30 | 99.989 | 0.008 | 0.003 | nonzero | nonzero | 0.069 | |||||
| pg16beta1_o3_native_lto.cx7a27_gcp_c2s30 | 99.988 | 0.008 | 0.004 | nonzero | nonzero | 0.077 | |||||
| pg16beta2_o3_native_lto.cx7a27_gcp_c2s30 | 99.987 | 0.009 | 0.004 | nonzero | nonzero | nonzero | 0.075 | ||||
| pg16beta3_o3_native_lto.cx7a27_gcp_c2s30 | 99.987 | 0.009 | 0.004 | nonzero | nonzero | 0.016 | |||||
| pg16rc1_o3_native_lto.cx7a27_gcp_c2s30 | 99.989 | 0.008 | 0.004 | nonzero | nonzero | nonzero | 0.066 | ||||
| pg160_o3_native_lto.cx7a27_gcp_c2s30 | 99.985 | 0.010 | 0.005 | nonzero | nonzero | 0.024 |
Insert response time histogram: each cell has the percentage of responses that take <= the time in the header and max is the max response time in seconds. For max values in the top 25% of the range have a red background and in the bottom 25% of the range have a green background. The red background is not used when the min value is within 80% of the max value.
| dbms | 256us | 1ms | 4ms | 16ms | 64ms | 256ms | 1s | 4s | 16s | gt | max |
|---|---|---|---|---|---|---|---|---|---|---|---|
| pg152_o3_native_lto.cx7a27_gcp_c2s30 | 99.932 | 0.068 | 0.016 | ||||||||
| pg153_o3_native_lto.cx7a27_gcp_c2s30 | 99.933 | 0.066 | 0.001 | 0.018 | |||||||
| pg154_o3_native_lto.cx7a27_gcp_c2s30 | 99.929 | 0.070 | nonzero | 0.019 | |||||||
| pg16beta1_o3_native_lto.cx7a27_gcp_c2s30 | 99.949 | 0.051 | nonzero | 0.018 | |||||||
| pg16beta2_o3_native_lto.cx7a27_gcp_c2s30 | 99.885 | 0.114 | 0.001 | 0.018 | |||||||
| pg16beta3_o3_native_lto.cx7a27_gcp_c2s30 | 99.901 | 0.097 | 0.001 | 0.018 | |||||||
| pg16rc1_o3_native_lto.cx7a27_gcp_c2s30 | 99.956 | 0.044 | nonzero | 0.016 | |||||||
| pg160_o3_native_lto.cx7a27_gcp_c2s30 | 99.806 | 0.192 | 0.001 | 0.023 |
Delete response time histogram: each cell has the percentage of responses that take <= the time in the header and max is the max response time in seconds. For max values in the top 25% of the range have a red background and in the bottom 25% of the range have a green background. The red background is not used when the min value is within 80% of the max value.
| dbms | 256us | 1ms | 4ms | 16ms | 64ms | 256ms | 1s | 4s | 16s | gt | max |
|---|---|---|---|---|---|---|---|---|---|---|---|
| pg152_o3_native_lto.cx7a27_gcp_c2s30 | 77.972 | 10.617 | 6.624 | 4.786 | nonzero | 0.021 | |||||
| pg153_o3_native_lto.cx7a27_gcp_c2s30 | 75.045 | 13.935 | 8.351 | 2.668 | nonzero | 0.018 | |||||
| pg154_o3_native_lto.cx7a27_gcp_c2s30 | 77.011 | 7.749 | 11.480 | 3.759 | nonzero | 0.019 | |||||
| pg16beta1_o3_native_lto.cx7a27_gcp_c2s30 | 75.641 | 12.624 | 11.315 | 0.420 | nonzero | 0.016 | |||||
| pg16beta2_o3_native_lto.cx7a27_gcp_c2s30 | 76.003 | 12.478 | 8.715 | 2.804 | nonzero | 0.018 | |||||
| pg16beta3_o3_native_lto.cx7a27_gcp_c2s30 | 77.294 | 10.217 | 7.004 | 5.485 | 0.001 | 0.018 | |||||
| pg16rc1_o3_native_lto.cx7a27_gcp_c2s30 | 76.810 | 10.494 | 9.432 | 3.264 | nonzero | 0.017 | |||||
| pg160_o3_native_lto.cx7a27_gcp_c2s30 | 75.595 | 12.526 | 7.594 | 4.284 | 0.002 | 0.022 |
Performance metrics for the DBMS listed above. Some are normalized by throughput, others are not. Legend for results is here.
ips	qps	rps	rmbps	wps	wmbps	rpq	rkbpq	wpi	wkbpi	csps	cpups	cspq	cpupq	dbgb1	dbgb2	rss	maxop	p50	p99	tag
3991	109208	0	0.0	247.4	14.9	0.000	0.000	0.062	3.833	416335	53.9	3.812	74	41.8	89.6	28.1	0.024	13718	11512	160m.pg152_o3_native_lto.cx7a27_gcp_c2s30
3992	108780	0	0.0	245.8	15.3	0.000	0.000	0.062	3.915	414611	53.9	3.811	74	42.0	89.6	22.6	0.073	13777	11459	160m.pg153_o3_native_lto.cx7a27_gcp_c2s30
3992	109057	0	0.0	248.2	15.0	0.000	0.000	0.062	3.840	415741	54.0	3.812	74	41.9	89.5	18.0	0.069	13793	11683	160m.pg154_o3_native_lto.cx7a27_gcp_c2s30
3992	109118	0	0.0	222.3	15.6	0.000	0.000	0.056	3.989	416154	53.8	3.814	74	41.8	92.0	15.8	0.077	13617	11475	160m.pg16beta1_o3_native_lto.cx7a27_gcp_c2s30
3991	109922	0	0.0	215.1	15.1	0.000	0.000	0.054	3.874	419018	53.8	3.812	73	41.8	92.4	0.8	0.075	13681	11539	160m.pg16beta2_o3_native_lto.cx7a27_gcp_c2s30
3992	109647	0	0.0	210.2	15.2	0.000	0.000	0.053	3.897	417852	53.9	3.811	74	41.9	92.3	13.2	0.016	13606	11332	160m.pg16beta3_o3_native_lto.cx7a27_gcp_c2s30
3992	109345	0	0.0	198.6	15.2	0.000	0.000	0.050	3.904	417056	53.9	3.814	74	41.8	92.3	17.8	0.066	13654	11332	160m.pg16rc1_o3_native_lto.cx7a27_gcp_c2s30
3991	110163	0	0.0	204.2	15.3	0.000	0.000	0.051	3.916	419749	53.8	3.810	73	41.8	92.2	31.2	0.024	13857	11498	160m.pg160_o3_native_lto.cx7a27_gcp_c2s30
q1000.1
q1000.1: range queries with 1000 insert/s per client. Graphs for performance per 1-second interval are here.
Average throughput:
Query response time histogram: each cell has the percentage of responses that take <= the time in the header and max is the max response time in seconds. For max values in the top 25% of the range have a red background and in the bottom 25% of the range have a green background. The red background is not used when the min value is within 80% of the max value.
| dbms | 256us | 1ms | 4ms | 16ms | 64ms | 256ms | 1s | 4s | 16s | gt | max |
|---|---|---|---|---|---|---|---|---|---|---|---|
| pg152_o3_native_lto.cx7a27_gcp_c2s30 | 99.960 | 0.031 | 0.009 | nonzero | nonzero | nonzero | 0.092 | ||||
| pg153_o3_native_lto.cx7a27_gcp_c2s30 | 99.956 | 0.035 | 0.009 | nonzero | nonzero | nonzero | 0.096 | ||||
| pg154_o3_native_lto.cx7a27_gcp_c2s30 | 99.963 | 0.029 | 0.008 | nonzero | nonzero | nonzero | 0.094 | ||||
| pg16beta1_o3_native_lto.cx7a27_gcp_c2s30 | 99.950 | 0.039 | 0.011 | nonzero | nonzero | nonzero | 0.089 | ||||
| pg16beta2_o3_native_lto.cx7a27_gcp_c2s30 | 99.959 | 0.032 | 0.009 | nonzero | nonzero | 0.023 | |||||
| pg16beta3_o3_native_lto.cx7a27_gcp_c2s30 | 99.959 | 0.032 | 0.009 | nonzero | nonzero | 0.021 | |||||
| pg16rc1_o3_native_lto.cx7a27_gcp_c2s30 | 99.954 | 0.035 | 0.011 | nonzero | nonzero | nonzero | 0.085 | ||||
| pg160_o3_native_lto.cx7a27_gcp_c2s30 | 99.964 | 0.028 | 0.008 | nonzero | nonzero | nonzero | 0.081 |
Insert response time histogram: each cell has the percentage of responses that take <= the time in the header and max is the max response time in seconds. For max values in the top 25% of the range have a red background and in the bottom 25% of the range have a green background. The red background is not used when the min value is within 80% of the max value.
| dbms | 256us | 1ms | 4ms | 16ms | 64ms | 256ms | 1s | 4s | 16s | gt | max |
|---|---|---|---|---|---|---|---|---|---|---|---|
| pg152_o3_native_lto.cx7a27_gcp_c2s30 | 99.755 | 0.240 | 0.004 | 0.061 | |||||||
| pg153_o3_native_lto.cx7a27_gcp_c2s30 | 99.534 | 0.456 | 0.009 | 0.030 | |||||||
| pg154_o3_native_lto.cx7a27_gcp_c2s30 | 99.721 | 0.272 | 0.007 | 0.031 | |||||||
| pg16beta1_o3_native_lto.cx7a27_gcp_c2s30 | 99.532 | 0.455 | 0.012 | 0.027 | |||||||
| pg16beta2_o3_native_lto.cx7a27_gcp_c2s30 | 99.730 | 0.263 | 0.006 | 0.027 | |||||||
| pg16beta3_o3_native_lto.cx7a27_gcp_c2s30 | 99.644 | 0.344 | 0.012 | 0.036 | |||||||
| pg16rc1_o3_native_lto.cx7a27_gcp_c2s30 | 99.602 | 0.389 | 0.009 | 0.032 | |||||||
| pg160_o3_native_lto.cx7a27_gcp_c2s30 | 99.815 | 0.181 | 0.003 | 0.024 |
Delete response time histogram: each cell has the percentage of responses that take <= the time in the header and max is the max response time in seconds. For max values in the top 25% of the range have a red background and in the bottom 25% of the range have a green background. The red background is not used when the min value is within 80% of the max value.
| dbms | 256us | 1ms | 4ms | 16ms | 64ms | 256ms | 1s | 4s | 16s | gt | max |
|---|---|---|---|---|---|---|---|---|---|---|---|
| pg152_o3_native_lto.cx7a27_gcp_c2s30 | 76.981 | 11.924 | 9.970 | 1.124 | 0.001 | 0.060 | |||||
| pg153_o3_native_lto.cx7a27_gcp_c2s30 | 76.589 | 14.041 | 8.041 | 1.327 | 0.002 | 0.024 | |||||
| pg154_o3_native_lto.cx7a27_gcp_c2s30 | 77.327 | 9.221 | 12.477 | 0.973 | 0.002 | 0.023 | |||||
| pg16beta1_o3_native_lto.cx7a27_gcp_c2s30 | 76.883 | 16.692 | 6.220 | 0.202 | 0.003 | 0.025 | |||||
| pg16beta2_o3_native_lto.cx7a27_gcp_c2s30 | 77.667 | 13.049 | 8.395 | 0.888 | 0.002 | 0.024 | |||||
| pg16beta3_o3_native_lto.cx7a27_gcp_c2s30 | 76.936 | 10.507 | 9.464 | 3.090 | 0.002 | 0.024 | |||||
| pg16rc1_o3_native_lto.cx7a27_gcp_c2s30 | 76.782 | 11.396 | 10.880 | 0.937 | 0.004 | 0.029 | |||||
| pg160_o3_native_lto.cx7a27_gcp_c2s30 | 78.017 | 11.621 | 7.932 | 2.430 | nonzero | 0.023 |
Performance metrics for the DBMS listed above. Some are normalized by throughput, others are not. Legend for results is here.
ips	qps	rps	rmbps	wps	wmbps	rpq	rkbpq	wpi	wkbpi	csps	cpups	cspq	cpupq	dbgb1	dbgb2	rss	maxop	p50	p99	tag
7984	108046	0	0.0	187.8	16.9	0.000	0.000	0.024	2.164	411635	54.9	3.810	76	41.6	83.6	22.5	0.092	13521	11348	160m.pg152_o3_native_lto.cx7a27_gcp_c2s30
7983	107108	0	0.0	192.2	16.5	0.000	0.000	0.024	2.120	407910	54.9	3.808	77	41.8	83.8	17.7	0.096	13537	11290	160m.pg153_o3_native_lto.cx7a27_gcp_c2s30
7984	107912	0	0.0	187.4	16.8	0.000	0.000	0.023	2.155	411102	54.9	3.810	76	41.7	83.6	18.1	0.094	13553	11427	160m.pg154_o3_native_lto.cx7a27_gcp_c2s30
7983	108317	0	0.0	183.5	16.6	0.000	0.000	0.023	2.132	412010	54.7	3.804	76	41.6	84.8	24.2	0.089	13441	11284	160m.pg16beta1_o3_native_lto.cx7a27_gcp_c2s30
7984	109074	0	0.0	186.0	16.5	0.000	0.000	0.023	2.122	415538	54.8	3.810	75	41.9	85.4	6.7	0.023	13553	11380	160m.pg16beta2_o3_native_lto.cx7a27_gcp_c2s30
7983	108294	0	0.0	185.8	16.6	0.000	0.000	0.023	2.125	412394	54.9	3.808	76	41.9	85.4	12.9	0.021	13457	11290	160m.pg16beta3_o3_native_lto.cx7a27_gcp_c2s30
7984	108139	0	0.0	187.7	16.5	0.000	0.000	0.024	2.119	411659	54.7	3.807	76	41.6	85.1	28.1	0.085	13526	11380	160m.pg16rc1_o3_native_lto.cx7a27_gcp_c2s30
7984	107879	0	0.0	187.8	16.7	0.000	0.000	0.024	2.138	411415	54.9	3.814	76	41.7	85.1	28.3	0.081	13505	11364	160m.pg160_o3_native_lto.cx7a27_gcp_c2s30
l.i0
l.i0: load without secondary indexes
Performance metrics for all DBMS, not just the ones listed above. Some are normalized by throughput, others are not. Legend for results is here.
ips	qps	rps	rmbps	wps	wmbps	rpq	rkbpq	wpi	wkbpi	csps	cpups	cspq	cpupq	dbgb1	dbgb2	rss	maxop	p50	p99	tag
1025641	0	0	0.0	1003.5	334.3	0.000	0.000	0.001	0.334	85489	77.5	0.083	11	15.3	41.4	1.7	0.299	145242	38857	160m.pg152_o3_native_lto.cx7a27_gcp_c2s30
1012658	0	0	0.0	1000.2	335.3	0.000	0.000	0.001	0.339	85948	77.8	0.085	12	15.3	41.4	4.8	0.274	143745	53341	160m.pg153_o3_native_lto.cx7a27_gcp_c2s30
1000000	0	0	0.0	970.9	326.5	0.000	0.000	0.001	0.334	84913	76.5	0.085	11	15.3	41.4	5.3	0.311	141047	46550	160m.pg154_o3_native_lto.cx7a27_gcp_c2s30
987654	0	0	0.0	972.8	325.9	0.000	0.000	0.001	0.338	83564	77.1	0.085	12	15.3	41.4	1.7	0.332	140946	55459	160m.pg16beta1_o3_native_lto.cx7a27_gcp_c2s30
1012658	0	0	0.0	997.4	335.5	0.000	0.000	0.001	0.339	85279	77.9	0.084	12	15.3	41.4	1.7	0.726	143144	54940	160m.pg16beta2_o3_native_lto.cx7a27_gcp_c2s30
993789	0	0	0.0	972.3	326.2	0.000	0.000	0.001	0.336	84087	76.9	0.085	12	15.3	41.4	1.7	0.286	141041	63930	160m.pg16beta3_o3_native_lto.cx7a27_gcp_c2s30
1012658	0	0	0.0	1000.9	336.5	0.000	0.000	0.001	0.340	84990	78.2	0.084	12	15.3	41.4	1.7	0.201	143040	76143	160m.pg16rc1_o3_native_lto.cx7a27_gcp_c2s30
1000000	0	0	0.0	968.2	331.3	0.000	0.000	0.001	0.339	81914	76.6	0.082	11	15.3	41.4	1.4	0.397	142147	81512	160m.pg160_o3_native_lto.cx7a27_gcp_c2s30
l.x
l.x: create secondary indexes
Performance metrics for all DBMS, not just the ones listed above. Some are normalized by throughput, others are not. Legend for results is here.
ips	qps	rps	rmbps	wps	wmbps	rpq	rkbpq	wpi	wkbpi	csps	cpups	cspq	cpupq	dbgb1	dbgb2	rss	maxop	p50	p99	tag
2320290	0	0	0.0	882.2	399.2	0.000	0.000	0.000	0.176	7473	41.9	0.003	3	29.4	63.3	13.2	0.002	NA	NA	160m.pg152_o3_native_lto.cx7a27_gcp_c2s30
2320290	0	0	0.0	888.0	401.5	0.000	0.000	0.000	0.177	7643	41.9	0.003	3	29.4	63.3	13.2	0.002	NA	NA	160m.pg153_o3_native_lto.cx7a27_gcp_c2s30
2354412	0	0	0.0	903.1	405.5	0.000	0.000	0.000	0.176	7981	41.4	0.003	3	29.4	63.4	13.2	0.002	NA	NA	160m.pg154_o3_native_lto.cx7a27_gcp_c2s30
2389552	0	0	0.0	941.8	417.7	0.000	0.000	0.000	0.179	8339	41.1	0.003	3	29.4	63.4	13.2	0.002	NA	NA	160m.pg16beta1_o3_native_lto.cx7a27_gcp_c2s30
2389552	0	0	0.0	968.8	426.8	0.000	0.000	0.000	0.183	7975	40.7	0.003	3	29.4	63.4	13.2	0.002	NA	NA	160m.pg16beta2_o3_native_lto.cx7a27_gcp_c2s30
2389552	0	0	0.0	946.6	415.2	0.000	0.000	0.000	0.178	8347	41.2	0.003	3	29.4	63.4	13.2	0.002	NA	NA	160m.pg16beta3_o3_native_lto.cx7a27_gcp_c2s30
2354412	0	0	0.0	934.2	413.8	0.000	0.000	0.000	0.180	7090	41.3	0.003	3	29.4	63.3	13.2	0.002	NA	NA	160m.pg16rc1_o3_native_lto.cx7a27_gcp_c2s30
2193151	0	0	0.0	871.6	387.2	0.000	0.000	0.000	0.181	7188	38.6	0.003	3	29.4	63.4	13.2	0.002	NA	NA	160m.pg160_o3_native_lto.cx7a27_gcp_c2s30
l.i1
l.i1: continue load after secondary indexes created
Performance metrics for all DBMS, not just the ones listed above. Some are normalized by throughput, others are not. Legend for results is here.
ips	qps	rps	rmbps	wps	wmbps	rpq	rkbpq	wpi	wkbpi	csps	cpups	cspq	cpupq	dbgb1	dbgb2	rss	maxop	p50	p99	tag
240577	0	0	0.0	1146.5	187.5	0.000	0.000	0.005	0.798	93513	78.9	0.389	49	41.8	111.9	30.5	0.385	35117	6842	160m.pg152_o3_native_lto.cx7a27_gcp_c2s30
225225	0	0	0.0	1087.0	175.0	0.000	0.000	0.005	0.796	88071	75.2	0.391	50	42.1	112.1	29.4	0.911	34812	5094	160m.pg153_o3_native_lto.cx7a27_gcp_c2s30
228397	0	0	0.0	1086.1	176.8	0.000	0.000	0.005	0.793	88476	77.4	0.387	51	41.9	112.0	32.1	0.335	35124	5996	160m.pg154_o3_native_lto.cx7a27_gcp_c2s30
237624	0	0	0.0	1136.5	184.8	0.000	0.000	0.005	0.796	92527	76.8	0.389	48	41.8	111.9	24.5	0.218	34862	6797	160m.pg16beta1_o3_native_lto.cx7a27_gcp_c2s30
231080	0	0	0.0	1100.2	178.2	0.000	0.000	0.005	0.790	90916	76.7	0.393	50	41.9	112.0	19.4	0.772	35412	5096	160m.pg16beta2_o3_native_lto.cx7a27_gcp_c2s30
231481	0	0	0.0	1102.6	178.4	0.000	0.000	0.005	0.789	91011	76.3	0.393	49	41.9	111.9	25.9	0.202	35412	6193	160m.pg16beta3_o3_native_lto.cx7a27_gcp_c2s30
231258	0	0	0.0	1107.3	178.6	0.000	0.000	0.005	0.791	91150	76.4	0.394	50	41.8	111.9	29.5	0.191	35561	5194	160m.pg16rc1_o3_native_lto.cx7a27_gcp_c2s30
224278	0	0	0.0	1066.3	173.2	0.000	0.000	0.005	0.791	88176	74.5	0.393	50	41.8	111.9	27.8	0.262	35511	4845	160m.pg160_o3_native_lto.cx7a27_gcp_c2s30
q100.1
q100.1: range queries with 100 insert/s per client
Performance metrics for all DBMS, not just the ones listed above. Some are normalized by throughput, others are not. Legend for results is here.
ips	qps	rps	rmbps	wps	wmbps	rpq	rkbpq	wpi	wkbpi	csps	cpups	cspq	cpupq	dbgb1	dbgb2	rss	maxop	p50	p99	tag
798	113260	0	0.0	319.3	10.6	0.000	0.000	0.400	13.567	431260	52.8	3.808	70	41.8	102.5	11.7	0.008	14289	14006	160m.pg152_o3_native_lto.cx7a27_gcp_c2s30
798	112255	0	0.0	377.2	11.2	0.000	0.000	0.473	14.394	427510	53.0	3.808	71	42.1	102.3	13.9	0.009	13985	13729	160m.pg153_o3_native_lto.cx7a27_gcp_c2s30
798	112526	0	0.0	316.0	10.7	0.000	0.000	0.396	13.738	428483	52.9	3.808	71	41.9	102.3	7.9	0.010	14065	13793	160m.pg154_o3_native_lto.cx7a27_gcp_c2s30
798	111648	0	0.0	378.4	11.4	0.000	0.000	0.474	14.586	425250	53.0	3.809	71	41.8	107.1	1.0	0.010	13953	13713	160m.pg16beta1_o3_native_lto.cx7a27_gcp_c2s30
798	113283	0	0.0	309.9	10.3	0.000	0.000	0.388	13.193	431512	52.9	3.809	70	41.9	107.1	11.3	0.009	13990	13697	160m.pg16beta2_o3_native_lto.cx7a27_gcp_c2s30
798	112842	0	0.0	313.9	10.4	0.000	0.000	0.393	13.357	429724	53.0	3.808	70	41.9	107.0	11.8	0.008	14129	13862	160m.pg16beta3_o3_native_lto.cx7a27_gcp_c2s30
798	113090	0	0.0	330.1	10.6	0.000	0.000	0.413	13.612	430612	53.0	3.808	70	41.8	107.1	7.3	0.006	14033	13777	160m.pg16rc1_o3_native_lto.cx7a27_gcp_c2s30
798	113084	0	0.0	341.1	10.5	0.000	0.000	0.427	13.472	430595	52.8	3.808	70	41.8	107.0	7.4	0.009	14049	13761	160m.pg160_o3_native_lto.cx7a27_gcp_c2s30
q500.1
q500.1: range queries with 500 insert/s per client
Performance metrics for all DBMS, not just the ones listed above. Some are normalized by throughput, others are not. Legend for results is here.
ips	qps	rps	rmbps	wps	wmbps	rpq	rkbpq	wpi	wkbpi	csps	cpups	cspq	cpupq	dbgb1	dbgb2	rss	maxop	p50	p99	tag
3991	109208	0	0.0	247.4	14.9	0.000	0.000	0.062	3.833	416335	53.9	3.812	74	41.8	89.6	28.1	0.024	13718	11512	160m.pg152_o3_native_lto.cx7a27_gcp_c2s30
3992	108780	0	0.0	245.8	15.3	0.000	0.000	0.062	3.915	414611	53.9	3.811	74	42.0	89.6	22.6	0.073	13777	11459	160m.pg153_o3_native_lto.cx7a27_gcp_c2s30
3992	109057	0	0.0	248.2	15.0	0.000	0.000	0.062	3.840	415741	54.0	3.812	74	41.9	89.5	18.0	0.069	13793	11683	160m.pg154_o3_native_lto.cx7a27_gcp_c2s30
3992	109118	0	0.0	222.3	15.6	0.000	0.000	0.056	3.989	416154	53.8	3.814	74	41.8	92.0	15.8	0.077	13617	11475	160m.pg16beta1_o3_native_lto.cx7a27_gcp_c2s30
3991	109922	0	0.0	215.1	15.1	0.000	0.000	0.054	3.874	419018	53.8	3.812	73	41.8	92.4	0.8	0.075	13681	11539	160m.pg16beta2_o3_native_lto.cx7a27_gcp_c2s30
3992	109647	0	0.0	210.2	15.2	0.000	0.000	0.053	3.897	417852	53.9	3.811	74	41.9	92.3	13.2	0.016	13606	11332	160m.pg16beta3_o3_native_lto.cx7a27_gcp_c2s30
3992	109345	0	0.0	198.6	15.2	0.000	0.000	0.050	3.904	417056	53.9	3.814	74	41.8	92.3	17.8	0.066	13654	11332	160m.pg16rc1_o3_native_lto.cx7a27_gcp_c2s30
3991	110163	0	0.0	204.2	15.3	0.000	0.000	0.051	3.916	419749	53.8	3.810	73	41.8	92.2	31.2	0.024	13857	11498	160m.pg160_o3_native_lto.cx7a27_gcp_c2s30
q1000.1
q1000.1: range queries with 1000 insert/s per client
Performance metrics for all DBMS, not just the ones listed above. Some are normalized by throughput, others are not. Legend for results is here.
ips	qps	rps	rmbps	wps	wmbps	rpq	rkbpq	wpi	wkbpi	csps	cpups	cspq	cpupq	dbgb1	dbgb2	rss	maxop	p50	p99	tag
7984	108046	0	0.0	187.8	16.9	0.000	0.000	0.024	2.164	411635	54.9	3.810	76	41.6	83.6	22.5	0.092	13521	11348	160m.pg152_o3_native_lto.cx7a27_gcp_c2s30
7983	107108	0	0.0	192.2	16.5	0.000	0.000	0.024	2.120	407910	54.9	3.808	77	41.8	83.8	17.7	0.096	13537	11290	160m.pg153_o3_native_lto.cx7a27_gcp_c2s30
7984	107912	0	0.0	187.4	16.8	0.000	0.000	0.023	2.155	411102	54.9	3.810	76	41.7	83.6	18.1	0.094	13553	11427	160m.pg154_o3_native_lto.cx7a27_gcp_c2s30
7983	108317	0	0.0	183.5	16.6	0.000	0.000	0.023	2.132	412010	54.7	3.804	76	41.6	84.8	24.2	0.089	13441	11284	160m.pg16beta1_o3_native_lto.cx7a27_gcp_c2s30
7984	109074	0	0.0	186.0	16.5	0.000	0.000	0.023	2.122	415538	54.8	3.810	75	41.9	85.4	6.7	0.023	13553	11380	160m.pg16beta2_o3_native_lto.cx7a27_gcp_c2s30
7983	108294	0	0.0	185.8	16.6	0.000	0.000	0.023	2.125	412394	54.9	3.808	76	41.9	85.4	12.9	0.021	13457	11290	160m.pg16beta3_o3_native_lto.cx7a27_gcp_c2s30
7984	108139	0	0.0	187.7	16.5	0.000	0.000	0.024	2.119	411659	54.7	3.807	76	41.6	85.1	28.1	0.085	13526	11380	160m.pg16rc1_o3_native_lto.cx7a27_gcp_c2s30
7984	107879	0	0.0	187.8	16.7	0.000	0.000	0.024	2.138	411415	54.9	3.814	76	41.7	85.1	28.3	0.081	13505	11364	160m.pg160_o3_native_lto.cx7a27_gcp_c2s30
l.i0
- l.i0: load without secondary indexes
- Legend for results is here.
- Each entry lists the percentage of responses that fit in that bucket (slower than max time for previous bucket, faster than min time for next bucket).
Insert response time histogram
256us	1ms	4ms	16ms	64ms	256ms	1s	4s	16s	gt	max	tag
0.000	97.886	2.062	0.043	0.001	0.006	0.002	0.000	0.000	0.000	0.299	pg152_o3_native_lto.cx7a27_gcp_c2s30
0.000	97.944	2.002	0.043	0.002	0.008	0.001	0.000	0.000	0.000	0.274	pg153_o3_native_lto.cx7a27_gcp_c2s30
0.000	97.788	2.160	0.044	0.000	0.007	0.001	0.000	0.000	0.000	0.311	pg154_o3_native_lto.cx7a27_gcp_c2s30
0.000	98.021	1.925	0.043	nonzero	0.010	0.001	0.000	0.000	0.000	0.332	pg16beta1_o3_native_lto.cx7a27_gcp_c2s30
0.000	98.200	1.746	0.044	0.002	0.007	0.001	0.000	0.000	0.000	0.726	pg16beta2_o3_native_lto.cx7a27_gcp_c2s30
0.000	98.140	1.805	0.046	0.002	0.004	0.002	0.000	0.000	0.000	0.286	pg16beta3_o3_native_lto.cx7a27_gcp_c2s30
0.000	98.256	1.691	0.045	0.001	0.007	0.000	0.000	0.000	0.000	0.201	pg16rc1_o3_native_lto.cx7a27_gcp_c2s30
0.000	98.101	1.830	0.055	0.003	0.008	0.002	0.000	0.000	0.000	0.397	pg160_o3_native_lto.cx7a27_gcp_c2s30
l.x
- l.x: create secondary indexes
- Legend for results is here.
- Each entry lists the percentage of responses that fit in that bucket (slower than max time for previous bucket, faster than min time for next bucket).
TODO - determine whether there is data for create index response time
l.i1
- l.i1: continue load after secondary indexes created
- Legend for results is here.
- Each entry lists the percentage of responses that fit in that bucket (slower than max time for previous bucket, faster than min time for next bucket).
Insert response time histogram
256us	1ms	4ms	16ms	64ms	256ms	1s	4s	16s	gt	max	tag
0.000	0.015	99.768	0.155	0.058	0.004	nonzero	0.000	0.000	0.000	0.385	pg152_o3_native_lto.cx7a27_gcp_c2s30
0.000	0.264	99.512	0.168	0.053	0.003	nonzero	0.000	0.000	0.000	0.911	pg153_o3_native_lto.cx7a27_gcp_c2s30
0.000	0.036	99.742	0.170	0.048	0.003	nonzero	0.000	0.000	0.000	0.335	pg154_o3_native_lto.cx7a27_gcp_c2s30
0.000	0.248	99.526	0.164	0.058	0.004	0.000	0.000	0.000	0.000	0.218	pg16beta1_o3_native_lto.cx7a27_gcp_c2s30
0.000	0.252	99.527	0.164	0.054	0.003	nonzero	0.000	0.000	0.000	0.772	pg16beta2_o3_native_lto.cx7a27_gcp_c2s30
0.000	0.288	99.496	0.164	0.048	0.003	0.000	0.000	0.000	0.000	0.202	pg16beta3_o3_native_lto.cx7a27_gcp_c2s30
0.000	0.349	99.431	0.163	0.053	0.003	0.000	0.000	0.000	0.000	0.191	pg16rc1_o3_native_lto.cx7a27_gcp_c2s30
0.000	0.392	99.390	0.168	0.046	0.003	nonzero	0.000	0.000	0.000	0.262	pg160_o3_native_lto.cx7a27_gcp_c2s30
Delete response time histogram
256us	1ms	4ms	16ms	64ms	256ms	1s	4s	16s	gt	max	tag
78.178	8.165	11.483	2.153	0.018	0.002	nonzero	0.000	0.000	0.000	0.383	pg152_o3_native_lto.cx7a27_gcp_c2s30
77.857	8.726	10.595	2.806	0.015	0.002	nonzero	0.000	0.000	0.000	0.697	pg153_o3_native_lto.cx7a27_gcp_c2s30
78.645	7.580	10.625	3.132	0.016	0.002	nonzero	0.000	0.000	0.000	0.280	pg154_o3_native_lto.cx7a27_gcp_c2s30
76.510	9.534	11.945	1.992	0.017	0.002	0.000	0.000	0.000	0.000	0.219	pg16beta1_o3_native_lto.cx7a27_gcp_c2s30
78.345	8.067	10.740	2.829	0.018	0.002	nonzero	0.000	0.000	0.000	0.770	pg16beta2_o3_native_lto.cx7a27_gcp_c2s30
78.202	7.923	11.219	2.636	0.017	0.002	0.000	0.000	0.000	0.000	0.230	pg16beta3_o3_native_lto.cx7a27_gcp_c2s30
78.159	7.970	11.051	2.801	0.017	0.002	0.000	0.000	0.000	0.000	0.243	pg16rc1_o3_native_lto.cx7a27_gcp_c2s30
78.367	7.777	10.766	3.069	0.019	0.002	nonzero	0.000	0.000	0.000	0.262	pg160_o3_native_lto.cx7a27_gcp_c2s30
q100.1
- q100.1: range queries with 100 insert/s per client
- Legend for results is here.
- Each entry lists the percentage of responses that fit in that bucket (slower than max time for previous bucket, faster than min time for next bucket).
Query response time histogram
256us	1ms	4ms	16ms	64ms	256ms	1s	4s	16s	gt	max	tag
99.997	0.003	nonzero	nonzero	0.000	0.000	0.000	0.000	0.000	0.000	0.008	pg152_o3_native_lto.cx7a27_gcp_c2s30
99.996	0.003	0.001	nonzero	0.000	0.000	0.000	0.000	0.000	0.000	0.009	pg153_o3_native_lto.cx7a27_gcp_c2s30
99.996	0.003	0.001	nonzero	0.000	0.000	0.000	0.000	0.000	0.000	0.010	pg154_o3_native_lto.cx7a27_gcp_c2s30
99.996	0.003	0.001	nonzero	0.000	0.000	0.000	0.000	0.000	0.000	0.010	pg16beta1_o3_native_lto.cx7a27_gcp_c2s30
99.996	0.003	0.001	nonzero	0.000	0.000	0.000	0.000	0.000	0.000	0.009	pg16beta2_o3_native_lto.cx7a27_gcp_c2s30
99.997	0.003	0.001	nonzero	0.000	0.000	0.000	0.000	0.000	0.000	0.008	pg16beta3_o3_native_lto.cx7a27_gcp_c2s30
99.996	0.003	0.001	nonzero	0.000	0.000	0.000	0.000	0.000	0.000	0.006	pg16rc1_o3_native_lto.cx7a27_gcp_c2s30
99.996	0.003	0.001	nonzero	0.000	0.000	0.000	0.000	0.000	0.000	0.009	pg160_o3_native_lto.cx7a27_gcp_c2s30
Insert response time histogram
256us	1ms	4ms	16ms	64ms	256ms	1s	4s	16s	gt	max	tag
0.000	0.000	99.921	0.079	0.000	0.000	0.000	0.000	0.000	0.000	0.013	pg152_o3_native_lto.cx7a27_gcp_c2s30
0.000	0.000	99.841	0.159	0.000	0.000	0.000	0.000	0.000	0.000	0.015	pg153_o3_native_lto.cx7a27_gcp_c2s30
0.000	0.000	99.852	0.148	0.000	0.000	0.000	0.000	0.000	0.000	0.012	pg154_o3_native_lto.cx7a27_gcp_c2s30
0.000	0.000	99.878	0.122	0.000	0.000	0.000	0.000	0.000	0.000	0.013	pg16beta1_o3_native_lto.cx7a27_gcp_c2s30
0.000	0.000	99.810	0.190	0.000	0.000	0.000	0.000	0.000	0.000	0.012	pg16beta2_o3_native_lto.cx7a27_gcp_c2s30
0.000	0.000	99.869	0.131	0.000	0.000	0.000	0.000	0.000	0.000	0.012	pg16beta3_o3_native_lto.cx7a27_gcp_c2s30
0.000	0.000	99.872	0.128	0.001	0.000	0.000	0.000	0.000	0.000	0.019	pg16rc1_o3_native_lto.cx7a27_gcp_c2s30
0.000	0.000	99.736	0.264	0.000	0.000	0.000	0.000	0.000	0.000	0.010	pg160_o3_native_lto.cx7a27_gcp_c2s30
Delete response time histogram
256us	1ms	4ms	16ms	64ms	256ms	1s	4s	16s	gt	max	tag
66.461	15.448	14.718	3.373	0.000	0.000	0.000	0.000	0.000	0.000	0.013	pg152_o3_native_lto.cx7a27_gcp_c2s30
57.270	23.173	17.409	2.148	0.000	0.000	0.000	0.000	0.000	0.000	0.008	pg153_o3_native_lto.cx7a27_gcp_c2s30
62.187	14.806	15.054	7.953	0.000	0.000	0.000	0.000	0.000	0.000	0.013	pg154_o3_native_lto.cx7a27_gcp_c2s30
55.911	20.905	21.876	1.307	0.000	0.000	0.000	0.000	0.000	0.000	0.008	pg16beta1_o3_native_lto.cx7a27_gcp_c2s30
59.968	23.069	13.876	3.087	0.000	0.000	0.000	0.000	0.000	0.000	0.010	pg16beta2_o3_native_lto.cx7a27_gcp_c2s30
65.770	22.024	9.612	2.594	0.000	0.000	0.000	0.000	0.000	0.000	0.009	pg16beta3_o3_native_lto.cx7a27_gcp_c2s30
63.451	19.562	14.059	2.927	0.000	0.000	0.000	0.000	0.000	0.000	0.008	pg16rc1_o3_native_lto.cx7a27_gcp_c2s30
61.826	27.021	10.772	0.381	0.000	0.000	0.000	0.000	0.000	0.000	0.011	pg160_o3_native_lto.cx7a27_gcp_c2s30
q500.1
- q500.1: range queries with 500 insert/s per client
- Legend for results is here.
- Each entry lists the percentage of responses that fit in that bucket (slower than max time for previous bucket, faster than min time for next bucket).
Query response time histogram
256us	1ms	4ms	16ms	64ms	256ms	1s	4s	16s	gt	max	tag
99.989	0.008	0.003	nonzero	nonzero	0.000	0.000	0.000	0.000	0.000	0.024	pg152_o3_native_lto.cx7a27_gcp_c2s30
99.988	0.008	0.004	nonzero	nonzero	nonzero	0.000	0.000	0.000	0.000	0.073	pg153_o3_native_lto.cx7a27_gcp_c2s30
99.989	0.008	0.003	nonzero	0.000	nonzero	0.000	0.000	0.000	0.000	0.069	pg154_o3_native_lto.cx7a27_gcp_c2s30
99.988	0.008	0.004	nonzero	0.000	nonzero	0.000	0.000	0.000	0.000	0.077	pg16beta1_o3_native_lto.cx7a27_gcp_c2s30
99.987	0.009	0.004	nonzero	nonzero	nonzero	0.000	0.000	0.000	0.000	0.075	pg16beta2_o3_native_lto.cx7a27_gcp_c2s30
99.987	0.009	0.004	nonzero	nonzero	0.000	0.000	0.000	0.000	0.000	0.016	pg16beta3_o3_native_lto.cx7a27_gcp_c2s30
99.989	0.008	0.004	nonzero	nonzero	nonzero	0.000	0.000	0.000	0.000	0.066	pg16rc1_o3_native_lto.cx7a27_gcp_c2s30
99.985	0.010	0.005	nonzero	nonzero	0.000	0.000	0.000	0.000	0.000	0.024	pg160_o3_native_lto.cx7a27_gcp_c2s30
Insert response time histogram
256us	1ms	4ms	16ms	64ms	256ms	1s	4s	16s	gt	max	tag
0.000	0.000	99.932	0.068	0.000	0.000	0.000	0.000	0.000	0.000	0.016	pg152_o3_native_lto.cx7a27_gcp_c2s30
0.000	0.000	99.933	0.066	0.001	0.000	0.000	0.000	0.000	0.000	0.018	pg153_o3_native_lto.cx7a27_gcp_c2s30
0.000	0.000	99.929	0.070	nonzero	0.000	0.000	0.000	0.000	0.000	0.019	pg154_o3_native_lto.cx7a27_gcp_c2s30
0.000	0.000	99.949	0.051	nonzero	0.000	0.000	0.000	0.000	0.000	0.018	pg16beta1_o3_native_lto.cx7a27_gcp_c2s30
0.000	0.000	99.885	0.114	0.001	0.000	0.000	0.000	0.000	0.000	0.018	pg16beta2_o3_native_lto.cx7a27_gcp_c2s30
0.000	0.000	99.901	0.097	0.001	0.000	0.000	0.000	0.000	0.000	0.018	pg16beta3_o3_native_lto.cx7a27_gcp_c2s30
0.000	0.000	99.956	0.044	nonzero	0.000	0.000	0.000	0.000	0.000	0.016	pg16rc1_o3_native_lto.cx7a27_gcp_c2s30
0.000	0.000	99.806	0.192	0.001	0.000	0.000	0.000	0.000	0.000	0.023	pg160_o3_native_lto.cx7a27_gcp_c2s30
Delete response time histogram
256us	1ms	4ms	16ms	64ms	256ms	1s	4s	16s	gt	max	tag
77.972	10.617	6.624	4.786	nonzero	0.000	0.000	0.000	0.000	0.000	0.021	pg152_o3_native_lto.cx7a27_gcp_c2s30
75.045	13.935	8.351	2.668	nonzero	0.000	0.000	0.000	0.000	0.000	0.018	pg153_o3_native_lto.cx7a27_gcp_c2s30
77.011	7.749	11.480	3.759	nonzero	0.000	0.000	0.000	0.000	0.000	0.019	pg154_o3_native_lto.cx7a27_gcp_c2s30
75.641	12.624	11.315	0.420	nonzero	0.000	0.000	0.000	0.000	0.000	0.016	pg16beta1_o3_native_lto.cx7a27_gcp_c2s30
76.003	12.478	8.715	2.804	nonzero	0.000	0.000	0.000	0.000	0.000	0.018	pg16beta2_o3_native_lto.cx7a27_gcp_c2s30
77.294	10.217	7.004	5.485	0.001	0.000	0.000	0.000	0.000	0.000	0.018	pg16beta3_o3_native_lto.cx7a27_gcp_c2s30
76.810	10.494	9.432	3.264	nonzero	0.000	0.000	0.000	0.000	0.000	0.017	pg16rc1_o3_native_lto.cx7a27_gcp_c2s30
75.595	12.526	7.594	4.284	0.002	0.000	0.000	0.000	0.000	0.000	0.022	pg160_o3_native_lto.cx7a27_gcp_c2s30
q1000.1
- q1000.1: range queries with 1000 insert/s per client
- Legend for results is here.
- Each entry lists the percentage of responses that fit in that bucket (slower than max time for previous bucket, faster than min time for next bucket).
Query response time histogram
256us	1ms	4ms	16ms	64ms	256ms	1s	4s	16s	gt	max	tag
99.960	0.031	0.009	nonzero	nonzero	nonzero	0.000	0.000	0.000	0.000	0.092	pg152_o3_native_lto.cx7a27_gcp_c2s30
99.956	0.035	0.009	nonzero	nonzero	nonzero	0.000	0.000	0.000	0.000	0.096	pg153_o3_native_lto.cx7a27_gcp_c2s30
99.963	0.029	0.008	nonzero	nonzero	nonzero	0.000	0.000	0.000	0.000	0.094	pg154_o3_native_lto.cx7a27_gcp_c2s30
99.950	0.039	0.011	nonzero	nonzero	nonzero	0.000	0.000	0.000	0.000	0.089	pg16beta1_o3_native_lto.cx7a27_gcp_c2s30
99.959	0.032	0.009	nonzero	nonzero	0.000	0.000	0.000	0.000	0.000	0.023	pg16beta2_o3_native_lto.cx7a27_gcp_c2s30
99.959	0.032	0.009	nonzero	nonzero	0.000	0.000	0.000	0.000	0.000	0.021	pg16beta3_o3_native_lto.cx7a27_gcp_c2s30
99.954	0.035	0.011	nonzero	nonzero	nonzero	0.000	0.000	0.000	0.000	0.085	pg16rc1_o3_native_lto.cx7a27_gcp_c2s30
99.964	0.028	0.008	nonzero	nonzero	nonzero	0.000	0.000	0.000	0.000	0.081	pg160_o3_native_lto.cx7a27_gcp_c2s30
Insert response time histogram
256us	1ms	4ms	16ms	64ms	256ms	1s	4s	16s	gt	max	tag
0.000	0.000	99.755	0.240	0.004	0.000	0.000	0.000	0.000	0.000	0.061	pg152_o3_native_lto.cx7a27_gcp_c2s30
0.000	0.000	99.534	0.456	0.009	0.000	0.000	0.000	0.000	0.000	0.030	pg153_o3_native_lto.cx7a27_gcp_c2s30
0.000	0.000	99.721	0.272	0.007	0.000	0.000	0.000	0.000	0.000	0.031	pg154_o3_native_lto.cx7a27_gcp_c2s30
0.000	0.000	99.532	0.455	0.012	0.000	0.000	0.000	0.000	0.000	0.027	pg16beta1_o3_native_lto.cx7a27_gcp_c2s30
0.000	0.000	99.730	0.263	0.006	0.000	0.000	0.000	0.000	0.000	0.027	pg16beta2_o3_native_lto.cx7a27_gcp_c2s30
0.000	0.000	99.644	0.344	0.012	0.000	0.000	0.000	0.000	0.000	0.036	pg16beta3_o3_native_lto.cx7a27_gcp_c2s30
0.000	0.000	99.602	0.389	0.009	0.000	0.000	0.000	0.000	0.000	0.032	pg16rc1_o3_native_lto.cx7a27_gcp_c2s30
0.000	0.000	99.815	0.181	0.003	0.000	0.000	0.000	0.000	0.000	0.024	pg160_o3_native_lto.cx7a27_gcp_c2s30
Delete response time histogram
256us	1ms	4ms	16ms	64ms	256ms	1s	4s	16s	gt	max	tag
76.981	11.924	9.970	1.124	0.001	0.000	0.000	0.000	0.000	0.000	0.060	pg152_o3_native_lto.cx7a27_gcp_c2s30
76.589	14.041	8.041	1.327	0.002	0.000	0.000	0.000	0.000	0.000	0.024	pg153_o3_native_lto.cx7a27_gcp_c2s30
77.327	9.221	12.477	0.973	0.002	0.000	0.000	0.000	0.000	0.000	0.023	pg154_o3_native_lto.cx7a27_gcp_c2s30
76.883	16.692	6.220	0.202	0.003	0.000	0.000	0.000	0.000	0.000	0.025	pg16beta1_o3_native_lto.cx7a27_gcp_c2s30
77.667	13.049	8.395	0.888	0.002	0.000	0.000	0.000	0.000	0.000	0.024	pg16beta2_o3_native_lto.cx7a27_gcp_c2s30
76.936	10.507	9.464	3.090	0.002	0.000	0.000	0.000	0.000	0.000	0.024	pg16beta3_o3_native_lto.cx7a27_gcp_c2s30
76.782	11.396	10.880	0.937	0.004	0.000	0.000	0.000	0.000	0.000	0.029	pg16rc1_o3_native_lto.cx7a27_gcp_c2s30
78.017	11.621	7.932	2.430	nonzero	0.000	0.000	0.000	0.000	0.000	0.023	pg160_o3_native_lto.cx7a27_gcp_c2s30