Introduction
This is a report for the insert benchmark with 800M docs and 1 client(s). It is generated by scripts (bash, awk, sed) and Tufte might not be impressed. An overview of the insert benchmark is here and a short update is here. Below, by DBMS, I mean DBMS+version.config. An example is my8020.c10b40 where my means MySQL, 8020 is version 8.0.20 and c10b40 is the name for the configuration file.
The test server has 8 AMD cores, 16G RAM and an NVMe SSD. It is described here as the Beelink. The benchmark was run with 1 client and there were 1 or 3 connections per client (1 for queries or inserts without rate limits, 1+1 for rate limited inserts+deletes). It uses 1 table. It loads 800M rows per table without secondary indexes, creates secondary indexes, then inserts 30M rows per table with a delete per insert to avoid growing the table. It then does 3 read+write tests for 7200s each that do queries as fast as possible with 100, 500 and then 1000 inserts/second/client concurrent with the queries and 1000 deletes/second to avoid growing the table. The database is cached by Postgres. Clients and the DBMS share one server. The per-database configs are in the per-database subdirectories here.
The tested DBMS are:
- pg152_o3_native_lto.cx9a2_bee - Postgres 15.3, o3_native_lto build that used -O3 -march/-mtune=native, -flto, a2 config
- pg153_o3_native_lto.cx9a2_bee - Postgres 15.3, o3_native_lto build that used -O3 -march/-mtune=native, -flto, a2 config
- pg154_o3_native_lto.cx9a2_bee - Postgres 15.4, o3_native_lto build that used -O3 -march/-mtune=native, -flto, a2 config
- pg16beta1_o3_native_lto.cx9a2_bee - Postgres 16 beta1, o3_native_lto build that used -O3 -march/-mtune=native, -flto, a1 config
- pg16beta2_o3_native_lto.cx9a2_bee - Postgres 16 beta2, o3_native_lto build that used -O3 -march/-mtune=native, -flto, a2 config
- pg16beta3_o3_native_lto.cx9a2_bee - Postgres 16 beta3, o3_native_lto build that used -O3 -march/-mtune=native, -flto, a2 config
- pg16rc1_o3_native_lto.cx9a2_bee - Postgres 16 rc1, o3_native_lto build that used -O3 -march/-mtune=native, -flto, a2 config
- pg160_o3_native_lto.cx9a2_bee - Postgres 16.0, o3_native_lto build that used -O3 -march/-mtune=native, -flto, a2 config
Contents
- Summary
- l.i0: load without secondary indexes
- l.x: create secondary indexes
- l.i1: continue load after secondary indexes created
- q100.1: range queries with 100 insert/s per client
- q500.1: range queries with 500 insert/s per client
- q1000.1: range queries with 1000 insert/s per client
Summary
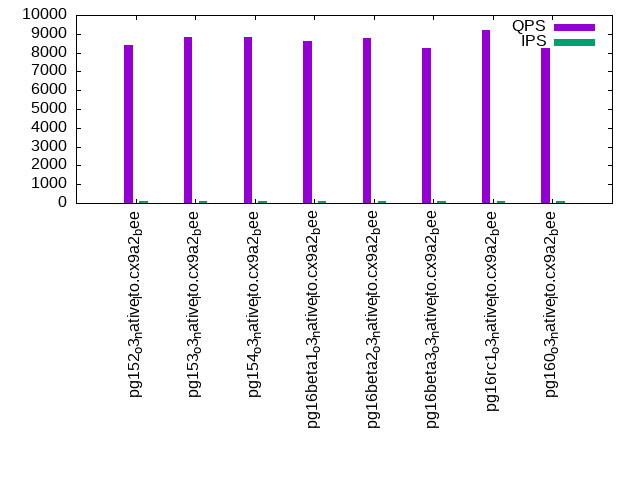
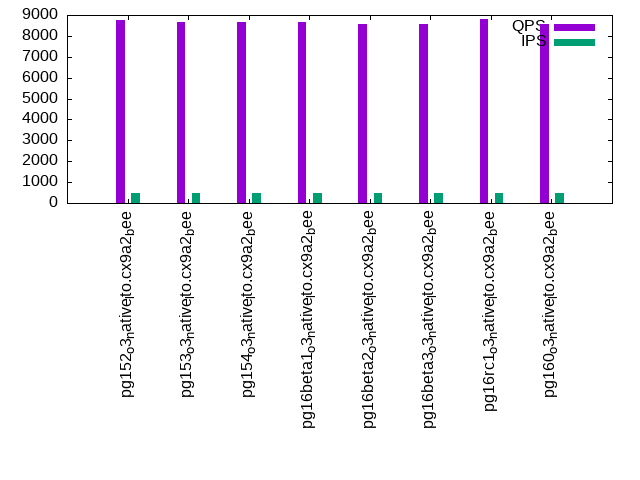
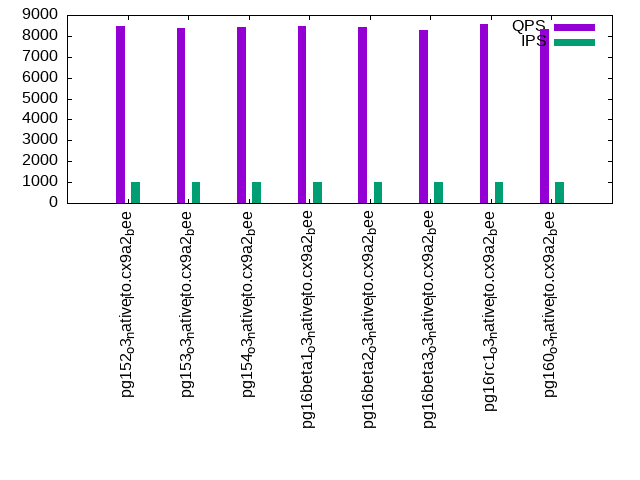
The numbers are inserts/s for l.i0 and l.i1, indexed docs (or rows) /s for l.x and queries/s for q*.2. The values are the average rate over the entire test for inserts (IPS) and queries (QPS). The range of values for IPS and QPS is split into 3 parts: bottom 25%, middle 50%, top 25%. Values in the bottom 25% have a red background, values in the top 25% have a green background and values in the middle have no color. A gray background is used for values that can be ignored because the DBMS did not sustain the target insert rate. Red backgrounds are not used when the minimum value is within 80% of the max value.
| dbms | l.i0 | l.x | l.i1 | q100.1 | q500.1 | q1000.1 |
|---|---|---|---|---|---|---|
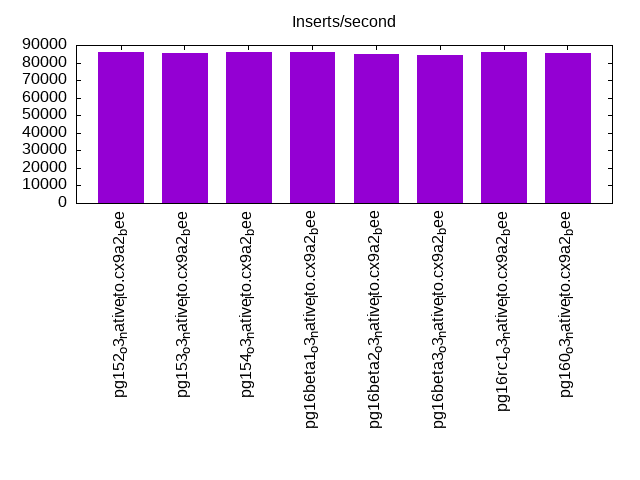
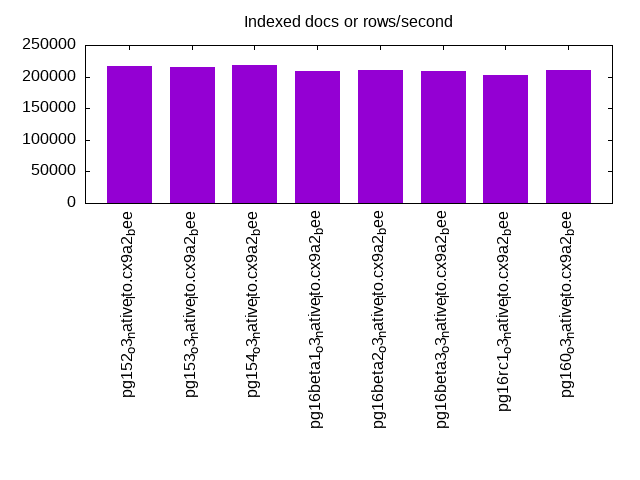
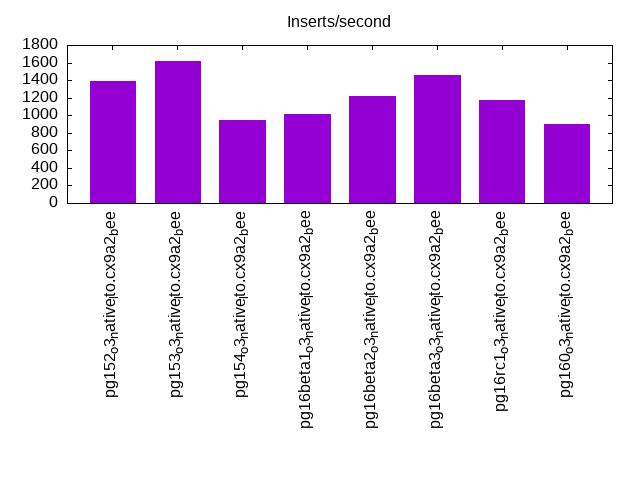
| pg152_o3_native_lto.cx9a2_bee | 86142 | 216947 | 1391 | 8409 | 8771 | 8487 |
| pg153_o3_native_lto.cx9a2_bee | 85470 | 215777 | 1620 | 8838 | 8681 | 8372 |
| pg154_o3_native_lto.cx9a2_bee | 86068 | 218070 | 940 | 8830 | 8675 | 8437 |
| pg16beta1_o3_native_lto.cx9a2_bee | 85929 | 209231 | 1012 | 8606 | 8648 | 8460 |
| pg16beta2_o3_native_lto.cx9a2_bee | 84629 | 211164 | 1223 | 8799 | 8584 | 8424 |
| pg16beta3_o3_native_lto.cx9a2_bee | 84459 | 208305 | 1460 | 8233 | 8572 | 8286 |
| pg16rc1_o3_native_lto.cx9a2_bee | 85975 | 203020 | 1175 | 9218 | 8800 | 8578 |
| pg160_o3_native_lto.cx9a2_bee | 85206 | 210830 | 899 | 8252 | 8548 | 8342 |
This table has relative throughput, throughput for the DBMS relative to the DBMS in the first line, using the absolute throughput from the previous table. Values less than 0.95 have a yellow background. Values greater than 1.05 have a blue background.
| dbms | l.i0 | l.x | l.i1 | q100.1 | q500.1 | q1000.1 |
|---|---|---|---|---|---|---|
| pg152_o3_native_lto.cx9a2_bee | 1.00 | 1.00 | 1.00 | 1.00 | 1.00 | 1.00 |
| pg153_o3_native_lto.cx9a2_bee | 0.99 | 0.99 | 1.16 | 1.05 | 0.99 | 0.99 |
| pg154_o3_native_lto.cx9a2_bee | 1.00 | 1.01 | 0.68 | 1.05 | 0.99 | 0.99 |
| pg16beta1_o3_native_lto.cx9a2_bee | 1.00 | 0.96 | 0.73 | 1.02 | 0.99 | 1.00 |
| pg16beta2_o3_native_lto.cx9a2_bee | 0.98 | 0.97 | 0.88 | 1.05 | 0.98 | 0.99 |
| pg16beta3_o3_native_lto.cx9a2_bee | 0.98 | 0.96 | 1.05 | 0.98 | 0.98 | 0.98 |
| pg16rc1_o3_native_lto.cx9a2_bee | 1.00 | 0.94 | 0.84 | 1.10 | 1.00 | 1.01 |
| pg160_o3_native_lto.cx9a2_bee | 0.99 | 0.97 | 0.65 | 0.98 | 0.97 | 0.98 |
This lists the average rate of inserts/s for the tests that do inserts concurrent with queries. For such tests the query rate is listed in the table above. The read+write tests are setup so that the insert rate should match the target rate every second. Cells that are not at least 95% of the target have a red background to indicate a failure to satisfy the target.
| dbms | q100.1 | q500.1 | q1000.1 |
|---|---|---|---|
| pg152_o3_native_lto.cx9a2_bee | 100 | 499 | 998 |
| pg153_o3_native_lto.cx9a2_bee | 100 | 499 | 999 |
| pg154_o3_native_lto.cx9a2_bee | 100 | 499 | 998 |
| pg16beta1_o3_native_lto.cx9a2_bee | 100 | 499 | 997 |
| pg16beta2_o3_native_lto.cx9a2_bee | 100 | 499 | 998 |
| pg16beta3_o3_native_lto.cx9a2_bee | 100 | 499 | 998 |
| pg16rc1_o3_native_lto.cx9a2_bee | 100 | 499 | 998 |
| pg160_o3_native_lto.cx9a2_bee | 100 | 499 | 998 |
| target | 100 | 500 | 1000 |
l.i0
l.i0: load without secondary indexes. Graphs for performance per 1-second interval are here.
Average throughput:
Insert response time histogram: each cell has the percentage of responses that take <= the time in the header and max is the max response time in seconds. For the max column values in the top 25% of the range have a red background and in the bottom 25% of the range have a green background. The red background is not used when the min value is within 80% of the max value.
| dbms | 256us | 1ms | 4ms | 16ms | 64ms | 256ms | 1s | 4s | 16s | gt | max |
|---|---|---|---|---|---|---|---|---|---|---|---|
| pg152_o3_native_lto.cx9a2_bee | 0.025 | 99.972 | 0.002 | nonzero | nonzero | 0.075 | |||||
| pg153_o3_native_lto.cx9a2_bee | 0.015 | 99.984 | 0.001 | nonzero | nonzero | 0.099 | |||||
| pg154_o3_native_lto.cx9a2_bee | 0.045 | 99.952 | 0.003 | 0.001 | nonzero | 0.105 | |||||
| pg16beta1_o3_native_lto.cx9a2_bee | 0.029 | 99.969 | 0.002 | nonzero | 0.062 | ||||||
| pg16beta2_o3_native_lto.cx9a2_bee | nonzero | 99.999 | 0.001 | nonzero | 0.061 | ||||||
| pg16beta3_o3_native_lto.cx9a2_bee | nonzero | 99.998 | 0.002 | nonzero | nonzero | 0.098 | |||||
| pg16rc1_o3_native_lto.cx9a2_bee | 0.038 | 99.960 | 0.002 | nonzero | 0.056 | ||||||
| pg160_o3_native_lto.cx9a2_bee | 0.003 | 99.994 | 0.003 | 0.001 | 0.059 |
Performance metrics for the DBMS listed above. Some are normalized by throughput, others are not. Legend for results is here.
ips	qps	rps	rmbps	wps	wmbps	rpq	rkbpq	wpi	wkbpi	csps	cpups	cspq	cpupq	dbgb1	dbgb2	rss	maxop	p50	p99	tag
86142	0	36	0.3	124.4	35.5	0.000	0.003	0.001	0.422	10381	22.7	0.121	21	76.5	116.6	1.0	0.075	86304	83807	800m.pg152_o3_native_lto.cx9a2_bee
85470	0	36	0.3	123.8	35.2	0.000	0.003	0.001	0.422	10335	22.5	0.121	21	76.5	116.6	0.6	0.099	85606	83392	800m.pg153_o3_native_lto.cx9a2_bee
86068	0	36	0.3	126.4	35.6	0.000	0.003	0.001	0.424	10405	22.7	0.121	21	76.5	116.6	0.3	0.105	86303	83704	800m.pg154_o3_native_lto.cx9a2_bee
85929	0	35	0.3	124.6	35.4	0.000	0.003	0.001	0.422	10374	22.6	0.121	21	76.5	116.6	5.0	0.062	86204	83488	800m.pg16beta1_o3_native_lto.cx9a2_bee
84629	0	35	0.3	123.1	34.9	0.000	0.003	0.001	0.423	10264	22.7	0.121	21	76.5	116.6	0.6	0.061	84908	82158	800m.pg16beta2_o3_native_lto.cx9a2_bee
84459	0	34	0.3	122.8	34.8	0.000	0.003	0.001	0.422	10216	22.7	0.121	22	76.5	116.6	0.1	0.098	84705	82138	800m.pg16beta3_o3_native_lto.cx9a2_bee
85975	0	35	0.3	124.7	35.5	0.000	0.003	0.001	0.422	10369	22.8	0.121	21	76.5	116.6	0.2	0.056	86107	83564	800m.pg16rc1_o3_native_lto.cx9a2_bee
85206	0	36	0.3	119.0	35.3	0.000	0.003	0.001	0.424	10289	22.8	0.121	21	76.5	116.6	1.2	0.059	85344	82996	800m.pg160_o3_native_lto.cx9a2_bee
l.x
l.x: create secondary indexes.
Average throughput:
Performance metrics for the DBMS listed above. Some are normalized by throughput, others are not. Legend for results is here.
ips	qps	rps	rmbps	wps	wmbps	rpq	rkbpq	wpi	wkbpi	csps	cpups	cspq	cpupq	dbgb1	dbgb2	rss	maxop	p50	p99	tag
216947	0	631	78.3	202.8	74.1	0.003	0.369	0.001	0.350	450	12.4	0.002	5	147.0	187.1	10.2	0.005	NA	NA	800m.pg152_o3_native_lto.cx9a2_bee
215777	0	628	77.9	199.6	73.7	0.003	0.370	0.001	0.350	470	12.4	0.002	5	147.0	187.1	10.2	0.005	NA	NA	800m.pg153_o3_native_lto.cx9a2_bee
218070	0	635	78.7	204.3	74.2	0.003	0.370	0.001	0.349	456	12.5	0.002	5	147.0	187.1	10.2	0.005	NA	NA	800m.pg154_o3_native_lto.cx9a2_bee
209231	0	609	75.6	195.9	71.4	0.003	0.370	0.001	0.350	418	12.4	0.002	5	147.1	187.1	10.2	0.006	NA	NA	800m.pg16beta1_o3_native_lto.cx9a2_bee
211164	0	614	76.3	196.3	72.3	0.003	0.370	0.001	0.351	422	12.4	0.002	5	147.0	187.1	10.2	0.005	NA	NA	800m.pg16beta2_o3_native_lto.cx9a2_bee
208305	0	605	75.1	196.5	71.2	0.003	0.369	0.001	0.350	405	12.4	0.002	5	147.0	187.1	10.2	0.008	NA	NA	800m.pg16beta3_o3_native_lto.cx9a2_bee
203020	0	589	73.2	187.5	69.4	0.003	0.369	0.001	0.350	422	12.4	0.002	5	147.0	187.1	10.2	0.005	NA	NA	800m.pg16rc1_o3_native_lto.cx9a2_bee
210830	0	613	76.1	191.7	71.9	0.003	0.369	0.001	0.349	450	12.5	0.002	5	147.0	187.1	10.2	0.004	NA	NA	800m.pg160_o3_native_lto.cx9a2_bee
l.i1
l.i1: continue load after secondary indexes created. Graphs for performance per 1-second interval are here.
Average throughput:
Insert response time histogram: each cell has the percentage of responses that take <= the time in the header and max is the max response time in seconds. For the max column values in the top 25% of the range have a red background and in the bottom 25% of the range have a green background. The red background is not used when the min value is within 80% of the max value.
| dbms | 256us | 1ms | 4ms | 16ms | 64ms | 256ms | 1s | 4s | 16s | gt | max |
|---|---|---|---|---|---|---|---|---|---|---|---|
| pg152_o3_native_lto.cx9a2_bee | 82.260 | 17.709 | 0.032 | nonzero | 0.273 | ||||||
| pg153_o3_native_lto.cx9a2_bee | 82.103 | 17.868 | 0.030 | 0.196 | |||||||
| pg154_o3_native_lto.cx9a2_bee | 88.468 | 11.530 | 0.002 | 0.252 | |||||||
| pg16beta1_o3_native_lto.cx9a2_bee | 80.703 | 19.269 | 0.028 | nonzero | 0.271 | ||||||
| pg16beta2_o3_native_lto.cx9a2_bee | 84.987 | 14.983 | 0.030 | nonzero | 0.265 | ||||||
| pg16beta3_o3_native_lto.cx9a2_bee | 82.885 | 17.084 | 0.031 | nonzero | 0.294 | ||||||
| pg16rc1_o3_native_lto.cx9a2_bee | 81.402 | 18.565 | 0.032 | 0.231 | |||||||
| pg160_o3_native_lto.cx9a2_bee | 86.370 | 13.626 | 0.004 | 0.207 |
Delete response time histogram: each cell has the percentage of responses that take <= the time in the header and max is the max response time in seconds. For the max column values in the top 25% of the range have a red background and in the bottom 25% of the range have a green background. The red background is not used when the min value is within 80% of the max value.
| dbms | 256us | 1ms | 4ms | 16ms | 64ms | 256ms | 1s | 4s | 16s | gt | max |
|---|---|---|---|---|---|---|---|---|---|---|---|
| pg152_o3_native_lto.cx9a2_bee | 0.001 | 54.322 | 0.719 | 3.750 | 20.009 | 21.199 | 0.123 | ||||
| pg153_o3_native_lto.cx9a2_bee | 0.001 | 58.486 | 0.839 | 4.481 | 20.259 | 15.935 | 0.102 | ||||
| pg154_o3_native_lto.cx9a2_bee | 0.003 | 48.612 | 0.810 | 4.523 | 16.787 | 29.265 | nonzero | 0.281 | |||
| pg16beta1_o3_native_lto.cx9a2_bee | 0.002 | 46.577 | 0.843 | 4.396 | 16.449 | 31.734 | 0.167 | ||||
| pg16beta2_o3_native_lto.cx9a2_bee | 0.003 | 56.383 | 0.692 | 3.754 | 14.062 | 25.106 | 0.167 | ||||
| pg16beta3_o3_native_lto.cx9a2_bee | 0.003 | 62.224 | 0.715 | 3.713 | 13.978 | 19.367 | 0.137 | ||||
| pg16rc1_o3_native_lto.cx9a2_bee | 0.002 | 55.801 | 0.685 | 3.766 | 13.915 | 25.832 | 0.159 | ||||
| pg160_o3_native_lto.cx9a2_bee | 0.003 | 50.140 | 0.801 | 4.492 | 16.317 | 28.247 | nonzero | 0.343 |
Performance metrics for the DBMS listed above. Some are normalized by throughput, others are not. Legend for results is here.
ips	qps	rps	rmbps	wps	wmbps	rpq	rkbpq	wpi	wkbpi	csps	cpups	cspq	cpupq	dbgb1	dbgb2	rss	maxop	p50	p99	tag
1391	0	2262	22.1	2662.6	40.3	1.627	16.244	1.914	29.653	5420	12.3	3.897	708	150.9	190.5	8.7	0.273	750	447	800m.pg152_o3_native_lto.cx9a2_bee
1620	0	2635	25.7	3095.7	46.7	1.627	16.251	1.911	29.506	6283	12.0	3.879	593	150.9	190.9	9.1	0.196	849	499	800m.pg153_o3_native_lto.cx9a2_bee
940	0	1506	12.0	1747.9	25.7	1.601	13.029	1.859	27.957	3667	12.5	3.900	1063	152.2	192.2	9.7	0.252	400	250	800m.pg154_o3_native_lto.cx9a2_bee
1012	0	1652	16.1	1950.3	30.2	1.632	16.282	1.927	30.596	4026	12.7	3.977	1004	151.5	191.5	8.7	0.271	499	300	800m.pg16beta1_o3_native_lto.cx9a2_bee
1223	0	1989	19.4	2345.8	36.0	1.627	16.235	1.918	30.144	4785	12.5	3.913	818	150.7	190.8	8.8	0.265	549	309	800m.pg16beta2_o3_native_lto.cx9a2_bee
1460	0	2373	23.1	2795.9	42.4	1.625	16.206	1.915	29.768	5676	12.0	3.887	657	150.6	190.6	2.3	0.294	699	399	800m.pg16beta3_o3_native_lto.cx9a2_bee
1175	0	1912	18.6	2259.0	34.8	1.628	16.244	1.923	30.297	4620	12.4	3.932	844	150.8	190.9	8.6	0.231	549	300	800m.pg16rc1_o3_native_lto.cx9a2_bee
899	0	1441	11.5	1671.5	24.9	1.602	13.139	1.859	28.382	3519	12.4	3.912	1103	152.2	192.2	1.3	0.207	350	249	800m.pg160_o3_native_lto.cx9a2_bee
q100.1
q100.1: range queries with 100 insert/s per client. Graphs for performance per 1-second interval are here.
Average throughput:
Query response time histogram: each cell has the percentage of responses that take <= the time in the header and max is the max response time in seconds. For max values in the top 25% of the range have a red background and in the bottom 25% of the range have a green background. The red background is not used when the min value is within 80% of the max value.
| dbms | 256us | 1ms | 4ms | 16ms | 64ms | 256ms | 1s | 4s | 16s | gt | max |
|---|---|---|---|---|---|---|---|---|---|---|---|
| pg152_o3_native_lto.cx9a2_bee | 99.841 | 0.157 | 0.001 | 0.001 | 0.016 | ||||||
| pg153_o3_native_lto.cx9a2_bee | 99.849 | 0.149 | 0.001 | 0.001 | 0.016 | ||||||
| pg154_o3_native_lto.cx9a2_bee | 99.879 | 0.119 | nonzero | 0.002 | 0.015 | ||||||
| pg16beta1_o3_native_lto.cx9a2_bee | 99.848 | 0.150 | 0.001 | 0.001 | 0.016 | ||||||
| pg16beta2_o3_native_lto.cx9a2_bee | 99.851 | 0.146 | 0.001 | 0.001 | 0.016 | ||||||
| pg16beta3_o3_native_lto.cx9a2_bee | 99.832 | 0.166 | nonzero | 0.001 | nonzero | 0.020 | |||||
| pg16rc1_o3_native_lto.cx9a2_bee | 99.862 | 0.136 | nonzero | 0.001 | 0.016 | ||||||
| pg160_o3_native_lto.cx9a2_bee | 99.874 | 0.125 | nonzero | 0.002 | nonzero | 0.017 |
Insert response time histogram: each cell has the percentage of responses that take <= the time in the header and max is the max response time in seconds. For max values in the top 25% of the range have a red background and in the bottom 25% of the range have a green background. The red background is not used when the min value is within 80% of the max value.
| dbms | 256us | 1ms | 4ms | 16ms | 64ms | 256ms | 1s | 4s | 16s | gt | max |
|---|---|---|---|---|---|---|---|---|---|---|---|
| pg152_o3_native_lto.cx9a2_bee | 69.090 | 30.910 | 0.033 | ||||||||
| pg153_o3_native_lto.cx9a2_bee | 74.438 | 25.562 | 0.031 | ||||||||
| pg154_o3_native_lto.cx9a2_bee | 73.257 | 26.743 | 0.031 | ||||||||
| pg16beta1_o3_native_lto.cx9a2_bee | 71.229 | 28.771 | 0.033 | ||||||||
| pg16beta2_o3_native_lto.cx9a2_bee | 68.799 | 31.201 | 0.034 | ||||||||
| pg16beta3_o3_native_lto.cx9a2_bee | 75.479 | 24.521 | 0.030 | ||||||||
| pg16rc1_o3_native_lto.cx9a2_bee | 75.472 | 24.528 | 0.031 | ||||||||
| pg160_o3_native_lto.cx9a2_bee | 72.389 | 27.611 | 0.030 |
Delete response time histogram: each cell has the percentage of responses that take <= the time in the header and max is the max response time in seconds. For max values in the top 25% of the range have a red background and in the bottom 25% of the range have a green background. The red background is not used when the min value is within 80% of the max value.
| dbms | 256us | 1ms | 4ms | 16ms | 64ms | 256ms | 1s | 4s | 16s | gt | max |
|---|---|---|---|---|---|---|---|---|---|---|---|
| pg152_o3_native_lto.cx9a2_bee | 0.583 | 43.444 | 27.451 | 28.521 | 0.013 | ||||||
| pg153_o3_native_lto.cx9a2_bee | 7.431 | 32.111 | 60.458 | 0.015 | |||||||
| pg154_o3_native_lto.cx9a2_bee | 0.799 | 98.799 | 0.049 | 0.354 | 0.010 | ||||||
| pg16beta1_o3_native_lto.cx9a2_bee | 0.938 | 98.431 | 0.083 | 0.549 | 0.009 | ||||||
| pg16beta2_o3_native_lto.cx9a2_bee | 0.458 | 99.028 | 0.069 | 0.444 | 0.009 | ||||||
| pg16beta3_o3_native_lto.cx9a2_bee | 0.611 | 99.097 | 0.056 | 0.236 | 0.009 | ||||||
| pg16rc1_o3_native_lto.cx9a2_bee | 0.375 | 99.215 | 0.049 | 0.361 | 0.010 | ||||||
| pg160_o3_native_lto.cx9a2_bee | 0.799 | 98.812 | 0.056 | 0.333 | 0.010 |
Performance metrics for the DBMS listed above. Some are normalized by throughput, others are not. Legend for results is here.
ips	qps	rps	rmbps	wps	wmbps	rpq	rkbpq	wpi	wkbpi	csps	cpups	cspq	cpupq	dbgb1	dbgb2	rss	maxop	p50	p99	tag
100	8409	180	1.4	217.9	3.5	0.021	0.176	2.184	36.189	32772	13.2	3.897	126	150.9	187.9	10.1	0.016	8252	7658	800m.pg152_o3_native_lto.cx9a2_bee
100	8838	180	1.4	215.2	3.6	0.020	0.167	2.156	36.729	34423	12.9	3.895	117	150.9	184.8	10.1	0.016	8295	7672	800m.pg153_o3_native_lto.cx9a2_bee
100	8830	175	1.4	199.4	3.3	0.020	0.161	2.000	34.337	34367	13.0	3.892	118	152.2	187.7	10.1	0.015	8330	7834	800m.pg154_o3_native_lto.cx9a2_bee
100	8606	181	1.4	207.9	3.4	0.021	0.172	2.087	35.057	33588	12.9	3.903	120	151.5	188.1	10.0	0.016	8244	7094	800m.pg16beta1_o3_native_lto.cx9a2_bee
100	8799	178	1.4	232.4	3.6	0.020	0.166	2.331	37.396	34295	12.9	3.898	117	150.8	186.7	10.1	0.016	8280	7317	800m.pg16beta2_o3_native_lto.cx9a2_bee
100	8233	178	1.4	202.9	3.4	0.022	0.177	2.035	35.424	32117	13.1	3.901	127	150.7	184.9	10.1	0.020	8135	7366	800m.pg16beta3_o3_native_lto.cx9a2_bee
100	9218	180	1.4	217.0	3.6	0.019	0.159	2.177	36.770	35879	12.8	3.892	111	150.9	187.9	10.1	0.016	8740	7658	800m.pg16rc1_o3_native_lto.cx9a2_bee
100	8252	175	1.4	199.8	3.3	0.021	0.173	2.002	34.130	32162	13.2	3.897	128	152.2	187.9	10.1	0.017	8181	7832	800m.pg160_o3_native_lto.cx9a2_bee
q500.1
q500.1: range queries with 500 insert/s per client. Graphs for performance per 1-second interval are here.
Average throughput:
Query response time histogram: each cell has the percentage of responses that take <= the time in the header and max is the max response time in seconds. For max values in the top 25% of the range have a red background and in the bottom 25% of the range have a green background. The red background is not used when the min value is within 80% of the max value.
| dbms | 256us | 1ms | 4ms | 16ms | 64ms | 256ms | 1s | 4s | 16s | gt | max |
|---|---|---|---|---|---|---|---|---|---|---|---|
| pg152_o3_native_lto.cx9a2_bee | 99.921 | 0.073 | 0.001 | 0.005 | 0.016 | ||||||
| pg153_o3_native_lto.cx9a2_bee | 99.907 | 0.088 | 0.001 | 0.004 | nonzero | 0.016 | |||||
| pg154_o3_native_lto.cx9a2_bee | 99.919 | 0.077 | 0.001 | 0.004 | 0.016 | ||||||
| pg16beta1_o3_native_lto.cx9a2_bee | 99.918 | 0.078 | 0.001 | 0.004 | 0.016 | ||||||
| pg16beta2_o3_native_lto.cx9a2_bee | 99.918 | 0.077 | 0.001 | 0.005 | 0.016 | ||||||
| pg16beta3_o3_native_lto.cx9a2_bee | 99.913 | 0.083 | 0.001 | 0.004 | 0.016 | ||||||
| pg16rc1_o3_native_lto.cx9a2_bee | 99.916 | 0.079 | 0.001 | 0.004 | 0.016 | ||||||
| pg160_o3_native_lto.cx9a2_bee | 99.913 | 0.083 | nonzero | 0.004 | 0.016 |
Insert response time histogram: each cell has the percentage of responses that take <= the time in the header and max is the max response time in seconds. For max values in the top 25% of the range have a red background and in the bottom 25% of the range have a green background. The red background is not used when the min value is within 80% of the max value.
| dbms | 256us | 1ms | 4ms | 16ms | 64ms | 256ms | 1s | 4s | 16s | gt | max |
|---|---|---|---|---|---|---|---|---|---|---|---|
| pg152_o3_native_lto.cx9a2_bee | 93.560 | 6.440 | 0.029 | ||||||||
| pg153_o3_native_lto.cx9a2_bee | 93.535 | 6.465 | 0.029 | ||||||||
| pg154_o3_native_lto.cx9a2_bee | 94.576 | 5.424 | 0.029 | ||||||||
| pg16beta1_o3_native_lto.cx9a2_bee | 93.456 | 6.544 | 0.033 | ||||||||
| pg16beta2_o3_native_lto.cx9a2_bee | 93.251 | 6.749 | 0.029 | ||||||||
| pg16beta3_o3_native_lto.cx9a2_bee | 93.414 | 6.586 | 0.031 | ||||||||
| pg16rc1_o3_native_lto.cx9a2_bee | 92.825 | 7.175 | 0.032 | ||||||||
| pg160_o3_native_lto.cx9a2_bee | 93.987 | 6.013 | 0.029 |
Delete response time histogram: each cell has the percentage of responses that take <= the time in the header and max is the max response time in seconds. For max values in the top 25% of the range have a red background and in the bottom 25% of the range have a green background. The red background is not used when the min value is within 80% of the max value.
| dbms | 256us | 1ms | 4ms | 16ms | 64ms | 256ms | 1s | 4s | 16s | gt | max |
|---|---|---|---|---|---|---|---|---|---|---|---|
| pg152_o3_native_lto.cx9a2_bee | 9.797 | 89.917 | 0.088 | 0.199 | 0.010 | ||||||
| pg153_o3_native_lto.cx9a2_bee | 1.651 | 17.531 | 0.029 | 24.131 | 56.658 | 0.038 | |||||
| pg154_o3_native_lto.cx9a2_bee | 7.900 | 91.857 | 0.089 | 0.154 | 0.009 | ||||||
| pg16beta1_o3_native_lto.cx9a2_bee | 9.069 | 90.632 | 0.078 | 0.221 | 0.009 | ||||||
| pg16beta2_o3_native_lto.cx9a2_bee | 8.690 | 90.971 | 0.068 | 0.271 | 0.009 | ||||||
| pg16beta3_o3_native_lto.cx9a2_bee | 7.232 | 92.474 | 0.081 | 0.214 | 0.010 | ||||||
| pg16rc1_o3_native_lto.cx9a2_bee | 8.306 | 91.365 | 0.061 | 0.268 | 0.009 | ||||||
| pg160_o3_native_lto.cx9a2_bee | 7.989 | 91.761 | 0.062 | 0.188 | 0.009 |
Performance metrics for the DBMS listed above. Some are normalized by throughput, others are not. Legend for results is here.
ips	qps	rps	rmbps	wps	wmbps	rpq	rkbpq	wpi	wkbpi	csps	cpups	cspq	cpupq	dbgb1	dbgb2	rss	maxop	p50	p99	tag
499	8771	805	6.4	976.0	14.6	0.092	0.750	1.956	29.886	35577	13.5	4.056	123	151.1	181.6	10.1	0.016	8328	8035	800m.pg152_o3_native_lto.cx9a2_bee
499	8681	806	6.4	985.5	14.6	0.093	0.759	1.975	30.001	35237	15.6	4.059	144	151.1	180.8	10.1	0.016	8231	7916	800m.pg153_o3_native_lto.cx9a2_bee
499	8675	802	6.4	967.4	14.5	0.092	0.755	1.939	29.839	35227	13.5	4.061	124	152.3	182.4	10.1	0.016	8310	8044	800m.pg154_o3_native_lto.cx9a2_bee
499	8648	804	6.4	968.9	14.6	0.093	0.763	1.943	29.896	35132	13.5	4.063	125	151.5	182.0	10.0	0.016	8326	8053	800m.pg16beta1_o3_native_lto.cx9a2_bee
499	8584	805	6.4	973.6	14.6	0.094	0.766	1.952	29.893	34870	13.5	4.062	126	151.0	180.8	10.1	0.016	8263	8006	800m.pg16beta2_o3_native_lto.cx9a2_bee
499	8572	805	6.4	987.5	14.7	0.094	0.767	1.979	30.172	34816	13.5	4.062	126	150.9	180.5	10.1	0.016	8133	7877	800m.pg16beta3_o3_native_lto.cx9a2_bee
499	8800	805	6.4	984.3	14.6	0.091	0.747	1.973	30.023	35702	13.6	4.057	124	151.1	180.8	10.1	0.016	8423	8119	800m.pg16rc1_o3_native_lto.cx9a2_bee
499	8548	803	6.4	966.7	14.5	0.094	0.767	1.937	29.827	34737	13.5	4.064	126	152.3	182.5	10.1	0.016	8135	7850	800m.pg160_o3_native_lto.cx9a2_bee
q1000.1
q1000.1: range queries with 1000 insert/s per client. Graphs for performance per 1-second interval are here.
Average throughput:
Query response time histogram: each cell has the percentage of responses that take <= the time in the header and max is the max response time in seconds. For max values in the top 25% of the range have a red background and in the bottom 25% of the range have a green background. The red background is not used when the min value is within 80% of the max value.
| dbms | 256us | 1ms | 4ms | 16ms | 64ms | 256ms | 1s | 4s | 16s | gt | max |
|---|---|---|---|---|---|---|---|---|---|---|---|
| pg152_o3_native_lto.cx9a2_bee | 99.859 | 0.130 | 0.002 | 0.010 | 0.016 | ||||||
| pg153_o3_native_lto.cx9a2_bee | 99.858 | 0.130 | 0.002 | 0.010 | 0.016 | ||||||
| pg154_o3_native_lto.cx9a2_bee | 99.862 | 0.127 | 0.002 | 0.010 | 0.016 | ||||||
| pg16beta1_o3_native_lto.cx9a2_bee | 99.857 | 0.131 | 0.002 | 0.010 | nonzero | 0.016 | |||||
| pg16beta2_o3_native_lto.cx9a2_bee | 99.860 | 0.128 | 0.002 | 0.010 | nonzero | 0.016 | |||||
| pg16beta3_o3_native_lto.cx9a2_bee | 99.856 | 0.133 | 0.002 | 0.010 | 0.016 | ||||||
| pg16rc1_o3_native_lto.cx9a2_bee | 99.862 | 0.126 | 0.002 | 0.010 | nonzero | 0.019 | |||||
| pg160_o3_native_lto.cx9a2_bee | 99.857 | 0.131 | 0.002 | 0.010 | nonzero | 0.016 |
Insert response time histogram: each cell has the percentage of responses that take <= the time in the header and max is the max response time in seconds. For max values in the top 25% of the range have a red background and in the bottom 25% of the range have a green background. The red background is not used when the min value is within 80% of the max value.
| dbms | 256us | 1ms | 4ms | 16ms | 64ms | 256ms | 1s | 4s | 16s | gt | max |
|---|---|---|---|---|---|---|---|---|---|---|---|
| pg152_o3_native_lto.cx9a2_bee | 97.946 | 2.054 | 0.027 | ||||||||
| pg153_o3_native_lto.cx9a2_bee | 97.876 | 2.124 | 0.028 | ||||||||
| pg154_o3_native_lto.cx9a2_bee | 98.154 | 1.846 | 0.026 | ||||||||
| pg16beta1_o3_native_lto.cx9a2_bee | 98.009 | 1.991 | 0.027 | ||||||||
| pg16beta2_o3_native_lto.cx9a2_bee | 97.966 | 2.034 | 0.027 | ||||||||
| pg16beta3_o3_native_lto.cx9a2_bee | 97.946 | 2.054 | 0.028 | ||||||||
| pg16rc1_o3_native_lto.cx9a2_bee | 97.819 | 2.181 | 0.028 | ||||||||
| pg160_o3_native_lto.cx9a2_bee | 98.001 | 1.999 | 0.027 |
Delete response time histogram: each cell has the percentage of responses that take <= the time in the header and max is the max response time in seconds. For max values in the top 25% of the range have a red background and in the bottom 25% of the range have a green background. The red background is not used when the min value is within 80% of the max value.
| dbms | 256us | 1ms | 4ms | 16ms | 64ms | 256ms | 1s | 4s | 16s | gt | max |
|---|---|---|---|---|---|---|---|---|---|---|---|
| pg152_o3_native_lto.cx9a2_bee | 6.069 | 93.752 | 0.078 | 0.101 | 0.010 | ||||||
| pg153_o3_native_lto.cx9a2_bee | 5.434 | 94.397 | 0.069 | 0.101 | 0.012 | ||||||
| pg154_o3_native_lto.cx9a2_bee | 5.179 | 94.681 | 0.069 | 0.070 | 0.010 | ||||||
| pg16beta1_o3_native_lto.cx9a2_bee | 5.494 | 94.356 | 0.053 | 0.096 | 0.009 | ||||||
| pg16beta2_o3_native_lto.cx9a2_bee | 5.321 | 94.499 | 0.062 | 0.117 | 0.010 | ||||||
| pg16beta3_o3_native_lto.cx9a2_bee | 4.726 | 95.131 | 0.053 | 0.091 | 0.010 | ||||||
| pg16rc1_o3_native_lto.cx9a2_bee | 5.010 | 94.829 | 0.058 | 0.103 | 0.010 | ||||||
| pg160_o3_native_lto.cx9a2_bee | 5.203 | 94.658 | 0.053 | 0.086 | 0.009 |
Performance metrics for the DBMS listed above. Some are normalized by throughput, others are not. Legend for results is here.
ips	qps	rps	rmbps	wps	wmbps	rpq	rkbpq	wpi	wkbpi	csps	cpups	cspq	cpupq	dbgb1	dbgb2	rss	maxop	p50	p99	tag
998	8487	1625	13.0	1961.5	28.8	0.192	1.570	1.965	29.522	36423	14.7	4.292	139	151.6	190.7	9.8	0.016	8182	7767	800m.pg152_o3_native_lto.cx9a2_bee
999	8372	1624	13.0	1951.8	28.5	0.194	1.588	1.955	29.225	35955	14.7	4.295	140	151.7	190.9	9.8	0.016	8086	7765	800m.pg153_o3_native_lto.cx9a2_bee
998	8437	1624	13.0	1942.5	28.3	0.192	1.577	1.946	29.047	36238	14.7	4.295	139	152.9	192.1	9.9	0.016	8108	7797	800m.pg154_o3_native_lto.cx9a2_bee
997	8460	1626	13.1	1953.0	28.3	0.192	1.582	1.959	29.048	36336	14.6	4.295	138	151.7	190.9	9.8	0.016	8170	7794	800m.pg16beta1_o3_native_lto.cx9a2_bee
998	8424	1625	13.0	1957.4	28.8	0.193	1.580	1.962	29.592	36159	14.8	4.292	141	151.6	190.7	9.7	0.016	8184	7866	800m.pg16beta2_o3_native_lto.cx9a2_bee
998	8286	1625	13.0	1943.1	28.4	0.196	1.606	1.947	29.109	35615	14.7	4.298	142	151.6	190.8	9.7	0.016	7998	7656	800m.pg16beta3_o3_native_lto.cx9a2_bee
998	8578	1625	13.0	1950.7	28.6	0.189	1.553	1.954	29.313	36729	14.7	4.282	137	151.6	190.9	9.7	0.019	8276	7912	800m.pg16rc1_o3_native_lto.cx9a2_bee
998	8342	1624	13.0	1942.0	28.3	0.195	1.594	1.946	29.035	35880	14.7	4.301	141	152.9	192.1	9.8	0.016	8040	7751	800m.pg160_o3_native_lto.cx9a2_bee
l.i0
l.i0: load without secondary indexes
Performance metrics for all DBMS, not just the ones listed above. Some are normalized by throughput, others are not. Legend for results is here.
ips	qps	rps	rmbps	wps	wmbps	rpq	rkbpq	wpi	wkbpi	csps	cpups	cspq	cpupq	dbgb1	dbgb2	rss	maxop	p50	p99	tag
86142	0	36	0.3	124.4	35.5	0.000	0.003	0.001	0.422	10381	22.7	0.121	21	76.5	116.6	1.0	0.075	86304	83807	800m.pg152_o3_native_lto.cx9a2_bee
85470	0	36	0.3	123.8	35.2	0.000	0.003	0.001	0.422	10335	22.5	0.121	21	76.5	116.6	0.6	0.099	85606	83392	800m.pg153_o3_native_lto.cx9a2_bee
86068	0	36	0.3	126.4	35.6	0.000	0.003	0.001	0.424	10405	22.7	0.121	21	76.5	116.6	0.3	0.105	86303	83704	800m.pg154_o3_native_lto.cx9a2_bee
85929	0	35	0.3	124.6	35.4	0.000	0.003	0.001	0.422	10374	22.6	0.121	21	76.5	116.6	5.0	0.062	86204	83488	800m.pg16beta1_o3_native_lto.cx9a2_bee
84629	0	35	0.3	123.1	34.9	0.000	0.003	0.001	0.423	10264	22.7	0.121	21	76.5	116.6	0.6	0.061	84908	82158	800m.pg16beta2_o3_native_lto.cx9a2_bee
84459	0	34	0.3	122.8	34.8	0.000	0.003	0.001	0.422	10216	22.7	0.121	22	76.5	116.6	0.1	0.098	84705	82138	800m.pg16beta3_o3_native_lto.cx9a2_bee
85975	0	35	0.3	124.7	35.5	0.000	0.003	0.001	0.422	10369	22.8	0.121	21	76.5	116.6	0.2	0.056	86107	83564	800m.pg16rc1_o3_native_lto.cx9a2_bee
85206	0	36	0.3	119.0	35.3	0.000	0.003	0.001	0.424	10289	22.8	0.121	21	76.5	116.6	1.2	0.059	85344	82996	800m.pg160_o3_native_lto.cx9a2_bee
l.x
l.x: create secondary indexes
Performance metrics for all DBMS, not just the ones listed above. Some are normalized by throughput, others are not. Legend for results is here.
ips	qps	rps	rmbps	wps	wmbps	rpq	rkbpq	wpi	wkbpi	csps	cpups	cspq	cpupq	dbgb1	dbgb2	rss	maxop	p50	p99	tag
216947	0	631	78.3	202.8	74.1	0.003	0.369	0.001	0.350	450	12.4	0.002	5	147.0	187.1	10.2	0.005	NA	NA	800m.pg152_o3_native_lto.cx9a2_bee
215777	0	628	77.9	199.6	73.7	0.003	0.370	0.001	0.350	470	12.4	0.002	5	147.0	187.1	10.2	0.005	NA	NA	800m.pg153_o3_native_lto.cx9a2_bee
218070	0	635	78.7	204.3	74.2	0.003	0.370	0.001	0.349	456	12.5	0.002	5	147.0	187.1	10.2	0.005	NA	NA	800m.pg154_o3_native_lto.cx9a2_bee
209231	0	609	75.6	195.9	71.4	0.003	0.370	0.001	0.350	418	12.4	0.002	5	147.1	187.1	10.2	0.006	NA	NA	800m.pg16beta1_o3_native_lto.cx9a2_bee
211164	0	614	76.3	196.3	72.3	0.003	0.370	0.001	0.351	422	12.4	0.002	5	147.0	187.1	10.2	0.005	NA	NA	800m.pg16beta2_o3_native_lto.cx9a2_bee
208305	0	605	75.1	196.5	71.2	0.003	0.369	0.001	0.350	405	12.4	0.002	5	147.0	187.1	10.2	0.008	NA	NA	800m.pg16beta3_o3_native_lto.cx9a2_bee
203020	0	589	73.2	187.5	69.4	0.003	0.369	0.001	0.350	422	12.4	0.002	5	147.0	187.1	10.2	0.005	NA	NA	800m.pg16rc1_o3_native_lto.cx9a2_bee
210830	0	613	76.1	191.7	71.9	0.003	0.369	0.001	0.349	450	12.5	0.002	5	147.0	187.1	10.2	0.004	NA	NA	800m.pg160_o3_native_lto.cx9a2_bee
l.i1
l.i1: continue load after secondary indexes created
Performance metrics for all DBMS, not just the ones listed above. Some are normalized by throughput, others are not. Legend for results is here.
ips	qps	rps	rmbps	wps	wmbps	rpq	rkbpq	wpi	wkbpi	csps	cpups	cspq	cpupq	dbgb1	dbgb2	rss	maxop	p50	p99	tag
1391	0	2262	22.1	2662.6	40.3	1.627	16.244	1.914	29.653	5420	12.3	3.897	708	150.9	190.5	8.7	0.273	750	447	800m.pg152_o3_native_lto.cx9a2_bee
1620	0	2635	25.7	3095.7	46.7	1.627	16.251	1.911	29.506	6283	12.0	3.879	593	150.9	190.9	9.1	0.196	849	499	800m.pg153_o3_native_lto.cx9a2_bee
940	0	1506	12.0	1747.9	25.7	1.601	13.029	1.859	27.957	3667	12.5	3.900	1063	152.2	192.2	9.7	0.252	400	250	800m.pg154_o3_native_lto.cx9a2_bee
1012	0	1652	16.1	1950.3	30.2	1.632	16.282	1.927	30.596	4026	12.7	3.977	1004	151.5	191.5	8.7	0.271	499	300	800m.pg16beta1_o3_native_lto.cx9a2_bee
1223	0	1989	19.4	2345.8	36.0	1.627	16.235	1.918	30.144	4785	12.5	3.913	818	150.7	190.8	8.8	0.265	549	309	800m.pg16beta2_o3_native_lto.cx9a2_bee
1460	0	2373	23.1	2795.9	42.4	1.625	16.206	1.915	29.768	5676	12.0	3.887	657	150.6	190.6	2.3	0.294	699	399	800m.pg16beta3_o3_native_lto.cx9a2_bee
1175	0	1912	18.6	2259.0	34.8	1.628	16.244	1.923	30.297	4620	12.4	3.932	844	150.8	190.9	8.6	0.231	549	300	800m.pg16rc1_o3_native_lto.cx9a2_bee
899	0	1441	11.5	1671.5	24.9	1.602	13.139	1.859	28.382	3519	12.4	3.912	1103	152.2	192.2	1.3	0.207	350	249	800m.pg160_o3_native_lto.cx9a2_bee
q100.1
q100.1: range queries with 100 insert/s per client
Performance metrics for all DBMS, not just the ones listed above. Some are normalized by throughput, others are not. Legend for results is here.
ips	qps	rps	rmbps	wps	wmbps	rpq	rkbpq	wpi	wkbpi	csps	cpups	cspq	cpupq	dbgb1	dbgb2	rss	maxop	p50	p99	tag
100	8409	180	1.4	217.9	3.5	0.021	0.176	2.184	36.189	32772	13.2	3.897	126	150.9	187.9	10.1	0.016	8252	7658	800m.pg152_o3_native_lto.cx9a2_bee
100	8838	180	1.4	215.2	3.6	0.020	0.167	2.156	36.729	34423	12.9	3.895	117	150.9	184.8	10.1	0.016	8295	7672	800m.pg153_o3_native_lto.cx9a2_bee
100	8830	175	1.4	199.4	3.3	0.020	0.161	2.000	34.337	34367	13.0	3.892	118	152.2	187.7	10.1	0.015	8330	7834	800m.pg154_o3_native_lto.cx9a2_bee
100	8606	181	1.4	207.9	3.4	0.021	0.172	2.087	35.057	33588	12.9	3.903	120	151.5	188.1	10.0	0.016	8244	7094	800m.pg16beta1_o3_native_lto.cx9a2_bee
100	8799	178	1.4	232.4	3.6	0.020	0.166	2.331	37.396	34295	12.9	3.898	117	150.8	186.7	10.1	0.016	8280	7317	800m.pg16beta2_o3_native_lto.cx9a2_bee
100	8233	178	1.4	202.9	3.4	0.022	0.177	2.035	35.424	32117	13.1	3.901	127	150.7	184.9	10.1	0.020	8135	7366	800m.pg16beta3_o3_native_lto.cx9a2_bee
100	9218	180	1.4	217.0	3.6	0.019	0.159	2.177	36.770	35879	12.8	3.892	111	150.9	187.9	10.1	0.016	8740	7658	800m.pg16rc1_o3_native_lto.cx9a2_bee
100	8252	175	1.4	199.8	3.3	0.021	0.173	2.002	34.130	32162	13.2	3.897	128	152.2	187.9	10.1	0.017	8181	7832	800m.pg160_o3_native_lto.cx9a2_bee
q500.1
q500.1: range queries with 500 insert/s per client
Performance metrics for all DBMS, not just the ones listed above. Some are normalized by throughput, others are not. Legend for results is here.
ips	qps	rps	rmbps	wps	wmbps	rpq	rkbpq	wpi	wkbpi	csps	cpups	cspq	cpupq	dbgb1	dbgb2	rss	maxop	p50	p99	tag
499	8771	805	6.4	976.0	14.6	0.092	0.750	1.956	29.886	35577	13.5	4.056	123	151.1	181.6	10.1	0.016	8328	8035	800m.pg152_o3_native_lto.cx9a2_bee
499	8681	806	6.4	985.5	14.6	0.093	0.759	1.975	30.001	35237	15.6	4.059	144	151.1	180.8	10.1	0.016	8231	7916	800m.pg153_o3_native_lto.cx9a2_bee
499	8675	802	6.4	967.4	14.5	0.092	0.755	1.939	29.839	35227	13.5	4.061	124	152.3	182.4	10.1	0.016	8310	8044	800m.pg154_o3_native_lto.cx9a2_bee
499	8648	804	6.4	968.9	14.6	0.093	0.763	1.943	29.896	35132	13.5	4.063	125	151.5	182.0	10.0	0.016	8326	8053	800m.pg16beta1_o3_native_lto.cx9a2_bee
499	8584	805	6.4	973.6	14.6	0.094	0.766	1.952	29.893	34870	13.5	4.062	126	151.0	180.8	10.1	0.016	8263	8006	800m.pg16beta2_o3_native_lto.cx9a2_bee
499	8572	805	6.4	987.5	14.7	0.094	0.767	1.979	30.172	34816	13.5	4.062	126	150.9	180.5	10.1	0.016	8133	7877	800m.pg16beta3_o3_native_lto.cx9a2_bee
499	8800	805	6.4	984.3	14.6	0.091	0.747	1.973	30.023	35702	13.6	4.057	124	151.1	180.8	10.1	0.016	8423	8119	800m.pg16rc1_o3_native_lto.cx9a2_bee
499	8548	803	6.4	966.7	14.5	0.094	0.767	1.937	29.827	34737	13.5	4.064	126	152.3	182.5	10.1	0.016	8135	7850	800m.pg160_o3_native_lto.cx9a2_bee
q1000.1
q1000.1: range queries with 1000 insert/s per client
Performance metrics for all DBMS, not just the ones listed above. Some are normalized by throughput, others are not. Legend for results is here.
ips	qps	rps	rmbps	wps	wmbps	rpq	rkbpq	wpi	wkbpi	csps	cpups	cspq	cpupq	dbgb1	dbgb2	rss	maxop	p50	p99	tag
998	8487	1625	13.0	1961.5	28.8	0.192	1.570	1.965	29.522	36423	14.7	4.292	139	151.6	190.7	9.8	0.016	8182	7767	800m.pg152_o3_native_lto.cx9a2_bee
999	8372	1624	13.0	1951.8	28.5	0.194	1.588	1.955	29.225	35955	14.7	4.295	140	151.7	190.9	9.8	0.016	8086	7765	800m.pg153_o3_native_lto.cx9a2_bee
998	8437	1624	13.0	1942.5	28.3	0.192	1.577	1.946	29.047	36238	14.7	4.295	139	152.9	192.1	9.9	0.016	8108	7797	800m.pg154_o3_native_lto.cx9a2_bee
997	8460	1626	13.1	1953.0	28.3	0.192	1.582	1.959	29.048	36336	14.6	4.295	138	151.7	190.9	9.8	0.016	8170	7794	800m.pg16beta1_o3_native_lto.cx9a2_bee
998	8424	1625	13.0	1957.4	28.8	0.193	1.580	1.962	29.592	36159	14.8	4.292	141	151.6	190.7	9.7	0.016	8184	7866	800m.pg16beta2_o3_native_lto.cx9a2_bee
998	8286	1625	13.0	1943.1	28.4	0.196	1.606	1.947	29.109	35615	14.7	4.298	142	151.6	190.8	9.7	0.016	7998	7656	800m.pg16beta3_o3_native_lto.cx9a2_bee
998	8578	1625	13.0	1950.7	28.6	0.189	1.553	1.954	29.313	36729	14.7	4.282	137	151.6	190.9	9.7	0.019	8276	7912	800m.pg16rc1_o3_native_lto.cx9a2_bee
998	8342	1624	13.0	1942.0	28.3	0.195	1.594	1.946	29.035	35880	14.7	4.301	141	152.9	192.1	9.8	0.016	8040	7751	800m.pg160_o3_native_lto.cx9a2_bee
l.i0
- l.i0: load without secondary indexes
- Legend for results is here.
- Each entry lists the percentage of responses that fit in that bucket (slower than max time for previous bucket, faster than min time for next bucket).
Insert response time histogram
256us	1ms	4ms	16ms	64ms	256ms	1s	4s	16s	gt	max	tag
0.000	0.025	99.972	0.002	nonzero	nonzero	0.000	0.000	0.000	0.000	0.075	pg152_o3_native_lto.cx9a2_bee
0.000	0.015	99.984	0.001	nonzero	nonzero	0.000	0.000	0.000	0.000	0.099	pg153_o3_native_lto.cx9a2_bee
0.000	0.045	99.952	0.003	0.001	nonzero	0.000	0.000	0.000	0.000	0.105	pg154_o3_native_lto.cx9a2_bee
0.000	0.029	99.969	0.002	nonzero	0.000	0.000	0.000	0.000	0.000	0.062	pg16beta1_o3_native_lto.cx9a2_bee
0.000	nonzero	99.999	0.001	nonzero	0.000	0.000	0.000	0.000	0.000	0.061	pg16beta2_o3_native_lto.cx9a2_bee
0.000	nonzero	99.998	0.002	nonzero	nonzero	0.000	0.000	0.000	0.000	0.098	pg16beta3_o3_native_lto.cx9a2_bee
0.000	0.038	99.960	0.002	nonzero	0.000	0.000	0.000	0.000	0.000	0.056	pg16rc1_o3_native_lto.cx9a2_bee
0.000	0.003	99.994	0.003	0.001	0.000	0.000	0.000	0.000	0.000	0.059	pg160_o3_native_lto.cx9a2_bee
l.x
- l.x: create secondary indexes
- Legend for results is here.
- Each entry lists the percentage of responses that fit in that bucket (slower than max time for previous bucket, faster than min time for next bucket).
TODO - determine whether there is data for create index response time
l.i1
- l.i1: continue load after secondary indexes created
- Legend for results is here.
- Each entry lists the percentage of responses that fit in that bucket (slower than max time for previous bucket, faster than min time for next bucket).
Insert response time histogram
256us	1ms	4ms	16ms	64ms	256ms	1s	4s	16s	gt	max	tag
0.000	0.000	0.000	82.260	17.709	0.032	nonzero	0.000	0.000	0.000	0.273	pg152_o3_native_lto.cx9a2_bee
0.000	0.000	0.000	82.103	17.868	0.030	0.000	0.000	0.000	0.000	0.196	pg153_o3_native_lto.cx9a2_bee
0.000	0.000	0.000	88.468	11.530	0.002	0.000	0.000	0.000	0.000	0.252	pg154_o3_native_lto.cx9a2_bee
0.000	0.000	0.000	80.703	19.269	0.028	nonzero	0.000	0.000	0.000	0.271	pg16beta1_o3_native_lto.cx9a2_bee
0.000	0.000	0.000	84.987	14.983	0.030	nonzero	0.000	0.000	0.000	0.265	pg16beta2_o3_native_lto.cx9a2_bee
0.000	0.000	0.000	82.885	17.084	0.031	nonzero	0.000	0.000	0.000	0.294	pg16beta3_o3_native_lto.cx9a2_bee
0.000	0.000	0.000	81.402	18.565	0.032	0.000	0.000	0.000	0.000	0.231	pg16rc1_o3_native_lto.cx9a2_bee
0.000	0.000	0.000	86.370	13.626	0.004	0.000	0.000	0.000	0.000	0.207	pg160_o3_native_lto.cx9a2_bee
Delete response time histogram
256us	1ms	4ms	16ms	64ms	256ms	1s	4s	16s	gt	max	tag
0.001	54.322	0.719	3.750	20.009	21.199	0.000	0.000	0.000	0.000	0.123	pg152_o3_native_lto.cx9a2_bee
0.001	58.486	0.839	4.481	20.259	15.935	0.000	0.000	0.000	0.000	0.102	pg153_o3_native_lto.cx9a2_bee
0.003	48.612	0.810	4.523	16.787	29.265	nonzero	0.000	0.000	0.000	0.281	pg154_o3_native_lto.cx9a2_bee
0.002	46.577	0.843	4.396	16.449	31.734	0.000	0.000	0.000	0.000	0.167	pg16beta1_o3_native_lto.cx9a2_bee
0.003	56.383	0.692	3.754	14.062	25.106	0.000	0.000	0.000	0.000	0.167	pg16beta2_o3_native_lto.cx9a2_bee
0.003	62.224	0.715	3.713	13.978	19.367	0.000	0.000	0.000	0.000	0.137	pg16beta3_o3_native_lto.cx9a2_bee
0.002	55.801	0.685	3.766	13.915	25.832	0.000	0.000	0.000	0.000	0.159	pg16rc1_o3_native_lto.cx9a2_bee
0.003	50.140	0.801	4.492	16.317	28.247	nonzero	0.000	0.000	0.000	0.343	pg160_o3_native_lto.cx9a2_bee
q100.1
- q100.1: range queries with 100 insert/s per client
- Legend for results is here.
- Each entry lists the percentage of responses that fit in that bucket (slower than max time for previous bucket, faster than min time for next bucket).
Query response time histogram
256us	1ms	4ms	16ms	64ms	256ms	1s	4s	16s	gt	max	tag
99.841	0.157	0.001	0.001	0.000	0.000	0.000	0.000	0.000	0.000	0.016	pg152_o3_native_lto.cx9a2_bee
99.849	0.149	0.001	0.001	0.000	0.000	0.000	0.000	0.000	0.000	0.016	pg153_o3_native_lto.cx9a2_bee
99.879	0.119	nonzero	0.002	0.000	0.000	0.000	0.000	0.000	0.000	0.015	pg154_o3_native_lto.cx9a2_bee
99.848	0.150	0.001	0.001	0.000	0.000	0.000	0.000	0.000	0.000	0.016	pg16beta1_o3_native_lto.cx9a2_bee
99.851	0.146	0.001	0.001	0.000	0.000	0.000	0.000	0.000	0.000	0.016	pg16beta2_o3_native_lto.cx9a2_bee
99.832	0.166	nonzero	0.001	nonzero	0.000	0.000	0.000	0.000	0.000	0.020	pg16beta3_o3_native_lto.cx9a2_bee
99.862	0.136	nonzero	0.001	0.000	0.000	0.000	0.000	0.000	0.000	0.016	pg16rc1_o3_native_lto.cx9a2_bee
99.874	0.125	nonzero	0.002	nonzero	0.000	0.000	0.000	0.000	0.000	0.017	pg160_o3_native_lto.cx9a2_bee
Insert response time histogram
256us	1ms	4ms	16ms	64ms	256ms	1s	4s	16s	gt	max	tag
0.000	0.000	0.000	69.090	30.910	0.000	0.000	0.000	0.000	0.000	0.033	pg152_o3_native_lto.cx9a2_bee
0.000	0.000	0.000	74.438	25.562	0.000	0.000	0.000	0.000	0.000	0.031	pg153_o3_native_lto.cx9a2_bee
0.000	0.000	0.000	73.257	26.743	0.000	0.000	0.000	0.000	0.000	0.031	pg154_o3_native_lto.cx9a2_bee
0.000	0.000	0.000	71.229	28.771	0.000	0.000	0.000	0.000	0.000	0.033	pg16beta1_o3_native_lto.cx9a2_bee
0.000	0.000	0.000	68.799	31.201	0.000	0.000	0.000	0.000	0.000	0.034	pg16beta2_o3_native_lto.cx9a2_bee
0.000	0.000	0.000	75.479	24.521	0.000	0.000	0.000	0.000	0.000	0.030	pg16beta3_o3_native_lto.cx9a2_bee
0.000	0.000	0.000	75.472	24.528	0.000	0.000	0.000	0.000	0.000	0.031	pg16rc1_o3_native_lto.cx9a2_bee
0.000	0.000	0.000	72.389	27.611	0.000	0.000	0.000	0.000	0.000	0.030	pg160_o3_native_lto.cx9a2_bee
Delete response time histogram
256us	1ms	4ms	16ms	64ms	256ms	1s	4s	16s	gt	max	tag
0.583	43.444	27.451	28.521	0.000	0.000	0.000	0.000	0.000	0.000	0.013	pg152_o3_native_lto.cx9a2_bee
0.000	7.431	32.111	60.458	0.000	0.000	0.000	0.000	0.000	0.000	0.015	pg153_o3_native_lto.cx9a2_bee
0.799	98.799	0.049	0.354	0.000	0.000	0.000	0.000	0.000	0.000	0.010	pg154_o3_native_lto.cx9a2_bee
0.938	98.431	0.083	0.549	0.000	0.000	0.000	0.000	0.000	0.000	0.009	pg16beta1_o3_native_lto.cx9a2_bee
0.458	99.028	0.069	0.444	0.000	0.000	0.000	0.000	0.000	0.000	0.009	pg16beta2_o3_native_lto.cx9a2_bee
0.611	99.097	0.056	0.236	0.000	0.000	0.000	0.000	0.000	0.000	0.009	pg16beta3_o3_native_lto.cx9a2_bee
0.375	99.215	0.049	0.361	0.000	0.000	0.000	0.000	0.000	0.000	0.010	pg16rc1_o3_native_lto.cx9a2_bee
0.799	98.812	0.056	0.333	0.000	0.000	0.000	0.000	0.000	0.000	0.010	pg160_o3_native_lto.cx9a2_bee
q500.1
- q500.1: range queries with 500 insert/s per client
- Legend for results is here.
- Each entry lists the percentage of responses that fit in that bucket (slower than max time for previous bucket, faster than min time for next bucket).
Query response time histogram
256us	1ms	4ms	16ms	64ms	256ms	1s	4s	16s	gt	max	tag
99.921	0.073	0.001	0.005	0.000	0.000	0.000	0.000	0.000	0.000	0.016	pg152_o3_native_lto.cx9a2_bee
99.907	0.088	0.001	0.004	nonzero	0.000	0.000	0.000	0.000	0.000	0.016	pg153_o3_native_lto.cx9a2_bee
99.919	0.077	0.001	0.004	0.000	0.000	0.000	0.000	0.000	0.000	0.016	pg154_o3_native_lto.cx9a2_bee
99.918	0.078	0.001	0.004	0.000	0.000	0.000	0.000	0.000	0.000	0.016	pg16beta1_o3_native_lto.cx9a2_bee
99.918	0.077	0.001	0.005	0.000	0.000	0.000	0.000	0.000	0.000	0.016	pg16beta2_o3_native_lto.cx9a2_bee
99.913	0.083	0.001	0.004	0.000	0.000	0.000	0.000	0.000	0.000	0.016	pg16beta3_o3_native_lto.cx9a2_bee
99.916	0.079	0.001	0.004	0.000	0.000	0.000	0.000	0.000	0.000	0.016	pg16rc1_o3_native_lto.cx9a2_bee
99.913	0.083	nonzero	0.004	0.000	0.000	0.000	0.000	0.000	0.000	0.016	pg160_o3_native_lto.cx9a2_bee
Insert response time histogram
256us	1ms	4ms	16ms	64ms	256ms	1s	4s	16s	gt	max	tag
0.000	0.000	0.000	93.560	6.440	0.000	0.000	0.000	0.000	0.000	0.029	pg152_o3_native_lto.cx9a2_bee
0.000	0.000	0.000	93.535	6.465	0.000	0.000	0.000	0.000	0.000	0.029	pg153_o3_native_lto.cx9a2_bee
0.000	0.000	0.000	94.576	5.424	0.000	0.000	0.000	0.000	0.000	0.029	pg154_o3_native_lto.cx9a2_bee
0.000	0.000	0.000	93.456	6.544	0.000	0.000	0.000	0.000	0.000	0.033	pg16beta1_o3_native_lto.cx9a2_bee
0.000	0.000	0.000	93.251	6.749	0.000	0.000	0.000	0.000	0.000	0.029	pg16beta2_o3_native_lto.cx9a2_bee
0.000	0.000	0.000	93.414	6.586	0.000	0.000	0.000	0.000	0.000	0.031	pg16beta3_o3_native_lto.cx9a2_bee
0.000	0.000	0.000	92.825	7.175	0.000	0.000	0.000	0.000	0.000	0.032	pg16rc1_o3_native_lto.cx9a2_bee
0.000	0.000	0.000	93.987	6.013	0.000	0.000	0.000	0.000	0.000	0.029	pg160_o3_native_lto.cx9a2_bee
Delete response time histogram
256us	1ms	4ms	16ms	64ms	256ms	1s	4s	16s	gt	max	tag
9.797	89.917	0.088	0.199	0.000	0.000	0.000	0.000	0.000	0.000	0.010	pg152_o3_native_lto.cx9a2_bee
1.651	17.531	0.029	24.131	56.658	0.000	0.000	0.000	0.000	0.000	0.038	pg153_o3_native_lto.cx9a2_bee
7.900	91.857	0.089	0.154	0.000	0.000	0.000	0.000	0.000	0.000	0.009	pg154_o3_native_lto.cx9a2_bee
9.069	90.632	0.078	0.221	0.000	0.000	0.000	0.000	0.000	0.000	0.009	pg16beta1_o3_native_lto.cx9a2_bee
8.690	90.971	0.068	0.271	0.000	0.000	0.000	0.000	0.000	0.000	0.009	pg16beta2_o3_native_lto.cx9a2_bee
7.232	92.474	0.081	0.214	0.000	0.000	0.000	0.000	0.000	0.000	0.010	pg16beta3_o3_native_lto.cx9a2_bee
8.306	91.365	0.061	0.268	0.000	0.000	0.000	0.000	0.000	0.000	0.009	pg16rc1_o3_native_lto.cx9a2_bee
7.989	91.761	0.062	0.188	0.000	0.000	0.000	0.000	0.000	0.000	0.009	pg160_o3_native_lto.cx9a2_bee
q1000.1
- q1000.1: range queries with 1000 insert/s per client
- Legend for results is here.
- Each entry lists the percentage of responses that fit in that bucket (slower than max time for previous bucket, faster than min time for next bucket).
Query response time histogram
256us	1ms	4ms	16ms	64ms	256ms	1s	4s	16s	gt	max	tag
99.859	0.130	0.002	0.010	0.000	0.000	0.000	0.000	0.000	0.000	0.016	pg152_o3_native_lto.cx9a2_bee
99.858	0.130	0.002	0.010	0.000	0.000	0.000	0.000	0.000	0.000	0.016	pg153_o3_native_lto.cx9a2_bee
99.862	0.127	0.002	0.010	0.000	0.000	0.000	0.000	0.000	0.000	0.016	pg154_o3_native_lto.cx9a2_bee
99.857	0.131	0.002	0.010	nonzero	0.000	0.000	0.000	0.000	0.000	0.016	pg16beta1_o3_native_lto.cx9a2_bee
99.860	0.128	0.002	0.010	nonzero	0.000	0.000	0.000	0.000	0.000	0.016	pg16beta2_o3_native_lto.cx9a2_bee
99.856	0.133	0.002	0.010	0.000	0.000	0.000	0.000	0.000	0.000	0.016	pg16beta3_o3_native_lto.cx9a2_bee
99.862	0.126	0.002	0.010	nonzero	0.000	0.000	0.000	0.000	0.000	0.019	pg16rc1_o3_native_lto.cx9a2_bee
99.857	0.131	0.002	0.010	nonzero	0.000	0.000	0.000	0.000	0.000	0.016	pg160_o3_native_lto.cx9a2_bee
Insert response time histogram
256us	1ms	4ms	16ms	64ms	256ms	1s	4s	16s	gt	max	tag
0.000	0.000	0.000	97.946	2.054	0.000	0.000	0.000	0.000	0.000	0.027	pg152_o3_native_lto.cx9a2_bee
0.000	0.000	0.000	97.876	2.124	0.000	0.000	0.000	0.000	0.000	0.028	pg153_o3_native_lto.cx9a2_bee
0.000	0.000	0.000	98.154	1.846	0.000	0.000	0.000	0.000	0.000	0.026	pg154_o3_native_lto.cx9a2_bee
0.000	0.000	0.000	98.009	1.991	0.000	0.000	0.000	0.000	0.000	0.027	pg16beta1_o3_native_lto.cx9a2_bee
0.000	0.000	0.000	97.966	2.034	0.000	0.000	0.000	0.000	0.000	0.027	pg16beta2_o3_native_lto.cx9a2_bee
0.000	0.000	0.000	97.946	2.054	0.000	0.000	0.000	0.000	0.000	0.028	pg16beta3_o3_native_lto.cx9a2_bee
0.000	0.000	0.000	97.819	2.181	0.000	0.000	0.000	0.000	0.000	0.028	pg16rc1_o3_native_lto.cx9a2_bee
0.000	0.000	0.000	98.001	1.999	0.000	0.000	0.000	0.000	0.000	0.027	pg160_o3_native_lto.cx9a2_bee
Delete response time histogram
256us	1ms	4ms	16ms	64ms	256ms	1s	4s	16s	gt	max	tag
6.069	93.752	0.078	0.101	0.000	0.000	0.000	0.000	0.000	0.000	0.010	pg152_o3_native_lto.cx9a2_bee
5.434	94.397	0.069	0.101	0.000	0.000	0.000	0.000	0.000	0.000	0.012	pg153_o3_native_lto.cx9a2_bee
5.179	94.681	0.069	0.070	0.000	0.000	0.000	0.000	0.000	0.000	0.010	pg154_o3_native_lto.cx9a2_bee
5.494	94.356	0.053	0.096	0.000	0.000	0.000	0.000	0.000	0.000	0.009	pg16beta1_o3_native_lto.cx9a2_bee
5.321	94.499	0.062	0.117	0.000	0.000	0.000	0.000	0.000	0.000	0.010	pg16beta2_o3_native_lto.cx9a2_bee
4.726	95.131	0.053	0.091	0.000	0.000	0.000	0.000	0.000	0.000	0.010	pg16beta3_o3_native_lto.cx9a2_bee
5.010	94.829	0.058	0.103	0.000	0.000	0.000	0.000	0.000	0.000	0.010	pg16rc1_o3_native_lto.cx9a2_bee
5.203	94.658	0.053	0.086	0.000	0.000	0.000	0.000	0.000	0.000	0.009	pg160_o3_native_lto.cx9a2_bee