Introduction
This is a report for the insert benchmark with 800M docs and 1 client(s). It is generated by scripts (bash, awk, sed) and Tufte might not be impressed. An overview of the insert benchmark is here and a short update is here. Below, by DBMS, I mean DBMS+version.config. An example is my8020.c10b40 where my means MySQL, 8020 is version 8.0.20 and c10b40 is the name for the configuration file.
The test server has 8 AMD cores, 16G RAM and an NVMe SSD. It is described here as the Beelink. The benchmark was run with 1 client and there were 1 or 3 connections per client (1 for queries or inserts without rate limits, 1+1 for rate limited inserts+deletes). It uses 1 table. It loads 800M rows per table without secondary indexes, creates secondary indexes, then inserts 30M rows per table with a delete per insert to avoid growing the table. It then does 3 read+write tests for 7200s each that do queries as fast as possible with 100, 500 and then 1000 inserts/second/client concurrent with the queries and 1000 deletes/second to avoid growing the table. The database is cached by Postgres. Clients and the DBMS share one server. The per-database configs are in the per-database subdirectories here.
The tested DBMS are:
- pg152_o3_native_lto.cx9a1_bee - Postgres 15.3, o3_native_lto build that used -O3 -march/-mtune=native, -flto, a1 config
- pg153_o3_native_lto.cx9a1_bee - Postgres 15.3, o3_native_lto build that used -O3 -march/-mtune=native, -flto, a1 config
- pg154_o3_native_lto.cx9a1_bee - Postgres 15.4, o3_native_lto build that used -O3 -march/-mtune=native, -flto, a1 config
- pg16beta1_o3_native_lto.cx9a1_bee - Postgres 16 beta1, o3_native_lto build that used -O3 -march/-mtune=native, -flto, a1 config
- pg16beta2_o3_native_lto.cx9a1_bee - Postgres 16 beta2, o3_native_lto build that used -O3 -march/-mtune=native, -flto, a1 config
- pg16beta3_o3_native_lto.cx9a1_bee - Postgres 16 beta3, o3_native_lto build that used -O3 -march/-mtune=native, -flto, a1 config
- pg16rc1_o3_native_lto.cx9a1_bee - Postgres 16 rc1, o3_native_lto build that used -O3 -march/-mtune=native, -flto, a1 config
- pg160_o3_native_lto.cx9a1_bee - Postgres 16.0, o3_native_lto build that used -O3 -march/-mtune=native, -flto, a1 config
Contents
- Summary
- l.i0: load without secondary indexes
- l.x: create secondary indexes
- l.i1: continue load after secondary indexes created
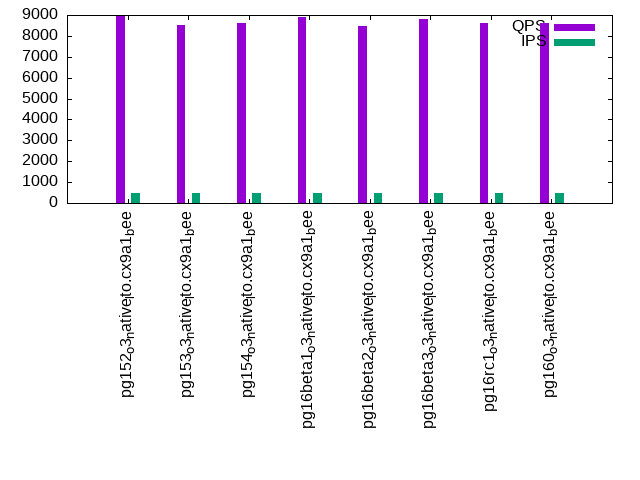
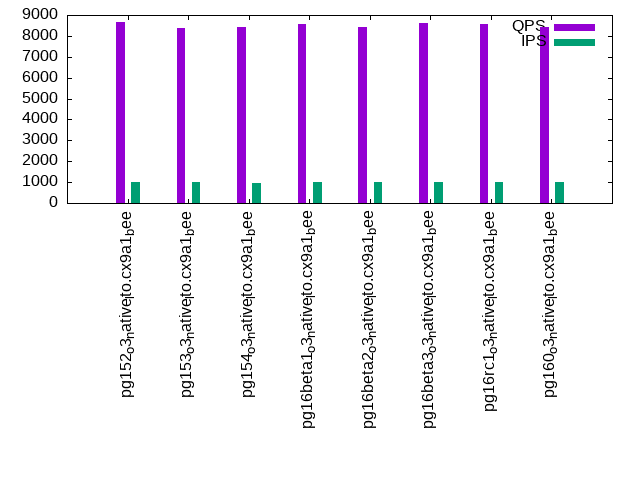
- q100.1: range queries with 100 insert/s per client
- q500.1: range queries with 500 insert/s per client
- q1000.1: range queries with 1000 insert/s per client
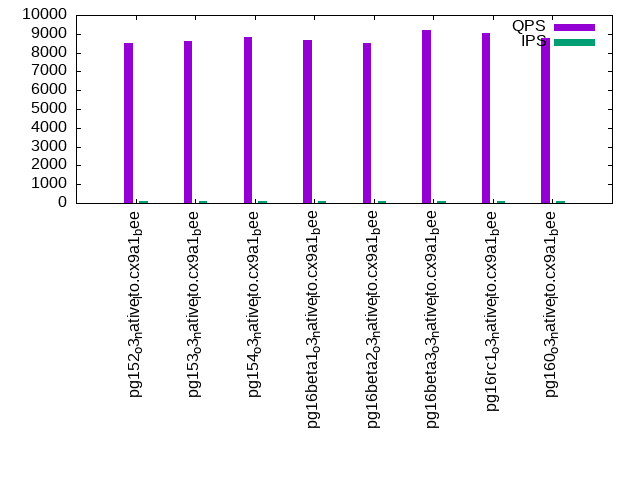
Summary
The numbers are inserts/s for l.i0 and l.i1, indexed docs (or rows) /s for l.x and queries/s for q*.2. The values are the average rate over the entire test for inserts (IPS) and queries (QPS). The range of values for IPS and QPS is split into 3 parts: bottom 25%, middle 50%, top 25%. Values in the bottom 25% have a red background, values in the top 25% have a green background and values in the middle have no color. A gray background is used for values that can be ignored because the DBMS did not sustain the target insert rate. Red backgrounds are not used when the minimum value is within 80% of the max value.
| dbms | l.i0 | l.x | l.i1 | q100.1 | q500.1 | q1000.1 |
|---|---|---|---|---|---|---|
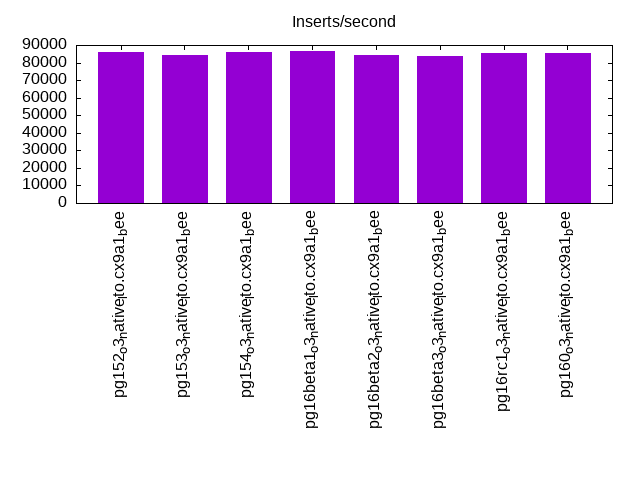
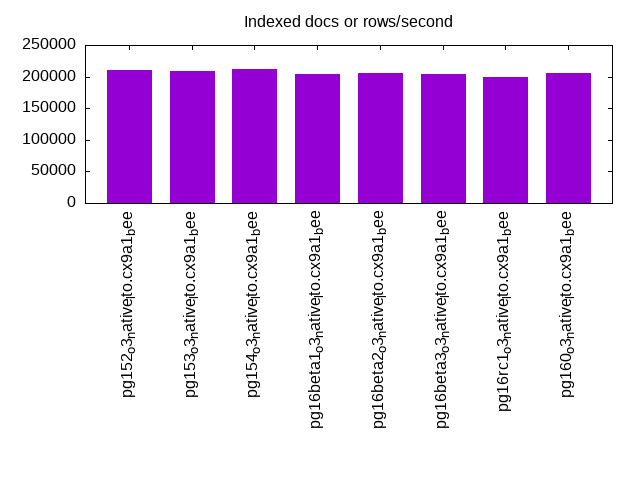
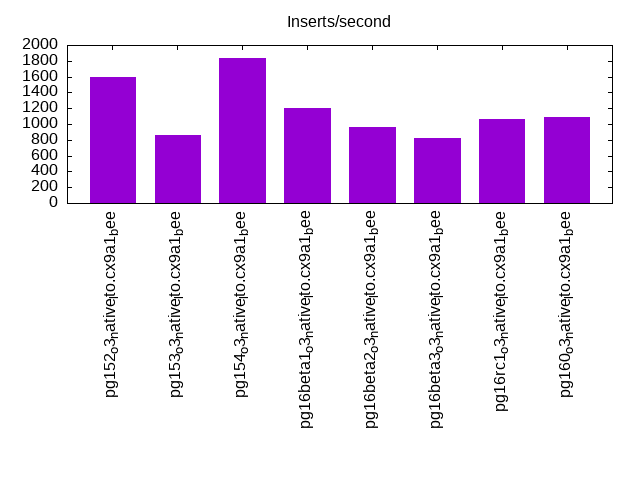
| pg152_o3_native_lto.cx9a1_bee | 85837 | 210497 | 1589 | 8516 | 8956 | 8675 |
| pg153_o3_native_lto.cx9a1_bee | 84433 | 209505 | 856 | 8600 | 8520 | 8395 |
| pg154_o3_native_lto.cx9a1_bee | 86068 | 212116 | 1835 | 8812 | 8614 | 8422 |
| pg16beta1_o3_native_lto.cx9a1_bee | 86402 | 204368 | 1201 | 8673 | 8903 | 8567 |
| pg16beta2_o3_native_lto.cx9a1_bee | 84219 | 205628 | 967 | 8514 | 8466 | 8440 |
| pg16beta3_o3_native_lto.cx9a1_bee | 83761 | 203588 | 821 | 9207 | 8802 | 8601 |
| pg16rc1_o3_native_lto.cx9a1_bee | 85717 | 198634 | 1062 | 9066 | 8605 | 8572 |
| pg160_o3_native_lto.cx9a1_bee | 85288 | 206318 | 1086 | 8758 | 8628 | 8445 |
This table has relative throughput, throughput for the DBMS relative to the DBMS in the first line, using the absolute throughput from the previous table. Values less than 0.95 have a yellow background. Values greater than 1.05 have a blue background.
| dbms | l.i0 | l.x | l.i1 | q100.1 | q500.1 | q1000.1 |
|---|---|---|---|---|---|---|
| pg152_o3_native_lto.cx9a1_bee | 1.00 | 1.00 | 1.00 | 1.00 | 1.00 | 1.00 |
| pg153_o3_native_lto.cx9a1_bee | 0.98 | 1.00 | 0.54 | 1.01 | 0.95 | 0.97 |
| pg154_o3_native_lto.cx9a1_bee | 1.00 | 1.01 | 1.15 | 1.03 | 0.96 | 0.97 |
| pg16beta1_o3_native_lto.cx9a1_bee | 1.01 | 0.97 | 0.76 | 1.02 | 0.99 | 0.99 |
| pg16beta2_o3_native_lto.cx9a1_bee | 0.98 | 0.98 | 0.61 | 1.00 | 0.95 | 0.97 |
| pg16beta3_o3_native_lto.cx9a1_bee | 0.98 | 0.97 | 0.52 | 1.08 | 0.98 | 0.99 |
| pg16rc1_o3_native_lto.cx9a1_bee | 1.00 | 0.94 | 0.67 | 1.06 | 0.96 | 0.99 |
| pg160_o3_native_lto.cx9a1_bee | 0.99 | 0.98 | 0.68 | 1.03 | 0.96 | 0.97 |
This lists the average rate of inserts/s for the tests that do inserts concurrent with queries. For such tests the query rate is listed in the table above. The read+write tests are setup so that the insert rate should match the target rate every second. Cells that are not at least 95% of the target have a red background to indicate a failure to satisfy the target.
| dbms | q100.1 | q500.1 | q1000.1 |
|---|---|---|---|
| pg152_o3_native_lto.cx9a1_bee | 100 | 499 | 997 |
| pg153_o3_native_lto.cx9a1_bee | 100 | 499 | 998 |
| pg154_o3_native_lto.cx9a1_bee | 100 | 499 | 974 |
| pg16beta1_o3_native_lto.cx9a1_bee | 100 | 499 | 998 |
| pg16beta2_o3_native_lto.cx9a1_bee | 100 | 499 | 998 |
| pg16beta3_o3_native_lto.cx9a1_bee | 100 | 499 | 997 |
| pg16rc1_o3_native_lto.cx9a1_bee | 100 | 499 | 998 |
| pg160_o3_native_lto.cx9a1_bee | 100 | 499 | 998 |
| target | 100 | 500 | 1000 |
l.i0
l.i0: load without secondary indexes. Graphs for performance per 1-second interval are here.
Average throughput:
Insert response time histogram: each cell has the percentage of responses that take <= the time in the header and max is the max response time in seconds. For the max column values in the top 25% of the range have a red background and in the bottom 25% of the range have a green background. The red background is not used when the min value is within 80% of the max value.
| dbms | 256us | 1ms | 4ms | 16ms | 64ms | 256ms | 1s | 4s | 16s | gt | max |
|---|---|---|---|---|---|---|---|---|---|---|---|
| pg152_o3_native_lto.cx9a1_bee | 0.011 | 99.988 | nonzero | nonzero | 0.029 | ||||||
| pg153_o3_native_lto.cx9a1_bee | 0.001 | 99.999 | 0.001 | nonzero | 0.057 | ||||||
| pg154_o3_native_lto.cx9a1_bee | 0.033 | 99.966 | 0.001 | nonzero | 0.056 | ||||||
| pg16beta1_o3_native_lto.cx9a1_bee | 0.046 | 99.953 | nonzero | nonzero | 0.058 | ||||||
| pg16beta2_o3_native_lto.cx9a1_bee | 99.999 | 0.001 | nonzero | 0.057 | |||||||
| pg16beta3_o3_native_lto.cx9a1_bee | 99.999 | nonzero | nonzero | 0.058 | |||||||
| pg16rc1_o3_native_lto.cx9a1_bee | 0.022 | 99.977 | nonzero | nonzero | 0.060 | ||||||
| pg160_o3_native_lto.cx9a1_bee | 0.006 | 99.993 | 0.001 | nonzero | 0.046 |
Performance metrics for the DBMS listed above. Some are normalized by throughput, others are not. Legend for results is here.
ips	qps	rps	rmbps	wps	wmbps	rpq	rkbpq	wpi	wkbpi	csps	cpups	cspq	cpupq	dbgb1	dbgb2	rss	maxop	p50	p99	tag
85837	0	37	0.3	126.2	35.1	0.000	0.003	0.001	0.419	10386	22.8	0.121	21	76.5	116.6	1.4	0.029	85914	83602	800m.pg152_o3_native_lto.cx9a1_bee
84433	0	35	0.3	117.5	34.5	0.000	0.003	0.001	0.419	10226	22.8	0.121	22	76.5	116.6	3.5	0.057	84704	82256	800m.pg153_o3_native_lto.cx9a1_bee
86068	0	35	0.3	124.2	35.2	0.000	0.003	0.001	0.418	10389	22.9	0.121	21	76.5	116.6	6.0	0.056	86303	83706	800m.pg154_o3_native_lto.cx9a1_bee
86402	0	36	0.3	121.8	35.3	0.000	0.003	0.001	0.419	10442	23.0	0.121	21	76.5	116.6	0.5	0.058	86605	84128	800m.pg16beta1_o3_native_lto.cx9a1_bee
84219	0	35	0.3	122.0	34.4	0.000	0.003	0.001	0.418	10175	23.0	0.121	22	76.5	116.6	3.6	0.057	84406	81999	800m.pg16beta2_o3_native_lto.cx9a1_bee
83761	0	35	0.3	116.1	34.2	0.000	0.003	0.001	0.418	10122	22.7	0.121	22	76.5	116.6	3.8	0.058	83910	81635	800m.pg16beta3_o3_native_lto.cx9a1_bee
85717	0	35	0.3	122.4	35.1	0.000	0.003	0.001	0.419	10363	22.5	0.121	21	76.5	116.6	0.5	0.060	85816	83507	800m.pg16rc1_o3_native_lto.cx9a1_bee
85288	0	36	0.3	125.0	34.9	0.000	0.003	0.001	0.419	10484	22.8	0.123	21	76.5	116.6	2.0	0.046	85505	82745	800m.pg160_o3_native_lto.cx9a1_bee
l.x
l.x: create secondary indexes.
Average throughput:
Performance metrics for the DBMS listed above. Some are normalized by throughput, others are not. Legend for results is here.
ips	qps	rps	rmbps	wps	wmbps	rpq	rkbpq	wpi	wkbpi	csps	cpups	cspq	cpupq	dbgb1	dbgb2	rss	maxop	p50	p99	tag
210497	0	612	75.9	177.2	64.8	0.003	0.369	0.001	0.315	406	12.5	0.002	5	147.0	187.1	10.2	0.004	NA	NA	800m.pg152_o3_native_lto.cx9a1_bee
209505	0	610	75.6	171.9	64.5	0.003	0.370	0.001	0.315	420	12.5	0.002	5	147.0	187.1	10.2	0.005	NA	NA	800m.pg153_o3_native_lto.cx9a1_bee
212116	0	618	76.5	178.9	65.4	0.003	0.369	0.001	0.316	412	12.4	0.002	5	147.0	187.1	10.2	0.005	NA	NA	800m.pg154_o3_native_lto.cx9a1_bee
204368	0	594	73.7	171.5	63.0	0.003	0.369	0.001	0.316	379	12.5	0.002	5	147.0	187.1	10.2	0.004	NA	NA	800m.pg16beta1_o3_native_lto.cx9a1_bee
205628	0	597	74.1	173.3	63.2	0.003	0.369	0.001	0.315	390	12.5	0.002	5	147.0	187.1	10.2	0.006	NA	NA	800m.pg16beta2_o3_native_lto.cx9a1_bee
203588	0	591	73.4	170.7	62.6	0.003	0.369	0.001	0.315	395	12.5	0.002	5	147.0	187.1	10.2	0.005	NA	NA	800m.pg16beta3_o3_native_lto.cx9a1_bee
198634	0	577	71.6	166.4	61.3	0.003	0.369	0.001	0.316	391	12.5	0.002	5	147.0	187.1	10.2	0.005	NA	NA	800m.pg16rc1_o3_native_lto.cx9a1_bee
206318	0	599	74.5	171.0	63.8	0.003	0.370	0.001	0.317	600	12.6	0.003	5	147.0	187.1	10.2	0.005	NA	NA	800m.pg160_o3_native_lto.cx9a1_bee
l.i1
l.i1: continue load after secondary indexes created. Graphs for performance per 1-second interval are here.
Average throughput:
Insert response time histogram: each cell has the percentage of responses that take <= the time in the header and max is the max response time in seconds. For the max column values in the top 25% of the range have a red background and in the bottom 25% of the range have a green background. The red background is not used when the min value is within 80% of the max value.
| dbms | 256us | 1ms | 4ms | 16ms | 64ms | 256ms | 1s | 4s | 16s | gt | max |
|---|---|---|---|---|---|---|---|---|---|---|---|
| pg152_o3_native_lto.cx9a1_bee | 76.868 | 23.100 | 0.033 | 0.224 | |||||||
| pg153_o3_native_lto.cx9a1_bee | 82.021 | 17.979 | 0.001 | 0.080 | |||||||
| pg154_o3_native_lto.cx9a1_bee | 79.866 | 20.105 | 0.029 | nonzero | 0.295 | ||||||
| pg16beta1_o3_native_lto.cx9a1_bee | 75.250 | 24.720 | 0.030 | 0.237 | |||||||
| pg16beta2_o3_native_lto.cx9a1_bee | 75.572 | 24.397 | 0.030 | 0.191 | |||||||
| pg16beta3_o3_native_lto.cx9a1_bee | 81.589 | 18.410 | 0.001 | 0.130 | |||||||
| pg16rc1_o3_native_lto.cx9a1_bee | 78.032 | 21.936 | 0.033 | 0.255 | |||||||
| pg160_o3_native_lto.cx9a1_bee | 80.176 | 19.791 | 0.033 | 0.254 |
Delete response time histogram: each cell has the percentage of responses that take <= the time in the header and max is the max response time in seconds. For the max column values in the top 25% of the range have a red background and in the bottom 25% of the range have a green background. The red background is not used when the min value is within 80% of the max value.
| dbms | 256us | 1ms | 4ms | 16ms | 64ms | 256ms | 1s | 4s | 16s | gt | max |
|---|---|---|---|---|---|---|---|---|---|---|---|
| pg152_o3_native_lto.cx9a1_bee | 0.002 | 59.488 | 0.689 | 3.736 | 19.784 | 16.302 | 0.102 | ||||
| pg153_o3_native_lto.cx9a1_bee | 0.003 | 49.922 | 0.820 | 4.500 | 16.393 | 28.362 | nonzero | 0.285 | |||
| pg154_o3_native_lto.cx9a1_bee | 0.001 | 65.668 | 0.842 | 4.464 | 16.756 | 12.269 | 0.106 | ||||
| pg16beta1_o3_native_lto.cx9a1_bee | 0.002 | 52.549 | 0.795 | 4.390 | 16.524 | 25.740 | 0.144 | ||||
| pg16beta2_o3_native_lto.cx9a1_bee | 0.002 | 51.306 | 0.712 | 3.789 | 14.028 | 30.163 | 0.188 | ||||
| pg16beta3_o3_native_lto.cx9a1_bee | 0.003 | 53.522 | 0.677 | 3.750 | 13.944 | 28.104 | nonzero | 0.271 | |||
| pg16rc1_o3_native_lto.cx9a1_bee | 0.002 | 52.374 | 0.707 | 3.741 | 13.923 | 29.253 | 0.173 | ||||
| pg160_o3_native_lto.cx9a1_bee | 0.003 | 44.843 | 0.814 | 4.533 | 16.426 | 33.380 | 0.152 |
Performance metrics for the DBMS listed above. Some are normalized by throughput, others are not. Legend for results is here.
ips	qps	rps	rmbps	wps	wmbps	rpq	rkbpq	wpi	wkbpi	csps	cpups	cspq	cpupq	dbgb1	dbgb2	rss	maxop	p50	p99	tag
1589	0	2588	25.3	3007.6	36.7	1.628	16.270	1.892	23.632	6124	12.2	3.853	614	151.6	191.7	9.5	0.224	899	499	800m.pg152_o3_native_lto.cx9a1_bee
856	0	1371	10.9	1572.5	19.1	1.602	13.075	1.837	22.825	3330	12.4	3.889	1159	152.2	192.2	9.7	0.080	350	249	800m.pg153_o3_native_lto.cx9a1_bee
1835	0	2978	29.0	3461.3	41.5	1.623	16.165	1.886	23.186	6985	11.9	3.807	519	150.7	190.8	3.9	0.295	1099	499	800m.pg154_o3_native_lto.cx9a1_bee
1201	0	1957	19.1	2281.8	29.0	1.629	16.256	1.899	24.685	4679	12.6	3.895	839	151.4	191.5	9.2	0.237	599	349	800m.pg16beta1_o3_native_lto.cx9a1_bee
967	0	1572	15.3	1830.3	22.7	1.627	16.204	1.894	24.050	3788	12.6	3.919	1043	150.8	174.8	1.9	0.191	400	250	800m.pg16beta2_o3_native_lto.cx9a1_bee
821	0	1314	10.5	1509.7	18.5	1.600	13.061	1.838	23.027	3208	12.3	3.906	1198	152.2	192.2	9.8	0.130	300	200	800m.pg16beta3_o3_native_lto.cx9a1_bee
1062	0	1729	16.8	2020.5	25.9	1.628	16.247	1.903	24.953	4153	12.7	3.911	957	151.3	191.3	9.3	0.255	499	300	800m.pg16rc1_o3_native_lto.cx9a1_bee
1086	0	1767	17.2	2046.7	25.5	1.627	16.235	1.885	24.029	4219	13.0	3.885	958	150.5	178.4	9.3	0.254	599	349	800m.pg160_o3_native_lto.cx9a1_bee
q100.1
q100.1: range queries with 100 insert/s per client. Graphs for performance per 1-second interval are here.
Average throughput:
Query response time histogram: each cell has the percentage of responses that take <= the time in the header and max is the max response time in seconds. For max values in the top 25% of the range have a red background and in the bottom 25% of the range have a green background. The red background is not used when the min value is within 80% of the max value.
| dbms | 256us | 1ms | 4ms | 16ms | 64ms | 256ms | 1s | 4s | 16s | gt | max |
|---|---|---|---|---|---|---|---|---|---|---|---|
| pg152_o3_native_lto.cx9a1_bee | 99.836 | 0.162 | 0.001 | 0.002 | 0.016 | ||||||
| pg153_o3_native_lto.cx9a1_bee | 99.869 | 0.129 | nonzero | 0.001 | 0.016 | ||||||
| pg154_o3_native_lto.cx9a1_bee | 99.872 | 0.126 | nonzero | 0.001 | nonzero | 0.020 | |||||
| pg16beta1_o3_native_lto.cx9a1_bee | 99.830 | 0.169 | nonzero | 0.001 | 0.010 | ||||||
| pg16beta2_o3_native_lto.cx9a1_bee | 99.873 | 0.125 | nonzero | 0.001 | nonzero | 0.016 | |||||
| pg16beta3_o3_native_lto.cx9a1_bee | 99.896 | 0.102 | nonzero | 0.001 | 0.016 | ||||||
| pg16rc1_o3_native_lto.cx9a1_bee | 99.867 | 0.131 | nonzero | 0.001 | 0.015 | ||||||
| pg160_o3_native_lto.cx9a1_bee | 99.871 | 0.127 | nonzero | 0.001 | nonzero | 0.019 |
Insert response time histogram: each cell has the percentage of responses that take <= the time in the header and max is the max response time in seconds. For max values in the top 25% of the range have a red background and in the bottom 25% of the range have a green background. The red background is not used when the min value is within 80% of the max value.
| dbms | 256us | 1ms | 4ms | 16ms | 64ms | 256ms | 1s | 4s | 16s | gt | max |
|---|---|---|---|---|---|---|---|---|---|---|---|
| pg152_o3_native_lto.cx9a1_bee | 61.542 | 38.458 | 0.034 | ||||||||
| pg153_o3_native_lto.cx9a1_bee | 82.097 | 17.903 | 0.033 | ||||||||
| pg154_o3_native_lto.cx9a1_bee | 67.340 | 32.660 | 0.032 | ||||||||
| pg16beta1_o3_native_lto.cx9a1_bee | 84.708 | 15.292 | 0.031 | ||||||||
| pg16beta2_o3_native_lto.cx9a1_bee | 62.528 | 37.472 | 0.033 | ||||||||
| pg16beta3_o3_native_lto.cx9a1_bee | 66.028 | 33.972 | 0.033 | ||||||||
| pg16rc1_o3_native_lto.cx9a1_bee | 72.528 | 27.472 | 0.033 | ||||||||
| pg160_o3_native_lto.cx9a1_bee | 63.861 | 36.139 | 0.052 |
Delete response time histogram: each cell has the percentage of responses that take <= the time in the header and max is the max response time in seconds. For max values in the top 25% of the range have a red background and in the bottom 25% of the range have a green background. The red background is not used when the min value is within 80% of the max value.
| dbms | 256us | 1ms | 4ms | 16ms | 64ms | 256ms | 1s | 4s | 16s | gt | max |
|---|---|---|---|---|---|---|---|---|---|---|---|
| pg152_o3_native_lto.cx9a1_bee | 5.597 | 27.729 | 66.660 | 0.014 | 0.016 | ||||||
| pg153_o3_native_lto.cx9a1_bee | 0.604 | 98.778 | 0.097 | 0.521 | 0.009 | ||||||
| pg154_o3_native_lto.cx9a1_bee | 0.701 | 99.007 | 0.028 | 0.264 | 0.007 | ||||||
| pg16beta1_o3_native_lto.cx9a1_bee | 2.729 | 97.236 | 0.007 | 0.028 | 0.010 | ||||||
| pg16beta2_o3_native_lto.cx9a1_bee | 1.243 | 98.208 | 0.118 | 0.431 | 0.009 | ||||||
| pg16beta3_o3_native_lto.cx9a1_bee | 0.396 | 99.243 | 0.042 | 0.319 | 0.008 | ||||||
| pg16rc1_o3_native_lto.cx9a1_bee | 0.542 | 99.118 | 0.042 | 0.299 | 0.010 | ||||||
| pg160_o3_native_lto.cx9a1_bee | 0.583 | 98.917 | 0.042 | 0.458 | 0.010 |
Performance metrics for the DBMS listed above. Some are normalized by throughput, others are not. Legend for results is here.
ips	qps	rps	rmbps	wps	wmbps	rpq	rkbpq	wpi	wkbpi	csps	cpups	cspq	cpupq	dbgb1	dbgb2	rss	maxop	p50	p99	tag
100	8516	182	1.5	198.0	2.8	0.021	0.175	1.986	29.089	33186	13.2	3.897	124	151.6	186.6	10.1	0.016	8404	7560	800m.pg152_o3_native_lto.cx9a1_bee
100	8600	174	1.4	204.6	2.8	0.020	0.166	2.050	28.957	33487	13.0	3.894	121	152.2	188.4	10.1	0.016	8134	7623	800m.pg153_o3_native_lto.cx9a1_bee
100	8812	175	1.4	213.0	2.9	0.020	0.162	2.135	29.635	34303	12.9	3.893	117	150.8	188.1	10.1	0.020	8246	7767	800m.pg154_o3_native_lto.cx9a1_bee
100	8673	181	1.4	207.7	2.8	0.021	0.171	2.081	29.095	33759	13.0	3.893	120	151.4	187.5	10.1	0.010	8391	7841	800m.pg16beta1_o3_native_lto.cx9a1_bee
100	8514	175	1.4	210.2	2.9	0.021	0.168	2.106	29.492	33157	13.0	3.894	122	150.9	186.9	10.0	0.016	8263	7893	800m.pg16beta2_o3_native_lto.cx9a1_bee
100	9207	175	1.4	206.9	2.8	0.019	0.155	2.073	29.028	35796	12.8	3.888	111	152.2	188.5	10.0	0.016	8629	7972	800m.pg16beta3_o3_native_lto.cx9a1_bee
100	9066	180	1.4	207.7	2.8	0.020	0.164	2.081	28.864	35256	12.8	3.889	113	151.3	187.3	10.1	0.015	8484	7959	800m.pg16rc1_o3_native_lto.cx9a1_bee
100	8758	176	1.4	214.4	2.9	0.020	0.164	2.148	29.819	34094	12.9	3.893	118	150.6	186.5	10.0	0.019	8246	7878	800m.pg160_o3_native_lto.cx9a1_bee
q500.1
q500.1: range queries with 500 insert/s per client. Graphs for performance per 1-second interval are here.
Average throughput:
Query response time histogram: each cell has the percentage of responses that take <= the time in the header and max is the max response time in seconds. For max values in the top 25% of the range have a red background and in the bottom 25% of the range have a green background. The red background is not used when the min value is within 80% of the max value.
| dbms | 256us | 1ms | 4ms | 16ms | 64ms | 256ms | 1s | 4s | 16s | gt | max |
|---|---|---|---|---|---|---|---|---|---|---|---|
| pg152_o3_native_lto.cx9a1_bee | 99.901 | 0.094 | 0.001 | 0.004 | 0.016 | ||||||
| pg153_o3_native_lto.cx9a1_bee | 99.914 | 0.082 | nonzero | 0.004 | 0.016 | ||||||
| pg154_o3_native_lto.cx9a1_bee | 99.921 | 0.074 | nonzero | 0.004 | 0.016 | ||||||
| pg16beta1_o3_native_lto.cx9a1_bee | 99.926 | 0.070 | nonzero | 0.004 | 0.016 | ||||||
| pg16beta2_o3_native_lto.cx9a1_bee | 99.914 | 0.082 | 0.001 | 0.004 | 0.016 | ||||||
| pg16beta3_o3_native_lto.cx9a1_bee | 99.922 | 0.074 | nonzero | 0.004 | 0.015 | ||||||
| pg16rc1_o3_native_lto.cx9a1_bee | 99.918 | 0.077 | nonzero | 0.004 | 0.016 | ||||||
| pg160_o3_native_lto.cx9a1_bee | 99.920 | 0.076 | nonzero | 0.004 | nonzero | 0.016 |
Insert response time histogram: each cell has the percentage of responses that take <= the time in the header and max is the max response time in seconds. For max values in the top 25% of the range have a red background and in the bottom 25% of the range have a green background. The red background is not used when the min value is within 80% of the max value.
| dbms | 256us | 1ms | 4ms | 16ms | 64ms | 256ms | 1s | 4s | 16s | gt | max |
|---|---|---|---|---|---|---|---|---|---|---|---|
| pg152_o3_native_lto.cx9a1_bee | 91.826 | 8.174 | 0.032 | ||||||||
| pg153_o3_native_lto.cx9a1_bee | 93.065 | 6.935 | 0.031 | ||||||||
| pg154_o3_native_lto.cx9a1_bee | 92.949 | 7.051 | 0.033 | ||||||||
| pg16beta1_o3_native_lto.cx9a1_bee | 91.801 | 8.199 | 0.032 | ||||||||
| pg16beta2_o3_native_lto.cx9a1_bee | 91.857 | 8.143 | 0.032 | ||||||||
| pg16beta3_o3_native_lto.cx9a1_bee | 92.607 | 7.393 | 0.030 | ||||||||
| pg16rc1_o3_native_lto.cx9a1_bee | 91.471 | 8.529 | 0.032 | ||||||||
| pg160_o3_native_lto.cx9a1_bee | 91.464 | 8.536 | 0.035 |
Delete response time histogram: each cell has the percentage of responses that take <= the time in the header and max is the max response time in seconds. For max values in the top 25% of the range have a red background and in the bottom 25% of the range have a green background. The red background is not used when the min value is within 80% of the max value.
| dbms | 256us | 1ms | 4ms | 16ms | 64ms | 256ms | 1s | 4s | 16s | gt | max |
|---|---|---|---|---|---|---|---|---|---|---|---|
| pg152_o3_native_lto.cx9a1_bee | 0.453 | 6.764 | 0.004 | 16.856 | 75.924 | 0.050 | |||||
| pg153_o3_native_lto.cx9a1_bee | 7.217 | 92.490 | 0.117 | 0.176 | 0.010 | ||||||
| pg154_o3_native_lto.cx9a1_bee | 6.643 | 93.096 | 0.067 | 0.194 | 0.010 | ||||||
| pg16beta1_o3_native_lto.cx9a1_bee | 7.356 | 92.335 | 0.082 | 0.228 | 0.010 | ||||||
| pg16beta2_o3_native_lto.cx9a1_bee | 6.286 | 93.440 | 0.051 | 0.222 | 0.010 | ||||||
| pg16beta3_o3_native_lto.cx9a1_bee | 6.578 | 93.168 | 0.051 | 0.203 | 0.009 | ||||||
| pg16rc1_o3_native_lto.cx9a1_bee | 5.631 | 94.083 | 0.075 | 0.211 | 0.010 | ||||||
| pg160_o3_native_lto.cx9a1_bee | 6.814 | 92.904 | 0.069 | 0.213 | 0.010 |
Performance metrics for the DBMS listed above. Some are normalized by throughput, others are not. Legend for results is here.
ips	qps	rps	rmbps	wps	wmbps	rpq	rkbpq	wpi	wkbpi	csps	cpups	cspq	cpupq	dbgb1	dbgb2	rss	maxop	p50	p99	tag
499	8956	805	6.5	963.0	12.2	0.090	0.738	1.930	24.973	36263	16.9	4.049	151	151.6	177.9	10.1	0.016	8471	8121	800m.pg152_o3_native_lto.cx9a1_bee
499	8520	803	6.4	954.7	12.1	0.094	0.771	1.915	24.887	34645	13.6	4.066	128	152.3	179.3	10.1	0.016	8135	7839	800m.pg153_o3_native_lto.cx9a1_bee
499	8614	804	6.4	959.4	12.2	0.093	0.764	1.922	25.054	34949	13.6	4.057	126	151.1	179.0	10.1	0.016	8122	7879	800m.pg154_o3_native_lto.cx9a1_bee
499	8903	804	6.5	960.7	12.1	0.090	0.743	1.925	24.899	36050	13.6	4.049	122	151.4	178.4	10.1	0.016	8391	8041	800m.pg16beta1_o3_native_lto.cx9a1_bee
499	8466	804	6.4	962.4	12.3	0.095	0.777	1.929	25.150	34398	13.7	4.063	129	151.2	178.3	10.0	0.016	8198	7945	800m.pg16beta2_o3_native_lto.cx9a1_bee
499	8802	802	6.4	953.4	12.1	0.091	0.746	1.911	24.853	35690	13.6	4.055	124	152.3	179.6	10.0	0.015	8331	8055	800m.pg16beta3_o3_native_lto.cx9a1_bee
499	8605	805	6.5	964.3	12.2	0.094	0.770	1.933	24.949	34921	13.6	4.058	126	151.3	178.2	10.0	0.016	8214	7974	800m.pg16rc1_o3_native_lto.cx9a1_bee
499	8628	805	6.4	968.0	12.2	0.093	0.763	1.940	25.118	35003	13.7	4.057	127	150.9	178.0	10.0	0.016	8199	7929	800m.pg160_o3_native_lto.cx9a1_bee
q1000.1
q1000.1: range queries with 1000 insert/s per client. Graphs for performance per 1-second interval are here.
Average throughput:
Query response time histogram: each cell has the percentage of responses that take <= the time in the header and max is the max response time in seconds. For max values in the top 25% of the range have a red background and in the bottom 25% of the range have a green background. The red background is not used when the min value is within 80% of the max value.
| dbms | 256us | 1ms | 4ms | 16ms | 64ms | 256ms | 1s | 4s | 16s | gt | max |
|---|---|---|---|---|---|---|---|---|---|---|---|
| pg152_o3_native_lto.cx9a1_bee | 99.880 | 0.113 | 0.001 | 0.006 | 0.016 | ||||||
| pg153_o3_native_lto.cx9a1_bee | 99.864 | 0.128 | 0.001 | 0.006 | 0.016 | ||||||
| pg154_o3_native_lto.cx9a1_bee | 99.870 | 0.123 | 0.001 | 0.006 | 0.016 | ||||||
| pg16beta1_o3_native_lto.cx9a1_bee | 99.873 | 0.119 | 0.001 | 0.006 | 0.016 | ||||||
| pg16beta2_o3_native_lto.cx9a1_bee | 99.871 | 0.122 | 0.001 | 0.006 | 0.016 | ||||||
| pg16beta3_o3_native_lto.cx9a1_bee | 99.870 | 0.123 | 0.001 | 0.006 | 0.015 | ||||||
| pg16rc1_o3_native_lto.cx9a1_bee | 99.874 | 0.119 | 0.001 | 0.006 | 0.016 | ||||||
| pg160_o3_native_lto.cx9a1_bee | 99.868 | 0.125 | 0.001 | 0.006 | 0.016 |
Insert response time histogram: each cell has the percentage of responses that take <= the time in the header and max is the max response time in seconds. For max values in the top 25% of the range have a red background and in the bottom 25% of the range have a green background. The red background is not used when the min value is within 80% of the max value.
| dbms | 256us | 1ms | 4ms | 16ms | 64ms | 256ms | 1s | 4s | 16s | gt | max |
|---|---|---|---|---|---|---|---|---|---|---|---|
| pg152_o3_native_lto.cx9a1_bee | 97.286 | 2.714 | 0.030 | ||||||||
| pg153_o3_native_lto.cx9a1_bee | 97.353 | 2.647 | 0.037 | ||||||||
| pg154_o3_native_lto.cx9a1_bee | 97.288 | 2.712 | 0.049 | ||||||||
| pg16beta1_o3_native_lto.cx9a1_bee | 97.375 | 2.625 | 0.028 | ||||||||
| pg16beta2_o3_native_lto.cx9a1_bee | 97.447 | 2.553 | 0.030 | ||||||||
| pg16beta3_o3_native_lto.cx9a1_bee | 97.567 | 2.433 | 0.030 | ||||||||
| pg16rc1_o3_native_lto.cx9a1_bee | 97.396 | 2.604 | 0.048 | ||||||||
| pg160_o3_native_lto.cx9a1_bee | 97.371 | 2.629 | 0.028 |
Delete response time histogram: each cell has the percentage of responses that take <= the time in the header and max is the max response time in seconds. For max values in the top 25% of the range have a red background and in the bottom 25% of the range have a green background. The red background is not used when the min value is within 80% of the max value.
| dbms | 256us | 1ms | 4ms | 16ms | 64ms | 256ms | 1s | 4s | 16s | gt | max |
|---|---|---|---|---|---|---|---|---|---|---|---|
| pg152_o3_native_lto.cx9a1_bee | 3.987 | 95.867 | 0.065 | 0.081 | 0.010 | ||||||
| pg153_o3_native_lto.cx9a1_bee | 3.817 | 96.062 | 0.061 | 0.060 | 0.010 | ||||||
| pg154_o3_native_lto.cx9a1_bee | 3.565 | 93.804 | 0.072 | 0.046 | 0.076 | 2.437 | 0.168 | ||||
| pg16beta1_o3_native_lto.cx9a1_bee | 3.985 | 95.899 | 0.051 | 0.064 | 0.010 | ||||||
| pg16beta2_o3_native_lto.cx9a1_bee | 3.501 | 96.373 | 0.062 | 0.065 | 0.009 | ||||||
| pg16beta3_o3_native_lto.cx9a1_bee | 3.488 | 96.374 | 0.060 | 0.078 | 0.009 | ||||||
| pg16rc1_o3_native_lto.cx9a1_bee | 3.264 | 96.614 | 0.062 | 0.060 | 0.009 | ||||||
| pg160_o3_native_lto.cx9a1_bee | 3.158 | 96.715 | 0.055 | 0.072 | 0.013 |
Performance metrics for the DBMS listed above. Some are normalized by throughput, others are not. Legend for results is here.
ips	qps	rps	rmbps	wps	wmbps	rpq	rkbpq	wpi	wkbpi	csps	cpups	cspq	cpupq	dbgb1	dbgb2	rss	maxop	p50	p99	tag
997	8675	1626	13.1	1929.4	22.9	0.187	1.546	1.935	23.501	37115	14.8	4.278	136	151.8	177.4	9.9	0.016	8343	7991	800m.pg152_o3_native_lto.cx9a1_bee
998	8395	1625	13.0	1923.7	22.9	0.194	1.589	1.928	23.506	36047	14.8	4.294	141	152.9	178.7	9.9	0.016	8024	7670	800m.pg153_o3_native_lto.cx9a1_bee
974	8422	1591	12.8	1888.0	22.5	0.189	1.560	1.939	23.675	36004	15.4	4.275	146	151.7	178.1	9.9	0.016	8107	7799	800m.pg154_o3_native_lto.cx9a1_bee
998	8567	1626	13.1	1933.4	22.9	0.190	1.563	1.937	23.496	36631	14.8	4.276	138	151.7	177.4	9.7	0.016	8201	7895	800m.pg16beta1_o3_native_lto.cx9a1_bee
998	8440	1625	13.0	1922.7	23.0	0.193	1.580	1.927	23.556	36172	14.8	4.286	140	151.9	177.8	9.7	0.016	8165	7867	800m.pg16beta2_o3_native_lto.cx9a1_bee
997	8601	1624	13.0	1923.3	22.9	0.189	1.549	1.929	23.535	36855	14.9	4.285	139	152.9	178.8	9.8	0.015	8280	7876	800m.pg16beta3_o3_native_lto.cx9a1_bee
998	8572	1625	13.1	1934.6	22.9	0.190	1.560	1.938	23.515	36649	14.7	4.276	137	151.7	177.4	9.7	0.016	8185	7863	800m.pg16rc1_o3_native_lto.cx9a1_bee
998	8445	1625	13.0	1924.7	23.0	0.192	1.578	1.928	23.547	36173	14.9	4.283	141	151.5	177.4	9.7	0.016	8164	7874	800m.pg160_o3_native_lto.cx9a1_bee
l.i0
l.i0: load without secondary indexes
Performance metrics for all DBMS, not just the ones listed above. Some are normalized by throughput, others are not. Legend for results is here.
ips	qps	rps	rmbps	wps	wmbps	rpq	rkbpq	wpi	wkbpi	csps	cpups	cspq	cpupq	dbgb1	dbgb2	rss	maxop	p50	p99	tag
85837	0	37	0.3	126.2	35.1	0.000	0.003	0.001	0.419	10386	22.8	0.121	21	76.5	116.6	1.4	0.029	85914	83602	800m.pg152_o3_native_lto.cx9a1_bee
84433	0	35	0.3	117.5	34.5	0.000	0.003	0.001	0.419	10226	22.8	0.121	22	76.5	116.6	3.5	0.057	84704	82256	800m.pg153_o3_native_lto.cx9a1_bee
86068	0	35	0.3	124.2	35.2	0.000	0.003	0.001	0.418	10389	22.9	0.121	21	76.5	116.6	6.0	0.056	86303	83706	800m.pg154_o3_native_lto.cx9a1_bee
86402	0	36	0.3	121.8	35.3	0.000	0.003	0.001	0.419	10442	23.0	0.121	21	76.5	116.6	0.5	0.058	86605	84128	800m.pg16beta1_o3_native_lto.cx9a1_bee
84219	0	35	0.3	122.0	34.4	0.000	0.003	0.001	0.418	10175	23.0	0.121	22	76.5	116.6	3.6	0.057	84406	81999	800m.pg16beta2_o3_native_lto.cx9a1_bee
83761	0	35	0.3	116.1	34.2	0.000	0.003	0.001	0.418	10122	22.7	0.121	22	76.5	116.6	3.8	0.058	83910	81635	800m.pg16beta3_o3_native_lto.cx9a1_bee
85717	0	35	0.3	122.4	35.1	0.000	0.003	0.001	0.419	10363	22.5	0.121	21	76.5	116.6	0.5	0.060	85816	83507	800m.pg16rc1_o3_native_lto.cx9a1_bee
85288	0	36	0.3	125.0	34.9	0.000	0.003	0.001	0.419	10484	22.8	0.123	21	76.5	116.6	2.0	0.046	85505	82745	800m.pg160_o3_native_lto.cx9a1_bee
l.x
l.x: create secondary indexes
Performance metrics for all DBMS, not just the ones listed above. Some are normalized by throughput, others are not. Legend for results is here.
ips	qps	rps	rmbps	wps	wmbps	rpq	rkbpq	wpi	wkbpi	csps	cpups	cspq	cpupq	dbgb1	dbgb2	rss	maxop	p50	p99	tag
210497	0	612	75.9	177.2	64.8	0.003	0.369	0.001	0.315	406	12.5	0.002	5	147.0	187.1	10.2	0.004	NA	NA	800m.pg152_o3_native_lto.cx9a1_bee
209505	0	610	75.6	171.9	64.5	0.003	0.370	0.001	0.315	420	12.5	0.002	5	147.0	187.1	10.2	0.005	NA	NA	800m.pg153_o3_native_lto.cx9a1_bee
212116	0	618	76.5	178.9	65.4	0.003	0.369	0.001	0.316	412	12.4	0.002	5	147.0	187.1	10.2	0.005	NA	NA	800m.pg154_o3_native_lto.cx9a1_bee
204368	0	594	73.7	171.5	63.0	0.003	0.369	0.001	0.316	379	12.5	0.002	5	147.0	187.1	10.2	0.004	NA	NA	800m.pg16beta1_o3_native_lto.cx9a1_bee
205628	0	597	74.1	173.3	63.2	0.003	0.369	0.001	0.315	390	12.5	0.002	5	147.0	187.1	10.2	0.006	NA	NA	800m.pg16beta2_o3_native_lto.cx9a1_bee
203588	0	591	73.4	170.7	62.6	0.003	0.369	0.001	0.315	395	12.5	0.002	5	147.0	187.1	10.2	0.005	NA	NA	800m.pg16beta3_o3_native_lto.cx9a1_bee
198634	0	577	71.6	166.4	61.3	0.003	0.369	0.001	0.316	391	12.5	0.002	5	147.0	187.1	10.2	0.005	NA	NA	800m.pg16rc1_o3_native_lto.cx9a1_bee
206318	0	599	74.5	171.0	63.8	0.003	0.370	0.001	0.317	600	12.6	0.003	5	147.0	187.1	10.2	0.005	NA	NA	800m.pg160_o3_native_lto.cx9a1_bee
l.i1
l.i1: continue load after secondary indexes created
Performance metrics for all DBMS, not just the ones listed above. Some are normalized by throughput, others are not. Legend for results is here.
ips	qps	rps	rmbps	wps	wmbps	rpq	rkbpq	wpi	wkbpi	csps	cpups	cspq	cpupq	dbgb1	dbgb2	rss	maxop	p50	p99	tag
1589	0	2588	25.3	3007.6	36.7	1.628	16.270	1.892	23.632	6124	12.2	3.853	614	151.6	191.7	9.5	0.224	899	499	800m.pg152_o3_native_lto.cx9a1_bee
856	0	1371	10.9	1572.5	19.1	1.602	13.075	1.837	22.825	3330	12.4	3.889	1159	152.2	192.2	9.7	0.080	350	249	800m.pg153_o3_native_lto.cx9a1_bee
1835	0	2978	29.0	3461.3	41.5	1.623	16.165	1.886	23.186	6985	11.9	3.807	519	150.7	190.8	3.9	0.295	1099	499	800m.pg154_o3_native_lto.cx9a1_bee
1201	0	1957	19.1	2281.8	29.0	1.629	16.256	1.899	24.685	4679	12.6	3.895	839	151.4	191.5	9.2	0.237	599	349	800m.pg16beta1_o3_native_lto.cx9a1_bee
967	0	1572	15.3	1830.3	22.7	1.627	16.204	1.894	24.050	3788	12.6	3.919	1043	150.8	174.8	1.9	0.191	400	250	800m.pg16beta2_o3_native_lto.cx9a1_bee
821	0	1314	10.5	1509.7	18.5	1.600	13.061	1.838	23.027	3208	12.3	3.906	1198	152.2	192.2	9.8	0.130	300	200	800m.pg16beta3_o3_native_lto.cx9a1_bee
1062	0	1729	16.8	2020.5	25.9	1.628	16.247	1.903	24.953	4153	12.7	3.911	957	151.3	191.3	9.3	0.255	499	300	800m.pg16rc1_o3_native_lto.cx9a1_bee
1086	0	1767	17.2	2046.7	25.5	1.627	16.235	1.885	24.029	4219	13.0	3.885	958	150.5	178.4	9.3	0.254	599	349	800m.pg160_o3_native_lto.cx9a1_bee
q100.1
q100.1: range queries with 100 insert/s per client
Performance metrics for all DBMS, not just the ones listed above. Some are normalized by throughput, others are not. Legend for results is here.
ips	qps	rps	rmbps	wps	wmbps	rpq	rkbpq	wpi	wkbpi	csps	cpups	cspq	cpupq	dbgb1	dbgb2	rss	maxop	p50	p99	tag
100	8516	182	1.5	198.0	2.8	0.021	0.175	1.986	29.089	33186	13.2	3.897	124	151.6	186.6	10.1	0.016	8404	7560	800m.pg152_o3_native_lto.cx9a1_bee
100	8600	174	1.4	204.6	2.8	0.020	0.166	2.050	28.957	33487	13.0	3.894	121	152.2	188.4	10.1	0.016	8134	7623	800m.pg153_o3_native_lto.cx9a1_bee
100	8812	175	1.4	213.0	2.9	0.020	0.162	2.135	29.635	34303	12.9	3.893	117	150.8	188.1	10.1	0.020	8246	7767	800m.pg154_o3_native_lto.cx9a1_bee
100	8673	181	1.4	207.7	2.8	0.021	0.171	2.081	29.095	33759	13.0	3.893	120	151.4	187.5	10.1	0.010	8391	7841	800m.pg16beta1_o3_native_lto.cx9a1_bee
100	8514	175	1.4	210.2	2.9	0.021	0.168	2.106	29.492	33157	13.0	3.894	122	150.9	186.9	10.0	0.016	8263	7893	800m.pg16beta2_o3_native_lto.cx9a1_bee
100	9207	175	1.4	206.9	2.8	0.019	0.155	2.073	29.028	35796	12.8	3.888	111	152.2	188.5	10.0	0.016	8629	7972	800m.pg16beta3_o3_native_lto.cx9a1_bee
100	9066	180	1.4	207.7	2.8	0.020	0.164	2.081	28.864	35256	12.8	3.889	113	151.3	187.3	10.1	0.015	8484	7959	800m.pg16rc1_o3_native_lto.cx9a1_bee
100	8758	176	1.4	214.4	2.9	0.020	0.164	2.148	29.819	34094	12.9	3.893	118	150.6	186.5	10.0	0.019	8246	7878	800m.pg160_o3_native_lto.cx9a1_bee
q500.1
q500.1: range queries with 500 insert/s per client
Performance metrics for all DBMS, not just the ones listed above. Some are normalized by throughput, others are not. Legend for results is here.
ips	qps	rps	rmbps	wps	wmbps	rpq	rkbpq	wpi	wkbpi	csps	cpups	cspq	cpupq	dbgb1	dbgb2	rss	maxop	p50	p99	tag
499	8956	805	6.5	963.0	12.2	0.090	0.738	1.930	24.973	36263	16.9	4.049	151	151.6	177.9	10.1	0.016	8471	8121	800m.pg152_o3_native_lto.cx9a1_bee
499	8520	803	6.4	954.7	12.1	0.094	0.771	1.915	24.887	34645	13.6	4.066	128	152.3	179.3	10.1	0.016	8135	7839	800m.pg153_o3_native_lto.cx9a1_bee
499	8614	804	6.4	959.4	12.2	0.093	0.764	1.922	25.054	34949	13.6	4.057	126	151.1	179.0	10.1	0.016	8122	7879	800m.pg154_o3_native_lto.cx9a1_bee
499	8903	804	6.5	960.7	12.1	0.090	0.743	1.925	24.899	36050	13.6	4.049	122	151.4	178.4	10.1	0.016	8391	8041	800m.pg16beta1_o3_native_lto.cx9a1_bee
499	8466	804	6.4	962.4	12.3	0.095	0.777	1.929	25.150	34398	13.7	4.063	129	151.2	178.3	10.0	0.016	8198	7945	800m.pg16beta2_o3_native_lto.cx9a1_bee
499	8802	802	6.4	953.4	12.1	0.091	0.746	1.911	24.853	35690	13.6	4.055	124	152.3	179.6	10.0	0.015	8331	8055	800m.pg16beta3_o3_native_lto.cx9a1_bee
499	8605	805	6.5	964.3	12.2	0.094	0.770	1.933	24.949	34921	13.6	4.058	126	151.3	178.2	10.0	0.016	8214	7974	800m.pg16rc1_o3_native_lto.cx9a1_bee
499	8628	805	6.4	968.0	12.2	0.093	0.763	1.940	25.118	35003	13.7	4.057	127	150.9	178.0	10.0	0.016	8199	7929	800m.pg160_o3_native_lto.cx9a1_bee
q1000.1
q1000.1: range queries with 1000 insert/s per client
Performance metrics for all DBMS, not just the ones listed above. Some are normalized by throughput, others are not. Legend for results is here.
ips	qps	rps	rmbps	wps	wmbps	rpq	rkbpq	wpi	wkbpi	csps	cpups	cspq	cpupq	dbgb1	dbgb2	rss	maxop	p50	p99	tag
997	8675	1626	13.1	1929.4	22.9	0.187	1.546	1.935	23.501	37115	14.8	4.278	136	151.8	177.4	9.9	0.016	8343	7991	800m.pg152_o3_native_lto.cx9a1_bee
998	8395	1625	13.0	1923.7	22.9	0.194	1.589	1.928	23.506	36047	14.8	4.294	141	152.9	178.7	9.9	0.016	8024	7670	800m.pg153_o3_native_lto.cx9a1_bee
974	8422	1591	12.8	1888.0	22.5	0.189	1.560	1.939	23.675	36004	15.4	4.275	146	151.7	178.1	9.9	0.016	8107	7799	800m.pg154_o3_native_lto.cx9a1_bee
998	8567	1626	13.1	1933.4	22.9	0.190	1.563	1.937	23.496	36631	14.8	4.276	138	151.7	177.4	9.7	0.016	8201	7895	800m.pg16beta1_o3_native_lto.cx9a1_bee
998	8440	1625	13.0	1922.7	23.0	0.193	1.580	1.927	23.556	36172	14.8	4.286	140	151.9	177.8	9.7	0.016	8165	7867	800m.pg16beta2_o3_native_lto.cx9a1_bee
997	8601	1624	13.0	1923.3	22.9	0.189	1.549	1.929	23.535	36855	14.9	4.285	139	152.9	178.8	9.8	0.015	8280	7876	800m.pg16beta3_o3_native_lto.cx9a1_bee
998	8572	1625	13.1	1934.6	22.9	0.190	1.560	1.938	23.515	36649	14.7	4.276	137	151.7	177.4	9.7	0.016	8185	7863	800m.pg16rc1_o3_native_lto.cx9a1_bee
998	8445	1625	13.0	1924.7	23.0	0.192	1.578	1.928	23.547	36173	14.9	4.283	141	151.5	177.4	9.7	0.016	8164	7874	800m.pg160_o3_native_lto.cx9a1_bee
l.i0
- l.i0: load without secondary indexes
- Legend for results is here.
- Each entry lists the percentage of responses that fit in that bucket (slower than max time for previous bucket, faster than min time for next bucket).
Insert response time histogram
256us	1ms	4ms	16ms	64ms	256ms	1s	4s	16s	gt	max	tag
0.000	0.011	99.988	nonzero	nonzero	0.000	0.000	0.000	0.000	0.000	0.029	pg152_o3_native_lto.cx9a1_bee
0.000	0.001	99.999	0.001	nonzero	0.000	0.000	0.000	0.000	0.000	0.057	pg153_o3_native_lto.cx9a1_bee
0.000	0.033	99.966	0.001	nonzero	0.000	0.000	0.000	0.000	0.000	0.056	pg154_o3_native_lto.cx9a1_bee
0.000	0.046	99.953	nonzero	nonzero	0.000	0.000	0.000	0.000	0.000	0.058	pg16beta1_o3_native_lto.cx9a1_bee
0.000	0.000	99.999	0.001	nonzero	0.000	0.000	0.000	0.000	0.000	0.057	pg16beta2_o3_native_lto.cx9a1_bee
0.000	0.000	99.999	nonzero	nonzero	0.000	0.000	0.000	0.000	0.000	0.058	pg16beta3_o3_native_lto.cx9a1_bee
0.000	0.022	99.977	nonzero	nonzero	0.000	0.000	0.000	0.000	0.000	0.060	pg16rc1_o3_native_lto.cx9a1_bee
0.000	0.006	99.993	0.001	nonzero	0.000	0.000	0.000	0.000	0.000	0.046	pg160_o3_native_lto.cx9a1_bee
l.x
- l.x: create secondary indexes
- Legend for results is here.
- Each entry lists the percentage of responses that fit in that bucket (slower than max time for previous bucket, faster than min time for next bucket).
TODO - determine whether there is data for create index response time
l.i1
- l.i1: continue load after secondary indexes created
- Legend for results is here.
- Each entry lists the percentage of responses that fit in that bucket (slower than max time for previous bucket, faster than min time for next bucket).
Insert response time histogram
256us	1ms	4ms	16ms	64ms	256ms	1s	4s	16s	gt	max	tag
0.000	0.000	0.000	76.868	23.100	0.033	0.000	0.000	0.000	0.000	0.224	pg152_o3_native_lto.cx9a1_bee
0.000	0.000	0.000	82.021	17.979	0.001	0.000	0.000	0.000	0.000	0.080	pg153_o3_native_lto.cx9a1_bee
0.000	0.000	0.000	79.866	20.105	0.029	nonzero	0.000	0.000	0.000	0.295	pg154_o3_native_lto.cx9a1_bee
0.000	0.000	0.000	75.250	24.720	0.030	0.000	0.000	0.000	0.000	0.237	pg16beta1_o3_native_lto.cx9a1_bee
0.000	0.000	0.000	75.572	24.397	0.030	0.000	0.000	0.000	0.000	0.191	pg16beta2_o3_native_lto.cx9a1_bee
0.000	0.000	0.000	81.589	18.410	0.001	0.000	0.000	0.000	0.000	0.130	pg16beta3_o3_native_lto.cx9a1_bee
0.000	0.000	0.000	78.032	21.936	0.033	0.000	0.000	0.000	0.000	0.255	pg16rc1_o3_native_lto.cx9a1_bee
0.000	0.000	0.000	80.176	19.791	0.033	0.000	0.000	0.000	0.000	0.254	pg160_o3_native_lto.cx9a1_bee
Delete response time histogram
256us	1ms	4ms	16ms	64ms	256ms	1s	4s	16s	gt	max	tag
0.002	59.488	0.689	3.736	19.784	16.302	0.000	0.000	0.000	0.000	0.102	pg152_o3_native_lto.cx9a1_bee
0.003	49.922	0.820	4.500	16.393	28.362	nonzero	0.000	0.000	0.000	0.285	pg153_o3_native_lto.cx9a1_bee
0.001	65.668	0.842	4.464	16.756	12.269	0.000	0.000	0.000	0.000	0.106	pg154_o3_native_lto.cx9a1_bee
0.002	52.549	0.795	4.390	16.524	25.740	0.000	0.000	0.000	0.000	0.144	pg16beta1_o3_native_lto.cx9a1_bee
0.002	51.306	0.712	3.789	14.028	30.163	0.000	0.000	0.000	0.000	0.188	pg16beta2_o3_native_lto.cx9a1_bee
0.003	53.522	0.677	3.750	13.944	28.104	nonzero	0.000	0.000	0.000	0.271	pg16beta3_o3_native_lto.cx9a1_bee
0.002	52.374	0.707	3.741	13.923	29.253	0.000	0.000	0.000	0.000	0.173	pg16rc1_o3_native_lto.cx9a1_bee
0.003	44.843	0.814	4.533	16.426	33.380	0.000	0.000	0.000	0.000	0.152	pg160_o3_native_lto.cx9a1_bee
q100.1
- q100.1: range queries with 100 insert/s per client
- Legend for results is here.
- Each entry lists the percentage of responses that fit in that bucket (slower than max time for previous bucket, faster than min time for next bucket).
Query response time histogram
256us	1ms	4ms	16ms	64ms	256ms	1s	4s	16s	gt	max	tag
99.836	0.162	0.001	0.002	0.000	0.000	0.000	0.000	0.000	0.000	0.016	pg152_o3_native_lto.cx9a1_bee
99.869	0.129	nonzero	0.001	0.000	0.000	0.000	0.000	0.000	0.000	0.016	pg153_o3_native_lto.cx9a1_bee
99.872	0.126	nonzero	0.001	nonzero	0.000	0.000	0.000	0.000	0.000	0.020	pg154_o3_native_lto.cx9a1_bee
99.830	0.169	nonzero	0.001	0.000	0.000	0.000	0.000	0.000	0.000	0.010	pg16beta1_o3_native_lto.cx9a1_bee
99.873	0.125	nonzero	0.001	nonzero	0.000	0.000	0.000	0.000	0.000	0.016	pg16beta2_o3_native_lto.cx9a1_bee
99.896	0.102	nonzero	0.001	0.000	0.000	0.000	0.000	0.000	0.000	0.016	pg16beta3_o3_native_lto.cx9a1_bee
99.867	0.131	nonzero	0.001	0.000	0.000	0.000	0.000	0.000	0.000	0.015	pg16rc1_o3_native_lto.cx9a1_bee
99.871	0.127	nonzero	0.001	nonzero	0.000	0.000	0.000	0.000	0.000	0.019	pg160_o3_native_lto.cx9a1_bee
Insert response time histogram
256us	1ms	4ms	16ms	64ms	256ms	1s	4s	16s	gt	max	tag
0.000	0.000	0.000	61.542	38.458	0.000	0.000	0.000	0.000	0.000	0.034	pg152_o3_native_lto.cx9a1_bee
0.000	0.000	0.000	82.097	17.903	0.000	0.000	0.000	0.000	0.000	0.033	pg153_o3_native_lto.cx9a1_bee
0.000	0.000	0.000	67.340	32.660	0.000	0.000	0.000	0.000	0.000	0.032	pg154_o3_native_lto.cx9a1_bee
0.000	0.000	0.000	84.708	15.292	0.000	0.000	0.000	0.000	0.000	0.031	pg16beta1_o3_native_lto.cx9a1_bee
0.000	0.000	0.000	62.528	37.472	0.000	0.000	0.000	0.000	0.000	0.033	pg16beta2_o3_native_lto.cx9a1_bee
0.000	0.000	0.000	66.028	33.972	0.000	0.000	0.000	0.000	0.000	0.033	pg16beta3_o3_native_lto.cx9a1_bee
0.000	0.000	0.000	72.528	27.472	0.000	0.000	0.000	0.000	0.000	0.033	pg16rc1_o3_native_lto.cx9a1_bee
0.000	0.000	0.000	63.861	36.139	0.000	0.000	0.000	0.000	0.000	0.052	pg160_o3_native_lto.cx9a1_bee
Delete response time histogram
256us	1ms	4ms	16ms	64ms	256ms	1s	4s	16s	gt	max	tag
0.000	5.597	27.729	66.660	0.014	0.000	0.000	0.000	0.000	0.000	0.016	pg152_o3_native_lto.cx9a1_bee
0.604	98.778	0.097	0.521	0.000	0.000	0.000	0.000	0.000	0.000	0.009	pg153_o3_native_lto.cx9a1_bee
0.701	99.007	0.028	0.264	0.000	0.000	0.000	0.000	0.000	0.000	0.007	pg154_o3_native_lto.cx9a1_bee
2.729	97.236	0.007	0.028	0.000	0.000	0.000	0.000	0.000	0.000	0.010	pg16beta1_o3_native_lto.cx9a1_bee
1.243	98.208	0.118	0.431	0.000	0.000	0.000	0.000	0.000	0.000	0.009	pg16beta2_o3_native_lto.cx9a1_bee
0.396	99.243	0.042	0.319	0.000	0.000	0.000	0.000	0.000	0.000	0.008	pg16beta3_o3_native_lto.cx9a1_bee
0.542	99.118	0.042	0.299	0.000	0.000	0.000	0.000	0.000	0.000	0.010	pg16rc1_o3_native_lto.cx9a1_bee
0.583	98.917	0.042	0.458	0.000	0.000	0.000	0.000	0.000	0.000	0.010	pg160_o3_native_lto.cx9a1_bee
q500.1
- q500.1: range queries with 500 insert/s per client
- Legend for results is here.
- Each entry lists the percentage of responses that fit in that bucket (slower than max time for previous bucket, faster than min time for next bucket).
Query response time histogram
256us	1ms	4ms	16ms	64ms	256ms	1s	4s	16s	gt	max	tag
99.901	0.094	0.001	0.004	0.000	0.000	0.000	0.000	0.000	0.000	0.016	pg152_o3_native_lto.cx9a1_bee
99.914	0.082	nonzero	0.004	0.000	0.000	0.000	0.000	0.000	0.000	0.016	pg153_o3_native_lto.cx9a1_bee
99.921	0.074	nonzero	0.004	0.000	0.000	0.000	0.000	0.000	0.000	0.016	pg154_o3_native_lto.cx9a1_bee
99.926	0.070	nonzero	0.004	0.000	0.000	0.000	0.000	0.000	0.000	0.016	pg16beta1_o3_native_lto.cx9a1_bee
99.914	0.082	0.001	0.004	0.000	0.000	0.000	0.000	0.000	0.000	0.016	pg16beta2_o3_native_lto.cx9a1_bee
99.922	0.074	nonzero	0.004	0.000	0.000	0.000	0.000	0.000	0.000	0.015	pg16beta3_o3_native_lto.cx9a1_bee
99.918	0.077	nonzero	0.004	0.000	0.000	0.000	0.000	0.000	0.000	0.016	pg16rc1_o3_native_lto.cx9a1_bee
99.920	0.076	nonzero	0.004	nonzero	0.000	0.000	0.000	0.000	0.000	0.016	pg160_o3_native_lto.cx9a1_bee
Insert response time histogram
256us	1ms	4ms	16ms	64ms	256ms	1s	4s	16s	gt	max	tag
0.000	0.000	0.000	91.826	8.174	0.000	0.000	0.000	0.000	0.000	0.032	pg152_o3_native_lto.cx9a1_bee
0.000	0.000	0.000	93.065	6.935	0.000	0.000	0.000	0.000	0.000	0.031	pg153_o3_native_lto.cx9a1_bee
0.000	0.000	0.000	92.949	7.051	0.000	0.000	0.000	0.000	0.000	0.033	pg154_o3_native_lto.cx9a1_bee
0.000	0.000	0.000	91.801	8.199	0.000	0.000	0.000	0.000	0.000	0.032	pg16beta1_o3_native_lto.cx9a1_bee
0.000	0.000	0.000	91.857	8.143	0.000	0.000	0.000	0.000	0.000	0.032	pg16beta2_o3_native_lto.cx9a1_bee
0.000	0.000	0.000	92.607	7.393	0.000	0.000	0.000	0.000	0.000	0.030	pg16beta3_o3_native_lto.cx9a1_bee
0.000	0.000	0.000	91.471	8.529	0.000	0.000	0.000	0.000	0.000	0.032	pg16rc1_o3_native_lto.cx9a1_bee
0.000	0.000	0.000	91.464	8.536	0.000	0.000	0.000	0.000	0.000	0.035	pg160_o3_native_lto.cx9a1_bee
Delete response time histogram
256us	1ms	4ms	16ms	64ms	256ms	1s	4s	16s	gt	max	tag
0.453	6.764	0.004	16.856	75.924	0.000	0.000	0.000	0.000	0.000	0.050	pg152_o3_native_lto.cx9a1_bee
7.217	92.490	0.117	0.176	0.000	0.000	0.000	0.000	0.000	0.000	0.010	pg153_o3_native_lto.cx9a1_bee
6.643	93.096	0.067	0.194	0.000	0.000	0.000	0.000	0.000	0.000	0.010	pg154_o3_native_lto.cx9a1_bee
7.356	92.335	0.082	0.228	0.000	0.000	0.000	0.000	0.000	0.000	0.010	pg16beta1_o3_native_lto.cx9a1_bee
6.286	93.440	0.051	0.222	0.000	0.000	0.000	0.000	0.000	0.000	0.010	pg16beta2_o3_native_lto.cx9a1_bee
6.578	93.168	0.051	0.203	0.000	0.000	0.000	0.000	0.000	0.000	0.009	pg16beta3_o3_native_lto.cx9a1_bee
5.631	94.083	0.075	0.211	0.000	0.000	0.000	0.000	0.000	0.000	0.010	pg16rc1_o3_native_lto.cx9a1_bee
6.814	92.904	0.069	0.213	0.000	0.000	0.000	0.000	0.000	0.000	0.010	pg160_o3_native_lto.cx9a1_bee
q1000.1
- q1000.1: range queries with 1000 insert/s per client
- Legend for results is here.
- Each entry lists the percentage of responses that fit in that bucket (slower than max time for previous bucket, faster than min time for next bucket).
Query response time histogram
256us	1ms	4ms	16ms	64ms	256ms	1s	4s	16s	gt	max	tag
99.880	0.113	0.001	0.006	0.000	0.000	0.000	0.000	0.000	0.000	0.016	pg152_o3_native_lto.cx9a1_bee
99.864	0.128	0.001	0.006	0.000	0.000	0.000	0.000	0.000	0.000	0.016	pg153_o3_native_lto.cx9a1_bee
99.870	0.123	0.001	0.006	0.000	0.000	0.000	0.000	0.000	0.000	0.016	pg154_o3_native_lto.cx9a1_bee
99.873	0.119	0.001	0.006	0.000	0.000	0.000	0.000	0.000	0.000	0.016	pg16beta1_o3_native_lto.cx9a1_bee
99.871	0.122	0.001	0.006	0.000	0.000	0.000	0.000	0.000	0.000	0.016	pg16beta2_o3_native_lto.cx9a1_bee
99.870	0.123	0.001	0.006	0.000	0.000	0.000	0.000	0.000	0.000	0.015	pg16beta3_o3_native_lto.cx9a1_bee
99.874	0.119	0.001	0.006	0.000	0.000	0.000	0.000	0.000	0.000	0.016	pg16rc1_o3_native_lto.cx9a1_bee
99.868	0.125	0.001	0.006	0.000	0.000	0.000	0.000	0.000	0.000	0.016	pg160_o3_native_lto.cx9a1_bee
Insert response time histogram
256us	1ms	4ms	16ms	64ms	256ms	1s	4s	16s	gt	max	tag
0.000	0.000	0.000	97.286	2.714	0.000	0.000	0.000	0.000	0.000	0.030	pg152_o3_native_lto.cx9a1_bee
0.000	0.000	0.000	97.353	2.647	0.000	0.000	0.000	0.000	0.000	0.037	pg153_o3_native_lto.cx9a1_bee
0.000	0.000	0.000	97.288	2.712	0.000	0.000	0.000	0.000	0.000	0.049	pg154_o3_native_lto.cx9a1_bee
0.000	0.000	0.000	97.375	2.625	0.000	0.000	0.000	0.000	0.000	0.028	pg16beta1_o3_native_lto.cx9a1_bee
0.000	0.000	0.000	97.447	2.553	0.000	0.000	0.000	0.000	0.000	0.030	pg16beta2_o3_native_lto.cx9a1_bee
0.000	0.000	0.000	97.567	2.433	0.000	0.000	0.000	0.000	0.000	0.030	pg16beta3_o3_native_lto.cx9a1_bee
0.000	0.000	0.000	97.396	2.604	0.000	0.000	0.000	0.000	0.000	0.048	pg16rc1_o3_native_lto.cx9a1_bee
0.000	0.000	0.000	97.371	2.629	0.000	0.000	0.000	0.000	0.000	0.028	pg160_o3_native_lto.cx9a1_bee
Delete response time histogram
256us	1ms	4ms	16ms	64ms	256ms	1s	4s	16s	gt	max	tag
3.987	95.867	0.065	0.081	0.000	0.000	0.000	0.000	0.000	0.000	0.010	pg152_o3_native_lto.cx9a1_bee
3.817	96.062	0.061	0.060	0.000	0.000	0.000	0.000	0.000	0.000	0.010	pg153_o3_native_lto.cx9a1_bee
3.565	93.804	0.072	0.046	0.076	2.437	0.000	0.000	0.000	0.000	0.168	pg154_o3_native_lto.cx9a1_bee
3.985	95.899	0.051	0.064	0.000	0.000	0.000	0.000	0.000	0.000	0.010	pg16beta1_o3_native_lto.cx9a1_bee
3.501	96.373	0.062	0.065	0.000	0.000	0.000	0.000	0.000	0.000	0.009	pg16beta2_o3_native_lto.cx9a1_bee
3.488	96.374	0.060	0.078	0.000	0.000	0.000	0.000	0.000	0.000	0.009	pg16beta3_o3_native_lto.cx9a1_bee
3.264	96.614	0.062	0.060	0.000	0.000	0.000	0.000	0.000	0.000	0.009	pg16rc1_o3_native_lto.cx9a1_bee
3.158	96.715	0.055	0.072	0.000	0.000	0.000	0.000	0.000	0.000	0.013	pg160_o3_native_lto.cx9a1_bee