Introduction
This is a report for the insert benchmark with 20M docs and 1 client(s). It is generated by scripts (bash, awk, sed) and Tufte might not be impressed. An overview of the insert benchmark is here and a short update is here. Below, by DBMS, I mean DBMS+version.config. An example is my8020.c10b40 where my means MySQL, 8020 is version 8.0.20 and c10b40 is the name for the configuration file.
The test server has 8 AMD cores, 16G RAM and an NVMe SSD. It is described here as the Beelink. The benchmark was run with 1 client and there were 1 or 3 connections per client (1 for queries or inserts without rate limits, 1+1 for rate limited inserts+deletes). It uses 1 table. It loads 20M rows per table without secondary indexes, creates secondary indexes, then inserts 300M rows per table with a delete per insert to avoid growing the table. It then does 3 read+write tests for 7200s each that do queries as fast as possible with 100, 500 and then 1000 inserts/second/client concurrent with the queries and 1000 deletes/second to avoid growing the table. The database is cached by Postgres. Clients and the DBMS share one server. The per-database configs are in the per-database subdirectories here.
The tested DBMS are:
- pg152_o3_native_lto.cx9a2_bee - Postgres 15.3, o3_native_lto build that used -O3 -march/-mtune=native, -flto, a2 config
- pg153_o3_native_lto.cx9a2_bee - Postgres 15.3, o3_native_lto build that used -O3 -march/-mtune=native, -flto, a2 config
- pg154_o3_native_lto.cx9a2_bee - Postgres 15.4, o3_native_lto build that used -O3 -march/-mtune=native, -flto, a2 config
- pg16beta1_o3_native_lto.cx9a2_bee - Postgres 16 beta1, o3_native_lto build that used -O3 -march/-mtune=native, -flto, a1 config
- pg16beta2_o3_native_lto.cx9a2_bee - Postgres 16 beta2, o3_native_lto build that used -O3 -march/-mtune=native, -flto, a2 config
- pg16beta3_o3_native_lto.cx9a2_bee - Postgres 16 beta3, o3_native_lto build that used -O3 -march/-mtune=native, -flto, a2 config
- pg16rc1_o3_native_lto.cx9a2_bee - Postgres 16 rc1, o3_native_lto build that used -O3 -march/-mtune=native, -flto, a2 config
- pg160_o3_native_lto.cx9a2_bee - Postgres 16.0, o3_native_lto build that used -O3 -march/-mtune=native, -flto, a2 config
Contents
- Summary
- l.i0: load without secondary indexes
- l.x: create secondary indexes
- l.i1: continue load after secondary indexes created
- q100.1: range queries with 100 insert/s per client
- q500.1: range queries with 500 insert/s per client
- q1000.1: range queries with 1000 insert/s per client
Summary
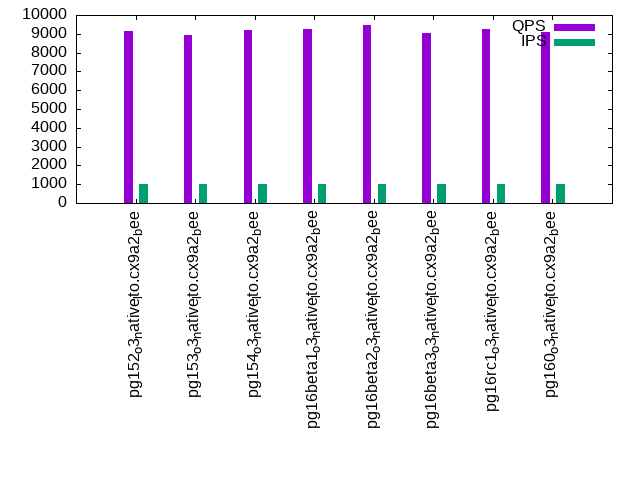
The numbers are inserts/s for l.i0 and l.i1, indexed docs (or rows) /s for l.x and queries/s for q*.2. The values are the average rate over the entire test for inserts (IPS) and queries (QPS). The range of values for IPS and QPS is split into 3 parts: bottom 25%, middle 50%, top 25%. Values in the bottom 25% have a red background, values in the top 25% have a green background and values in the middle have no color. A gray background is used for values that can be ignored because the DBMS did not sustain the target insert rate. Red backgrounds are not used when the minimum value is within 80% of the max value.
| dbms | l.i0 | l.x | l.i1 | q100.1 | q500.1 | q1000.1 |
|---|---|---|---|---|---|---|
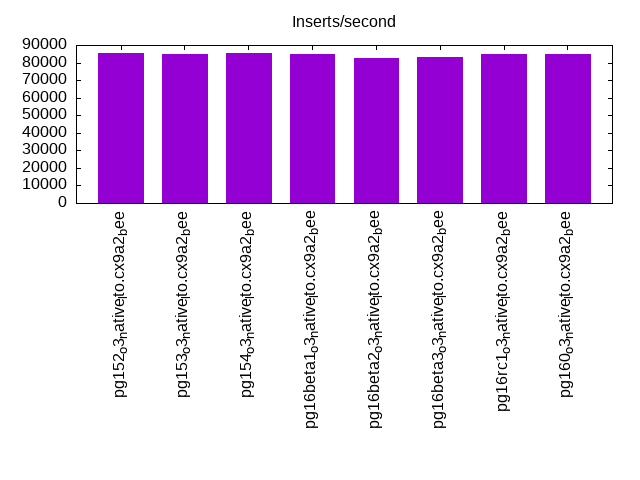
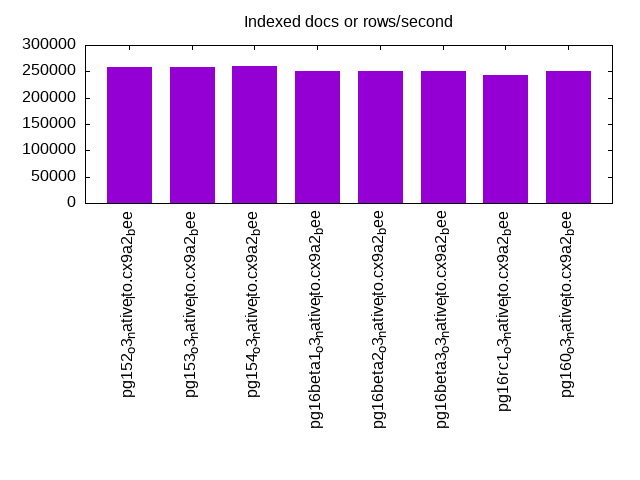
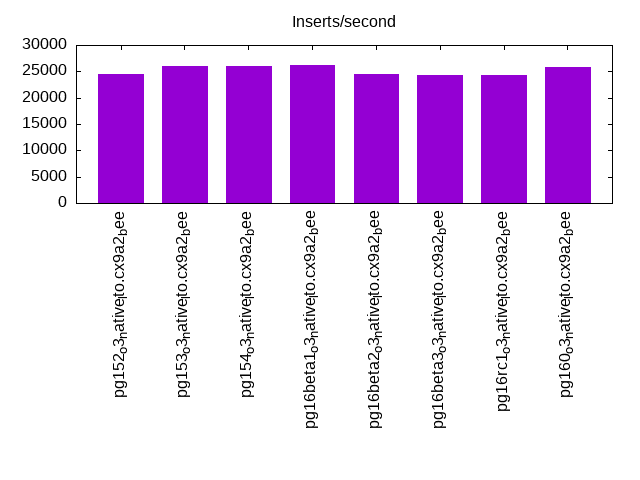
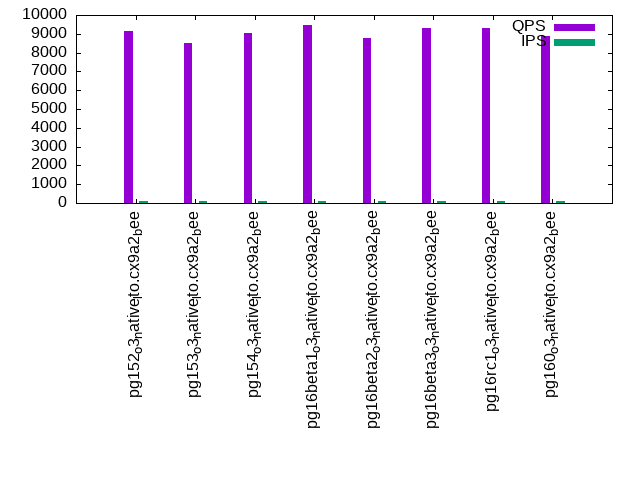
| pg152_o3_native_lto.cx9a2_bee | 85470 | 257692 | 24580 | 9133 | 9084 | 9133 |
| pg153_o3_native_lto.cx9a2_bee | 85106 | 257692 | 26046 | 8508 | 8997 | 8912 |
| pg154_o3_native_lto.cx9a2_bee | 85470 | 261039 | 25988 | 9028 | 9293 | 9203 |
| pg16beta1_o3_native_lto.cx9a2_bee | 84746 | 251250 | 26110 | 9448 | 9002 | 9266 |
| pg16beta2_o3_native_lto.cx9a2_bee | 82645 | 251250 | 24420 | 8763 | 9284 | 9485 |
| pg16beta3_o3_native_lto.cx9a2_bee | 82988 | 251250 | 24319 | 9300 | 8786 | 9045 |
| pg16rc1_o3_native_lto.cx9a2_bee | 84746 | 242169 | 24229 | 9293 | 8978 | 9268 |
| pg160_o3_native_lto.cx9a2_bee | 84746 | 251250 | 25878 | 8888 | 9152 | 9071 |
This table has relative throughput, throughput for the DBMS relative to the DBMS in the first line, using the absolute throughput from the previous table. Values less than 0.95 have a yellow background. Values greater than 1.05 have a blue background.
| dbms | l.i0 | l.x | l.i1 | q100.1 | q500.1 | q1000.1 |
|---|---|---|---|---|---|---|
| pg152_o3_native_lto.cx9a2_bee | 1.00 | 1.00 | 1.00 | 1.00 | 1.00 | 1.00 |
| pg153_o3_native_lto.cx9a2_bee | 1.00 | 1.00 | 1.06 | 0.93 | 0.99 | 0.98 |
| pg154_o3_native_lto.cx9a2_bee | 1.00 | 1.01 | 1.06 | 0.99 | 1.02 | 1.01 |
| pg16beta1_o3_native_lto.cx9a2_bee | 0.99 | 0.98 | 1.06 | 1.03 | 0.99 | 1.01 |
| pg16beta2_o3_native_lto.cx9a2_bee | 0.97 | 0.98 | 0.99 | 0.96 | 1.02 | 1.04 |
| pg16beta3_o3_native_lto.cx9a2_bee | 0.97 | 0.98 | 0.99 | 1.02 | 0.97 | 0.99 |
| pg16rc1_o3_native_lto.cx9a2_bee | 0.99 | 0.94 | 0.99 | 1.02 | 0.99 | 1.01 |
| pg160_o3_native_lto.cx9a2_bee | 0.99 | 0.98 | 1.05 | 0.97 | 1.01 | 0.99 |
This lists the average rate of inserts/s for the tests that do inserts concurrent with queries. For such tests the query rate is listed in the table above. The read+write tests are setup so that the insert rate should match the target rate every second. Cells that are not at least 95% of the target have a red background to indicate a failure to satisfy the target.
| dbms | q100.1 | q500.1 | q1000.1 |
|---|---|---|---|
| pg152_o3_native_lto.cx9a2_bee | 100 | 499 | 998 |
| pg153_o3_native_lto.cx9a2_bee | 100 | 499 | 997 |
| pg154_o3_native_lto.cx9a2_bee | 100 | 499 | 998 |
| pg16beta1_o3_native_lto.cx9a2_bee | 100 | 499 | 998 |
| pg16beta2_o3_native_lto.cx9a2_bee | 100 | 499 | 998 |
| pg16beta3_o3_native_lto.cx9a2_bee | 100 | 499 | 999 |
| pg16rc1_o3_native_lto.cx9a2_bee | 100 | 499 | 998 |
| pg160_o3_native_lto.cx9a2_bee | 100 | 499 | 998 |
| target | 100 | 500 | 1000 |
l.i0
l.i0: load without secondary indexes. Graphs for performance per 1-second interval are here.
Average throughput:
Insert response time histogram: each cell has the percentage of responses that take <= the time in the header and max is the max response time in seconds. For the max column values in the top 25% of the range have a red background and in the bottom 25% of the range have a green background. The red background is not used when the min value is within 80% of the max value.
| dbms | 256us | 1ms | 4ms | 16ms | 64ms | 256ms | 1s | 4s | 16s | gt | max |
|---|---|---|---|---|---|---|---|---|---|---|---|
| pg152_o3_native_lto.cx9a2_bee | 0.024 | 99.977 | 0.003 | ||||||||
| pg153_o3_native_lto.cx9a2_bee | 0.018 | 99.982 | 0.003 | ||||||||
| pg154_o3_native_lto.cx9a2_bee | 0.076 | 99.924 | 0.003 | ||||||||
| pg16beta1_o3_native_lto.cx9a2_bee | 0.012 | 99.988 | 0.003 | ||||||||
| pg16beta2_o3_native_lto.cx9a2_bee | 100.000 | 0.003 | |||||||||
| pg16beta3_o3_native_lto.cx9a2_bee | 100.000 | 0.003 | |||||||||
| pg16rc1_o3_native_lto.cx9a2_bee | 0.025 | 99.975 | 0.003 | ||||||||
| pg160_o3_native_lto.cx9a2_bee | 0.015 | 99.984 | 0.003 |
Performance metrics for the DBMS listed above. Some are normalized by throughput, others are not. Legend for results is here.
ips	qps	rps	rmbps	wps	wmbps	rpq	rkbpq	wpi	wkbpi	csps	cpups	cspq	cpupq	dbgb1	dbgb2	rss	maxop	p50	p99	tag
85470	0	0	0.0	100.0	36.4	0.000	0.000	0.001	0.436	10313	23.1	0.121	22	1.9	5.2	0.3	0.003	85711	82900	20m.pg152_o3_native_lto.cx9a2_bee
85106	0	0	0.0	100.0	36.1	0.000	0.000	0.001	0.434	10260	22.7	0.121	21	1.9	5.2	0.2	0.003	85406	81907	20m.pg153_o3_native_lto.cx9a2_bee
85470	0	0	0.0	101.7	36.6	0.000	0.000	0.001	0.439	10393	22.7	0.122	21	1.9	5.2	1.8	0.003	86303	76593	20m.pg154_o3_native_lto.cx9a2_bee
84746	0	0	0.0	100.4	36.0	0.000	0.000	0.001	0.436	10269	22.7	0.121	21	1.9	5.2	0.3	0.003	85407	73720	20m.pg16beta1_o3_native_lto.cx9a2_bee
82645	0	0	0.0	97.9	35.1	0.000	0.000	0.001	0.435	10070	23.0	0.122	22	1.9	5.2	1.9	0.003	83224	79634	20m.pg16beta2_o3_native_lto.cx9a2_bee
82988	0	0	0.0	97.8	35.1	0.000	0.000	0.001	0.433	10058	23.1	0.121	22	1.9	5.2	1.9	0.003	83304	79508	20m.pg16beta3_o3_native_lto.cx9a2_bee
84746	0	0	0.0	98.4	36.1	0.000	0.000	0.001	0.436	10283	22.7	0.121	21	1.9	5.2	0.3	0.003	85503	82603	20m.pg16rc1_o3_native_lto.cx9a2_bee
84746	0	0	0.0	98.5	36.0	0.000	0.000	0.001	0.435	10251	22.5	0.121	21	1.9	5.2	0.2	0.003	85207	81374	20m.pg160_o3_native_lto.cx9a2_bee
l.x
l.x: create secondary indexes.
Average throughput:
Performance metrics for the DBMS listed above. Some are normalized by throughput, others are not. Legend for results is here.
ips	qps	rps	rmbps	wps	wmbps	rpq	rkbpq	wpi	wkbpi	csps	cpups	cspq	cpupq	dbgb1	dbgb2	rss	maxop	p50	p99	tag
257692	0	0	0.0	108.0	50.1	0.000	0.000	0.000	0.199	701	11.9	0.003	4	3.7	8.6	2.1	0.003	NA	NA	20m.pg152_o3_native_lto.cx9a2_bee
257692	0	0	0.0	110.7	51.5	0.000	0.000	0.000	0.204	711	11.9	0.003	4	3.7	8.6	2.1	0.003	NA	NA	20m.pg153_o3_native_lto.cx9a2_bee
261039	0	0	0.0	115.1	53.3	0.000	0.000	0.000	0.209	723	11.9	0.003	4	3.7	8.6	2.1	0.003	NA	NA	20m.pg154_o3_native_lto.cx9a2_bee
251250	0	0	0.0	101.7	47.0	0.000	0.000	0.000	0.191	732	11.9	0.003	4	3.7	8.6	2.1	0.003	NA	NA	20m.pg16beta1_o3_native_lto.cx9a2_bee
251250	0	0	0.0	153.8	71.6	0.000	0.000	0.001	0.292	874	11.8	0.003	4	3.7	8.6	2.1	0.003	NA	NA	20m.pg16beta2_o3_native_lto.cx9a2_bee
251250	0	0	0.0	134.4	62.7	0.000	0.000	0.001	0.256	742	12.1	0.003	4	3.7	8.6	2.1	0.002	NA	NA	20m.pg16beta3_o3_native_lto.cx9a2_bee
242169	0	0	0.0	107.7	50.2	0.000	0.000	0.000	0.212	736	11.8	0.003	4	3.7	8.6	2.1	0.003	NA	NA	20m.pg16rc1_o3_native_lto.cx9a2_bee
251250	0	0	0.0	134.7	62.7	0.000	0.000	0.001	0.256	739	11.8	0.003	4	3.7	8.6	2.1	0.003	NA	NA	20m.pg160_o3_native_lto.cx9a2_bee
l.i1
l.i1: continue load after secondary indexes created. Graphs for performance per 1-second interval are here.
Average throughput:
Insert response time histogram: each cell has the percentage of responses that take <= the time in the header and max is the max response time in seconds. For the max column values in the top 25% of the range have a red background and in the bottom 25% of the range have a green background. The red background is not used when the min value is within 80% of the max value.
| dbms | 256us | 1ms | 4ms | 16ms | 64ms | 256ms | 1s | 4s | 16s | gt | max |
|---|---|---|---|---|---|---|---|---|---|---|---|
| pg152_o3_native_lto.cx9a2_bee | 99.999 | 0.001 | nonzero | 0.020 | |||||||
| pg153_o3_native_lto.cx9a2_bee | 99.999 | 0.001 | nonzero | 0.047 | |||||||
| pg154_o3_native_lto.cx9a2_bee | 99.999 | 0.001 | nonzero | 0.025 | |||||||
| pg16beta1_o3_native_lto.cx9a2_bee | 99.999 | 0.001 | nonzero | 0.033 | |||||||
| pg16beta2_o3_native_lto.cx9a2_bee | 99.999 | 0.001 | nonzero | 0.027 | |||||||
| pg16beta3_o3_native_lto.cx9a2_bee | 99.999 | 0.001 | nonzero | 0.024 | |||||||
| pg16rc1_o3_native_lto.cx9a2_bee | 99.998 | 0.001 | 0.001 | 0.058 | |||||||
| pg160_o3_native_lto.cx9a2_bee | 99.999 | 0.001 | nonzero | 0.026 |
Delete response time histogram: each cell has the percentage of responses that take <= the time in the header and max is the max response time in seconds. For the max column values in the top 25% of the range have a red background and in the bottom 25% of the range have a green background. The red background is not used when the min value is within 80% of the max value.
| dbms | 256us | 1ms | 4ms | 16ms | 64ms | 256ms | 1s | 4s | 16s | gt | max |
|---|---|---|---|---|---|---|---|---|---|---|---|
| pg152_o3_native_lto.cx9a2_bee | 0.684 | 83.822 | 2.164 | 13.330 | nonzero | 0.019 | |||||
| pg153_o3_native_lto.cx9a2_bee | 0.708 | 83.262 | 9.716 | 6.314 | nonzero | 0.045 | |||||
| pg154_o3_native_lto.cx9a2_bee | 0.653 | 83.530 | 9.675 | 6.141 | nonzero | 0.022 | |||||
| pg16beta1_o3_native_lto.cx9a2_bee | 0.682 | 83.273 | 9.041 | 7.005 | nonzero | 0.026 | |||||
| pg16beta2_o3_native_lto.cx9a2_bee | 0.680 | 83.785 | 2.262 | 13.273 | nonzero | 0.027 | |||||
| pg16beta3_o3_native_lto.cx9a2_bee | 0.564 | 83.771 | 2.094 | 13.571 | nonzero | 0.018 | |||||
| pg16rc1_o3_native_lto.cx9a2_bee | 0.657 | 83.663 | 3.465 | 12.214 | nonzero | 0.057 | |||||
| pg160_o3_native_lto.cx9a2_bee | 0.549 | 83.549 | 9.104 | 6.798 | nonzero | 0.022 |
Performance metrics for the DBMS listed above. Some are normalized by throughput, others are not. Legend for results is here.
ips	qps	rps	rmbps	wps	wmbps	rpq	rkbpq	wpi	wkbpi	csps	cpups	cspq	cpupq	dbgb1	dbgb2	rss	maxop	p50	p99	tag
24580	0	0	0.0	72.0	19.7	0.000	0.000	0.003	0.820	11760	23.2	0.478	76	5.1	45.2	1.6	0.020	32514	8344	20m.pg152_o3_native_lto.cx9a2_bee
26046	0	0	0.0	76.3	20.8	0.000	0.000	0.003	0.819	12480	23.9	0.479	73	5.1	45.1	5.0	0.047	32579	5645	20m.pg153_o3_native_lto.cx9a2_bee
25988	0	0	0.0	76.7	20.8	0.000	0.000	0.003	0.819	12446	23.9	0.479	74	5.1	45.1	4.8	0.025	32664	5499	20m.pg154_o3_native_lto.cx9a2_bee
26110	0	0	0.0	76.9	20.9	0.000	0.000	0.003	0.821	12485	24.1	0.478	74	5.1	45.2	5.0	0.033	32563	7791	20m.pg16beta1_o3_native_lto.cx9a2_bee
24420	0	0	0.0	71.8	19.5	0.000	0.000	0.003	0.819	11741	23.3	0.481	76	5.1	45.2	3.5	0.027	32164	8292	20m.pg16beta2_o3_native_lto.cx9a2_bee
24319	0	0	0.0	71.1	19.5	0.000	0.000	0.003	0.819	11628	23.2	0.478	76	5.1	45.2	4.0	0.024	32165	8241	20m.pg16beta3_o3_native_lto.cx9a2_bee
24229	0	0	0.0	71.7	19.6	0.000	0.000	0.003	0.829	11577	23.1	0.478	76	5.1	45.2	5.2	0.058	32470	4695	20m.pg16rc1_o3_native_lto.cx9a2_bee
25878	0	0	0.0	75.4	20.7	0.000	0.000	0.003	0.820	12367	24.1	0.478	75	5.1	45.2	5.2	0.026	32265	7392	20m.pg160_o3_native_lto.cx9a2_bee
q100.1
q100.1: range queries with 100 insert/s per client. Graphs for performance per 1-second interval are here.
Average throughput:
Query response time histogram: each cell has the percentage of responses that take <= the time in the header and max is the max response time in seconds. For max values in the top 25% of the range have a red background and in the bottom 25% of the range have a green background. The red background is not used when the min value is within 80% of the max value.
| dbms | 256us | 1ms | 4ms | 16ms | 64ms | 256ms | 1s | 4s | 16s | gt | max |
|---|---|---|---|---|---|---|---|---|---|---|---|
| pg152_o3_native_lto.cx9a2_bee | 99.968 | 0.032 | nonzero | nonzero | 0.004 | ||||||
| pg153_o3_native_lto.cx9a2_bee | 99.952 | 0.048 | nonzero | nonzero | 0.004 | ||||||
| pg154_o3_native_lto.cx9a2_bee | 99.951 | 0.049 | nonzero | nonzero | 0.004 | ||||||
| pg16beta1_o3_native_lto.cx9a2_bee | 99.966 | 0.034 | nonzero | 0.003 | |||||||
| pg16beta2_o3_native_lto.cx9a2_bee | 99.964 | 0.036 | nonzero | nonzero | 0.005 | ||||||
| pg16beta3_o3_native_lto.cx9a2_bee | 99.966 | 0.034 | nonzero | 0.003 | |||||||
| pg16rc1_o3_native_lto.cx9a2_bee | 99.956 | 0.044 | nonzero | nonzero | 0.004 | ||||||
| pg160_o3_native_lto.cx9a2_bee | 99.966 | 0.033 | nonzero | nonzero | 0.005 |
Insert response time histogram: each cell has the percentage of responses that take <= the time in the header and max is the max response time in seconds. For max values in the top 25% of the range have a red background and in the bottom 25% of the range have a green background. The red background is not used when the min value is within 80% of the max value.
| dbms | 256us | 1ms | 4ms | 16ms | 64ms | 256ms | 1s | 4s | 16s | gt | max |
|---|---|---|---|---|---|---|---|---|---|---|---|
| pg152_o3_native_lto.cx9a2_bee | 99.965 | 0.035 | 0.006 | ||||||||
| pg153_o3_native_lto.cx9a2_bee | 99.972 | 0.028 | 0.006 | ||||||||
| pg154_o3_native_lto.cx9a2_bee | 99.979 | 0.021 | 0.007 | ||||||||
| pg16beta1_o3_native_lto.cx9a2_bee | 99.986 | 0.014 | 0.006 | ||||||||
| pg16beta2_o3_native_lto.cx9a2_bee | 99.986 | 0.014 | 0.007 | ||||||||
| pg16beta3_o3_native_lto.cx9a2_bee | 99.979 | 0.021 | 0.006 | ||||||||
| pg16rc1_o3_native_lto.cx9a2_bee | 99.979 | 0.021 | 0.007 | ||||||||
| pg160_o3_native_lto.cx9a2_bee | 99.965 | 0.035 | 0.005 |
Delete response time histogram: each cell has the percentage of responses that take <= the time in the header and max is the max response time in seconds. For max values in the top 25% of the range have a red background and in the bottom 25% of the range have a green background. The red background is not used when the min value is within 80% of the max value.
| dbms | 256us | 1ms | 4ms | 16ms | 64ms | 256ms | 1s | 4s | 16s | gt | max |
|---|---|---|---|---|---|---|---|---|---|---|---|
| pg152_o3_native_lto.cx9a2_bee | 1.076 | 71.715 | 9.458 | 17.750 | 0.006 | ||||||
| pg153_o3_native_lto.cx9a2_bee | 1.812 | 68.500 | 14.278 | 15.410 | 0.007 | ||||||
| pg154_o3_native_lto.cx9a2_bee | 3.757 | 96.229 | 0.014 | 0.002 | |||||||
| pg16beta1_o3_native_lto.cx9a2_bee | 0.910 | 98.472 | 0.618 | 0.003 | |||||||
| pg16beta2_o3_native_lto.cx9a2_bee | 1.868 | 69.792 | 7.812 | 20.528 | 0.008 | ||||||
| pg16beta3_o3_native_lto.cx9a2_bee | 1.833 | 72.028 | 0.021 | 26.118 | 0.010 | ||||||
| pg16rc1_o3_native_lto.cx9a2_bee | 1.361 | 69.417 | 3.681 | 25.542 | 0.008 | ||||||
| pg160_o3_native_lto.cx9a2_bee | 1.264 | 68.562 | 2.743 | 27.431 | 0.007 |
Performance metrics for the DBMS listed above. Some are normalized by throughput, others are not. Legend for results is here.
ips	qps	rps	rmbps	wps	wmbps	rpq	rkbpq	wpi	wkbpi	csps	cpups	cspq	cpupq	dbgb1	dbgb2	rss	maxop	p50	p99	tag
100	9133	0	0.0	49.4	2.2	0.000	0.000	0.495	23.009	35152	12.9	3.849	113	5.1	43.5	3.4	0.004	8646	8464	20m.pg152_o3_native_lto.cx9a2_bee
100	8508	0	0.0	48.6	2.2	0.000	0.000	0.488	22.895	32770	13.1	3.852	123	5.1	43.4	3.4	0.004	8359	8224	20m.pg153_o3_native_lto.cx9a2_bee
100	9028	0	0.0	47.8	2.2	0.000	0.000	0.480	22.752	34767	13.1	3.851	116	5.1	43.4	1.1	0.004	8711	8527	20m.pg154_o3_native_lto.cx9a2_bee
100	9448	0	0.0	48.8	2.2	0.000	0.000	0.489	22.926	36352	12.8	3.847	108	5.1	43.6	3.5	0.003	8819	8484	20m.pg16beta1_o3_native_lto.cx9a2_bee
100	8763	0	0.0	49.2	2.2	0.000	0.000	0.493	23.076	33723	13.2	3.848	121	5.1	43.5	3.5	0.005	8582	8404	20m.pg16beta2_o3_native_lto.cx9a2_bee
100	9300	0	0.0	49.7	2.3	0.000	0.000	0.498	23.134	35766	12.8	3.846	110	5.1	43.5	3.4	0.003	8763	8342	20m.pg16beta3_o3_native_lto.cx9a2_bee
100	9293	0	0.0	50.8	2.0	0.000	0.000	0.509	21.055	35770	12.9	3.849	111	5.1	42.3	1.4	0.004	8733	8474	20m.pg16rc1_o3_native_lto.cx9a2_bee
100	8888	0	0.0	49.2	2.2	0.000	0.000	0.493	22.999	34209	13.0	3.849	117	5.2	43.5	3.4	0.005	8502	8357	20m.pg160_o3_native_lto.cx9a2_bee
q500.1
q500.1: range queries with 500 insert/s per client. Graphs for performance per 1-second interval are here.
Average throughput:

Query response time histogram: each cell has the percentage of responses that take <= the time in the header and max is the max response time in seconds. For max values in the top 25% of the range have a red background and in the bottom 25% of the range have a green background. The red background is not used when the min value is within 80% of the max value.
| dbms | 256us | 1ms | 4ms | 16ms | 64ms | 256ms | 1s | 4s | 16s | gt | max |
|---|---|---|---|---|---|---|---|---|---|---|---|
| pg152_o3_native_lto.cx9a2_bee | 99.964 | 0.036 | nonzero | nonzero | 0.009 | ||||||
| pg153_o3_native_lto.cx9a2_bee | 99.965 | 0.035 | nonzero | nonzero | nonzero | 0.022 | |||||
| pg154_o3_native_lto.cx9a2_bee | 99.969 | 0.030 | nonzero | nonzero | 0.015 | ||||||
| pg16beta1_o3_native_lto.cx9a2_bee | 99.968 | 0.032 | nonzero | nonzero | nonzero | 0.042 | |||||
| pg16beta2_o3_native_lto.cx9a2_bee | 99.968 | 0.032 | nonzero | nonzero | nonzero | 0.017 | |||||
| pg16beta3_o3_native_lto.cx9a2_bee | 99.961 | 0.039 | nonzero | nonzero | nonzero | 0.017 | |||||
| pg16rc1_o3_native_lto.cx9a2_bee | 99.966 | 0.034 | nonzero | nonzero | 0.009 | ||||||
| pg160_o3_native_lto.cx9a2_bee | 99.969 | 0.031 | nonzero | nonzero | nonzero | 0.016 |
Insert response time histogram: each cell has the percentage of responses that take <= the time in the header and max is the max response time in seconds. For max values in the top 25% of the range have a red background and in the bottom 25% of the range have a green background. The red background is not used when the min value is within 80% of the max value.
| dbms | 256us | 1ms | 4ms | 16ms | 64ms | 256ms | 1s | 4s | 16s | gt | max |
|---|---|---|---|---|---|---|---|---|---|---|---|
| pg152_o3_native_lto.cx9a2_bee | 99.981 | 0.019 | 0.014 | ||||||||
| pg153_o3_native_lto.cx9a2_bee | 99.981 | 0.018 | 0.001 | 0.021 | |||||||
| pg154_o3_native_lto.cx9a2_bee | 99.978 | 0.021 | 0.001 | 0.019 | |||||||
| pg16beta1_o3_native_lto.cx9a2_bee | 99.985 | 0.014 | 0.001 | 0.030 | |||||||
| pg16beta2_o3_native_lto.cx9a2_bee | 99.971 | 0.017 | 0.013 | 0.028 | |||||||
| pg16beta3_o3_native_lto.cx9a2_bee | 99.985 | 0.013 | 0.003 | 0.022 | |||||||
| pg16rc1_o3_native_lto.cx9a2_bee | 99.981 | 0.015 | 0.004 | 0.022 | |||||||
| pg160_o3_native_lto.cx9a2_bee | 99.982 | 0.014 | 0.004 | 0.020 |
Delete response time histogram: each cell has the percentage of responses that take <= the time in the header and max is the max response time in seconds. For max values in the top 25% of the range have a red background and in the bottom 25% of the range have a green background. The red background is not used when the min value is within 80% of the max value.
| dbms | 256us | 1ms | 4ms | 16ms | 64ms | 256ms | 1s | 4s | 16s | gt | max |
|---|---|---|---|---|---|---|---|---|---|---|---|
| pg152_o3_native_lto.cx9a2_bee | 9.432 | 69.475 | 18.083 | 3.010 | 0.012 | ||||||
| pg153_o3_native_lto.cx9a2_bee | 9.850 | 67.938 | 19.010 | 3.201 | 0.001 | 0.019 | |||||
| pg154_o3_native_lto.cx9a2_bee | 10.629 | 68.782 | 0.606 | 19.981 | 0.003 | 0.018 | |||||
| pg16beta1_o3_native_lto.cx9a2_bee | 10.990 | 67.485 | 0.142 | 21.382 | 0.001 | 0.020 | |||||
| pg16beta2_o3_native_lto.cx9a2_bee | 10.269 | 68.285 | 16.294 | 5.143 | 0.008 | 0.025 | |||||
| pg16beta3_o3_native_lto.cx9a2_bee | 9.701 | 71.643 | 0.112 | 18.540 | 0.003 | 0.019 | |||||
| pg16rc1_o3_native_lto.cx9a2_bee | 8.458 | 67.619 | 13.168 | 10.751 | 0.003 | 0.020 | |||||
| pg160_o3_native_lto.cx9a2_bee | 8.721 | 71.218 | 10.926 | 9.131 | 0.004 | 0.018 |
Performance metrics for the DBMS listed above. Some are normalized by throughput, others are not. Legend for results is here.
ips	qps	rps	rmbps	wps	wmbps	rpq	rkbpq	wpi	wkbpi	csps	cpups	cspq	cpupq	dbgb1	dbgb2	rss	maxop	p50	p99	tag
499	9084	0	0.0	33.4	3.0	0.000	0.000	0.067	6.113	35074	13.1	3.861	115	5.2	36.0	5.1	0.009	8621	8433	20m.pg152_o3_native_lto.cx9a2_bee
499	8997	0	0.0	33.4	3.0	0.000	0.000	0.067	6.112	34755	13.0	3.863	116	5.1	35.9	5.0	0.022	8421	8254	20m.pg153_o3_native_lto.cx9a2_bee
499	9293	0	0.0	28.6	3.0	0.000	0.000	0.057	6.191	35892	13.2	3.862	114	5.1	35.8	3.8	0.015	8710	8492	20m.pg154_o3_native_lto.cx9a2_bee
499	9002	0	0.0	33.3	3.0	0.000	0.000	0.067	6.147	34745	13.3	3.860	118	5.1	36.0	5.0	0.042	8581	8419	20m.pg16beta1_o3_native_lto.cx9a2_bee
499	9284	0	0.0	28.8	3.0	0.000	0.000	0.058	6.221	35815	13.1	3.858	113	5.1	35.9	1.9	0.017	8711	8454	20m.pg16beta2_o3_native_lto.cx9a2_bee
499	8786	0	0.0	33.8	3.0	0.000	0.000	0.068	6.101	33922	13.3	3.861	121	5.1	36.0	4.9	0.017	8488	8335	20m.pg16beta3_o3_native_lto.cx9a2_bee
499	8978	0	0.0	37.1	2.9	0.000	0.000	0.074	6.019	34675	13.2	3.862	118	5.1	34.3	5.1	0.009	8535	8348	20m.pg16rc1_o3_native_lto.cx9a2_bee
499	9152	0	0.0	33.1	3.0	0.000	0.000	0.066	6.130	35313	13.1	3.859	115	5.2	36.0	1.2	0.016	8519	8322	20m.pg160_o3_native_lto.cx9a2_bee
q1000.1
q1000.1: range queries with 1000 insert/s per client. Graphs for performance per 1-second interval are here.
Average throughput:
Query response time histogram: each cell has the percentage of responses that take <= the time in the header and max is the max response time in seconds. For max values in the top 25% of the range have a red background and in the bottom 25% of the range have a green background. The red background is not used when the min value is within 80% of the max value.
| dbms | 256us | 1ms | 4ms | 16ms | 64ms | 256ms | 1s | 4s | 16s | gt | max |
|---|---|---|---|---|---|---|---|---|---|---|---|
| pg152_o3_native_lto.cx9a2_bee | 99.964 | 0.036 | nonzero | nonzero | nonzero | 0.019 | |||||
| pg153_o3_native_lto.cx9a2_bee | 99.960 | 0.040 | nonzero | nonzero | 0.015 | ||||||
| pg154_o3_native_lto.cx9a2_bee | 99.967 | 0.033 | nonzero | nonzero | 0.016 | ||||||
| pg16beta1_o3_native_lto.cx9a2_bee | 99.969 | 0.031 | nonzero | nonzero | 0.004 | ||||||
| pg16beta2_o3_native_lto.cx9a2_bee | 99.968 | 0.032 | nonzero | nonzero | 0.015 | ||||||
| pg16beta3_o3_native_lto.cx9a2_bee | 99.959 | 0.041 | nonzero | nonzero | 0.015 | ||||||
| pg16rc1_o3_native_lto.cx9a2_bee | 99.965 | 0.035 | nonzero | nonzero | nonzero | 0.019 | |||||
| pg160_o3_native_lto.cx9a2_bee | 99.961 | 0.039 | nonzero | nonzero | 0.013 |
Insert response time histogram: each cell has the percentage of responses that take <= the time in the header and max is the max response time in seconds. For max values in the top 25% of the range have a red background and in the bottom 25% of the range have a green background. The red background is not used when the min value is within 80% of the max value.
| dbms | 256us | 1ms | 4ms | 16ms | 64ms | 256ms | 1s | 4s | 16s | gt | max |
|---|---|---|---|---|---|---|---|---|---|---|---|
| pg152_o3_native_lto.cx9a2_bee | 99.990 | 0.008 | 0.003 | 0.022 | |||||||
| pg153_o3_native_lto.cx9a2_bee | 99.988 | 0.009 | 0.003 | 0.021 | |||||||
| pg154_o3_native_lto.cx9a2_bee | 99.993 | 0.006 | 0.001 | 0.024 | |||||||
| pg16beta1_o3_native_lto.cx9a2_bee | 99.994 | 0.006 | 0.007 | ||||||||
| pg16beta2_o3_native_lto.cx9a2_bee | 99.992 | 0.006 | 0.001 | 0.026 | |||||||
| pg16beta3_o3_native_lto.cx9a2_bee | 99.992 | 0.006 | 0.003 | 0.023 | |||||||
| pg16rc1_o3_native_lto.cx9a2_bee | 99.985 | 0.010 | 0.005 | 0.039 | |||||||
| pg160_o3_native_lto.cx9a2_bee | 99.989 | 0.007 | 0.004 | 0.033 |
Delete response time histogram: each cell has the percentage of responses that take <= the time in the header and max is the max response time in seconds. For max values in the top 25% of the range have a red background and in the bottom 25% of the range have a green background. The red background is not used when the min value is within 80% of the max value.
| dbms | 256us | 1ms | 4ms | 16ms | 64ms | 256ms | 1s | 4s | 16s | gt | max |
|---|---|---|---|---|---|---|---|---|---|---|---|
| pg152_o3_native_lto.cx9a2_bee | 7.006 | 76.922 | 16.058 | 0.012 | 0.003 | 0.020 | |||||
| pg153_o3_native_lto.cx9a2_bee | 6.781 | 78.112 | 15.100 | 0.004 | 0.002 | 0.019 | |||||
| pg154_o3_native_lto.cx9a2_bee | 6.484 | 72.092 | 0.108 | 21.315 | 0.001 | 0.022 | |||||
| pg16beta1_o3_native_lto.cx9a2_bee | 6.876 | 72.090 | 0.197 | 20.838 | 0.011 | ||||||
| pg16beta2_o3_native_lto.cx9a2_bee | 6.565 | 76.153 | 17.267 | 0.013 | 0.001 | 0.024 | |||||
| pg16beta3_o3_native_lto.cx9a2_bee | 5.951 | 72.958 | 11.291 | 9.797 | 0.003 | 0.021 | |||||
| pg16rc1_o3_native_lto.cx9a2_bee | 6.492 | 76.654 | 16.704 | 0.146 | 0.003 | 0.025 | |||||
| pg160_o3_native_lto.cx9a2_bee | 5.599 | 75.490 | 18.206 | 0.702 | 0.003 | 0.022 |
Performance metrics for the DBMS listed above. Some are normalized by throughput, others are not. Legend for results is here.
ips	qps	rps	rmbps	wps	wmbps	rpq	rkbpq	wpi	wkbpi	csps	cpups	cspq	cpupq	dbgb1	dbgb2	rss	maxop	p50	p99	tag
998	9133	0	0.0	28.1	3.3	0.000	0.000	0.028	3.386	35490	13.7	3.886	120	5.1	26.2	5.2	0.019	8629	8438	20m.pg152_o3_native_lto.cx9a2_bee
997	8912	0	0.0	28.3	3.3	0.000	0.000	0.028	3.381	34657	13.5	3.889	121	5.1	26.0	5.1	0.015	8373	8198	20m.pg153_o3_native_lto.cx9a2_bee
998	9203	0	0.0	26.7	3.3	0.000	0.000	0.027	3.388	35760	13.8	3.886	120	5.1	25.9	2.6	0.016	8665	8471	20m.pg154_o3_native_lto.cx9a2_bee
998	9266	0	0.0	28.5	3.3	0.000	0.000	0.029	3.382	35985	13.7	3.883	118	5.2	26.1	2.8	0.004	8629	8400	20m.pg16beta1_o3_native_lto.cx9a2_bee
998	9485	0	0.0	28.0	3.3	0.000	0.000	0.028	3.398	36803	13.5	3.880	114	5.1	26.0	3.7	0.015	8873	8542	20m.pg16beta2_o3_native_lto.cx9a2_bee
999	9045	0	0.0	28.5	3.3	0.000	0.000	0.028	3.380	35120	13.7	3.883	121	5.1	26.1	2.1	0.015	8456	8254	20m.pg16beta3_o3_native_lto.cx9a2_bee
998	9268	0	0.0	29.0	3.3	0.000	0.000	0.029	3.428	35978	13.6	3.882	117	5.1	25.2	5.2	0.019	8708	8497	20m.pg16rc1_o3_native_lto.cx9a2_bee
998	9071	0	0.0	28.1	3.3	0.000	0.000	0.028	3.384	35227	13.6	3.884	120	5.2	26.1	3.8	0.013	8500	8302	20m.pg160_o3_native_lto.cx9a2_bee
l.i0
l.i0: load without secondary indexes
Performance metrics for all DBMS, not just the ones listed above. Some are normalized by throughput, others are not. Legend for results is here.
ips	qps	rps	rmbps	wps	wmbps	rpq	rkbpq	wpi	wkbpi	csps	cpups	cspq	cpupq	dbgb1	dbgb2	rss	maxop	p50	p99	tag
85470	0	0	0.0	100.0	36.4	0.000	0.000	0.001	0.436	10313	23.1	0.121	22	1.9	5.2	0.3	0.003	85711	82900	20m.pg152_o3_native_lto.cx9a2_bee
85106	0	0	0.0	100.0	36.1	0.000	0.000	0.001	0.434	10260	22.7	0.121	21	1.9	5.2	0.2	0.003	85406	81907	20m.pg153_o3_native_lto.cx9a2_bee
85470	0	0	0.0	101.7	36.6	0.000	0.000	0.001	0.439	10393	22.7	0.122	21	1.9	5.2	1.8	0.003	86303	76593	20m.pg154_o3_native_lto.cx9a2_bee
84746	0	0	0.0	100.4	36.0	0.000	0.000	0.001	0.436	10269	22.7	0.121	21	1.9	5.2	0.3	0.003	85407	73720	20m.pg16beta1_o3_native_lto.cx9a2_bee
82645	0	0	0.0	97.9	35.1	0.000	0.000	0.001	0.435	10070	23.0	0.122	22	1.9	5.2	1.9	0.003	83224	79634	20m.pg16beta2_o3_native_lto.cx9a2_bee
82988	0	0	0.0	97.8	35.1	0.000	0.000	0.001	0.433	10058	23.1	0.121	22	1.9	5.2	1.9	0.003	83304	79508	20m.pg16beta3_o3_native_lto.cx9a2_bee
84746	0	0	0.0	98.4	36.1	0.000	0.000	0.001	0.436	10283	22.7	0.121	21	1.9	5.2	0.3	0.003	85503	82603	20m.pg16rc1_o3_native_lto.cx9a2_bee
84746	0	0	0.0	98.5	36.0	0.000	0.000	0.001	0.435	10251	22.5	0.121	21	1.9	5.2	0.2	0.003	85207	81374	20m.pg160_o3_native_lto.cx9a2_bee
l.x
l.x: create secondary indexes
Performance metrics for all DBMS, not just the ones listed above. Some are normalized by throughput, others are not. Legend for results is here.
ips	qps	rps	rmbps	wps	wmbps	rpq	rkbpq	wpi	wkbpi	csps	cpups	cspq	cpupq	dbgb1	dbgb2	rss	maxop	p50	p99	tag
257692	0	0	0.0	108.0	50.1	0.000	0.000	0.000	0.199	701	11.9	0.003	4	3.7	8.6	2.1	0.003	NA	NA	20m.pg152_o3_native_lto.cx9a2_bee
257692	0	0	0.0	110.7	51.5	0.000	0.000	0.000	0.204	711	11.9	0.003	4	3.7	8.6	2.1	0.003	NA	NA	20m.pg153_o3_native_lto.cx9a2_bee
261039	0	0	0.0	115.1	53.3	0.000	0.000	0.000	0.209	723	11.9	0.003	4	3.7	8.6	2.1	0.003	NA	NA	20m.pg154_o3_native_lto.cx9a2_bee
251250	0	0	0.0	101.7	47.0	0.000	0.000	0.000	0.191	732	11.9	0.003	4	3.7	8.6	2.1	0.003	NA	NA	20m.pg16beta1_o3_native_lto.cx9a2_bee
251250	0	0	0.0	153.8	71.6	0.000	0.000	0.001	0.292	874	11.8	0.003	4	3.7	8.6	2.1	0.003	NA	NA	20m.pg16beta2_o3_native_lto.cx9a2_bee
251250	0	0	0.0	134.4	62.7	0.000	0.000	0.001	0.256	742	12.1	0.003	4	3.7	8.6	2.1	0.002	NA	NA	20m.pg16beta3_o3_native_lto.cx9a2_bee
242169	0	0	0.0	107.7	50.2	0.000	0.000	0.000	0.212	736	11.8	0.003	4	3.7	8.6	2.1	0.003	NA	NA	20m.pg16rc1_o3_native_lto.cx9a2_bee
251250	0	0	0.0	134.7	62.7	0.000	0.000	0.001	0.256	739	11.8	0.003	4	3.7	8.6	2.1	0.003	NA	NA	20m.pg160_o3_native_lto.cx9a2_bee
l.i1
l.i1: continue load after secondary indexes created
Performance metrics for all DBMS, not just the ones listed above. Some are normalized by throughput, others are not. Legend for results is here.
ips	qps	rps	rmbps	wps	wmbps	rpq	rkbpq	wpi	wkbpi	csps	cpups	cspq	cpupq	dbgb1	dbgb2	rss	maxop	p50	p99	tag
24580	0	0	0.0	72.0	19.7	0.000	0.000	0.003	0.820	11760	23.2	0.478	76	5.1	45.2	1.6	0.020	32514	8344	20m.pg152_o3_native_lto.cx9a2_bee
26046	0	0	0.0	76.3	20.8	0.000	0.000	0.003	0.819	12480	23.9	0.479	73	5.1	45.1	5.0	0.047	32579	5645	20m.pg153_o3_native_lto.cx9a2_bee
25988	0	0	0.0	76.7	20.8	0.000	0.000	0.003	0.819	12446	23.9	0.479	74	5.1	45.1	4.8	0.025	32664	5499	20m.pg154_o3_native_lto.cx9a2_bee
26110	0	0	0.0	76.9	20.9	0.000	0.000	0.003	0.821	12485	24.1	0.478	74	5.1	45.2	5.0	0.033	32563	7791	20m.pg16beta1_o3_native_lto.cx9a2_bee
24420	0	0	0.0	71.8	19.5	0.000	0.000	0.003	0.819	11741	23.3	0.481	76	5.1	45.2	3.5	0.027	32164	8292	20m.pg16beta2_o3_native_lto.cx9a2_bee
24319	0	0	0.0	71.1	19.5	0.000	0.000	0.003	0.819	11628	23.2	0.478	76	5.1	45.2	4.0	0.024	32165	8241	20m.pg16beta3_o3_native_lto.cx9a2_bee
24229	0	0	0.0	71.7	19.6	0.000	0.000	0.003	0.829	11577	23.1	0.478	76	5.1	45.2	5.2	0.058	32470	4695	20m.pg16rc1_o3_native_lto.cx9a2_bee
25878	0	0	0.0	75.4	20.7	0.000	0.000	0.003	0.820	12367	24.1	0.478	75	5.1	45.2	5.2	0.026	32265	7392	20m.pg160_o3_native_lto.cx9a2_bee
q100.1
q100.1: range queries with 100 insert/s per client
Performance metrics for all DBMS, not just the ones listed above. Some are normalized by throughput, others are not. Legend for results is here.
ips	qps	rps	rmbps	wps	wmbps	rpq	rkbpq	wpi	wkbpi	csps	cpups	cspq	cpupq	dbgb1	dbgb2	rss	maxop	p50	p99	tag
100	9133	0	0.0	49.4	2.2	0.000	0.000	0.495	23.009	35152	12.9	3.849	113	5.1	43.5	3.4	0.004	8646	8464	20m.pg152_o3_native_lto.cx9a2_bee
100	8508	0	0.0	48.6	2.2	0.000	0.000	0.488	22.895	32770	13.1	3.852	123	5.1	43.4	3.4	0.004	8359	8224	20m.pg153_o3_native_lto.cx9a2_bee
100	9028	0	0.0	47.8	2.2	0.000	0.000	0.480	22.752	34767	13.1	3.851	116	5.1	43.4	1.1	0.004	8711	8527	20m.pg154_o3_native_lto.cx9a2_bee
100	9448	0	0.0	48.8	2.2	0.000	0.000	0.489	22.926	36352	12.8	3.847	108	5.1	43.6	3.5	0.003	8819	8484	20m.pg16beta1_o3_native_lto.cx9a2_bee
100	8763	0	0.0	49.2	2.2	0.000	0.000	0.493	23.076	33723	13.2	3.848	121	5.1	43.5	3.5	0.005	8582	8404	20m.pg16beta2_o3_native_lto.cx9a2_bee
100	9300	0	0.0	49.7	2.3	0.000	0.000	0.498	23.134	35766	12.8	3.846	110	5.1	43.5	3.4	0.003	8763	8342	20m.pg16beta3_o3_native_lto.cx9a2_bee
100	9293	0	0.0	50.8	2.0	0.000	0.000	0.509	21.055	35770	12.9	3.849	111	5.1	42.3	1.4	0.004	8733	8474	20m.pg16rc1_o3_native_lto.cx9a2_bee
100	8888	0	0.0	49.2	2.2	0.000	0.000	0.493	22.999	34209	13.0	3.849	117	5.2	43.5	3.4	0.005	8502	8357	20m.pg160_o3_native_lto.cx9a2_bee
q500.1
q500.1: range queries with 500 insert/s per client
Performance metrics for all DBMS, not just the ones listed above. Some are normalized by throughput, others are not. Legend for results is here.
ips	qps	rps	rmbps	wps	wmbps	rpq	rkbpq	wpi	wkbpi	csps	cpups	cspq	cpupq	dbgb1	dbgb2	rss	maxop	p50	p99	tag
499	9084	0	0.0	33.4	3.0	0.000	0.000	0.067	6.113	35074	13.1	3.861	115	5.2	36.0	5.1	0.009	8621	8433	20m.pg152_o3_native_lto.cx9a2_bee
499	8997	0	0.0	33.4	3.0	0.000	0.000	0.067	6.112	34755	13.0	3.863	116	5.1	35.9	5.0	0.022	8421	8254	20m.pg153_o3_native_lto.cx9a2_bee
499	9293	0	0.0	28.6	3.0	0.000	0.000	0.057	6.191	35892	13.2	3.862	114	5.1	35.8	3.8	0.015	8710	8492	20m.pg154_o3_native_lto.cx9a2_bee
499	9002	0	0.0	33.3	3.0	0.000	0.000	0.067	6.147	34745	13.3	3.860	118	5.1	36.0	5.0	0.042	8581	8419	20m.pg16beta1_o3_native_lto.cx9a2_bee
499	9284	0	0.0	28.8	3.0	0.000	0.000	0.058	6.221	35815	13.1	3.858	113	5.1	35.9	1.9	0.017	8711	8454	20m.pg16beta2_o3_native_lto.cx9a2_bee
499	8786	0	0.0	33.8	3.0	0.000	0.000	0.068	6.101	33922	13.3	3.861	121	5.1	36.0	4.9	0.017	8488	8335	20m.pg16beta3_o3_native_lto.cx9a2_bee
499	8978	0	0.0	37.1	2.9	0.000	0.000	0.074	6.019	34675	13.2	3.862	118	5.1	34.3	5.1	0.009	8535	8348	20m.pg16rc1_o3_native_lto.cx9a2_bee
499	9152	0	0.0	33.1	3.0	0.000	0.000	0.066	6.130	35313	13.1	3.859	115	5.2	36.0	1.2	0.016	8519	8322	20m.pg160_o3_native_lto.cx9a2_bee
q1000.1
q1000.1: range queries with 1000 insert/s per client
Performance metrics for all DBMS, not just the ones listed above. Some are normalized by throughput, others are not. Legend for results is here.
ips	qps	rps	rmbps	wps	wmbps	rpq	rkbpq	wpi	wkbpi	csps	cpups	cspq	cpupq	dbgb1	dbgb2	rss	maxop	p50	p99	tag
998	9133	0	0.0	28.1	3.3	0.000	0.000	0.028	3.386	35490	13.7	3.886	120	5.1	26.2	5.2	0.019	8629	8438	20m.pg152_o3_native_lto.cx9a2_bee
997	8912	0	0.0	28.3	3.3	0.000	0.000	0.028	3.381	34657	13.5	3.889	121	5.1	26.0	5.1	0.015	8373	8198	20m.pg153_o3_native_lto.cx9a2_bee
998	9203	0	0.0	26.7	3.3	0.000	0.000	0.027	3.388	35760	13.8	3.886	120	5.1	25.9	2.6	0.016	8665	8471	20m.pg154_o3_native_lto.cx9a2_bee
998	9266	0	0.0	28.5	3.3	0.000	0.000	0.029	3.382	35985	13.7	3.883	118	5.2	26.1	2.8	0.004	8629	8400	20m.pg16beta1_o3_native_lto.cx9a2_bee
998	9485	0	0.0	28.0	3.3	0.000	0.000	0.028	3.398	36803	13.5	3.880	114	5.1	26.0	3.7	0.015	8873	8542	20m.pg16beta2_o3_native_lto.cx9a2_bee
999	9045	0	0.0	28.5	3.3	0.000	0.000	0.028	3.380	35120	13.7	3.883	121	5.1	26.1	2.1	0.015	8456	8254	20m.pg16beta3_o3_native_lto.cx9a2_bee
998	9268	0	0.0	29.0	3.3	0.000	0.000	0.029	3.428	35978	13.6	3.882	117	5.1	25.2	5.2	0.019	8708	8497	20m.pg16rc1_o3_native_lto.cx9a2_bee
998	9071	0	0.0	28.1	3.3	0.000	0.000	0.028	3.384	35227	13.6	3.884	120	5.2	26.1	3.8	0.013	8500	8302	20m.pg160_o3_native_lto.cx9a2_bee
l.i0
- l.i0: load without secondary indexes
- Legend for results is here.
- Each entry lists the percentage of responses that fit in that bucket (slower than max time for previous bucket, faster than min time for next bucket).
Insert response time histogram
256us	1ms	4ms	16ms	64ms	256ms	1s	4s	16s	gt	max	tag
0.000	0.024	99.977	0.000	0.000	0.000	0.000	0.000	0.000	0.000	0.003	pg152_o3_native_lto.cx9a2_bee
0.000	0.018	99.982	0.000	0.000	0.000	0.000	0.000	0.000	0.000	0.003	pg153_o3_native_lto.cx9a2_bee
0.000	0.076	99.924	0.000	0.000	0.000	0.000	0.000	0.000	0.000	0.003	pg154_o3_native_lto.cx9a2_bee
0.000	0.012	99.988	0.000	0.000	0.000	0.000	0.000	0.000	0.000	0.003	pg16beta1_o3_native_lto.cx9a2_bee
0.000	0.000	100.000	0.000	0.000	0.000	0.000	0.000	0.000	0.000	0.003	pg16beta2_o3_native_lto.cx9a2_bee
0.000	0.000	100.000	0.000	0.000	0.000	0.000	0.000	0.000	0.000	0.003	pg16beta3_o3_native_lto.cx9a2_bee
0.000	0.025	99.975	0.000	0.000	0.000	0.000	0.000	0.000	0.000	0.003	pg16rc1_o3_native_lto.cx9a2_bee
0.000	0.015	99.984	0.000	0.000	0.000	0.000	0.000	0.000	0.000	0.003	pg160_o3_native_lto.cx9a2_bee
l.x
- l.x: create secondary indexes
- Legend for results is here.
- Each entry lists the percentage of responses that fit in that bucket (slower than max time for previous bucket, faster than min time for next bucket).
TODO - determine whether there is data for create index response time
l.i1
- l.i1: continue load after secondary indexes created
- Legend for results is here.
- Each entry lists the percentage of responses that fit in that bucket (slower than max time for previous bucket, faster than min time for next bucket).
Insert response time histogram
256us	1ms	4ms	16ms	64ms	256ms	1s	4s	16s	gt	max	tag
0.000	0.000	99.999	0.001	nonzero	0.000	0.000	0.000	0.000	0.000	0.020	pg152_o3_native_lto.cx9a2_bee
0.000	0.000	99.999	0.001	nonzero	0.000	0.000	0.000	0.000	0.000	0.047	pg153_o3_native_lto.cx9a2_bee
0.000	0.000	99.999	0.001	nonzero	0.000	0.000	0.000	0.000	0.000	0.025	pg154_o3_native_lto.cx9a2_bee
0.000	0.000	99.999	0.001	nonzero	0.000	0.000	0.000	0.000	0.000	0.033	pg16beta1_o3_native_lto.cx9a2_bee
0.000	0.000	99.999	0.001	nonzero	0.000	0.000	0.000	0.000	0.000	0.027	pg16beta2_o3_native_lto.cx9a2_bee
0.000	0.000	99.999	0.001	nonzero	0.000	0.000	0.000	0.000	0.000	0.024	pg16beta3_o3_native_lto.cx9a2_bee
0.000	0.000	99.998	0.001	0.001	0.000	0.000	0.000	0.000	0.000	0.058	pg16rc1_o3_native_lto.cx9a2_bee
0.000	0.000	99.999	0.001	nonzero	0.000	0.000	0.000	0.000	0.000	0.026	pg160_o3_native_lto.cx9a2_bee
Delete response time histogram
256us	1ms	4ms	16ms	64ms	256ms	1s	4s	16s	gt	max	tag
0.684	83.822	2.164	13.330	nonzero	0.000	0.000	0.000	0.000	0.000	0.019	pg152_o3_native_lto.cx9a2_bee
0.708	83.262	9.716	6.314	nonzero	0.000	0.000	0.000	0.000	0.000	0.045	pg153_o3_native_lto.cx9a2_bee
0.653	83.530	9.675	6.141	nonzero	0.000	0.000	0.000	0.000	0.000	0.022	pg154_o3_native_lto.cx9a2_bee
0.682	83.273	9.041	7.005	nonzero	0.000	0.000	0.000	0.000	0.000	0.026	pg16beta1_o3_native_lto.cx9a2_bee
0.680	83.785	2.262	13.273	nonzero	0.000	0.000	0.000	0.000	0.000	0.027	pg16beta2_o3_native_lto.cx9a2_bee
0.564	83.771	2.094	13.571	nonzero	0.000	0.000	0.000	0.000	0.000	0.018	pg16beta3_o3_native_lto.cx9a2_bee
0.657	83.663	3.465	12.214	nonzero	0.000	0.000	0.000	0.000	0.000	0.057	pg16rc1_o3_native_lto.cx9a2_bee
0.549	83.549	9.104	6.798	nonzero	0.000	0.000	0.000	0.000	0.000	0.022	pg160_o3_native_lto.cx9a2_bee
q100.1
- q100.1: range queries with 100 insert/s per client
- Legend for results is here.
- Each entry lists the percentage of responses that fit in that bucket (slower than max time for previous bucket, faster than min time for next bucket).
Query response time histogram
256us	1ms	4ms	16ms	64ms	256ms	1s	4s	16s	gt	max	tag
99.968	0.032	nonzero	nonzero	0.000	0.000	0.000	0.000	0.000	0.000	0.004	pg152_o3_native_lto.cx9a2_bee
99.952	0.048	nonzero	nonzero	0.000	0.000	0.000	0.000	0.000	0.000	0.004	pg153_o3_native_lto.cx9a2_bee
99.951	0.049	nonzero	nonzero	0.000	0.000	0.000	0.000	0.000	0.000	0.004	pg154_o3_native_lto.cx9a2_bee
99.966	0.034	nonzero	0.000	0.000	0.000	0.000	0.000	0.000	0.000	0.003	pg16beta1_o3_native_lto.cx9a2_bee
99.964	0.036	nonzero	nonzero	0.000	0.000	0.000	0.000	0.000	0.000	0.005	pg16beta2_o3_native_lto.cx9a2_bee
99.966	0.034	nonzero	0.000	0.000	0.000	0.000	0.000	0.000	0.000	0.003	pg16beta3_o3_native_lto.cx9a2_bee
99.956	0.044	nonzero	nonzero	0.000	0.000	0.000	0.000	0.000	0.000	0.004	pg16rc1_o3_native_lto.cx9a2_bee
99.966	0.033	nonzero	nonzero	0.000	0.000	0.000	0.000	0.000	0.000	0.005	pg160_o3_native_lto.cx9a2_bee
Insert response time histogram
256us	1ms	4ms	16ms	64ms	256ms	1s	4s	16s	gt	max	tag
0.000	0.000	99.965	0.035	0.000	0.000	0.000	0.000	0.000	0.000	0.006	pg152_o3_native_lto.cx9a2_bee
0.000	0.000	99.972	0.028	0.000	0.000	0.000	0.000	0.000	0.000	0.006	pg153_o3_native_lto.cx9a2_bee
0.000	0.000	99.979	0.021	0.000	0.000	0.000	0.000	0.000	0.000	0.007	pg154_o3_native_lto.cx9a2_bee
0.000	0.000	99.986	0.014	0.000	0.000	0.000	0.000	0.000	0.000	0.006	pg16beta1_o3_native_lto.cx9a2_bee
0.000	0.000	99.986	0.014	0.000	0.000	0.000	0.000	0.000	0.000	0.007	pg16beta2_o3_native_lto.cx9a2_bee
0.000	0.000	99.979	0.021	0.000	0.000	0.000	0.000	0.000	0.000	0.006	pg16beta3_o3_native_lto.cx9a2_bee
0.000	0.000	99.979	0.021	0.000	0.000	0.000	0.000	0.000	0.000	0.007	pg16rc1_o3_native_lto.cx9a2_bee
0.000	0.000	99.965	0.035	0.000	0.000	0.000	0.000	0.000	0.000	0.005	pg160_o3_native_lto.cx9a2_bee
Delete response time histogram
256us	1ms	4ms	16ms	64ms	256ms	1s	4s	16s	gt	max	tag
1.076	71.715	9.458	17.750	0.000	0.000	0.000	0.000	0.000	0.000	0.006	pg152_o3_native_lto.cx9a2_bee
1.812	68.500	14.278	15.410	0.000	0.000	0.000	0.000	0.000	0.000	0.007	pg153_o3_native_lto.cx9a2_bee
3.757	96.229	0.014	0.000	0.000	0.000	0.000	0.000	0.000	0.000	0.002	pg154_o3_native_lto.cx9a2_bee
0.910	98.472	0.618	0.000	0.000	0.000	0.000	0.000	0.000	0.000	0.003	pg16beta1_o3_native_lto.cx9a2_bee
1.868	69.792	7.812	20.528	0.000	0.000	0.000	0.000	0.000	0.000	0.008	pg16beta2_o3_native_lto.cx9a2_bee
1.833	72.028	0.021	26.118	0.000	0.000	0.000	0.000	0.000	0.000	0.010	pg16beta3_o3_native_lto.cx9a2_bee
1.361	69.417	3.681	25.542	0.000	0.000	0.000	0.000	0.000	0.000	0.008	pg16rc1_o3_native_lto.cx9a2_bee
1.264	68.562	2.743	27.431	0.000	0.000	0.000	0.000	0.000	0.000	0.007	pg160_o3_native_lto.cx9a2_bee
q500.1
- q500.1: range queries with 500 insert/s per client
- Legend for results is here.
- Each entry lists the percentage of responses that fit in that bucket (slower than max time for previous bucket, faster than min time for next bucket).
Query response time histogram
256us	1ms	4ms	16ms	64ms	256ms	1s	4s	16s	gt	max	tag
99.964	0.036	nonzero	nonzero	0.000	0.000	0.000	0.000	0.000	0.000	0.009	pg152_o3_native_lto.cx9a2_bee
99.965	0.035	nonzero	nonzero	nonzero	0.000	0.000	0.000	0.000	0.000	0.022	pg153_o3_native_lto.cx9a2_bee
99.969	0.030	nonzero	nonzero	0.000	0.000	0.000	0.000	0.000	0.000	0.015	pg154_o3_native_lto.cx9a2_bee
99.968	0.032	nonzero	nonzero	nonzero	0.000	0.000	0.000	0.000	0.000	0.042	pg16beta1_o3_native_lto.cx9a2_bee
99.968	0.032	nonzero	nonzero	nonzero	0.000	0.000	0.000	0.000	0.000	0.017	pg16beta2_o3_native_lto.cx9a2_bee
99.961	0.039	nonzero	nonzero	nonzero	0.000	0.000	0.000	0.000	0.000	0.017	pg16beta3_o3_native_lto.cx9a2_bee
99.966	0.034	nonzero	nonzero	0.000	0.000	0.000	0.000	0.000	0.000	0.009	pg16rc1_o3_native_lto.cx9a2_bee
99.969	0.031	nonzero	nonzero	nonzero	0.000	0.000	0.000	0.000	0.000	0.016	pg160_o3_native_lto.cx9a2_bee
Insert response time histogram
256us	1ms	4ms	16ms	64ms	256ms	1s	4s	16s	gt	max	tag
0.000	0.000	99.981	0.019	0.000	0.000	0.000	0.000	0.000	0.000	0.014	pg152_o3_native_lto.cx9a2_bee
0.000	0.000	99.981	0.018	0.001	0.000	0.000	0.000	0.000	0.000	0.021	pg153_o3_native_lto.cx9a2_bee
0.000	0.000	99.978	0.021	0.001	0.000	0.000	0.000	0.000	0.000	0.019	pg154_o3_native_lto.cx9a2_bee
0.000	0.000	99.985	0.014	0.001	0.000	0.000	0.000	0.000	0.000	0.030	pg16beta1_o3_native_lto.cx9a2_bee
0.000	0.000	99.971	0.017	0.013	0.000	0.000	0.000	0.000	0.000	0.028	pg16beta2_o3_native_lto.cx9a2_bee
0.000	0.000	99.985	0.013	0.003	0.000	0.000	0.000	0.000	0.000	0.022	pg16beta3_o3_native_lto.cx9a2_bee
0.000	0.000	99.981	0.015	0.004	0.000	0.000	0.000	0.000	0.000	0.022	pg16rc1_o3_native_lto.cx9a2_bee
0.000	0.000	99.982	0.014	0.004	0.000	0.000	0.000	0.000	0.000	0.020	pg160_o3_native_lto.cx9a2_bee
Delete response time histogram
256us	1ms	4ms	16ms	64ms	256ms	1s	4s	16s	gt	max	tag
9.432	69.475	18.083	3.010	0.000	0.000	0.000	0.000	0.000	0.000	0.012	pg152_o3_native_lto.cx9a2_bee
9.850	67.938	19.010	3.201	0.001	0.000	0.000	0.000	0.000	0.000	0.019	pg153_o3_native_lto.cx9a2_bee
10.629	68.782	0.606	19.981	0.003	0.000	0.000	0.000	0.000	0.000	0.018	pg154_o3_native_lto.cx9a2_bee
10.990	67.485	0.142	21.382	0.001	0.000	0.000	0.000	0.000	0.000	0.020	pg16beta1_o3_native_lto.cx9a2_bee
10.269	68.285	16.294	5.143	0.008	0.000	0.000	0.000	0.000	0.000	0.025	pg16beta2_o3_native_lto.cx9a2_bee
9.701	71.643	0.112	18.540	0.003	0.000	0.000	0.000	0.000	0.000	0.019	pg16beta3_o3_native_lto.cx9a2_bee
8.458	67.619	13.168	10.751	0.003	0.000	0.000	0.000	0.000	0.000	0.020	pg16rc1_o3_native_lto.cx9a2_bee
8.721	71.218	10.926	9.131	0.004	0.000	0.000	0.000	0.000	0.000	0.018	pg160_o3_native_lto.cx9a2_bee
q1000.1
- q1000.1: range queries with 1000 insert/s per client
- Legend for results is here.
- Each entry lists the percentage of responses that fit in that bucket (slower than max time for previous bucket, faster than min time for next bucket).
Query response time histogram
256us	1ms	4ms	16ms	64ms	256ms	1s	4s	16s	gt	max	tag
99.964	0.036	nonzero	nonzero	nonzero	0.000	0.000	0.000	0.000	0.000	0.019	pg152_o3_native_lto.cx9a2_bee
99.960	0.040	nonzero	nonzero	0.000	0.000	0.000	0.000	0.000	0.000	0.015	pg153_o3_native_lto.cx9a2_bee
99.967	0.033	nonzero	nonzero	0.000	0.000	0.000	0.000	0.000	0.000	0.016	pg154_o3_native_lto.cx9a2_bee
99.969	0.031	nonzero	nonzero	0.000	0.000	0.000	0.000	0.000	0.000	0.004	pg16beta1_o3_native_lto.cx9a2_bee
99.968	0.032	nonzero	nonzero	0.000	0.000	0.000	0.000	0.000	0.000	0.015	pg16beta2_o3_native_lto.cx9a2_bee
99.959	0.041	nonzero	nonzero	0.000	0.000	0.000	0.000	0.000	0.000	0.015	pg16beta3_o3_native_lto.cx9a2_bee
99.965	0.035	nonzero	nonzero	nonzero	0.000	0.000	0.000	0.000	0.000	0.019	pg16rc1_o3_native_lto.cx9a2_bee
99.961	0.039	nonzero	nonzero	0.000	0.000	0.000	0.000	0.000	0.000	0.013	pg160_o3_native_lto.cx9a2_bee
Insert response time histogram
256us	1ms	4ms	16ms	64ms	256ms	1s	4s	16s	gt	max	tag
0.000	0.000	99.990	0.008	0.003	0.000	0.000	0.000	0.000	0.000	0.022	pg152_o3_native_lto.cx9a2_bee
0.000	0.000	99.988	0.009	0.003	0.000	0.000	0.000	0.000	0.000	0.021	pg153_o3_native_lto.cx9a2_bee
0.000	0.000	99.993	0.006	0.001	0.000	0.000	0.000	0.000	0.000	0.024	pg154_o3_native_lto.cx9a2_bee
0.000	0.000	99.994	0.006	0.000	0.000	0.000	0.000	0.000	0.000	0.007	pg16beta1_o3_native_lto.cx9a2_bee
0.000	0.000	99.992	0.006	0.001	0.000	0.000	0.000	0.000	0.000	0.026	pg16beta2_o3_native_lto.cx9a2_bee
0.000	0.000	99.992	0.006	0.003	0.000	0.000	0.000	0.000	0.000	0.023	pg16beta3_o3_native_lto.cx9a2_bee
0.000	0.000	99.985	0.010	0.005	0.000	0.000	0.000	0.000	0.000	0.039	pg16rc1_o3_native_lto.cx9a2_bee
0.000	0.000	99.989	0.007	0.004	0.000	0.000	0.000	0.000	0.000	0.033	pg160_o3_native_lto.cx9a2_bee
Delete response time histogram
256us	1ms	4ms	16ms	64ms	256ms	1s	4s	16s	gt	max	tag
7.006	76.922	16.058	0.012	0.003	0.000	0.000	0.000	0.000	0.000	0.020	pg152_o3_native_lto.cx9a2_bee
6.781	78.112	15.100	0.004	0.002	0.000	0.000	0.000	0.000	0.000	0.019	pg153_o3_native_lto.cx9a2_bee
6.484	72.092	0.108	21.315	0.001	0.000	0.000	0.000	0.000	0.000	0.022	pg154_o3_native_lto.cx9a2_bee
6.876	72.090	0.197	20.838	0.000	0.000	0.000	0.000	0.000	0.000	0.011	pg16beta1_o3_native_lto.cx9a2_bee
6.565	76.153	17.267	0.013	0.001	0.000	0.000	0.000	0.000	0.000	0.024	pg16beta2_o3_native_lto.cx9a2_bee
5.951	72.958	11.291	9.797	0.003	0.000	0.000	0.000	0.000	0.000	0.021	pg16beta3_o3_native_lto.cx9a2_bee
6.492	76.654	16.704	0.146	0.003	0.000	0.000	0.000	0.000	0.000	0.025	pg16rc1_o3_native_lto.cx9a2_bee
5.599	75.490	18.206	0.702	0.003	0.000	0.000	0.000	0.000	0.000	0.022	pg160_o3_native_lto.cx9a2_bee