Introduction
This is a report for the insert benchmark with 800M docs and 1 client(s). It is generated by scripts (bash, awk, sed) and Tufte might not be impressed. An overview of the insert benchmark is here and a short update is here. Below, by DBMS, I mean DBMS+version.config. An example is my8020.c10b40 where my means MySQL, 8020 is version 8.0.20 and c10b40 is the name for the configuration file.
The test server has 8 AMD cores, 16G RAM and an NVMe SSD. It is described here as the Beelink. The benchmark was run with 1 client and there were 1 or 3 connections per client (1 for queries or inserts without rate limits, 1+1 for rate limited inserts+deletes). It uses 1 table. It loads 20M rows per table without secondary indexes, creates secondary indexes, then inserts 200M rows per table with a delete per insert to avoid growing the table. It then does 3 read+write tests for 7200s each that do queries as fast as possible with 100, 500 and then 1000 inserts/second/client concurrent with the queries and 1000 deletes/second to avoid growing the table. The database is cached by Postgres. Clients and the DBMS share one server. The per-database configs are in the per-database subdirectories here.
The tested DBMS are:
- pg153_o2_nofp.cx9a1_bee - Postgres 15.3, o2_nofp build that used -O2 -no-omit-frame-pointer, a1 config
- pg154_o2_nofp.cx9a1_bee - Postgres 15.4, o2_nofp build that used -O2 -no-omit-frame-pointer, a1 config
- pg16beta1_o2_nofp.cx9a1_bee - Postgres 16 beta1, o2_nofp build that used -O2 -no-omit-frame-pointer, a1 config
- pg16beta2_o2_nofp.cx9a1_bee - Postgres 16 beta2, o2_nofp build that used -O2 -no-omit-frame-pointer, a1 config
- pg16beta3_o2_nofp.cx9a1_bee - Postgres 16 beta3, o2_nofp build that used -O2 -no-omit-frame-pointer, a1 config
Contents
- Summary
- l.i0: load without secondary indexes
- l.x: create secondary indexes
- l.i1: continue load after secondary indexes created
- q100.1: range queries with 100 insert/s per client
- q500.1: range queries with 500 insert/s per client
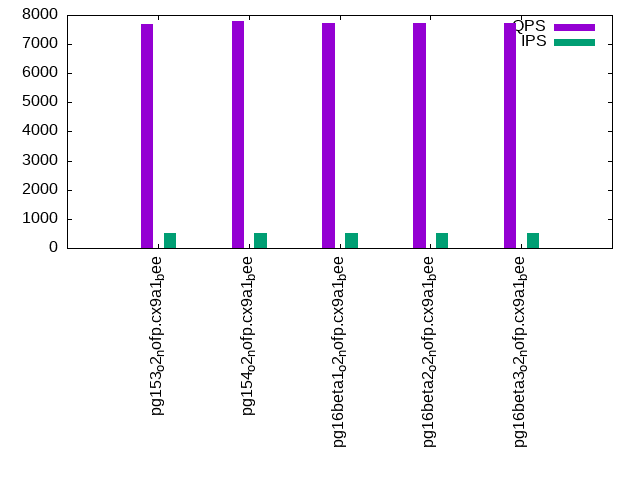
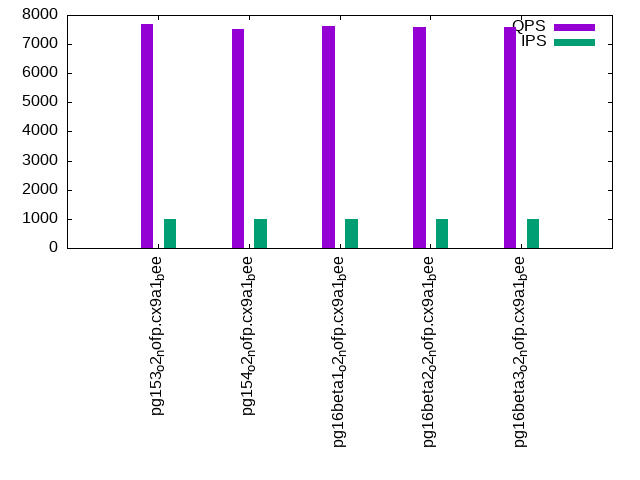
- q1000.1: range queries with 1000 insert/s per client
Summary
The numbers are inserts/s for l.i0 and l.i1, indexed docs (or rows) /s for l.x and queries/s for q*.2. The values are the average rate over the entire test for inserts (IPS) and queries (QPS). The range of values for IPS and QPS is split into 3 parts: bottom 25%, middle 50%, top 25%. Values in the bottom 25% have a red background, values in the top 25% have a green background and values in the middle have no color. A gray background is used for values that can be ignored because the DBMS did not sustain the target insert rate. Red backgrounds are not used when the minimum value is within 80% of the max value.
| dbms | l.i0 | l.x | l.i1 | q100.1 | q500.1 | q1000.1 |
|---|---|---|---|---|---|---|
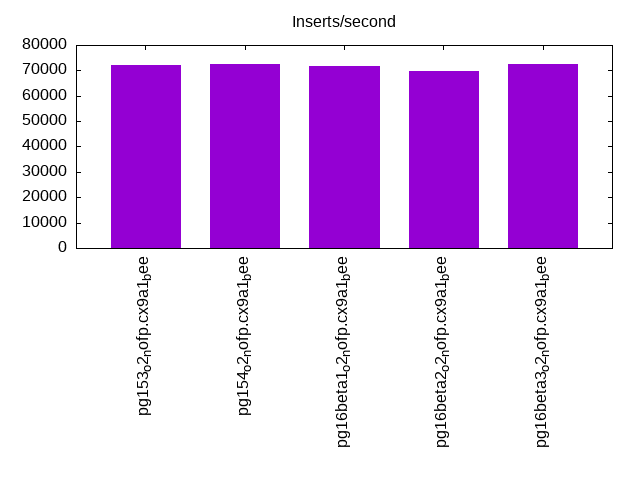
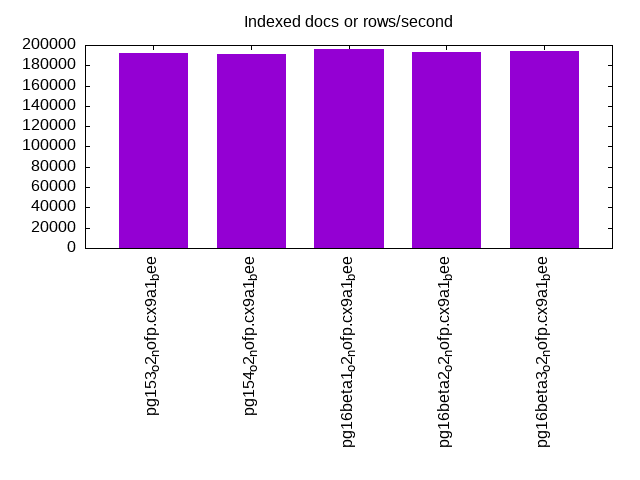
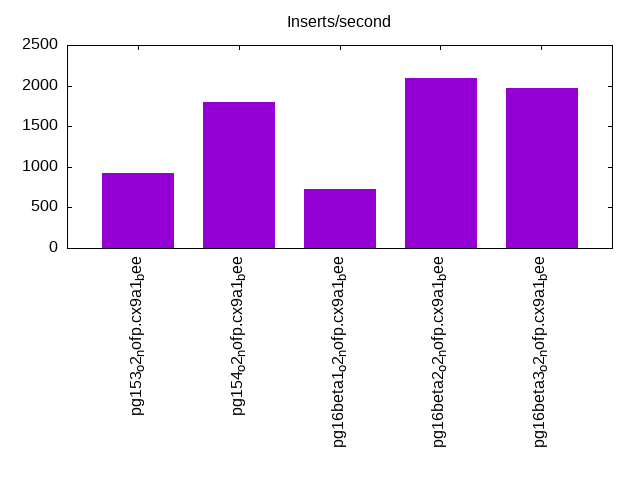
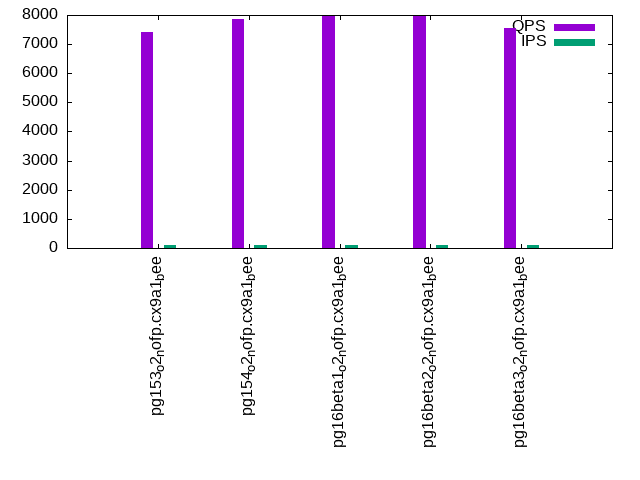
| pg153_o2_nofp.cx9a1_bee | 72014 | 191641 | 918 | 7428 | 7699 | 7693 |
| pg154_o2_nofp.cx9a1_bee | 72543 | 191549 | 1796 | 7878 | 7790 | 7535 |
| pg16beta1_o2_nofp.cx9a1_bee | 71820 | 196247 | 721 | 7960 | 7712 | 7626 |
| pg16beta2_o2_nofp.cx9a1_bee | 69784 | 193308 | 2094 | 7994 | 7728 | 7572 |
| pg16beta3_o2_nofp.cx9a1_bee | 72424 | 194577 | 1966 | 7553 | 7740 | 7586 |
This table has relative throughput, throughput for the DBMS relative to the DBMS in the first line, using the absolute throughput from the previous table. Values less than 0.95 have a yellow background. Values greater than 1.05 have a blue background.
| dbms | l.i0 | l.x | l.i1 | q100.1 | q500.1 | q1000.1 |
|---|---|---|---|---|---|---|
| pg153_o2_nofp.cx9a1_bee | 1.00 | 1.00 | 1.00 | 1.00 | 1.00 | 1.00 |
| pg154_o2_nofp.cx9a1_bee | 1.01 | 1.00 | 1.96 | 1.06 | 1.01 | 0.98 |
| pg16beta1_o2_nofp.cx9a1_bee | 1.00 | 1.02 | 0.79 | 1.07 | 1.00 | 0.99 |
| pg16beta2_o2_nofp.cx9a1_bee | 0.97 | 1.01 | 2.28 | 1.08 | 1.00 | 0.98 |
| pg16beta3_o2_nofp.cx9a1_bee | 1.01 | 1.02 | 2.14 | 1.02 | 1.01 | 0.99 |
This lists the average rate of inserts/s for the tests that do inserts concurrent with queries. For such tests the query rate is listed in the table above. The read+write tests are setup so that the insert rate should match the target rate every second. Cells that are not at least 95% of the target have a red background to indicate a failure to satisfy the target.
| dbms | q100.1 | q500.1 | q1000.1 |
|---|---|---|---|
| pg153_o2_nofp.cx9a1_bee | 100 | 499 | 998 |
| pg154_o2_nofp.cx9a1_bee | 100 | 499 | 998 |
| pg16beta1_o2_nofp.cx9a1_bee | 100 | 498 | 997 |
| pg16beta2_o2_nofp.cx9a1_bee | 100 | 499 | 998 |
| pg16beta3_o2_nofp.cx9a1_bee | 100 | 499 | 994 |
| target | 100 | 500 | 1000 |
l.i0
l.i0: load without secondary indexes. Graphs for performance per 1-second interval are here.
Average throughput:
Insert response time histogram: each cell has the percentage of responses that take <= the time in the header and max is the max response time in seconds. For the max column values in the top 25% of the range have a red background and in the bottom 25% of the range have a green background. The red background is not used when the min value is within 80% of the max value.
| dbms | 256us | 1ms | 4ms | 16ms | 64ms | 256ms | 1s | 4s | 16s | gt | max |
|---|---|---|---|---|---|---|---|---|---|---|---|
| pg153_o2_nofp.cx9a1_bee | 99.999 | nonzero | nonzero | 0.031 | |||||||
| pg154_o2_nofp.cx9a1_bee | 99.999 | 0.001 | nonzero | 0.057 | |||||||
| pg16beta1_o2_nofp.cx9a1_bee | 99.999 | nonzero | nonzero | 0.057 | |||||||
| pg16beta2_o2_nofp.cx9a1_bee | 99.999 | nonzero | nonzero | 0.058 | |||||||
| pg16beta3_o2_nofp.cx9a1_bee | 99.999 | nonzero | nonzero | 0.057 |
Performance metrics for the DBMS listed above. Some are normalized by throughput, others are not. Legend for results is here.
ips	qps	rps	rmbps	wps	wmbps	rpq	rkbpq	wpi	wkbpi	csps	cpups	cspq	cpupq	dbgb1	dbgb2	rss	maxop	p50	p99	tag
72014	0	30	0.2	106.0	29.4	0.000	0.003	0.001	0.418	8807	22.3	0.122	25	76.5	116.6	0.4	0.031	72217	70098	800m.pg153_o2_nofp.cx9a1_bee
72543	0	30	0.2	103.2	29.6	0.000	0.003	0.001	0.418	8843	22.3	0.122	25	76.5	116.6	3.2	0.057	72719	70720	800m.pg154_o2_nofp.cx9a1_bee
71820	0	30	0.2	99.7	29.4	0.000	0.003	0.001	0.419	8774	22.3	0.122	25	76.5	116.6	1.4	0.057	72118	69816	800m.pg16beta1_o2_nofp.cx9a1_bee
69784	0	30	0.2	99.3	28.4	0.000	0.003	0.001	0.417	8530	23.0	0.122	26	76.5	116.2	2.1	0.058	70023	67962	800m.pg16beta2_o2_nofp.cx9a1_bee
72424	0	31	0.2	104.2	29.7	0.000	0.003	0.001	0.419	8832	22.3	0.122	25	76.5	116.6	2.1	0.057	72624	70483	800m.pg16beta3_o2_nofp.cx9a1_bee
l.x
l.x: create secondary indexes.
Average throughput:
Performance metrics for the DBMS listed above. Some are normalized by throughput, others are not. Legend for results is here.
ips	qps	rps	rmbps	wps	wmbps	rpq	rkbpq	wpi	wkbpi	csps	cpups	cspq	cpupq	dbgb1	dbgb2	rss	maxop	p50	p99	tag
191641	0	557	69.1	161.6	58.9	0.003	0.369	0.001	0.315	410	12.5	0.002	5	147.0	187.1	10.2	0.004	NA	NA	800m.pg153_o2_nofp.cx9a1_bee
191549	0	557	69.1	160.6	59.2	0.003	0.369	0.001	0.316	400	12.5	0.002	5	147.0	187.1	10.2	0.004	NA	NA	800m.pg154_o2_nofp.cx9a1_bee
196247	0	571	70.8	164.3	60.4	0.003	0.370	0.001	0.315	402	12.5	0.002	5	147.0	187.1	10.2	0.005	NA	NA	800m.pg16beta1_o2_nofp.cx9a1_bee
193308	0	561	69.7	162.5	59.8	0.003	0.369	0.001	0.317	411	12.5	0.002	5	147.0	187.1	10.2	0.004	NA	NA	800m.pg16beta2_o2_nofp.cx9a1_bee
194577	0	566	70.2	161.1	60.1	0.003	0.370	0.001	0.316	392	12.5	0.002	5	147.0	187.1	10.2	0.006	NA	NA	800m.pg16beta3_o2_nofp.cx9a1_bee
l.i1
l.i1: continue load after secondary indexes created. Graphs for performance per 1-second interval are here.
Average throughput:
Insert response time histogram: each cell has the percentage of responses that take <= the time in the header and max is the max response time in seconds. For the max column values in the top 25% of the range have a red background and in the bottom 25% of the range have a green background. The red background is not used when the min value is within 80% of the max value.
| dbms | 256us | 1ms | 4ms | 16ms | 64ms | 256ms | 1s | 4s | 16s | gt | max |
|---|---|---|---|---|---|---|---|---|---|---|---|
| pg153_o2_nofp.cx9a1_bee | 83.148 | 16.850 | 0.002 | 0.085 | |||||||
| pg154_o2_nofp.cx9a1_bee | 76.694 | 23.260 | 0.045 | 0.188 | |||||||
| pg16beta1_o2_nofp.cx9a1_bee | 78.473 | 21.526 | 0.001 | 0.069 | |||||||
| pg16beta2_o2_nofp.cx9a1_bee | 81.408 | 18.591 | 0.001 | 0.090 | |||||||
| pg16beta3_o2_nofp.cx9a1_bee | 85.672 | 14.327 | 0.002 | 0.096 |
Delete response time histogram: each cell has the percentage of responses that take <= the time in the header and max is the max response time in seconds. For the max column values in the top 25% of the range have a red background and in the bottom 25% of the range have a green background. The red background is not used when the min value is within 80% of the max value.
| dbms | 256us | 1ms | 4ms | 16ms | 64ms | 256ms | 1s | 4s | 16s | gt | max |
|---|---|---|---|---|---|---|---|---|---|---|---|
| pg153_o2_nofp.cx9a1_bee | 0.002 | 39.147 | 1.191 | 6.672 | 24.172 | 28.817 | nonzero | 0.356 | |||
| pg154_o2_nofp.cx9a1_bee | 0.002 | 57.210 | 1.258 | 6.550 | 24.240 | 10.740 | 0.092 | ||||
| pg16beta1_o2_nofp.cx9a1_bee | 0.001 | 28.285 | 1.190 | 6.415 | 23.869 | 40.240 | nonzero | 0.328 | |||
| pg16beta2_o2_nofp.cx9a1_bee | 0.003 | 62.941 | 1.230 | 6.452 | 23.975 | 5.401 | 0.081 | ||||
| pg16beta3_o2_nofp.cx9a1_bee | 0.001 | 60.328 | 1.126 | 6.401 | 23.725 | 8.421 | 0.087 |
Performance metrics for the DBMS listed above. Some are normalized by throughput, others are not. Legend for results is here.
ips	qps	rps	rmbps	wps	wmbps	rpq	rkbpq	wpi	wkbpi	csps	cpups	cspq	cpupq	dbgb1	dbgb2	rss	maxop	p50	p99	tag
918	0	1476	11.9	1684.0	20.1	1.609	13.293	1.835	22.444	3579	12.7	3.901	1107	150.5	180.1	1.3	0.085	350	250	800m.pg153_o2_nofp.cx9a1_bee
1796	0	2952	31.2	3435.9	42.8	1.643	17.766	1.913	24.379	6918	12.6	3.851	561	149.6	189.6	3.4	0.188	1198	599	800m.pg154_o2_nofp.cx9a1_bee
721	0	1161	9.3	1325.0	16.0	1.609	13.136	1.837	22.655	2834	12.9	3.929	1431	150.5	173.6	9.7	0.069	350	250	800m.pg16beta1_o2_nofp.cx9a1_bee
2094	0	3353	26.7	3806.0	42.7	1.601	13.050	1.817	20.888	7879	11.8	3.762	451	150.5	190.5	9.8	0.090	1698	649	800m.pg16beta2_o2_nofp.cx9a1_bee
1966	0	3147	25.1	3572.2	40.1	1.601	13.049	1.817	20.874	7402	12.1	3.765	492	150.5	190.5	8.7	0.096	1300	599	800m.pg16beta3_o2_nofp.cx9a1_bee
q100.1
q100.1: range queries with 100 insert/s per client. Graphs for performance per 1-second interval are here.
Average throughput:
Query response time histogram: each cell has the percentage of responses that take <= the time in the header and max is the max response time in seconds. For max values in the top 25% of the range have a red background and in the bottom 25% of the range have a green background. The red background is not used when the min value is within 80% of the max value.
| dbms | 256us | 1ms | 4ms | 16ms | 64ms | 256ms | 1s | 4s | 16s | gt | max |
|---|---|---|---|---|---|---|---|---|---|---|---|
| pg153_o2_nofp.cx9a1_bee | 99.545 | 0.452 | 0.002 | 0.002 | 0.014 | ||||||
| pg154_o2_nofp.cx9a1_bee | 99.597 | 0.400 | 0.001 | 0.002 | nonzero | 0.019 | |||||
| pg16beta1_o2_nofp.cx9a1_bee | 99.588 | 0.409 | 0.002 | 0.002 | nonzero | 0.019 | |||||
| pg16beta2_o2_nofp.cx9a1_bee | 99.607 | 0.391 | 0.001 | 0.002 | 0.010 | ||||||
| pg16beta3_o2_nofp.cx9a1_bee | 99.549 | 0.448 | 0.001 | 0.002 | 0.010 |
Insert response time histogram: each cell has the percentage of responses that take <= the time in the header and max is the max response time in seconds. For max values in the top 25% of the range have a red background and in the bottom 25% of the range have a green background. The red background is not used when the min value is within 80% of the max value.
| dbms | 256us | 1ms | 4ms | 16ms | 64ms | 256ms | 1s | 4s | 16s | gt | max |
|---|---|---|---|---|---|---|---|---|---|---|---|
| pg153_o2_nofp.cx9a1_bee | 72.403 | 27.597 | 0.032 | ||||||||
| pg154_o2_nofp.cx9a1_bee | 74.194 | 25.806 | 0.036 | ||||||||
| pg16beta1_o2_nofp.cx9a1_bee | 71.569 | 28.417 | 0.014 | 0.067 | |||||||
| pg16beta2_o2_nofp.cx9a1_bee | 74.653 | 25.347 | 0.033 | ||||||||
| pg16beta3_o2_nofp.cx9a1_bee | 77.042 | 22.958 | 0.036 |
Delete response time histogram: each cell has the percentage of responses that take <= the time in the header and max is the max response time in seconds. For max values in the top 25% of the range have a red background and in the bottom 25% of the range have a green background. The red background is not used when the min value is within 80% of the max value.
| dbms | 256us | 1ms | 4ms | 16ms | 64ms | 256ms | 1s | 4s | 16s | gt | max |
|---|---|---|---|---|---|---|---|---|---|---|---|
| pg153_o2_nofp.cx9a1_bee | 13.667 | 65.583 | 20.750 | 0.011 | |||||||
| pg154_o2_nofp.cx9a1_bee | 0.111 | 99.792 | 0.042 | 0.056 | 0.007 | ||||||
| pg16beta1_o2_nofp.cx9a1_bee | 12.542 | 65.861 | 21.597 | 0.009 | |||||||
| pg16beta2_o2_nofp.cx9a1_bee | 0.056 | 99.806 | 0.028 | 0.111 | 0.010 | ||||||
| pg16beta3_o2_nofp.cx9a1_bee | 0.833 | 99.056 | 0.042 | 0.069 | 0.007 |
Performance metrics for the DBMS listed above. Some are normalized by throughput, others are not. Legend for results is here.
ips	qps	rps	rmbps	wps	wmbps	rpq	rkbpq	wpi	wkbpi	csps	cpups	cspq	cpupq	dbgb1	dbgb2	rss	maxop	p50	p99	tag
100	7428	198	1.6	163.5	2.6	0.027	0.218	1.638	26.469	29015	12.7	3.906	137	150.5	190.5	10.0	0.014	7239	5897	800m.pg153_o2_nofp.cx9a1_bee
100	7878	199	1.6	163.0	2.6	0.025	0.207	1.635	26.387	30772	12.5	3.906	127	149.6	189.7	10.0	0.019	7432	5455	800m.pg154_o2_nofp.cx9a1_bee
100	7960	199	1.6	162.7	2.6	0.025	0.204	1.630	26.392	31051	12.6	3.901	127	150.5	190.5	9.9	0.019	7507	5786	800m.pg16beta1_o2_nofp.cx9a1_bee
100	7994	199	1.6	166.3	2.6	0.025	0.203	1.668	26.694	31211	12.5	3.904	125	150.5	190.5	10.0	0.010	7525	5624	800m.pg16beta2_o2_nofp.cx9a1_bee
100	7553	199	1.6	160.5	2.6	0.026	0.215	1.609	26.437	29495	12.6	3.905	133	150.5	190.5	9.9	0.010	7307	5605	800m.pg16beta3_o2_nofp.cx9a1_bee
q500.1
q500.1: range queries with 500 insert/s per client. Graphs for performance per 1-second interval are here.
Average throughput:
Query response time histogram: each cell has the percentage of responses that take <= the time in the header and max is the max response time in seconds. For max values in the top 25% of the range have a red background and in the bottom 25% of the range have a green background. The red background is not used when the min value is within 80% of the max value.
| dbms | 256us | 1ms | 4ms | 16ms | 64ms | 256ms | 1s | 4s | 16s | gt | max |
|---|---|---|---|---|---|---|---|---|---|---|---|
| pg153_o2_nofp.cx9a1_bee | 99.845 | 0.149 | 0.001 | 0.005 | 0.015 | ||||||
| pg154_o2_nofp.cx9a1_bee | 99.871 | 0.124 | 0.001 | 0.004 | 0.015 | ||||||
| pg16beta1_o2_nofp.cx9a1_bee | 99.855 | 0.139 | 0.001 | 0.005 | 0.016 | ||||||
| pg16beta2_o2_nofp.cx9a1_bee | 99.868 | 0.128 | nonzero | 0.004 | 0.015 | ||||||
| pg16beta3_o2_nofp.cx9a1_bee | 99.876 | 0.120 | nonzero | 0.004 | 0.015 |
Insert response time histogram: each cell has the percentage of responses that take <= the time in the header and max is the max response time in seconds. For max values in the top 25% of the range have a red background and in the bottom 25% of the range have a green background. The red background is not used when the min value is within 80% of the max value.
| dbms | 256us | 1ms | 4ms | 16ms | 64ms | 256ms | 1s | 4s | 16s | gt | max |
|---|---|---|---|---|---|---|---|---|---|---|---|
| pg153_o2_nofp.cx9a1_bee | 90.894 | 9.106 | 0.032 | ||||||||
| pg154_o2_nofp.cx9a1_bee | 90.942 | 9.058 | 0.032 | ||||||||
| pg16beta1_o2_nofp.cx9a1_bee | 90.125 | 9.875 | 0.032 | ||||||||
| pg16beta2_o2_nofp.cx9a1_bee | 91.414 | 8.586 | 0.032 | ||||||||
| pg16beta3_o2_nofp.cx9a1_bee | 92.589 | 7.411 | 0.033 |
Delete response time histogram: each cell has the percentage of responses that take <= the time in the header and max is the max response time in seconds. For max values in the top 25% of the range have a red background and in the bottom 25% of the range have a green background. The red background is not used when the min value is within 80% of the max value.
| dbms | 256us | 1ms | 4ms | 16ms | 64ms | 256ms | 1s | 4s | 16s | gt | max |
|---|---|---|---|---|---|---|---|---|---|---|---|
| pg153_o2_nofp.cx9a1_bee | 0.011 | 68.275 | 31.714 | 0.026 | |||||||
| pg154_o2_nofp.cx9a1_bee | 3.214 | 96.506 | 0.086 | 0.194 | 0.009 | ||||||
| pg16beta1_o2_nofp.cx9a1_bee | 1.125 | 39.642 | 0.056 | 58.125 | 1.053 | 0.022 | |||||
| pg16beta2_o2_nofp.cx9a1_bee | 2.328 | 97.406 | 0.078 | 0.189 | 0.008 | ||||||
| pg16beta3_o2_nofp.cx9a1_bee | 2.922 | 96.800 | 0.086 | 0.192 | 0.009 |
Performance metrics for the DBMS listed above. Some are normalized by throughput, others are not. Legend for results is here.
ips	qps	rps	rmbps	wps	wmbps	rpq	rkbpq	wpi	wkbpi	csps	cpups	cspq	cpupq	dbgb1	dbgb2	rss	maxop	p50	p99	tag
499	7699	805	6.4	941.7	12.1	0.105	0.855	1.887	24.790	31458	15.4	4.086	160	150.5	185.5	10.0	0.015	7288	6936	800m.pg153_o2_nofp.cx9a1_bee
499	7790	803	6.4	946.1	12.2	0.103	0.843	1.897	24.951	31790	13.8	4.081	142	149.7	185.0	10.0	0.015	7364	7033	800m.pg154_o2_nofp.cx9a1_bee
498	7712	805	6.4	945.1	12.1	0.104	0.853	1.896	24.880	31525	14.5	4.088	150	150.5	185.5	9.9	0.016	7318	7017	800m.pg16beta1_o2_nofp.cx9a1_bee
499	7728	801	6.4	938.1	12.1	0.104	0.848	1.881	24.780	31566	13.9	4.085	144	150.5	186.6	10.0	0.015	7368	7081	800m.pg16beta2_o2_nofp.cx9a1_bee
499	7740	801	6.4	945.1	12.1	0.103	0.846	1.895	24.917	31603	13.8	4.083	143	150.5	185.7	10.0	0.015	7350	7081	800m.pg16beta3_o2_nofp.cx9a1_bee
q1000.1
q1000.1: range queries with 1000 insert/s per client. Graphs for performance per 1-second interval are here.
Average throughput:
Query response time histogram: each cell has the percentage of responses that take <= the time in the header and max is the max response time in seconds. For max values in the top 25% of the range have a red background and in the bottom 25% of the range have a green background. The red background is not used when the min value is within 80% of the max value.
| dbms | 256us | 1ms | 4ms | 16ms | 64ms | 256ms | 1s | 4s | 16s | gt | max |
|---|---|---|---|---|---|---|---|---|---|---|---|
| pg153_o2_nofp.cx9a1_bee | 99.783 | 0.209 | 0.002 | 0.005 | 0.016 | ||||||
| pg154_o2_nofp.cx9a1_bee | 99.806 | 0.186 | 0.001 | 0.007 | 0.016 | ||||||
| pg16beta1_o2_nofp.cx9a1_bee | 99.810 | 0.182 | 0.001 | 0.007 | 0.015 | ||||||
| pg16beta2_o2_nofp.cx9a1_bee | 99.811 | 0.181 | 0.001 | 0.007 | 0.015 | ||||||
| pg16beta3_o2_nofp.cx9a1_bee | 99.808 | 0.185 | 0.001 | 0.006 | 0.016 |
Insert response time histogram: each cell has the percentage of responses that take <= the time in the header and max is the max response time in seconds. For max values in the top 25% of the range have a red background and in the bottom 25% of the range have a green background. The red background is not used when the min value is within 80% of the max value.
| dbms | 256us | 1ms | 4ms | 16ms | 64ms | 256ms | 1s | 4s | 16s | gt | max |
|---|---|---|---|---|---|---|---|---|---|---|---|
| pg153_o2_nofp.cx9a1_bee | 97.983 | 2.017 | 0.029 | ||||||||
| pg154_o2_nofp.cx9a1_bee | 97.651 | 2.349 | 0.029 | ||||||||
| pg16beta1_o2_nofp.cx9a1_bee | 97.328 | 2.672 | 0.029 | ||||||||
| pg16beta2_o2_nofp.cx9a1_bee | 97.112 | 2.888 | 0.029 | ||||||||
| pg16beta3_o2_nofp.cx9a1_bee | 97.782 | 2.218 | 0.029 |
Delete response time histogram: each cell has the percentage of responses that take <= the time in the header and max is the max response time in seconds. For max values in the top 25% of the range have a red background and in the bottom 25% of the range have a green background. The red background is not used when the min value is within 80% of the max value.
| dbms | 256us | 1ms | 4ms | 16ms | 64ms | 256ms | 1s | 4s | 16s | gt | max |
|---|---|---|---|---|---|---|---|---|---|---|---|
| pg153_o2_nofp.cx9a1_bee | 0.179 | 15.950 | 0.006 | 0.001 | 83.862 | 0.001 | 0.069 | ||||
| pg154_o2_nofp.cx9a1_bee | 1.622 | 98.282 | 0.056 | 0.040 | 0.008 | ||||||
| pg16beta1_o2_nofp.cx9a1_bee | 1.389 | 98.501 | 0.062 | 0.047 | 0.008 | ||||||
| pg16beta2_o2_nofp.cx9a1_bee | 1.190 | 98.696 | 0.053 | 0.061 | 0.009 | ||||||
| pg16beta3_o2_nofp.cx9a1_bee | 1.132 | 70.539 | 0.057 | 0.051 | 28.219 | 0.001 | 0.098 |
Performance metrics for the DBMS listed above. Some are normalized by throughput, others are not. Legend for results is here.
ips	qps	rps	rmbps	wps	wmbps	rpq	rkbpq	wpi	wkbpi	csps	cpups	cspq	cpupq	dbgb1	dbgb2	rss	maxop	p50	p99	tag
998	7693	1612	12.9	1893.4	22.7	0.210	1.716	1.897	23.303	33278	21.9	4.326	228	150.7	182.9	9.9	0.016	7350	6904	800m.pg153_o2_nofp.cx9a1_bee
998	7535	1612	12.9	1894.0	22.7	0.214	1.752	1.899	23.343	32666	14.7	4.335	156	150.0	182.4	10.0	0.016	7251	6951	800m.pg154_o2_nofp.cx9a1_bee
997	7626	1611	12.9	1887.3	22.7	0.211	1.730	1.893	23.262	33065	14.7	4.336	154	150.7	182.9	9.8	0.015	7288	6999	800m.pg16beta1_o2_nofp.cx9a1_bee
998	7572	1611	12.9	1880.9	22.6	0.213	1.742	1.885	23.210	32828	14.8	4.335	156	150.7	183.6	9.9	0.015	7272	7003	800m.pg16beta2_o2_nofp.cx9a1_bee
994	7586	1616	13.0	1877.7	22.6	0.213	1.750	1.889	23.265	32882	18.1	4.335	191	150.7	183.0	9.9	0.016	7288	6969	800m.pg16beta3_o2_nofp.cx9a1_bee
l.i0
l.i0: load without secondary indexes
Performance metrics for all DBMS, not just the ones listed above. Some are normalized by throughput, others are not. Legend for results is here.
ips	qps	rps	rmbps	wps	wmbps	rpq	rkbpq	wpi	wkbpi	csps	cpups	cspq	cpupq	dbgb1	dbgb2	rss	maxop	p50	p99	tag
72014	0	30	0.2	106.0	29.4	0.000	0.003	0.001	0.418	8807	22.3	0.122	25	76.5	116.6	0.4	0.031	72217	70098	800m.pg153_o2_nofp.cx9a1_bee
72543	0	30	0.2	103.2	29.6	0.000	0.003	0.001	0.418	8843	22.3	0.122	25	76.5	116.6	3.2	0.057	72719	70720	800m.pg154_o2_nofp.cx9a1_bee
71820	0	30	0.2	99.7	29.4	0.000	0.003	0.001	0.419	8774	22.3	0.122	25	76.5	116.6	1.4	0.057	72118	69816	800m.pg16beta1_o2_nofp.cx9a1_bee
69784	0	30	0.2	99.3	28.4	0.000	0.003	0.001	0.417	8530	23.0	0.122	26	76.5	116.2	2.1	0.058	70023	67962	800m.pg16beta2_o2_nofp.cx9a1_bee
72424	0	31	0.2	104.2	29.7	0.000	0.003	0.001	0.419	8832	22.3	0.122	25	76.5	116.6	2.1	0.057	72624	70483	800m.pg16beta3_o2_nofp.cx9a1_bee
l.x
l.x: create secondary indexes
Performance metrics for all DBMS, not just the ones listed above. Some are normalized by throughput, others are not. Legend for results is here.
ips	qps	rps	rmbps	wps	wmbps	rpq	rkbpq	wpi	wkbpi	csps	cpups	cspq	cpupq	dbgb1	dbgb2	rss	maxop	p50	p99	tag
191641	0	557	69.1	161.6	58.9	0.003	0.369	0.001	0.315	410	12.5	0.002	5	147.0	187.1	10.2	0.004	NA	NA	800m.pg153_o2_nofp.cx9a1_bee
191549	0	557	69.1	160.6	59.2	0.003	0.369	0.001	0.316	400	12.5	0.002	5	147.0	187.1	10.2	0.004	NA	NA	800m.pg154_o2_nofp.cx9a1_bee
196247	0	571	70.8	164.3	60.4	0.003	0.370	0.001	0.315	402	12.5	0.002	5	147.0	187.1	10.2	0.005	NA	NA	800m.pg16beta1_o2_nofp.cx9a1_bee
193308	0	561	69.7	162.5	59.8	0.003	0.369	0.001	0.317	411	12.5	0.002	5	147.0	187.1	10.2	0.004	NA	NA	800m.pg16beta2_o2_nofp.cx9a1_bee
194577	0	566	70.2	161.1	60.1	0.003	0.370	0.001	0.316	392	12.5	0.002	5	147.0	187.1	10.2	0.006	NA	NA	800m.pg16beta3_o2_nofp.cx9a1_bee
l.i1
l.i1: continue load after secondary indexes created
Performance metrics for all DBMS, not just the ones listed above. Some are normalized by throughput, others are not. Legend for results is here.
ips	qps	rps	rmbps	wps	wmbps	rpq	rkbpq	wpi	wkbpi	csps	cpups	cspq	cpupq	dbgb1	dbgb2	rss	maxop	p50	p99	tag
918	0	1476	11.9	1684.0	20.1	1.609	13.293	1.835	22.444	3579	12.7	3.901	1107	150.5	180.1	1.3	0.085	350	250	800m.pg153_o2_nofp.cx9a1_bee
1796	0	2952	31.2	3435.9	42.8	1.643	17.766	1.913	24.379	6918	12.6	3.851	561	149.6	189.6	3.4	0.188	1198	599	800m.pg154_o2_nofp.cx9a1_bee
721	0	1161	9.3	1325.0	16.0	1.609	13.136	1.837	22.655	2834	12.9	3.929	1431	150.5	173.6	9.7	0.069	350	250	800m.pg16beta1_o2_nofp.cx9a1_bee
2094	0	3353	26.7	3806.0	42.7	1.601	13.050	1.817	20.888	7879	11.8	3.762	451	150.5	190.5	9.8	0.090	1698	649	800m.pg16beta2_o2_nofp.cx9a1_bee
1966	0	3147	25.1	3572.2	40.1	1.601	13.049	1.817	20.874	7402	12.1	3.765	492	150.5	190.5	8.7	0.096	1300	599	800m.pg16beta3_o2_nofp.cx9a1_bee
q100.1
q100.1: range queries with 100 insert/s per client
Performance metrics for all DBMS, not just the ones listed above. Some are normalized by throughput, others are not. Legend for results is here.
ips	qps	rps	rmbps	wps	wmbps	rpq	rkbpq	wpi	wkbpi	csps	cpups	cspq	cpupq	dbgb1	dbgb2	rss	maxop	p50	p99	tag
100	7428	198	1.6	163.5	2.6	0.027	0.218	1.638	26.469	29015	12.7	3.906	137	150.5	190.5	10.0	0.014	7239	5897	800m.pg153_o2_nofp.cx9a1_bee
100	7878	199	1.6	163.0	2.6	0.025	0.207	1.635	26.387	30772	12.5	3.906	127	149.6	189.7	10.0	0.019	7432	5455	800m.pg154_o2_nofp.cx9a1_bee
100	7960	199	1.6	162.7	2.6	0.025	0.204	1.630	26.392	31051	12.6	3.901	127	150.5	190.5	9.9	0.019	7507	5786	800m.pg16beta1_o2_nofp.cx9a1_bee
100	7994	199	1.6	166.3	2.6	0.025	0.203	1.668	26.694	31211	12.5	3.904	125	150.5	190.5	10.0	0.010	7525	5624	800m.pg16beta2_o2_nofp.cx9a1_bee
100	7553	199	1.6	160.5	2.6	0.026	0.215	1.609	26.437	29495	12.6	3.905	133	150.5	190.5	9.9	0.010	7307	5605	800m.pg16beta3_o2_nofp.cx9a1_bee
q500.1
q500.1: range queries with 500 insert/s per client
Performance metrics for all DBMS, not just the ones listed above. Some are normalized by throughput, others are not. Legend for results is here.
ips	qps	rps	rmbps	wps	wmbps	rpq	rkbpq	wpi	wkbpi	csps	cpups	cspq	cpupq	dbgb1	dbgb2	rss	maxop	p50	p99	tag
499	7699	805	6.4	941.7	12.1	0.105	0.855	1.887	24.790	31458	15.4	4.086	160	150.5	185.5	10.0	0.015	7288	6936	800m.pg153_o2_nofp.cx9a1_bee
499	7790	803	6.4	946.1	12.2	0.103	0.843	1.897	24.951	31790	13.8	4.081	142	149.7	185.0	10.0	0.015	7364	7033	800m.pg154_o2_nofp.cx9a1_bee
498	7712	805	6.4	945.1	12.1	0.104	0.853	1.896	24.880	31525	14.5	4.088	150	150.5	185.5	9.9	0.016	7318	7017	800m.pg16beta1_o2_nofp.cx9a1_bee
499	7728	801	6.4	938.1	12.1	0.104	0.848	1.881	24.780	31566	13.9	4.085	144	150.5	186.6	10.0	0.015	7368	7081	800m.pg16beta2_o2_nofp.cx9a1_bee
499	7740	801	6.4	945.1	12.1	0.103	0.846	1.895	24.917	31603	13.8	4.083	143	150.5	185.7	10.0	0.015	7350	7081	800m.pg16beta3_o2_nofp.cx9a1_bee
q1000.1
q1000.1: range queries with 1000 insert/s per client
Performance metrics for all DBMS, not just the ones listed above. Some are normalized by throughput, others are not. Legend for results is here.
ips	qps	rps	rmbps	wps	wmbps	rpq	rkbpq	wpi	wkbpi	csps	cpups	cspq	cpupq	dbgb1	dbgb2	rss	maxop	p50	p99	tag
998	7693	1612	12.9	1893.4	22.7	0.210	1.716	1.897	23.303	33278	21.9	4.326	228	150.7	182.9	9.9	0.016	7350	6904	800m.pg153_o2_nofp.cx9a1_bee
998	7535	1612	12.9	1894.0	22.7	0.214	1.752	1.899	23.343	32666	14.7	4.335	156	150.0	182.4	10.0	0.016	7251	6951	800m.pg154_o2_nofp.cx9a1_bee
997	7626	1611	12.9	1887.3	22.7	0.211	1.730	1.893	23.262	33065	14.7	4.336	154	150.7	182.9	9.8	0.015	7288	6999	800m.pg16beta1_o2_nofp.cx9a1_bee
998	7572	1611	12.9	1880.9	22.6	0.213	1.742	1.885	23.210	32828	14.8	4.335	156	150.7	183.6	9.9	0.015	7272	7003	800m.pg16beta2_o2_nofp.cx9a1_bee
994	7586	1616	13.0	1877.7	22.6	0.213	1.750	1.889	23.265	32882	18.1	4.335	191	150.7	183.0	9.9	0.016	7288	6969	800m.pg16beta3_o2_nofp.cx9a1_bee
l.i0
- l.i0: load without secondary indexes
- Legend for results is here.
- Each entry lists the percentage of responses that fit in that bucket (slower than max time for previous bucket, faster than min time for next bucket).
Insert response time histogram
256us	1ms	4ms	16ms	64ms	256ms	1s	4s	16s	gt	max	tag
0.000	0.000	99.999	nonzero	nonzero	0.000	0.000	0.000	0.000	0.000	0.031	pg153_o2_nofp.cx9a1_bee
0.000	0.000	99.999	0.001	nonzero	0.000	0.000	0.000	0.000	0.000	0.057	pg154_o2_nofp.cx9a1_bee
0.000	0.000	99.999	nonzero	nonzero	0.000	0.000	0.000	0.000	0.000	0.057	pg16beta1_o2_nofp.cx9a1_bee
0.000	0.000	99.999	nonzero	nonzero	0.000	0.000	0.000	0.000	0.000	0.058	pg16beta2_o2_nofp.cx9a1_bee
0.000	0.000	99.999	nonzero	nonzero	0.000	0.000	0.000	0.000	0.000	0.057	pg16beta3_o2_nofp.cx9a1_bee
l.x
- l.x: create secondary indexes
- Legend for results is here.
- Each entry lists the percentage of responses that fit in that bucket (slower than max time for previous bucket, faster than min time for next bucket).
TODO - determine whether there is data for create index response time
l.i1
- l.i1: continue load after secondary indexes created
- Legend for results is here.
- Each entry lists the percentage of responses that fit in that bucket (slower than max time for previous bucket, faster than min time for next bucket).
Insert response time histogram
256us	1ms	4ms	16ms	64ms	256ms	1s	4s	16s	gt	max	tag
0.000	0.000	0.000	83.148	16.850	0.002	0.000	0.000	0.000	0.000	0.085	pg153_o2_nofp.cx9a1_bee
0.000	0.000	0.000	76.694	23.260	0.045	0.000	0.000	0.000	0.000	0.188	pg154_o2_nofp.cx9a1_bee
0.000	0.000	0.000	78.473	21.526	0.001	0.000	0.000	0.000	0.000	0.069	pg16beta1_o2_nofp.cx9a1_bee
0.000	0.000	0.000	81.408	18.591	0.001	0.000	0.000	0.000	0.000	0.090	pg16beta2_o2_nofp.cx9a1_bee
0.000	0.000	0.000	85.672	14.327	0.002	0.000	0.000	0.000	0.000	0.096	pg16beta3_o2_nofp.cx9a1_bee
Delete response time histogram
256us	1ms	4ms	16ms	64ms	256ms	1s	4s	16s	gt	max	tag
0.002	39.147	1.191	6.672	24.172	28.817	nonzero	0.000	0.000	0.000	0.356	pg153_o2_nofp.cx9a1_bee
0.002	57.210	1.258	6.550	24.240	10.740	0.000	0.000	0.000	0.000	0.092	pg154_o2_nofp.cx9a1_bee
0.001	28.285	1.190	6.415	23.869	40.240	nonzero	0.000	0.000	0.000	0.328	pg16beta1_o2_nofp.cx9a1_bee
0.003	62.941	1.230	6.452	23.975	5.401	0.000	0.000	0.000	0.000	0.081	pg16beta2_o2_nofp.cx9a1_bee
0.001	60.328	1.126	6.401	23.725	8.421	0.000	0.000	0.000	0.000	0.087	pg16beta3_o2_nofp.cx9a1_bee
q100.1
- q100.1: range queries with 100 insert/s per client
- Legend for results is here.
- Each entry lists the percentage of responses that fit in that bucket (slower than max time for previous bucket, faster than min time for next bucket).
Query response time histogram
256us	1ms	4ms	16ms	64ms	256ms	1s	4s	16s	gt	max	tag
99.545	0.452	0.002	0.002	0.000	0.000	0.000	0.000	0.000	0.000	0.014	pg153_o2_nofp.cx9a1_bee
99.597	0.400	0.001	0.002	nonzero	0.000	0.000	0.000	0.000	0.000	0.019	pg154_o2_nofp.cx9a1_bee
99.588	0.409	0.002	0.002	nonzero	0.000	0.000	0.000	0.000	0.000	0.019	pg16beta1_o2_nofp.cx9a1_bee
99.607	0.391	0.001	0.002	0.000	0.000	0.000	0.000	0.000	0.000	0.010	pg16beta2_o2_nofp.cx9a1_bee
99.549	0.448	0.001	0.002	0.000	0.000	0.000	0.000	0.000	0.000	0.010	pg16beta3_o2_nofp.cx9a1_bee
Insert response time histogram
256us	1ms	4ms	16ms	64ms	256ms	1s	4s	16s	gt	max	tag
0.000	0.000	0.000	72.403	27.597	0.000	0.000	0.000	0.000	0.000	0.032	pg153_o2_nofp.cx9a1_bee
0.000	0.000	0.000	74.194	25.806	0.000	0.000	0.000	0.000	0.000	0.036	pg154_o2_nofp.cx9a1_bee
0.000	0.000	0.000	71.569	28.417	0.014	0.000	0.000	0.000	0.000	0.067	pg16beta1_o2_nofp.cx9a1_bee
0.000	0.000	0.000	74.653	25.347	0.000	0.000	0.000	0.000	0.000	0.033	pg16beta2_o2_nofp.cx9a1_bee
0.000	0.000	0.000	77.042	22.958	0.000	0.000	0.000	0.000	0.000	0.036	pg16beta3_o2_nofp.cx9a1_bee
Delete response time histogram
256us	1ms	4ms	16ms	64ms	256ms	1s	4s	16s	gt	max	tag
0.000	13.667	65.583	20.750	0.000	0.000	0.000	0.000	0.000	0.000	0.011	pg153_o2_nofp.cx9a1_bee
0.111	99.792	0.042	0.056	0.000	0.000	0.000	0.000	0.000	0.000	0.007	pg154_o2_nofp.cx9a1_bee
0.000	12.542	65.861	21.597	0.000	0.000	0.000	0.000	0.000	0.000	0.009	pg16beta1_o2_nofp.cx9a1_bee
0.056	99.806	0.028	0.111	0.000	0.000	0.000	0.000	0.000	0.000	0.010	pg16beta2_o2_nofp.cx9a1_bee
0.833	99.056	0.042	0.069	0.000	0.000	0.000	0.000	0.000	0.000	0.007	pg16beta3_o2_nofp.cx9a1_bee
q500.1
- q500.1: range queries with 500 insert/s per client
- Legend for results is here.
- Each entry lists the percentage of responses that fit in that bucket (slower than max time for previous bucket, faster than min time for next bucket).
Query response time histogram
256us	1ms	4ms	16ms	64ms	256ms	1s	4s	16s	gt	max	tag
99.845	0.149	0.001	0.005	0.000	0.000	0.000	0.000	0.000	0.000	0.015	pg153_o2_nofp.cx9a1_bee
99.871	0.124	0.001	0.004	0.000	0.000	0.000	0.000	0.000	0.000	0.015	pg154_o2_nofp.cx9a1_bee
99.855	0.139	0.001	0.005	0.000	0.000	0.000	0.000	0.000	0.000	0.016	pg16beta1_o2_nofp.cx9a1_bee
99.868	0.128	nonzero	0.004	0.000	0.000	0.000	0.000	0.000	0.000	0.015	pg16beta2_o2_nofp.cx9a1_bee
99.876	0.120	nonzero	0.004	0.000	0.000	0.000	0.000	0.000	0.000	0.015	pg16beta3_o2_nofp.cx9a1_bee
Insert response time histogram
256us	1ms	4ms	16ms	64ms	256ms	1s	4s	16s	gt	max	tag
0.000	0.000	0.000	90.894	9.106	0.000	0.000	0.000	0.000	0.000	0.032	pg153_o2_nofp.cx9a1_bee
0.000	0.000	0.000	90.942	9.058	0.000	0.000	0.000	0.000	0.000	0.032	pg154_o2_nofp.cx9a1_bee
0.000	0.000	0.000	90.125	9.875	0.000	0.000	0.000	0.000	0.000	0.032	pg16beta1_o2_nofp.cx9a1_bee
0.000	0.000	0.000	91.414	8.586	0.000	0.000	0.000	0.000	0.000	0.032	pg16beta2_o2_nofp.cx9a1_bee
0.000	0.000	0.000	92.589	7.411	0.000	0.000	0.000	0.000	0.000	0.033	pg16beta3_o2_nofp.cx9a1_bee
Delete response time histogram
256us	1ms	4ms	16ms	64ms	256ms	1s	4s	16s	gt	max	tag
0.000	0.000	0.011	68.275	31.714	0.000	0.000	0.000	0.000	0.000	0.026	pg153_o2_nofp.cx9a1_bee
3.214	96.506	0.086	0.194	0.000	0.000	0.000	0.000	0.000	0.000	0.009	pg154_o2_nofp.cx9a1_bee
1.125	39.642	0.056	58.125	1.053	0.000	0.000	0.000	0.000	0.000	0.022	pg16beta1_o2_nofp.cx9a1_bee
2.328	97.406	0.078	0.189	0.000	0.000	0.000	0.000	0.000	0.000	0.008	pg16beta2_o2_nofp.cx9a1_bee
2.922	96.800	0.086	0.192	0.000	0.000	0.000	0.000	0.000	0.000	0.009	pg16beta3_o2_nofp.cx9a1_bee
q1000.1
- q1000.1: range queries with 1000 insert/s per client
- Legend for results is here.
- Each entry lists the percentage of responses that fit in that bucket (slower than max time for previous bucket, faster than min time for next bucket).
Query response time histogram
256us	1ms	4ms	16ms	64ms	256ms	1s	4s	16s	gt	max	tag
99.783	0.209	0.002	0.005	0.000	0.000	0.000	0.000	0.000	0.000	0.016	pg153_o2_nofp.cx9a1_bee
99.806	0.186	0.001	0.007	0.000	0.000	0.000	0.000	0.000	0.000	0.016	pg154_o2_nofp.cx9a1_bee
99.810	0.182	0.001	0.007	0.000	0.000	0.000	0.000	0.000	0.000	0.015	pg16beta1_o2_nofp.cx9a1_bee
99.811	0.181	0.001	0.007	0.000	0.000	0.000	0.000	0.000	0.000	0.015	pg16beta2_o2_nofp.cx9a1_bee
99.808	0.185	0.001	0.006	0.000	0.000	0.000	0.000	0.000	0.000	0.016	pg16beta3_o2_nofp.cx9a1_bee
Insert response time histogram
256us	1ms	4ms	16ms	64ms	256ms	1s	4s	16s	gt	max	tag
0.000	0.000	0.000	97.983	2.017	0.000	0.000	0.000	0.000	0.000	0.029	pg153_o2_nofp.cx9a1_bee
0.000	0.000	0.000	97.651	2.349	0.000	0.000	0.000	0.000	0.000	0.029	pg154_o2_nofp.cx9a1_bee
0.000	0.000	0.000	97.328	2.672	0.000	0.000	0.000	0.000	0.000	0.029	pg16beta1_o2_nofp.cx9a1_bee
0.000	0.000	0.000	97.112	2.888	0.000	0.000	0.000	0.000	0.000	0.029	pg16beta2_o2_nofp.cx9a1_bee
0.000	0.000	0.000	97.782	2.218	0.000	0.000	0.000	0.000	0.000	0.029	pg16beta3_o2_nofp.cx9a1_bee
Delete response time histogram
256us	1ms	4ms	16ms	64ms	256ms	1s	4s	16s	gt	max	tag
0.179	15.950	0.006	0.001	83.862	0.001	0.000	0.000	0.000	0.000	0.069	pg153_o2_nofp.cx9a1_bee
1.622	98.282	0.056	0.040	0.000	0.000	0.000	0.000	0.000	0.000	0.008	pg154_o2_nofp.cx9a1_bee
1.389	98.501	0.062	0.047	0.000	0.000	0.000	0.000	0.000	0.000	0.008	pg16beta1_o2_nofp.cx9a1_bee
1.190	98.696	0.053	0.061	0.000	0.000	0.000	0.000	0.000	0.000	0.009	pg16beta2_o2_nofp.cx9a1_bee
1.132	70.539	0.057	0.051	28.219	0.001	0.000	0.000	0.000	0.000	0.098	pg16beta3_o2_nofp.cx9a1_bee