Introduction
This is a report for the insert benchmark with 20M docs and 1 client(s). It is generated by scripts (bash, awk, sed) and Tufte might not be impressed. An overview of the insert benchmark is here and a short update is here. Below, by DBMS, I mean DBMS+version.config. An example is my8020.c10b40 where my means MySQL, 8020 is version 8.0.20 and c10b40 is the name for the configuration file.
The test server has 8 AMD cores, 16G RAM and an NVMe SSD. It is described here as the Beelink. The benchmark was run with 1 client and there were 1 or 3 connections per client (1 for queries or inserts without rate limits, 1+1 for rate limited inserts+deletes). It uses 1 table. It loads 20M rows per table without secondary indexes, creates secondary indexes, then inserts 200M rows per table with a delete per insert to avoid growing the table. It then does 3 read+write tests for 7200s each that do queries as fast as possible with 100, 500 and then 1000 inserts/second/client concurrent with the queries and 1000 deletes/second to avoid growing the table. The database is cached by Postgres. Clients and the DBMS share one server. The per-database configs are in the per-database subdirectories here.
The tested DBMS are:
- pg153_o2_nofp.cx9a2_bee - Postgres 15.3, o2_nofp build that used -O2 -no-omit-frame-pointer, a2 config
- pg154_o2_nofp.cx9a2_bee - Postgres 15.4, o2_nofp build that used -O2 -no-omit-frame-pointer, a2 config
- pg16beta1_o2_nofp.cx9a2_bee - Postgres 16 beta1, o2_nofp build that used -O2 -no-omit-frame-pointer, a2 config
- pg16beta2_o2_nofp.cx9a2_bee - Postgres 16 beta2, o2_nofp build that used -O2 -no-omit-frame-pointer, a2 config
- pg16beta3_o2_nofp.cx9a2_bee - Postgres 16 beta3, o2_nofp build that used -O2 -no-omit-frame-pointer, a2 config
Contents
- Summary
- l.i0: load without secondary indexes
- l.x: create secondary indexes
- l.i1: continue load after secondary indexes created
- q100.1: range queries with 100 insert/s per client
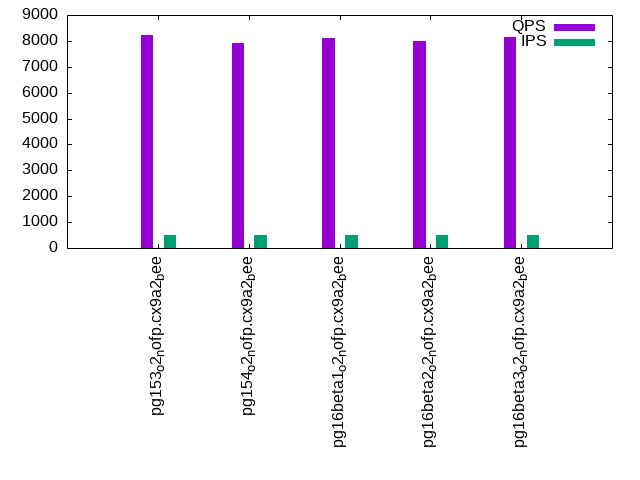
- q500.1: range queries with 500 insert/s per client
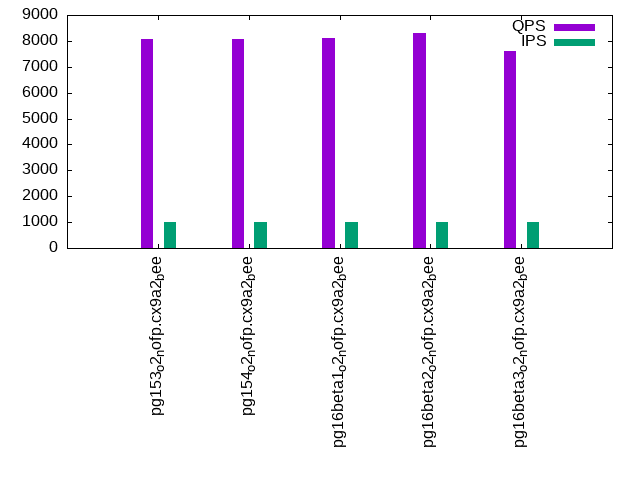
- q1000.1: range queries with 1000 insert/s per client
Summary
The numbers are inserts/s for l.i0 and l.i1, indexed docs (or rows) /s for l.x and queries/s for q*.2. The values are the average rate over the entire test for inserts (IPS) and queries (QPS). The range of values for IPS and QPS is split into 3 parts: bottom 25%, middle 50%, top 25%. Values in the bottom 25% have a red background, values in the top 25% have a green background and values in the middle have no color. A gray background is used for values that can be ignored because the DBMS did not sustain the target insert rate. Red backgrounds are not used when the minimum value is within 80% of the max value.
| dbms | l.i0 | l.x | l.i1 | q100.1 | q500.1 | q1000.1 |
|---|---|---|---|---|---|---|
| pg153_o2_nofp.cx9a2_bee | 70922 | 233721 | 23422 | 8605 | 8223 | 8056 |
| pg154_o2_nofp.cx9a2_bee | 72464 | 228409 | 24137 | 8278 | 7911 | 8059 |
| pg16beta1_o2_nofp.cx9a2_bee | 71174 | 242169 | 24085 | 8403 | 8113 | 8093 |
| pg16beta2_o2_nofp.cx9a2_bee | 71174 | 233721 | 24122 | 7810 | 7977 | 8312 |
| pg16beta3_o2_nofp.cx9a2_bee | 71942 | 239286 | 24236 | 7978 | 8162 | 7621 |
This table has relative throughput, throughput for the DBMS relative to the DBMS in the first line, using the absolute throughput from the previous table. Values less than 0.95 have a yellow background. Values greater than 1.05 have a blue background.
| dbms | l.i0 | l.x | l.i1 | q100.1 | q500.1 | q1000.1 |
|---|---|---|---|---|---|---|
| pg153_o2_nofp.cx9a2_bee | 1.00 | 1.00 | 1.00 | 1.00 | 1.00 | 1.00 |
| pg154_o2_nofp.cx9a2_bee | 1.02 | 0.98 | 1.03 | 0.96 | 0.96 | 1.00 |
| pg16beta1_o2_nofp.cx9a2_bee | 1.00 | 1.04 | 1.03 | 0.98 | 0.99 | 1.00 |
| pg16beta2_o2_nofp.cx9a2_bee | 1.00 | 1.00 | 1.03 | 0.91 | 0.97 | 1.03 |
| pg16beta3_o2_nofp.cx9a2_bee | 1.01 | 1.02 | 1.03 | 0.93 | 0.99 | 0.95 |
This lists the average rate of inserts/s for the tests that do inserts concurrent with queries. For such tests the query rate is listed in the table above. The read+write tests are setup so that the insert rate should match the target rate every second. Cells that are not at least 95% of the target have a red background to indicate a failure to satisfy the target.
| dbms | q100.1 | q500.1 | q1000.1 |
|---|---|---|---|
| pg153_o2_nofp.cx9a2_bee | 100 | 499 | 998 |
| pg154_o2_nofp.cx9a2_bee | 100 | 499 | 998 |
| pg16beta1_o2_nofp.cx9a2_bee | 100 | 499 | 998 |
| pg16beta2_o2_nofp.cx9a2_bee | 100 | 499 | 998 |
| pg16beta3_o2_nofp.cx9a2_bee | 100 | 498 | 998 |
| target | 100 | 500 | 1000 |
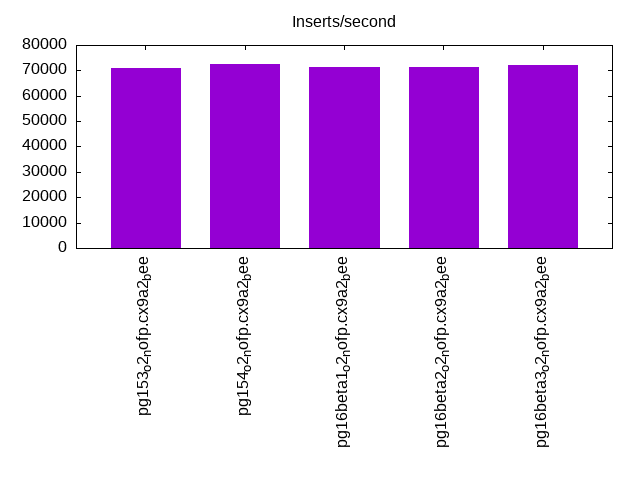
l.i0
l.i0: load without secondary indexes. Graphs for performance per 1-second interval are here.
Average throughput:
Insert response time histogram: each cell has the percentage of responses that take <= the time in the header and max is the max response time in seconds. For the max column values in the top 25% of the range have a red background and in the bottom 25% of the range have a green background. The red background is not used when the min value is within 80% of the max value.
| dbms | 256us | 1ms | 4ms | 16ms | 64ms | 256ms | 1s | 4s | 16s | gt | max |
|---|---|---|---|---|---|---|---|---|---|---|---|
| pg153_o2_nofp.cx9a2_bee | 99.999 | 0.001 | 0.004 | ||||||||
| pg154_o2_nofp.cx9a2_bee | 100.000 | 0.003 | |||||||||
| pg16beta1_o2_nofp.cx9a2_bee | 100.000 | 0.003 | |||||||||
| pg16beta2_o2_nofp.cx9a2_bee | 100.000 | 0.003 | |||||||||
| pg16beta3_o2_nofp.cx9a2_bee | 99.999 | 0.001 | 0.005 |
Performance metrics for the DBMS listed above. Some are normalized by throughput, others are not. Legend for results is here.
ips	qps	rps	rmbps	wps	wmbps	rpq	rkbpq	wpi	wkbpi	csps	cpups	cspq	cpupq	dbgb1	dbgb2	rss	maxop	p50	p99	tag
70922	0	0	0.0	83.5	30.1	0.000	0.000	0.001	0.434	8753	22.3	0.123	25	1.9	5.2	0.2	0.004	71322	68116	20m.pg153_o2_nofp.cx9a2_bee
72464	0	0	0.0	85.0	30.7	0.000	0.000	0.001	0.433	8945	22.4	0.123	25	1.9	5.2	1.9	0.003	73019	64131	20m.pg154_o2_nofp.cx9a2_bee
71174	0	0	0.0	83.5	30.2	0.000	0.000	0.001	0.435	8767	22.4	0.123	25	1.9	5.2	1.9	0.003	71421	69887	20m.pg16beta1_o2_nofp.cx9a2_bee
71174	0	0	0.0	84.5	30.6	0.000	0.000	0.001	0.440	8792	22.5	0.124	25	1.9	5.2	0.2	0.003	71622	69222	20m.pg16beta2_o2_nofp.cx9a2_bee
71942	0	0	0.0	84.2	30.3	0.000	0.000	0.001	0.432	8851	22.4	0.123	25	1.9	5.2	1.5	0.005	72038	70219	20m.pg16beta3_o2_nofp.cx9a2_bee
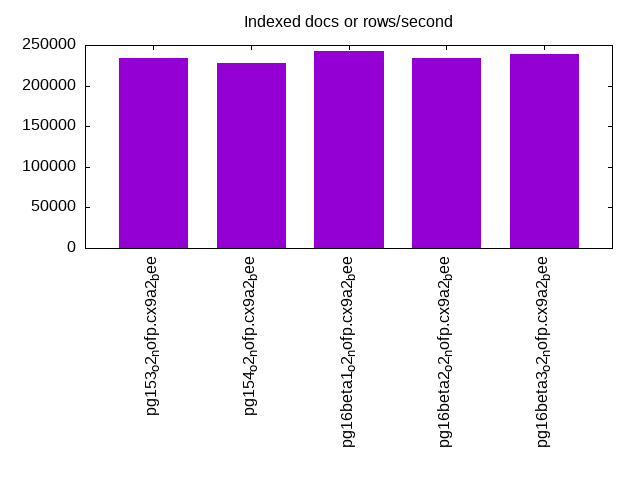
l.x
l.x: create secondary indexes.
Average throughput:
Performance metrics for the DBMS listed above. Some are normalized by throughput, others are not. Legend for results is here.
ips	qps	rps	rmbps	wps	wmbps	rpq	rkbpq	wpi	wkbpi	csps	cpups	cspq	cpupq	dbgb1	dbgb2	rss	maxop	p50	p99	tag
233721	0	0	0.0	115.2	54.0	0.000	0.000	0.000	0.236	669	11.8	0.003	4	3.7	8.6	2.1	0.003	NA	NA	20m.pg153_o2_nofp.cx9a2_bee
228409	0	0	0.0	103.2	48.2	0.000	0.000	0.000	0.216	709	11.7	0.003	4	3.7	8.6	2.1	0.003	NA	NA	20m.pg154_o2_nofp.cx9a2_bee
242169	0	0	0.0	100.4	46.6	0.000	0.000	0.000	0.197	848	12.0	0.004	4	3.7	8.6	2.1	0.003	NA	NA	20m.pg16beta1_o2_nofp.cx9a2_bee
233721	0	0	0.0	112.1	52.1	0.000	0.000	0.000	0.228	782	12.1	0.003	4	3.7	8.6	2.1	0.003	NA	NA	20m.pg16beta2_o2_nofp.cx9a2_bee
239286	0	0	0.0	100.6	46.7	0.000	0.000	0.000	0.200	687	12.2	0.003	4	3.7	8.6	2.1	0.003	NA	NA	20m.pg16beta3_o2_nofp.cx9a2_bee
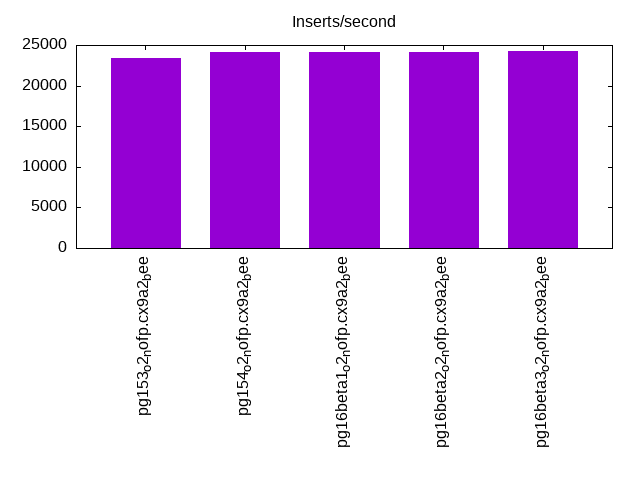
l.i1
l.i1: continue load after secondary indexes created. Graphs for performance per 1-second interval are here.
Average throughput:
Insert response time histogram: each cell has the percentage of responses that take <= the time in the header and max is the max response time in seconds. For the max column values in the top 25% of the range have a red background and in the bottom 25% of the range have a green background. The red background is not used when the min value is within 80% of the max value.
| dbms | 256us | 1ms | 4ms | 16ms | 64ms | 256ms | 1s | 4s | 16s | gt | max |
|---|---|---|---|---|---|---|---|---|---|---|---|
| pg153_o2_nofp.cx9a2_bee | 99.998 | 0.002 | nonzero | 0.026 | |||||||
| pg154_o2_nofp.cx9a2_bee | 99.999 | 0.001 | nonzero | 0.037 | |||||||
| pg16beta1_o2_nofp.cx9a2_bee | 99.999 | nonzero | nonzero | 0.020 | |||||||
| pg16beta2_o2_nofp.cx9a2_bee | 99.999 | 0.001 | nonzero | 0.022 | |||||||
| pg16beta3_o2_nofp.cx9a2_bee | 99.999 | nonzero | nonzero | 0.021 |
Delete response time histogram: each cell has the percentage of responses that take <= the time in the header and max is the max response time in seconds. For the max column values in the top 25% of the range have a red background and in the bottom 25% of the range have a green background. The red background is not used when the min value is within 80% of the max value.
| dbms | 256us | 1ms | 4ms | 16ms | 64ms | 256ms | 1s | 4s | 16s | gt | max |
|---|---|---|---|---|---|---|---|---|---|---|---|
| pg153_o2_nofp.cx9a2_bee | 0.100 | 84.138 | 7.583 | 8.179 | nonzero | 0.024 | |||||
| pg154_o2_nofp.cx9a2_bee | 0.105 | 84.026 | 9.104 | 6.765 | nonzero | 0.031 | |||||
| pg16beta1_o2_nofp.cx9a2_bee | 0.101 | 83.862 | 8.568 | 7.470 | nonzero | 0.018 | |||||
| pg16beta2_o2_nofp.cx9a2_bee | 0.097 | 83.915 | 9.132 | 6.856 | nonzero | 0.020 | |||||
| pg16beta3_o2_nofp.cx9a2_bee | 0.101 | 84.147 | 8.608 | 7.145 | nonzero | 0.019 |
Performance metrics for the DBMS listed above. Some are normalized by throughput, others are not. Legend for results is here.
ips	qps	rps	rmbps	wps	wmbps	rpq	rkbpq	wpi	wkbpi	csps	cpups	cspq	cpupq	dbgb1	dbgb2	rss	maxop	p50	p99	tag
23422	0	0	0.0	71.4	20.2	0.000	0.000	0.003	0.882	11209	23.4	0.479	80	5.1	45.1	4.7	0.026	29068	7042	20m.pg153_o2_nofp.cx9a2_bee
24137	0	0	0.0	73.0	20.7	0.000	0.000	0.003	0.880	11585	23.7	0.480	79	5.1	45.1	4.8	0.037	29132	9889	20m.pg154_o2_nofp.cx9a2_bee
24085	0	0	0.0	72.9	20.7	0.000	0.000	0.003	0.880	11575	23.7	0.481	79	5.1	45.1	4.8	0.020	29262	9789	20m.pg16beta1_o2_nofp.cx9a2_bee
24122	0	0	0.0	73.2	20.8	0.000	0.000	0.003	0.881	11585	23.7	0.480	79	5.1	45.1	5.1	0.022	29118	9989	20m.pg16beta2_o2_nofp.cx9a2_bee
24236	0	0	0.0	73.5	20.8	0.000	0.000	0.003	0.879	11639	23.8	0.480	79	5.1	45.1	4.8	0.021	29329	9939	20m.pg16beta3_o2_nofp.cx9a2_bee
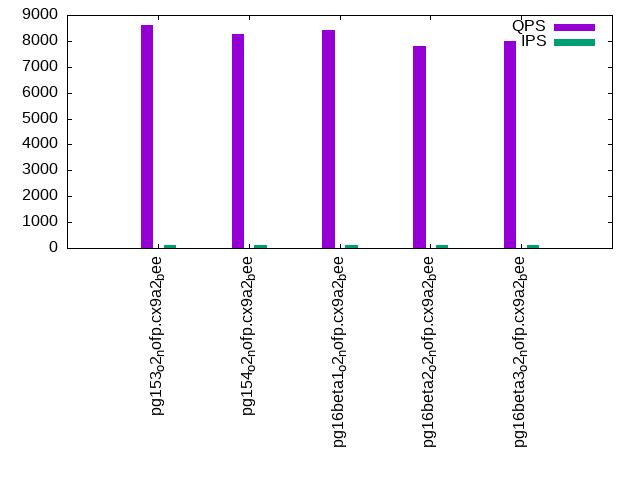
q100.1
q100.1: range queries with 100 insert/s per client. Graphs for performance per 1-second interval are here.
Average throughput:
Query response time histogram: each cell has the percentage of responses that take <= the time in the header and max is the max response time in seconds. For max values in the top 25% of the range have a red background and in the bottom 25% of the range have a green background. The red background is not used when the min value is within 80% of the max value.
| dbms | 256us | 1ms | 4ms | 16ms | 64ms | 256ms | 1s | 4s | 16s | gt | max |
|---|---|---|---|---|---|---|---|---|---|---|---|
| pg153_o2_nofp.cx9a2_bee | 99.956 | 0.044 | nonzero | 0.003 | |||||||
| pg154_o2_nofp.cx9a2_bee | 99.928 | 0.072 | nonzero | 0.003 | |||||||
| pg16beta1_o2_nofp.cx9a2_bee | 99.936 | 0.063 | nonzero | 0.003 | |||||||
| pg16beta2_o2_nofp.cx9a2_bee | 99.913 | 0.087 | nonzero | nonzero | 0.004 | ||||||
| pg16beta3_o2_nofp.cx9a2_bee | 99.923 | 0.077 | nonzero | 0.003 |
Insert response time histogram: each cell has the percentage of responses that take <= the time in the header and max is the max response time in seconds. For max values in the top 25% of the range have a red background and in the bottom 25% of the range have a green background. The red background is not used when the min value is within 80% of the max value.
| dbms | 256us | 1ms | 4ms | 16ms | 64ms | 256ms | 1s | 4s | 16s | gt | max |
|---|---|---|---|---|---|---|---|---|---|---|---|
| pg153_o2_nofp.cx9a2_bee | 99.958 | 0.042 | 0.007 | ||||||||
| pg154_o2_nofp.cx9a2_bee | 99.944 | 0.056 | 0.006 | ||||||||
| pg16beta1_o2_nofp.cx9a2_bee | 99.847 | 0.153 | 0.006 | ||||||||
| pg16beta2_o2_nofp.cx9a2_bee | 99.819 | 0.181 | 0.006 | ||||||||
| pg16beta3_o2_nofp.cx9a2_bee | 99.958 | 0.042 | 0.006 |
Delete response time histogram: each cell has the percentage of responses that take <= the time in the header and max is the max response time in seconds. For max values in the top 25% of the range have a red background and in the bottom 25% of the range have a green background. The red background is not used when the min value is within 80% of the max value.
| dbms | 256us | 1ms | 4ms | 16ms | 64ms | 256ms | 1s | 4s | 16s | gt | max |
|---|---|---|---|---|---|---|---|---|---|---|---|
| pg153_o2_nofp.cx9a2_bee | 0.042 | 99.944 | 0.014 | 0.002 | |||||||
| pg154_o2_nofp.cx9a2_bee | 0.167 | 99.819 | 0.014 | 0.002 | |||||||
| pg16beta1_o2_nofp.cx9a2_bee | 0.236 | 40.667 | 57.486 | 1.611 | 0.007 | ||||||
| pg16beta2_o2_nofp.cx9a2_bee | 0.444 | 49.486 | 41.403 | 8.667 | 0.007 | ||||||
| pg16beta3_o2_nofp.cx9a2_bee | 0.944 | 99.014 | 0.042 | 0.003 |
Performance metrics for the DBMS listed above. Some are normalized by throughput, others are not. Legend for results is here.
ips	qps	rps	rmbps	wps	wmbps	rpq	rkbpq	wpi	wkbpi	csps	cpups	cspq	cpupq	dbgb1	dbgb2	rss	maxop	p50	p99	tag
100	8605	0	0.0	47.6	2.3	0.000	0.000	0.478	23.249	33126	12.6	3.849	117	5.1	45.1	3.3	0.003	8201	7542	20m.pg153_o2_nofp.cx9a2_bee
100	8278	0	0.0	46.1	2.2	0.000	0.000	0.463	22.592	31908	12.5	3.854	121	5.1	45.1	3.3	0.003	7686	7418	20m.pg154_o2_nofp.cx9a2_bee
100	8403	0	0.0	45.8	2.2	0.000	0.000	0.459	22.739	32357	12.6	3.851	120	5.1	45.1	3.3	0.003	7795	7581	20m.pg16beta1_o2_nofp.cx9a2_bee
100	7810	0	0.0	46.0	2.2	0.000	0.000	0.461	22.685	30104	12.7	3.854	130	5.1	45.1	1.3	0.004	7592	7463	20m.pg16beta2_o2_nofp.cx9a2_bee
100	7978	0	0.0	46.0	2.2	0.000	0.000	0.462	22.514	30764	12.7	3.856	127	5.1	45.1	3.3	0.003	7522	7368	20m.pg16beta3_o2_nofp.cx9a2_bee
q500.1
q500.1: range queries with 500 insert/s per client. Graphs for performance per 1-second interval are here.
Average throughput:
Query response time histogram: each cell has the percentage of responses that take <= the time in the header and max is the max response time in seconds. For max values in the top 25% of the range have a red background and in the bottom 25% of the range have a green background. The red background is not used when the min value is within 80% of the max value.
| dbms | 256us | 1ms | 4ms | 16ms | 64ms | 256ms | 1s | 4s | 16s | gt | max |
|---|---|---|---|---|---|---|---|---|---|---|---|
| pg153_o2_nofp.cx9a2_bee | 99.935 | 0.065 | nonzero | nonzero | 0.014 | ||||||
| pg154_o2_nofp.cx9a2_bee | 99.925 | 0.075 | nonzero | nonzero | 0.014 | ||||||
| pg16beta1_o2_nofp.cx9a2_bee | 99.935 | 0.065 | nonzero | nonzero | 0.007 | ||||||
| pg16beta2_o2_nofp.cx9a2_bee | 99.934 | 0.066 | nonzero | 0.003 | |||||||
| pg16beta3_o2_nofp.cx9a2_bee | 99.932 | 0.068 | nonzero | nonzero | 0.014 |
Insert response time histogram: each cell has the percentage of responses that take <= the time in the header and max is the max response time in seconds. For max values in the top 25% of the range have a red background and in the bottom 25% of the range have a green background. The red background is not used when the min value is within 80% of the max value.
| dbms | 256us | 1ms | 4ms | 16ms | 64ms | 256ms | 1s | 4s | 16s | gt | max |
|---|---|---|---|---|---|---|---|---|---|---|---|
| pg153_o2_nofp.cx9a2_bee | 99.958 | 0.028 | 0.014 | 0.035 | |||||||
| pg154_o2_nofp.cx9a2_bee | 99.958 | 0.031 | 0.011 | 0.028 | |||||||
| pg16beta1_o2_nofp.cx9a2_bee | 99.978 | 0.014 | 0.008 | 0.024 | |||||||
| pg16beta2_o2_nofp.cx9a2_bee | 99.983 | 0.014 | 0.003 | 0.020 | |||||||
| pg16beta3_o2_nofp.cx9a2_bee | 99.961 | 0.028 | 0.011 | 0.031 |
Delete response time histogram: each cell has the percentage of responses that take <= the time in the header and max is the max response time in seconds. For max values in the top 25% of the range have a red background and in the bottom 25% of the range have a green background. The red background is not used when the min value is within 80% of the max value.
| dbms | 256us | 1ms | 4ms | 16ms | 64ms | 256ms | 1s | 4s | 16s | gt | max |
|---|---|---|---|---|---|---|---|---|---|---|---|
| pg153_o2_nofp.cx9a2_bee | 5.150 | 73.550 | 0.106 | 21.189 | 0.006 | 0.024 | |||||
| pg154_o2_nofp.cx9a2_bee | 4.597 | 74.119 | 0.156 | 21.122 | 0.006 | 0.026 | |||||
| pg16beta1_o2_nofp.cx9a2_bee | 3.769 | 84.078 | 11.303 | 0.831 | 0.019 | 0.022 | |||||
| pg16beta2_o2_nofp.cx9a2_bee | 3.911 | 83.211 | 8.619 | 4.247 | 0.011 | 0.018 | |||||
| pg16beta3_o2_nofp.cx9a2_bee | 4.197 | 72.983 | 0.092 | 22.722 | 0.006 | 0.022 |
Performance metrics for the DBMS listed above. Some are normalized by throughput, others are not. Legend for results is here.
ips	qps	rps	rmbps	wps	wmbps	rpq	rkbpq	wpi	wkbpi	csps	cpups	cspq	cpupq	dbgb1	dbgb2	rss	maxop	p50	p99	tag
499	8223	0	0.0	37.1	3.0	0.000	0.000	0.074	6.214	31784	13.0	3.865	126	5.1	41.8	2.0	0.014	7703	7526	20m.pg153_o2_nofp.cx9a2_bee
499	7911	0	0.0	39.1	3.0	0.000	0.000	0.078	6.229	30575	13.0	3.865	131	5.1	41.7	5.1	0.014	7508	7324	20m.pg154_o2_nofp.cx9a2_bee
499	8113	0	0.0	38.9	3.0	0.000	0.000	0.078	6.204	31350	12.9	3.864	127	5.1	41.8	5.1	0.007	7701	7544	20m.pg16beta1_o2_nofp.cx9a2_bee
499	7977	0	0.0	39.0	3.0	0.000	0.000	0.078	6.081	30829	12.9	3.865	129	5.1	41.7	2.0	0.003	7591	7433	20m.pg16beta2_o2_nofp.cx9a2_bee
498	8162	0	0.0	39.2	3.0	0.000	0.000	0.079	6.256	31603	13.1	3.872	128	5.1	41.7	2.0	0.014	7606	7382	20m.pg16beta3_o2_nofp.cx9a2_bee
q1000.1
q1000.1: range queries with 1000 insert/s per client. Graphs for performance per 1-second interval are here.
Average throughput:
Query response time histogram: each cell has the percentage of responses that take <= the time in the header and max is the max response time in seconds. For max values in the top 25% of the range have a red background and in the bottom 25% of the range have a green background. The red background is not used when the min value is within 80% of the max value.
| dbms | 256us | 1ms | 4ms | 16ms | 64ms | 256ms | 1s | 4s | 16s | gt | max |
|---|---|---|---|---|---|---|---|---|---|---|---|
| pg153_o2_nofp.cx9a2_bee | 99.924 | 0.075 | nonzero | nonzero | nonzero | 0.019 | |||||
| pg154_o2_nofp.cx9a2_bee | 99.929 | 0.071 | nonzero | nonzero | 0.004 | ||||||
| pg16beta1_o2_nofp.cx9a2_bee | 99.931 | 0.069 | nonzero | 0.003 | |||||||
| pg16beta2_o2_nofp.cx9a2_bee | 99.941 | 0.059 | nonzero | nonzero | nonzero | 0.027 | |||||
| pg16beta3_o2_nofp.cx9a2_bee | 99.919 | 0.081 | nonzero | nonzero | 0.004 |
Insert response time histogram: each cell has the percentage of responses that take <= the time in the header and max is the max response time in seconds. For max values in the top 25% of the range have a red background and in the bottom 25% of the range have a green background. The red background is not used when the min value is within 80% of the max value.
| dbms | 256us | 1ms | 4ms | 16ms | 64ms | 256ms | 1s | 4s | 16s | gt | max |
|---|---|---|---|---|---|---|---|---|---|---|---|
| pg153_o2_nofp.cx9a2_bee | 99.982 | 0.015 | 0.003 | 0.024 | |||||||
| pg154_o2_nofp.cx9a2_bee | 99.992 | 0.008 | 0.008 | ||||||||
| pg16beta1_o2_nofp.cx9a2_bee | 99.990 | 0.010 | 0.005 | ||||||||
| pg16beta2_o2_nofp.cx9a2_bee | 99.987 | 0.007 | 0.006 | 0.033 | |||||||
| pg16beta3_o2_nofp.cx9a2_bee | 99.996 | 0.004 | 0.007 |
Delete response time histogram: each cell has the percentage of responses that take <= the time in the header and max is the max response time in seconds. For max values in the top 25% of the range have a red background and in the bottom 25% of the range have a green background. The red background is not used when the min value is within 80% of the max value.
| dbms | 256us | 1ms | 4ms | 16ms | 64ms | 256ms | 1s | 4s | 16s | gt | max |
|---|---|---|---|---|---|---|---|---|---|---|---|
| pg153_o2_nofp.cx9a2_bee | 2.960 | 73.797 | 0.099 | 23.142 | 0.003 | 0.022 | |||||
| pg154_o2_nofp.cx9a2_bee | 3.288 | 73.756 | 0.107 | 22.850 | 0.013 | ||||||
| pg16beta1_o2_nofp.cx9a2_bee | 2.896 | 82.332 | 7.536 | 7.233 | 0.003 | 0.020 | |||||
| pg16beta2_o2_nofp.cx9a2_bee | 2.572 | 81.536 | 6.431 | 9.456 | 0.006 | 0.026 | |||||
| pg16beta3_o2_nofp.cx9a2_bee | 2.311 | 75.607 | 0.103 | 21.979 | 0.012 |
Performance metrics for the DBMS listed above. Some are normalized by throughput, others are not. Legend for results is here.
ips	qps	rps	rmbps	wps	wmbps	rpq	rkbpq	wpi	wkbpi	csps	cpups	cspq	cpupq	dbgb1	dbgb2	rss	maxop	p50	p99	tag
998	8056	0	0.0	26.6	3.3	0.000	0.000	0.027	3.394	31375	13.9	3.895	138	5.1	37.0	5.1	0.019	7616	7448	20m.pg153_o2_nofp.cx9a2_bee
998	8059	0	0.0	27.5	3.3	0.000	0.000	0.028	3.361	31366	13.8	3.892	137	5.1	37.0	2.7	0.004	7543	7335	20m.pg154_o2_nofp.cx9a2_bee
998	8093	0	0.0	27.3	3.3	0.000	0.000	0.027	3.345	31489	13.9	3.891	137	5.1	37.0	5.1	0.003	7699	7534	20m.pg16beta1_o2_nofp.cx9a2_bee
998	8312	0	0.0	26.9	3.3	0.000	0.000	0.027	3.391	32320	13.7	3.888	132	5.1	37.0	3.1	0.027	7694	7485	20m.pg16beta2_o2_nofp.cx9a2_bee
998	7621	0	0.0	27.6	3.3	0.000	0.000	0.028	3.365	29699	14.0	3.897	147	5.1	37.0	2.7	0.004	7463	7318	20m.pg16beta3_o2_nofp.cx9a2_bee
l.i0
l.i0: load without secondary indexes
Performance metrics for all DBMS, not just the ones listed above. Some are normalized by throughput, others are not. Legend for results is here.
ips	qps	rps	rmbps	wps	wmbps	rpq	rkbpq	wpi	wkbpi	csps	cpups	cspq	cpupq	dbgb1	dbgb2	rss	maxop	p50	p99	tag
70922	0	0	0.0	83.5	30.1	0.000	0.000	0.001	0.434	8753	22.3	0.123	25	1.9	5.2	0.2	0.004	71322	68116	20m.pg153_o2_nofp.cx9a2_bee
72464	0	0	0.0	85.0	30.7	0.000	0.000	0.001	0.433	8945	22.4	0.123	25	1.9	5.2	1.9	0.003	73019	64131	20m.pg154_o2_nofp.cx9a2_bee
71174	0	0	0.0	83.5	30.2	0.000	0.000	0.001	0.435	8767	22.4	0.123	25	1.9	5.2	1.9	0.003	71421	69887	20m.pg16beta1_o2_nofp.cx9a2_bee
71174	0	0	0.0	84.5	30.6	0.000	0.000	0.001	0.440	8792	22.5	0.124	25	1.9	5.2	0.2	0.003	71622	69222	20m.pg16beta2_o2_nofp.cx9a2_bee
71942	0	0	0.0	84.2	30.3	0.000	0.000	0.001	0.432	8851	22.4	0.123	25	1.9	5.2	1.5	0.005	72038	70219	20m.pg16beta3_o2_nofp.cx9a2_bee
l.x
l.x: create secondary indexes
Performance metrics for all DBMS, not just the ones listed above. Some are normalized by throughput, others are not. Legend for results is here.
ips	qps	rps	rmbps	wps	wmbps	rpq	rkbpq	wpi	wkbpi	csps	cpups	cspq	cpupq	dbgb1	dbgb2	rss	maxop	p50	p99	tag
233721	0	0	0.0	115.2	54.0	0.000	0.000	0.000	0.236	669	11.8	0.003	4	3.7	8.6	2.1	0.003	NA	NA	20m.pg153_o2_nofp.cx9a2_bee
228409	0	0	0.0	103.2	48.2	0.000	0.000	0.000	0.216	709	11.7	0.003	4	3.7	8.6	2.1	0.003	NA	NA	20m.pg154_o2_nofp.cx9a2_bee
242169	0	0	0.0	100.4	46.6	0.000	0.000	0.000	0.197	848	12.0	0.004	4	3.7	8.6	2.1	0.003	NA	NA	20m.pg16beta1_o2_nofp.cx9a2_bee
233721	0	0	0.0	112.1	52.1	0.000	0.000	0.000	0.228	782	12.1	0.003	4	3.7	8.6	2.1	0.003	NA	NA	20m.pg16beta2_o2_nofp.cx9a2_bee
239286	0	0	0.0	100.6	46.7	0.000	0.000	0.000	0.200	687	12.2	0.003	4	3.7	8.6	2.1	0.003	NA	NA	20m.pg16beta3_o2_nofp.cx9a2_bee
l.i1
l.i1: continue load after secondary indexes created
Performance metrics for all DBMS, not just the ones listed above. Some are normalized by throughput, others are not. Legend for results is here.
ips	qps	rps	rmbps	wps	wmbps	rpq	rkbpq	wpi	wkbpi	csps	cpups	cspq	cpupq	dbgb1	dbgb2	rss	maxop	p50	p99	tag
23422	0	0	0.0	71.4	20.2	0.000	0.000	0.003	0.882	11209	23.4	0.479	80	5.1	45.1	4.7	0.026	29068	7042	20m.pg153_o2_nofp.cx9a2_bee
24137	0	0	0.0	73.0	20.7	0.000	0.000	0.003	0.880	11585	23.7	0.480	79	5.1	45.1	4.8	0.037	29132	9889	20m.pg154_o2_nofp.cx9a2_bee
24085	0	0	0.0	72.9	20.7	0.000	0.000	0.003	0.880	11575	23.7	0.481	79	5.1	45.1	4.8	0.020	29262	9789	20m.pg16beta1_o2_nofp.cx9a2_bee
24122	0	0	0.0	73.2	20.8	0.000	0.000	0.003	0.881	11585	23.7	0.480	79	5.1	45.1	5.1	0.022	29118	9989	20m.pg16beta2_o2_nofp.cx9a2_bee
24236	0	0	0.0	73.5	20.8	0.000	0.000	0.003	0.879	11639	23.8	0.480	79	5.1	45.1	4.8	0.021	29329	9939	20m.pg16beta3_o2_nofp.cx9a2_bee
q100.1
q100.1: range queries with 100 insert/s per client
Performance metrics for all DBMS, not just the ones listed above. Some are normalized by throughput, others are not. Legend for results is here.
ips	qps	rps	rmbps	wps	wmbps	rpq	rkbpq	wpi	wkbpi	csps	cpups	cspq	cpupq	dbgb1	dbgb2	rss	maxop	p50	p99	tag
100	8605	0	0.0	47.6	2.3	0.000	0.000	0.478	23.249	33126	12.6	3.849	117	5.1	45.1	3.3	0.003	8201	7542	20m.pg153_o2_nofp.cx9a2_bee
100	8278	0	0.0	46.1	2.2	0.000	0.000	0.463	22.592	31908	12.5	3.854	121	5.1	45.1	3.3	0.003	7686	7418	20m.pg154_o2_nofp.cx9a2_bee
100	8403	0	0.0	45.8	2.2	0.000	0.000	0.459	22.739	32357	12.6	3.851	120	5.1	45.1	3.3	0.003	7795	7581	20m.pg16beta1_o2_nofp.cx9a2_bee
100	7810	0	0.0	46.0	2.2	0.000	0.000	0.461	22.685	30104	12.7	3.854	130	5.1	45.1	1.3	0.004	7592	7463	20m.pg16beta2_o2_nofp.cx9a2_bee
100	7978	0	0.0	46.0	2.2	0.000	0.000	0.462	22.514	30764	12.7	3.856	127	5.1	45.1	3.3	0.003	7522	7368	20m.pg16beta3_o2_nofp.cx9a2_bee
q500.1
q500.1: range queries with 500 insert/s per client
Performance metrics for all DBMS, not just the ones listed above. Some are normalized by throughput, others are not. Legend for results is here.
ips	qps	rps	rmbps	wps	wmbps	rpq	rkbpq	wpi	wkbpi	csps	cpups	cspq	cpupq	dbgb1	dbgb2	rss	maxop	p50	p99	tag
499	8223	0	0.0	37.1	3.0	0.000	0.000	0.074	6.214	31784	13.0	3.865	126	5.1	41.8	2.0	0.014	7703	7526	20m.pg153_o2_nofp.cx9a2_bee
499	7911	0	0.0	39.1	3.0	0.000	0.000	0.078	6.229	30575	13.0	3.865	131	5.1	41.7	5.1	0.014	7508	7324	20m.pg154_o2_nofp.cx9a2_bee
499	8113	0	0.0	38.9	3.0	0.000	0.000	0.078	6.204	31350	12.9	3.864	127	5.1	41.8	5.1	0.007	7701	7544	20m.pg16beta1_o2_nofp.cx9a2_bee
499	7977	0	0.0	39.0	3.0	0.000	0.000	0.078	6.081	30829	12.9	3.865	129	5.1	41.7	2.0	0.003	7591	7433	20m.pg16beta2_o2_nofp.cx9a2_bee
498	8162	0	0.0	39.2	3.0	0.000	0.000	0.079	6.256	31603	13.1	3.872	128	5.1	41.7	2.0	0.014	7606	7382	20m.pg16beta3_o2_nofp.cx9a2_bee
q1000.1
q1000.1: range queries with 1000 insert/s per client
Performance metrics for all DBMS, not just the ones listed above. Some are normalized by throughput, others are not. Legend for results is here.
ips	qps	rps	rmbps	wps	wmbps	rpq	rkbpq	wpi	wkbpi	csps	cpups	cspq	cpupq	dbgb1	dbgb2	rss	maxop	p50	p99	tag
998	8056	0	0.0	26.6	3.3	0.000	0.000	0.027	3.394	31375	13.9	3.895	138	5.1	37.0	5.1	0.019	7616	7448	20m.pg153_o2_nofp.cx9a2_bee
998	8059	0	0.0	27.5	3.3	0.000	0.000	0.028	3.361	31366	13.8	3.892	137	5.1	37.0	2.7	0.004	7543	7335	20m.pg154_o2_nofp.cx9a2_bee
998	8093	0	0.0	27.3	3.3	0.000	0.000	0.027	3.345	31489	13.9	3.891	137	5.1	37.0	5.1	0.003	7699	7534	20m.pg16beta1_o2_nofp.cx9a2_bee
998	8312	0	0.0	26.9	3.3	0.000	0.000	0.027	3.391	32320	13.7	3.888	132	5.1	37.0	3.1	0.027	7694	7485	20m.pg16beta2_o2_nofp.cx9a2_bee
998	7621	0	0.0	27.6	3.3	0.000	0.000	0.028	3.365	29699	14.0	3.897	147	5.1	37.0	2.7	0.004	7463	7318	20m.pg16beta3_o2_nofp.cx9a2_bee
l.i0
- l.i0: load without secondary indexes
- Legend for results is here.
- Each entry lists the percentage of responses that fit in that bucket (slower than max time for previous bucket, faster than min time for next bucket).
Insert response time histogram
256us	1ms	4ms	16ms	64ms	256ms	1s	4s	16s	gt	max	tag
0.000	0.000	99.999	0.001	0.000	0.000	0.000	0.000	0.000	0.000	0.004	pg153_o2_nofp.cx9a2_bee
0.000	0.000	100.000	0.000	0.000	0.000	0.000	0.000	0.000	0.000	0.003	pg154_o2_nofp.cx9a2_bee
0.000	0.000	100.000	0.000	0.000	0.000	0.000	0.000	0.000	0.000	0.003	pg16beta1_o2_nofp.cx9a2_bee
0.000	0.000	100.000	0.000	0.000	0.000	0.000	0.000	0.000	0.000	0.003	pg16beta2_o2_nofp.cx9a2_bee
0.000	0.000	99.999	0.001	0.000	0.000	0.000	0.000	0.000	0.000	0.005	pg16beta3_o2_nofp.cx9a2_bee
l.x
- l.x: create secondary indexes
- Legend for results is here.
- Each entry lists the percentage of responses that fit in that bucket (slower than max time for previous bucket, faster than min time for next bucket).
TODO - determine whether there is data for create index response time
l.i1
- l.i1: continue load after secondary indexes created
- Legend for results is here.
- Each entry lists the percentage of responses that fit in that bucket (slower than max time for previous bucket, faster than min time for next bucket).
Insert response time histogram
256us	1ms	4ms	16ms	64ms	256ms	1s	4s	16s	gt	max	tag
0.000	0.000	99.998	0.002	nonzero	0.000	0.000	0.000	0.000	0.000	0.026	pg153_o2_nofp.cx9a2_bee
0.000	0.000	99.999	0.001	nonzero	0.000	0.000	0.000	0.000	0.000	0.037	pg154_o2_nofp.cx9a2_bee
0.000	0.000	99.999	nonzero	nonzero	0.000	0.000	0.000	0.000	0.000	0.020	pg16beta1_o2_nofp.cx9a2_bee
0.000	0.000	99.999	0.001	nonzero	0.000	0.000	0.000	0.000	0.000	0.022	pg16beta2_o2_nofp.cx9a2_bee
0.000	0.000	99.999	nonzero	nonzero	0.000	0.000	0.000	0.000	0.000	0.021	pg16beta3_o2_nofp.cx9a2_bee
Delete response time histogram
256us	1ms	4ms	16ms	64ms	256ms	1s	4s	16s	gt	max	tag
0.100	84.138	7.583	8.179	nonzero	0.000	0.000	0.000	0.000	0.000	0.024	pg153_o2_nofp.cx9a2_bee
0.105	84.026	9.104	6.765	nonzero	0.000	0.000	0.000	0.000	0.000	0.031	pg154_o2_nofp.cx9a2_bee
0.101	83.862	8.568	7.470	nonzero	0.000	0.000	0.000	0.000	0.000	0.018	pg16beta1_o2_nofp.cx9a2_bee
0.097	83.915	9.132	6.856	nonzero	0.000	0.000	0.000	0.000	0.000	0.020	pg16beta2_o2_nofp.cx9a2_bee
0.101	84.147	8.608	7.145	nonzero	0.000	0.000	0.000	0.000	0.000	0.019	pg16beta3_o2_nofp.cx9a2_bee
q100.1
- q100.1: range queries with 100 insert/s per client
- Legend for results is here.
- Each entry lists the percentage of responses that fit in that bucket (slower than max time for previous bucket, faster than min time for next bucket).
Query response time histogram
256us	1ms	4ms	16ms	64ms	256ms	1s	4s	16s	gt	max	tag
99.956	0.044	nonzero	0.000	0.000	0.000	0.000	0.000	0.000	0.000	0.003	pg153_o2_nofp.cx9a2_bee
99.928	0.072	nonzero	0.000	0.000	0.000	0.000	0.000	0.000	0.000	0.003	pg154_o2_nofp.cx9a2_bee
99.936	0.063	nonzero	0.000	0.000	0.000	0.000	0.000	0.000	0.000	0.003	pg16beta1_o2_nofp.cx9a2_bee
99.913	0.087	nonzero	nonzero	0.000	0.000	0.000	0.000	0.000	0.000	0.004	pg16beta2_o2_nofp.cx9a2_bee
99.923	0.077	nonzero	0.000	0.000	0.000	0.000	0.000	0.000	0.000	0.003	pg16beta3_o2_nofp.cx9a2_bee
Insert response time histogram
256us	1ms	4ms	16ms	64ms	256ms	1s	4s	16s	gt	max	tag
0.000	0.000	99.958	0.042	0.000	0.000	0.000	0.000	0.000	0.000	0.007	pg153_o2_nofp.cx9a2_bee
0.000	0.000	99.944	0.056	0.000	0.000	0.000	0.000	0.000	0.000	0.006	pg154_o2_nofp.cx9a2_bee
0.000	0.000	99.847	0.153	0.000	0.000	0.000	0.000	0.000	0.000	0.006	pg16beta1_o2_nofp.cx9a2_bee
0.000	0.000	99.819	0.181	0.000	0.000	0.000	0.000	0.000	0.000	0.006	pg16beta2_o2_nofp.cx9a2_bee
0.000	0.000	99.958	0.042	0.000	0.000	0.000	0.000	0.000	0.000	0.006	pg16beta3_o2_nofp.cx9a2_bee
Delete response time histogram
256us	1ms	4ms	16ms	64ms	256ms	1s	4s	16s	gt	max	tag
0.042	99.944	0.014	0.000	0.000	0.000	0.000	0.000	0.000	0.000	0.002	pg153_o2_nofp.cx9a2_bee
0.167	99.819	0.014	0.000	0.000	0.000	0.000	0.000	0.000	0.000	0.002	pg154_o2_nofp.cx9a2_bee
0.236	40.667	57.486	1.611	0.000	0.000	0.000	0.000	0.000	0.000	0.007	pg16beta1_o2_nofp.cx9a2_bee
0.444	49.486	41.403	8.667	0.000	0.000	0.000	0.000	0.000	0.000	0.007	pg16beta2_o2_nofp.cx9a2_bee
0.944	99.014	0.042	0.000	0.000	0.000	0.000	0.000	0.000	0.000	0.003	pg16beta3_o2_nofp.cx9a2_bee
q500.1
- q500.1: range queries with 500 insert/s per client
- Legend for results is here.
- Each entry lists the percentage of responses that fit in that bucket (slower than max time for previous bucket, faster than min time for next bucket).
Query response time histogram
256us	1ms	4ms	16ms	64ms	256ms	1s	4s	16s	gt	max	tag
99.935	0.065	nonzero	nonzero	0.000	0.000	0.000	0.000	0.000	0.000	0.014	pg153_o2_nofp.cx9a2_bee
99.925	0.075	nonzero	nonzero	0.000	0.000	0.000	0.000	0.000	0.000	0.014	pg154_o2_nofp.cx9a2_bee
99.935	0.065	nonzero	nonzero	0.000	0.000	0.000	0.000	0.000	0.000	0.007	pg16beta1_o2_nofp.cx9a2_bee
99.934	0.066	nonzero	0.000	0.000	0.000	0.000	0.000	0.000	0.000	0.003	pg16beta2_o2_nofp.cx9a2_bee
99.932	0.068	nonzero	nonzero	0.000	0.000	0.000	0.000	0.000	0.000	0.014	pg16beta3_o2_nofp.cx9a2_bee
Insert response time histogram
256us	1ms	4ms	16ms	64ms	256ms	1s	4s	16s	gt	max	tag
0.000	0.000	99.958	0.028	0.014	0.000	0.000	0.000	0.000	0.000	0.035	pg153_o2_nofp.cx9a2_bee
0.000	0.000	99.958	0.031	0.011	0.000	0.000	0.000	0.000	0.000	0.028	pg154_o2_nofp.cx9a2_bee
0.000	0.000	99.978	0.014	0.008	0.000	0.000	0.000	0.000	0.000	0.024	pg16beta1_o2_nofp.cx9a2_bee
0.000	0.000	99.983	0.014	0.003	0.000	0.000	0.000	0.000	0.000	0.020	pg16beta2_o2_nofp.cx9a2_bee
0.000	0.000	99.961	0.028	0.011	0.000	0.000	0.000	0.000	0.000	0.031	pg16beta3_o2_nofp.cx9a2_bee
Delete response time histogram
256us	1ms	4ms	16ms	64ms	256ms	1s	4s	16s	gt	max	tag
5.150	73.550	0.106	21.189	0.006	0.000	0.000	0.000	0.000	0.000	0.024	pg153_o2_nofp.cx9a2_bee
4.597	74.119	0.156	21.122	0.006	0.000	0.000	0.000	0.000	0.000	0.026	pg154_o2_nofp.cx9a2_bee
3.769	84.078	11.303	0.831	0.019	0.000	0.000	0.000	0.000	0.000	0.022	pg16beta1_o2_nofp.cx9a2_bee
3.911	83.211	8.619	4.247	0.011	0.000	0.000	0.000	0.000	0.000	0.018	pg16beta2_o2_nofp.cx9a2_bee
4.197	72.983	0.092	22.722	0.006	0.000	0.000	0.000	0.000	0.000	0.022	pg16beta3_o2_nofp.cx9a2_bee
q1000.1
- q1000.1: range queries with 1000 insert/s per client
- Legend for results is here.
- Each entry lists the percentage of responses that fit in that bucket (slower than max time for previous bucket, faster than min time for next bucket).
Query response time histogram
256us	1ms	4ms	16ms	64ms	256ms	1s	4s	16s	gt	max	tag
99.924	0.075	nonzero	nonzero	nonzero	0.000	0.000	0.000	0.000	0.000	0.019	pg153_o2_nofp.cx9a2_bee
99.929	0.071	nonzero	nonzero	0.000	0.000	0.000	0.000	0.000	0.000	0.004	pg154_o2_nofp.cx9a2_bee
99.931	0.069	nonzero	0.000	0.000	0.000	0.000	0.000	0.000	0.000	0.003	pg16beta1_o2_nofp.cx9a2_bee
99.941	0.059	nonzero	nonzero	nonzero	0.000	0.000	0.000	0.000	0.000	0.027	pg16beta2_o2_nofp.cx9a2_bee
99.919	0.081	nonzero	nonzero	0.000	0.000	0.000	0.000	0.000	0.000	0.004	pg16beta3_o2_nofp.cx9a2_bee
Insert response time histogram
256us	1ms	4ms	16ms	64ms	256ms	1s	4s	16s	gt	max	tag
0.000	0.000	99.982	0.015	0.003	0.000	0.000	0.000	0.000	0.000	0.024	pg153_o2_nofp.cx9a2_bee
0.000	0.000	99.992	0.008	0.000	0.000	0.000	0.000	0.000	0.000	0.008	pg154_o2_nofp.cx9a2_bee
0.000	0.000	99.990	0.010	0.000	0.000	0.000	0.000	0.000	0.000	0.005	pg16beta1_o2_nofp.cx9a2_bee
0.000	0.000	99.987	0.007	0.006	0.000	0.000	0.000	0.000	0.000	0.033	pg16beta2_o2_nofp.cx9a2_bee
0.000	0.000	99.996	0.004	0.000	0.000	0.000	0.000	0.000	0.000	0.007	pg16beta3_o2_nofp.cx9a2_bee
Delete response time histogram
256us	1ms	4ms	16ms	64ms	256ms	1s	4s	16s	gt	max	tag
2.960	73.797	0.099	23.142	0.003	0.000	0.000	0.000	0.000	0.000	0.022	pg153_o2_nofp.cx9a2_bee
3.288	73.756	0.107	22.850	0.000	0.000	0.000	0.000	0.000	0.000	0.013	pg154_o2_nofp.cx9a2_bee
2.896	82.332	7.536	7.233	0.003	0.000	0.000	0.000	0.000	0.000	0.020	pg16beta1_o2_nofp.cx9a2_bee
2.572	81.536	6.431	9.456	0.006	0.000	0.000	0.000	0.000	0.000	0.026	pg16beta2_o2_nofp.cx9a2_bee
2.311	75.607	0.103	21.979	0.000	0.000	0.000	0.000	0.000	0.000	0.012	pg16beta3_o2_nofp.cx9a2_bee