Introduction
This is a report for the insert benchmark with 12000M docs and 24 client(s). It is generated by scripts (bash, awk, sed) and Tufte might not be impressed. An overview of the insert benchmark is here and a short update is here. Below, by DBMS, I mean DBMS+version.config. An example is my8020.c10b40 where my means MySQL, 8020 is version 8.0.20 and c10b40 is the name for the configuration file.
The test server has 80 cores, hyperthreads enabled, 256G RAM and fast NVMe with XFS. The benchmark was run with 24 clients and there were 1 or 3 connections per client (1 for queries or inserts without rate limits, 1+1 for rate limited inserts+deletes). There are 24 tables, with a client per table. It loads 500M rows per-table without secondary indexes, creates secondary indexes, then inserts 50M rows per-table with a delete per insert to avoid growing the table. It then does 3 read+write tests for 3600s each that do queries as fast as possible with 100, 500 and then 1000 inserts/second/client concurrent with the queries and 1000 deletes/second to avoid growing the table. The database is larger than memory.
The tested DBMS are:
- fbmy5635_202203072101.cy9c5_u - FB MySQL 5.6.35 compiled at git hash e7d976ee (7 Mar 2022 tag) with RocksDB 6.28.2, cy9c5_u config adds rocksdb_max_subcompactions=4
- fbmy5635_202205192101.cy9c5_u - FB MySQL 5.6.35 compiled at git hash d503bd77 (19 May 2022 tag) with RocksDB 7.2.2, cy9c5_u config adds rocksdb_max_subcompactions=4
- fbmy5635_202208092101.cy9c5_u - FB MySQL 5.6.35 compiled at git hash 877a0e58 (9 Aug 2022 tag) with RocksDB 7.3.1, cy9c5_u config adds rocksdb_max_subcompactions=4
- fbmy5635_202210112144.cy9c5_u - FB MySQL 5.6.35 compiled at git hash c691c716 (11 Oct 2022 tag) with RocksDB 7.3.1, cy9c5_u config adds rocksdb_max_subcompactions=4
- fbmy5635_202302162102.cy9c5_u - FB MySQL 5.6.35 compiled at git hash 21a2b0aa (16 Feb 2023 tag) with RocksDB 7.10.0, cy9c5_u config adds rocksdb_max_subcompactions=4
- fbmy5635_202304122154.cy9c5_u - FB MySQL 5.6.35 compiled at git hash 205c31dd (12 Apr 2023 tag) with RocksDB 7.10.2, cy9c5_u config adds rocksdb_max_subcompactions=4
- fbmy5635_202305292102.cy9c5_u - FB MySQL 5.6.35 compiled at git hash b739eac1 (29 May 2023 tag) with RocksDB 8.2.1, cy9c5_u config adds rocksdb_max_subcompactions=4
- fbmy5635_20230529_832.cy9c5_u - FB MySQL 5.6.35 compiled at git hash b739eac1 (29 May 2023 tag) with RocksDB 8.3.2, cy9c5_u config adds rocksdb_max_subcompactions=4
- fbmy5635_20230529_843.cy9c5_u - FB MySQL 5.6.35 compiled at git hash b739eac1 (29 May 2023 tag) with RocksDB 8.4.3, cy9c5_u config adds rocksdb_max_subcompactions=4
- fbmy5635_20230529_850.cy9c5_u - FB MySQL 5.6.35 compiled at git hash b739eac1 (29 May 2023 tag) with RocksDB 8.5.0, cy9c5_u config adds rocksdb_max_subcompactions=4
Contents
- Summary
- l.i0: load without secondary indexes
- l.x: create secondary indexes
- l.i1: continue load after secondary indexes created
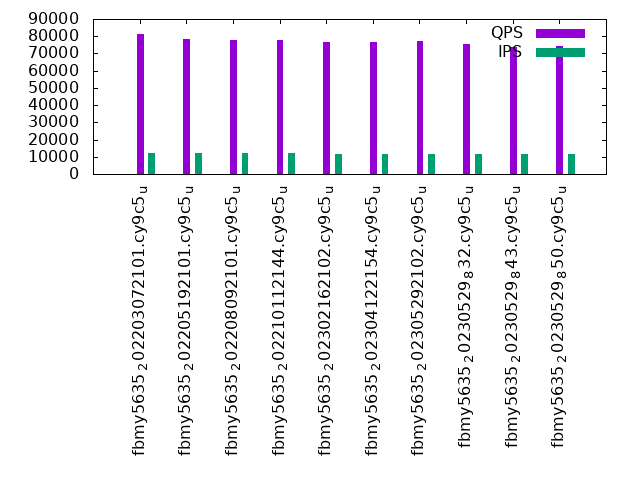
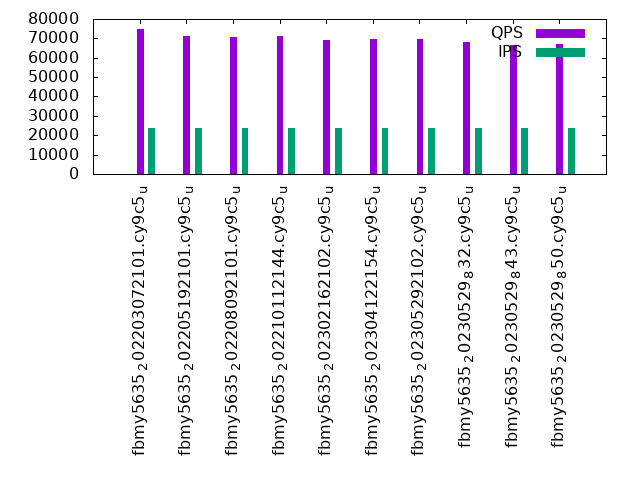
- q100.1: range queries with 100 insert/s per client
- q500.1: range queries with 500 insert/s per client
- q1000.1: range queries with 1000 insert/s per client
Summary
The numbers are inserts/s for l.i0 and l.i1, indexed docs (or rows) /s for l.x and queries/s for q100, q500, q1000. The values are the average rate over the entire test for inserts (IPS) and queries (QPS). The range of values for IPS and QPS is split into 3 parts: bottom 25%, middle 50%, top 25%. Values in the bottom 25% have a red background, values in the top 25% have a green background and values in the middle have no color. A gray background is used for values that can be ignored because the DBMS did not sustain the target insert rate. Red backgrounds are not used when the minimum value is within 80% of the max value.
| dbms | l.i0 | l.x | l.i1 | q100.1 | q500.1 | q1000.1 |
|---|---|---|---|---|---|---|
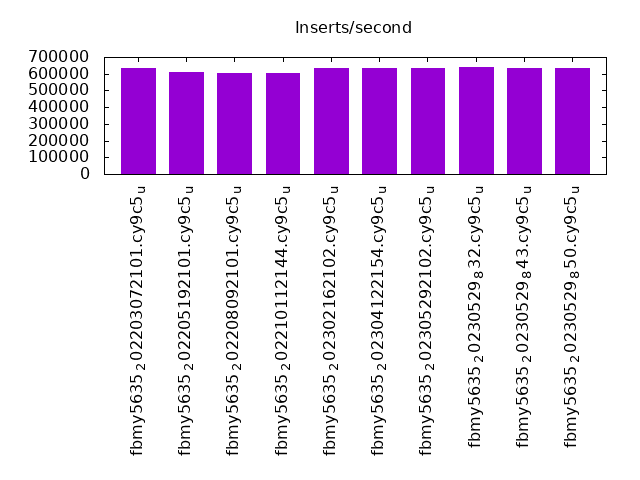
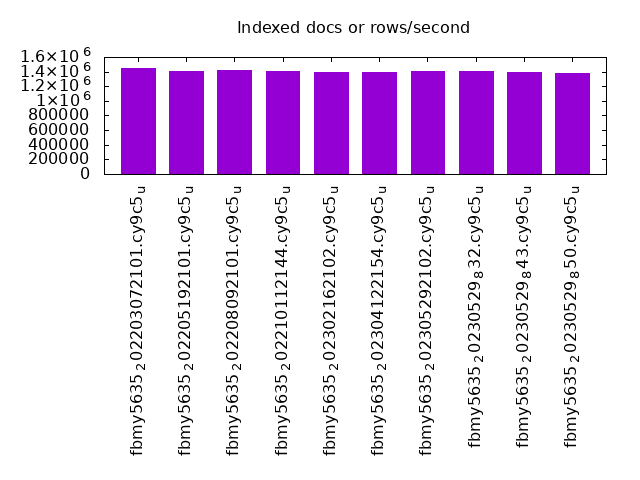
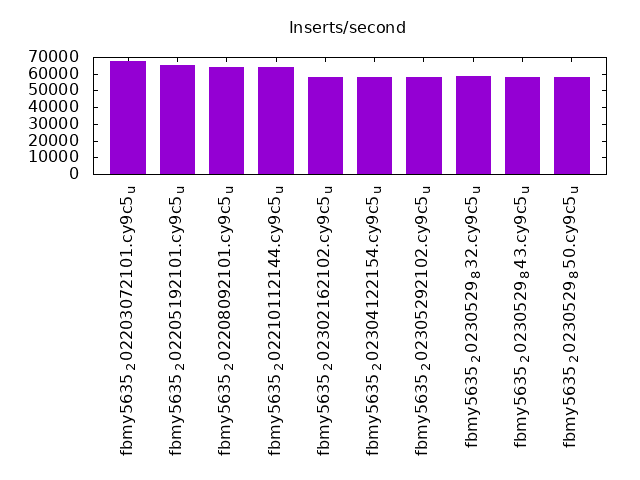
| fbmy5635_202203072101.cy9c5_u | 633279 | 1447888 | 67839 | 85825 | 81396 | 74690 |
| fbmy5635_202205192101.cy9c5_u | 611839 | 1410615 | 64918 | 82795 | 78354 | 71104 |
| fbmy5635_202208092101.cy9c5_u | 605999 | 1415440 | 64260 | 82368 | 77883 | 70878 |
| fbmy5635_202210112144.cy9c5_u | 604108 | 1409455 | 64144 | 82498 | 77681 | 70968 |
| fbmy5635_202302162102.cy9c5_u | 635526 | 1396985 | 57895 | 81526 | 76543 | 69227 |
| fbmy5635_202304122154.cy9c5_u | 634753 | 1392608 | 58002 | 82130 | 76638 | 69574 |
| fbmy5635_202305292102.cy9c5_u | 633012 | 1412441 | 57898 | 82115 | 77186 | 69814 |
| fbmy5635_20230529_832.cy9c5_u | 640205 | 1402536 | 58477 | 80494 | 75309 | 68239 |
| fbmy5635_20230529_843.cy9c5_u | 633513 | 1398776 | 58244 | 78885 | 74008 | 66478 |
| fbmy5635_20230529_850.cy9c5_u | 636638 | 1387616 | 58204 | 78975 | 74317 | 67062 |
This table has relative throughput, throughput for the DBMS relative to the DBMS in the first line, using the absolute throughput from the previous table. Values less than 0.95 have a yellow background. Values greater than 1.05 have a blue background.
| dbms | l.i0 | l.x | l.i1 | q100.1 | q500.1 | q1000.1 |
|---|---|---|---|---|---|---|
| fbmy5635_202203072101.cy9c5_u | 1.00 | 1.00 | 1.00 | 1.00 | 1.00 | 1.00 |
| fbmy5635_202205192101.cy9c5_u | 0.97 | 0.97 | 0.96 | 0.96 | 0.96 | 0.95 |
| fbmy5635_202208092101.cy9c5_u | 0.96 | 0.98 | 0.95 | 0.96 | 0.96 | 0.95 |
| fbmy5635_202210112144.cy9c5_u | 0.95 | 0.97 | 0.95 | 0.96 | 0.95 | 0.95 |
| fbmy5635_202302162102.cy9c5_u | 1.00 | 0.96 | 0.85 | 0.95 | 0.94 | 0.93 |
| fbmy5635_202304122154.cy9c5_u | 1.00 | 0.96 | 0.85 | 0.96 | 0.94 | 0.93 |
| fbmy5635_202305292102.cy9c5_u | 1.00 | 0.98 | 0.85 | 0.96 | 0.95 | 0.93 |
| fbmy5635_20230529_832.cy9c5_u | 1.01 | 0.97 | 0.86 | 0.94 | 0.93 | 0.91 |
| fbmy5635_20230529_843.cy9c5_u | 1.00 | 0.97 | 0.86 | 0.92 | 0.91 | 0.89 |
| fbmy5635_20230529_850.cy9c5_u | 1.01 | 0.96 | 0.86 | 0.92 | 0.91 | 0.90 |
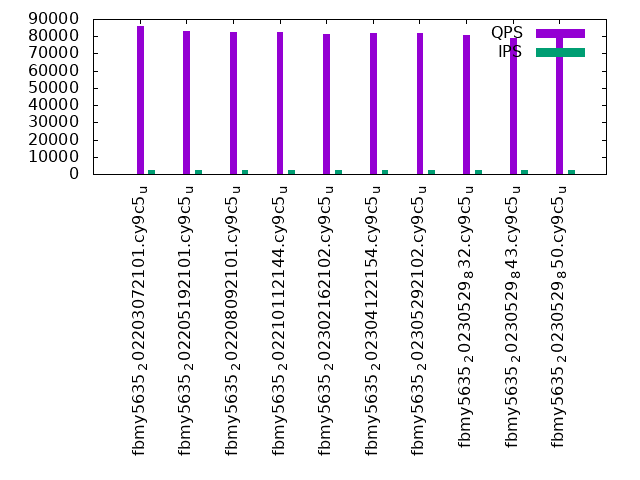
This lists the average rate of inserts/s for the tests that do inserts concurrent with queries. For such tests the query rate is listed in the table above. The read+write tests are setup so that the insert rate should match the target rate every second. Cells that are not at least 95% of the target have a red background to indicate a failure to satisfy the target.
| dbms | q100.1 | q500.1 | q1000.1 |
|---|---|---|---|
| fbmy5635_202203072101.cy9c5_u | 2381 | 11907 | 23821 |
| fbmy5635_202205192101.cy9c5_u | 2381 | 11907 | 23828 |
| fbmy5635_202208092101.cy9c5_u | 2381 | 11904 | 23828 |
| fbmy5635_202210112144.cy9c5_u | 2381 | 11907 | 23821 |
| fbmy5635_202302162102.cy9c5_u | 2374 | 11871 | 23749 |
| fbmy5635_202304122154.cy9c5_u | 2377 | 11884 | 23756 |
| fbmy5635_202305292102.cy9c5_u | 2375 | 11871 | 23736 |
| fbmy5635_20230529_832.cy9c5_u | 2376 | 11878 | 23743 |
| fbmy5635_20230529_843.cy9c5_u | 2377 | 11884 | 23756 |
| fbmy5635_20230529_850.cy9c5_u | 2379 | 11891 | 23769 |
| target | 2400 | 12000 | 24000 |
l.i0
l.i0: load without secondary indexes. Graphs for performance per 1-second interval are here.
Average throughput:
Insert response time histogram: each cell has the percentage of responses that take <= the time in the header and max is the max response time in seconds. For the max column values in the top 25% of the range have a red background and in the bottom 25% of the range have a green background. The red background is not used when the min value is within 80% of the max value.
| dbms | 256us | 1ms | 4ms | 16ms | 64ms | 256ms | 1s | 4s | 16s | gt | max |
|---|---|---|---|---|---|---|---|---|---|---|---|
| fbmy5635_202203072101.cy9c5_u | 0.017 | 74.881 | 25.059 | 0.004 | 0.040 | nonzero | 0.401 | ||||
| fbmy5635_202205192101.cy9c5_u | 0.011 | 67.565 | 32.381 | 0.003 | 0.041 | nonzero | 0.363 | ||||
| fbmy5635_202208092101.cy9c5_u | 0.010 | 65.970 | 33.978 | 0.003 | 0.040 | nonzero | 0.366 | ||||
| fbmy5635_202210112144.cy9c5_u | 0.011 | 65.110 | 34.836 | 0.003 | 0.040 | nonzero | 0.292 | ||||
| fbmy5635_202302162102.cy9c5_u | 0.007 | 76.096 | 23.853 | 0.002 | 0.041 | 0.176 | |||||
| fbmy5635_202304122154.cy9c5_u | 0.008 | 75.319 | 24.629 | 0.002 | 0.042 | 0.237 | |||||
| fbmy5635_202305292102.cy9c5_u | 0.006 | 75.466 | 24.485 | 0.002 | 0.041 | nonzero | 0.325 | ||||
| fbmy5635_20230529_832.cy9c5_u | 0.005 | 77.525 | 22.427 | 0.003 | 0.040 | 0.254 | |||||
| fbmy5635_20230529_843.cy9c5_u | 0.005 | 75.147 | 24.805 | 0.002 | 0.041 | nonzero | 0.353 | ||||
| fbmy5635_20230529_850.cy9c5_u | 0.004 | 76.998 | 22.943 | 0.010 | 0.046 | 0.237 |
Performance metrics for the DBMS listed above. Some are normalized by throughput, others are not. Legend for results is here.
ips	qps	rps	rmbps	wps	wmbps	rpq	rkbpq	wpi	wkbpi	csps	cpups	cspq	cpupq	dbgb1	dbgb2	rss	maxop	p50	p99	tag
633279	0	11	0.2	3327.8	366.0	0.000	0.000	0.005	0.592	485180	42.2	0.766	53	376.5	377.8	170.6	0.401	26573	17083	12000m.fbmy5635_202203072101.cy9c5_u
611839	0	20	0.5	3199.2	356.2	0.000	0.001	0.005	0.596	494213	42.5	0.808	56	376.4	377.9	169.9	0.363	25675	16883	12000m.fbmy5635_202205192101.cy9c5_u
605999	0	11	0.2	3139.5	351.1	0.000	0.000	0.005	0.593	484949	42.0	0.800	55	376.4	377.8	167.7	0.366	25474	16783	12000m.fbmy5635_202208092101.cy9c5_u
604108	0	15	0.3	3165.1	356.5	0.000	0.000	0.005	0.604	485062	42.1	0.803	56	376.5	378.0	169.7	0.292	25375	16184	12000m.fbmy5635_202210112144.cy9c5_u
635526	0	41	0.4	2160.9	237.7	0.000	0.001	0.003	0.383	261223	35.9	0.411	45	376.2	377.6	99.6	0.176	26973	21179	12000m.fbmy5635_202302162102.cy9c5_u
634753	0	47	0.5	2138.8	234.8	0.000	0.001	0.003	0.379	260430	35.8	0.410	45	376.2	377.6	98.6	0.237	26773	21479	12000m.fbmy5635_202304122154.cy9c5_u
633012	0	42	0.5	2133.8	236.3	0.000	0.001	0.003	0.382	281333	36.5	0.444	46	376.4	377.7	98.6	0.325	26773	21279	12000m.fbmy5635_202305292102.cy9c5_u
640205	0	43	0.5	2153.7	238.0	0.000	0.001	0.003	0.381	308274	39.1	0.482	49	376.3	377.6	98.4	0.254	27173	20779	12000m.fbmy5635_20230529_832.cy9c5_u
633513	0	62	0.6	2128.4	234.7	0.000	0.001	0.003	0.379	310643	39.5	0.490	50	376.4	377.7	98.2	0.353	26873	20380	12000m.fbmy5635_20230529_843.cy9c5_u
636638	0	199	1.3	2135.4	235.4	0.000	0.002	0.003	0.379	293754	38.9	0.461	49	376.3	377.6	97.8	0.237	27073	20277	12000m.fbmy5635_20230529_850.cy9c5_u
l.x
l.x: create secondary indexes.
Average throughput:
Performance metrics for the DBMS listed above. Some are normalized by throughput, others are not. Legend for results is here.
ips	qps	rps	rmbps	wps	wmbps	rpq	rkbpq	wpi	wkbpi	csps	cpups	cspq	cpupq	dbgb1	dbgb2	rss	maxop	p50	p99	tag
1447888	0	8250	213.5	1764.0	181.6	0.006	0.151	0.001	0.128	41693	30.3	0.029	17	772.1	773.4	207.0	0.005	NA	NA	12000m.fbmy5635_202203072101.cy9c5_u
1410615	0	6709	209.8	1721.8	175.5	0.005	0.152	0.001	0.127	40595	30.1	0.029	17	772.0	773.5	207.0	0.004	NA	NA	12000m.fbmy5635_202205192101.cy9c5_u
1415440	0	7654	210.1	1727.4	177.6	0.005	0.152	0.001	0.128	40876	30.2	0.029	17	772.0	773.4	207.0	0.003	NA	NA	12000m.fbmy5635_202208092101.cy9c5_u
1409455	0	6322	209.1	1719.9	177.4	0.004	0.152	0.001	0.129	42432	30.2	0.030	17	772.0	773.5	207.0	0.003	NA	NA	12000m.fbmy5635_202210112144.cy9c5_u
1396985	0	9474	201.0	1704.9	169.6	0.007	0.147	0.001	0.124	39465	29.8	0.028	17	771.8	773.1	208.8	0.002	NA	NA	12000m.fbmy5635_202302162102.cy9c5_u
1392608	0	7166	204.8	1699.2	174.0	0.005	0.151	0.001	0.128	40025	29.8	0.029	17	771.8	773.1	208.8	0.005	NA	NA	12000m.fbmy5635_202304122154.cy9c5_u
1412441	0	8497	208.5	1723.8	174.6	0.006	0.151	0.001	0.127	39023	29.9	0.028	17	771.9	773.3	208.8	0.003	NA	NA	12000m.fbmy5635_202305292102.cy9c5_u
1402536	0	7697	207.2	1714.0	170.1	0.005	0.151	0.001	0.124	47651	31.0	0.034	18	771.9	773.2	208.6	0.003	NA	NA	12000m.fbmy5635_20230529_832.cy9c5_u
1398776	0	7391	206.1	1708.5	170.6	0.005	0.151	0.001	0.125	51057	30.9	0.037	18	771.9	773.3	208.7	0.003	NA	NA	12000m.fbmy5635_20230529_843.cy9c5_u
1387616	0	5559	206.7	1699.2	167.2	0.004	0.153	0.001	0.123	48870	30.9	0.035	18	771.9	773.2	208.7	0.003	NA	NA	12000m.fbmy5635_20230529_850.cy9c5_u
l.i1
l.i1: continue load after secondary indexes created. Graphs for performance per 1-second interval are here.
Average throughput:
Insert response time histogram: each cell has the percentage of responses that take <= the time in the header and max is the max response time in seconds. For the max column values in the top 25% of the range have a red background and in the bottom 25% of the range have a green background. The red background is not used when the min value is within 80% of the max value.
| dbms | 256us | 1ms | 4ms | 16ms | 64ms | 256ms | 1s | 4s | 16s | gt | max |
|---|---|---|---|---|---|---|---|---|---|---|---|
| fbmy5635_202203072101.cy9c5_u | nonzero | 0.040 | 27.431 | 72.520 | 0.008 | 0.125 | |||||
| fbmy5635_202205192101.cy9c5_u | 0.033 | 21.368 | 78.591 | 0.008 | 0.143 | ||||||
| fbmy5635_202208092101.cy9c5_u | 0.038 | 20.205 | 79.751 | 0.006 | 0.132 | ||||||
| fbmy5635_202210112144.cy9c5_u | 0.034 | 20.051 | 79.908 | 0.008 | 0.126 | ||||||
| fbmy5635_202302162102.cy9c5_u | 0.035 | 11.916 | 88.028 | 0.021 | 0.161 | ||||||
| fbmy5635_202304122154.cy9c5_u | 0.035 | 11.852 | 88.094 | 0.019 | 0.200 | ||||||
| fbmy5635_202305292102.cy9c5_u | 0.044 | 11.863 | 88.074 | 0.020 | 0.178 | ||||||
| fbmy5635_20230529_832.cy9c5_u | 0.033 | 13.071 | 86.884 | 0.012 | 0.199 | ||||||
| fbmy5635_20230529_843.cy9c5_u | 0.039 | 12.856 | 87.090 | 0.015 | 0.179 | ||||||
| fbmy5635_20230529_850.cy9c5_u | 0.029 | 12.560 | 87.400 | 0.010 | 0.209 |
Delete response time histogram: each cell has the percentage of responses that take <= the time in the header and max is the max response time in seconds. For the max column values in the top 25% of the range have a red background and in the bottom 25% of the range have a green background. The red background is not used when the min value is within 80% of the max value.
| dbms | 256us | 1ms | 4ms | 16ms | 64ms | 256ms | 1s | 4s | 16s | gt | max |
|---|---|---|---|---|---|---|---|---|---|---|---|
| fbmy5635_202203072101.cy9c5_u | 0.001 | 0.040 | 29.752 | 70.198 | 0.009 | nonzero | 0.294 | ||||
| fbmy5635_202205192101.cy9c5_u | 0.001 | 0.033 | 22.722 | 77.236 | 0.008 | nonzero | 0.294 | ||||
| fbmy5635_202208092101.cy9c5_u | 0.001 | 0.037 | 21.545 | 78.411 | 0.007 | nonzero | 0.270 | ||||
| fbmy5635_202210112144.cy9c5_u | 0.001 | 0.033 | 21.232 | 78.725 | 0.008 | 0.253 | |||||
| fbmy5635_202302162102.cy9c5_u | nonzero | 0.036 | 11.418 | 88.523 | 0.022 | nonzero | 0.264 | ||||
| fbmy5635_202304122154.cy9c5_u | nonzero | 0.036 | 11.298 | 88.646 | 0.021 | 0.200 | |||||
| fbmy5635_202305292102.cy9c5_u | nonzero | 0.045 | 11.448 | 88.486 | 0.020 | 0.231 | |||||
| fbmy5635_20230529_832.cy9c5_u | nonzero | 0.034 | 12.725 | 87.227 | 0.014 | 0.199 | |||||
| fbmy5635_20230529_843.cy9c5_u | nonzero | 0.040 | 12.324 | 87.619 | 0.016 | 0.191 | |||||
| fbmy5635_20230529_850.cy9c5_u | nonzero | 0.029 | 12.132 | 87.827 | 0.011 | nonzero | 0.321 |
Performance metrics for the DBMS listed above. Some are normalized by throughput, others are not. Legend for results is here.
ips	qps	rps	rmbps	wps	wmbps	rpq	rkbpq	wpi	wkbpi	csps	cpups	cspq	cpupq	dbgb1	dbgb2	rss	maxop	p50	p99	tag
67839	0	1186	23.0	2504.3	285.3	0.017	0.348	0.037	4.306	148054	17.7	2.182	209	836.1	836.4	180.3	0.125	2847	2497	12000m.fbmy5635_202203072101.cy9c5_u
64918	0	1068	21.7	2384.6	272.8	0.016	0.343	0.037	4.303	141784	18.0	2.184	222	837.6	838.0	180.3	0.143	2697	2397	12000m.fbmy5635_202205192101.cy9c5_u
64260	0	1043	21.4	2375.2	271.5	0.016	0.341	0.037	4.326	139915	17.9	2.177	223	836.5	837.0	180.3	0.132	2697	2348	12000m.fbmy5635_202208092101.cy9c5_u
64144	0	1035	21.5	2369.7	270.7	0.016	0.343	0.037	4.322	141158	18.0	2.201	224	839.4	839.9	180.3	0.126	2697	2348	12000m.fbmy5635_202210112144.cy9c5_u
57895	0	797	14.5	1674.2	187.4	0.014	0.257	0.029	3.314	115102	15.8	1.988	218	844.0	844.4	181.9	0.161	2448	1798	12000m.fbmy5635_202302162102.cy9c5_u
58002	0	805	14.5	1676.9	188.7	0.014	0.255	0.029	3.332	116196	15.7	2.003	217	844.5	844.9	182.0	0.200	2448	1848	12000m.fbmy5635_202304122154.cy9c5_u
57898	0	808	14.7	1669.9	188.0	0.014	0.260	0.029	3.325	115552	16.0	1.996	221	841.0	841.4	182.0	0.178	2448	1798	12000m.fbmy5635_202305292102.cy9c5_u
58477	0	1870	19.0	1689.4	187.0	0.032	0.333	0.029	3.275	116816	17.1	1.998	234	844.3	844.6	181.9	0.199	2448	1849	12000m.fbmy5635_20230529_832.cy9c5_u
58244	0	1838	18.5	1670.0	186.0	0.032	0.325	0.029	3.269	112886	17.2	1.938	236	845.0	845.4	181.9	0.179	2448	1848	12000m.fbmy5635_20230529_843.cy9c5_u
58204	0	9204	50.0	1672.2	186.4	0.158	0.879	0.029	3.280	128959	17.3	2.216	238	843.4	843.8	181.9	0.209	2448	1948	12000m.fbmy5635_20230529_850.cy9c5_u
q100.1
q100.1: range queries with 100 insert/s per client. Graphs for performance per 1-second interval are here.
Average throughput:
Query response time histogram: each cell has the percentage of responses that take <= the time in the header and max is the max response time in seconds. For max values in the top 25% of the range have a red background and in the bottom 25% of the range have a green background. The red background is not used when the min value is within 80% of the max value.
| dbms | 256us | 1ms | 4ms | 16ms | 64ms | 256ms | 1s | 4s | 16s | gt | max |
|---|---|---|---|---|---|---|---|---|---|---|---|
| fbmy5635_202203072101.cy9c5_u | 56.721 | 43.196 | 0.081 | 0.002 | nonzero | nonzero | 0.076 | ||||
| fbmy5635_202205192101.cy9c5_u | 51.255 | 48.644 | 0.098 | 0.003 | nonzero | nonzero | 0.071 | ||||
| fbmy5635_202208092101.cy9c5_u | 50.845 | 49.044 | 0.108 | 0.003 | nonzero | nonzero | 0.079 | ||||
| fbmy5635_202210112144.cy9c5_u | 50.819 | 49.088 | 0.090 | 0.003 | nonzero | nonzero | 0.066 | ||||
| fbmy5635_202302162102.cy9c5_u | 47.826 | 52.095 | 0.068 | 0.006 | 0.004 | nonzero | 0.076 | ||||
| fbmy5635_202304122154.cy9c5_u | 48.816 | 51.104 | 0.071 | 0.006 | 0.004 | nonzero | 0.083 | ||||
| fbmy5635_202305292102.cy9c5_u | 49.325 | 50.593 | 0.072 | 0.006 | 0.004 | nonzero | 0.084 | ||||
| fbmy5635_20230529_832.cy9c5_u | 46.160 | 53.747 | 0.083 | 0.007 | 0.002 | nonzero | 0.084 | ||||
| fbmy5635_20230529_843.cy9c5_u | 42.356 | 57.547 | 0.088 | 0.008 | 0.002 | nonzero | 0.088 | ||||
| fbmy5635_20230529_850.cy9c5_u | 42.413 | 57.486 | 0.093 | 0.007 | 0.001 | 0.001 | 0.086 |
Insert response time histogram: each cell has the percentage of responses that take <= the time in the header and max is the max response time in seconds. For max values in the top 25% of the range have a red background and in the bottom 25% of the range have a green background. The red background is not used when the min value is within 80% of the max value.
| dbms | 256us | 1ms | 4ms | 16ms | 64ms | 256ms | 1s | 4s | 16s | gt | max |
|---|---|---|---|---|---|---|---|---|---|---|---|
| fbmy5635_202203072101.cy9c5_u | 0.003 | 99.956 | 0.041 | 0.013 | |||||||
| fbmy5635_202205192101.cy9c5_u | 99.966 | 0.032 | 0.001 | 0.001 | 0.077 | ||||||
| fbmy5635_202208092101.cy9c5_u | 99.869 | 0.131 | 0.012 | ||||||||
| fbmy5635_202210112144.cy9c5_u | 99.957 | 0.043 | 0.012 | ||||||||
| fbmy5635_202302162102.cy9c5_u | 0.013 | 99.739 | 0.201 | 0.047 | 0.043 | ||||||
| fbmy5635_202304122154.cy9c5_u | 0.013 | 99.730 | 0.204 | 0.054 | 0.026 | ||||||
| fbmy5635_202305292102.cy9c5_u | 0.008 | 99.727 | 0.202 | 0.064 | 0.054 | ||||||
| fbmy5635_20230529_832.cy9c5_u | 0.016 | 99.753 | 0.192 | 0.039 | 0.057 | ||||||
| fbmy5635_20230529_843.cy9c5_u | 0.006 | 99.781 | 0.189 | 0.024 | 0.001 | 0.079 | |||||
| fbmy5635_20230529_850.cy9c5_u | 0.010 | 99.609 | 0.354 | 0.026 | 0.001 | 0.081 |
Delete response time histogram: each cell has the percentage of responses that take <= the time in the header and max is the max response time in seconds. For max values in the top 25% of the range have a red background and in the bottom 25% of the range have a green background. The red background is not used when the min value is within 80% of the max value.
| dbms | 256us | 1ms | 4ms | 16ms | 64ms | 256ms | 1s | 4s | 16s | gt | max |
|---|---|---|---|---|---|---|---|---|---|---|---|
| fbmy5635_202203072101.cy9c5_u | 0.067 | 99.883 | 0.048 | 0.002 | 0.001 | 0.085 | |||||
| fbmy5635_202205192101.cy9c5_u | 0.010 | 99.953 | 0.033 | 0.002 | 0.002 | 0.077 | |||||
| fbmy5635_202208092101.cy9c5_u | 0.001 | 99.904 | 0.091 | 0.003 | 0.001 | 0.075 | |||||
| fbmy5635_202210112144.cy9c5_u | 0.001 | 99.948 | 0.048 | 0.002 | 0.001 | 0.065 | |||||
| fbmy5635_202302162102.cy9c5_u | 0.001 | 99.727 | 0.207 | 0.064 | 0.001 | 0.077 | |||||
| fbmy5635_202304122154.cy9c5_u | 99.716 | 0.213 | 0.071 | 0.027 | |||||||
| fbmy5635_202305292102.cy9c5_u | 99.696 | 0.220 | 0.083 | 0.002 | 0.075 | ||||||
| fbmy5635_20230529_832.cy9c5_u | 99.730 | 0.218 | 0.051 | 0.001 | 0.077 | ||||||
| fbmy5635_20230529_843.cy9c5_u | 99.759 | 0.199 | 0.039 | 0.002 | 0.081 | ||||||
| fbmy5635_20230529_850.cy9c5_u | 99.680 | 0.285 | 0.030 | 0.005 | 0.082 |
Performance metrics for the DBMS listed above. Some are normalized by throughput, others are not. Legend for results is here.
ips	qps	rps	rmbps	wps	wmbps	rpq	rkbpq	wpi	wkbpi	csps	cpups	cspq	cpupq	dbgb1	dbgb2	rss	maxop	p50	p99	tag
2381	85825	3442	27.7	123.6	13.0	0.040	0.331	0.052	5.587	415690	31.2	4.843	291	834.9	835.1	181.9	0.076	3596	2366	12000m.fbmy5635_202203072101.cy9c5_u
2381	82795	3458	27.5	125.4	13.5	0.042	0.340	0.053	5.803	402367	31.2	4.860	301	834.5	834.7	181.9	0.071	3453	2286	12000m.fbmy5635_202205192101.cy9c5_u
2381	82368	3441	27.9	122.6	13.1	0.042	0.347	0.051	5.631	397451	31.2	4.825	303	835.3	835.6	182.0	0.079	3469	2190	12000m.fbmy5635_202208092101.cy9c5_u
2381	82498	3455	27.3	120.8	12.6	0.042	0.338	0.051	5.407	396545	31.0	4.807	301	834.3	834.6	181.7	0.066	3516	2318	12000m.fbmy5635_202210112144.cy9c5_u
2374	81526	2905	26.0	104.4	10.7	0.036	0.326	0.044	4.633	381953	31.0	4.685	304	840.4	840.6	182.7	0.076	3501	2221	12000m.fbmy5635_202302162102.cy9c5_u
2377	82130	2938	26.1	106.2	10.9	0.036	0.326	0.045	4.686	385839	31.1	4.698	303	840.7	840.9	182.7	0.083	3405	2222	12000m.fbmy5635_202304122154.cy9c5_u
2375	82115	2960	26.0	108.6	11.2	0.036	0.325	0.046	4.840	385978	30.9	4.700	301	840.2	840.5	182.7	0.084	3406	2094	12000m.fbmy5635_202305292102.cy9c5_u
2376	80494	3052	26.7	105.0	11.0	0.038	0.339	0.044	4.728	380833	31.8	4.731	316	840.2	840.4	182.9	0.084	3357	2046	12000m.fbmy5635_20230529_832.cy9c5_u
2377	78885	3072	27.3	106.1	11.3	0.039	0.354	0.045	4.847	372321	31.8	4.720	322	840.7	841.0	182.6	0.088	3341	2238	12000m.fbmy5635_20230529_843.cy9c5_u
2379	78975	4113	31.1	112.4	11.8	0.052	0.403	0.047	5.085	372860	31.9	4.721	323	840.7	840.9	183.2	0.086	3309	2174	12000m.fbmy5635_20230529_850.cy9c5_u
q500.1
q500.1: range queries with 500 insert/s per client. Graphs for performance per 1-second interval are here.
Average throughput:
Query response time histogram: each cell has the percentage of responses that take <= the time in the header and max is the max response time in seconds. For max values in the top 25% of the range have a red background and in the bottom 25% of the range have a green background. The red background is not used when the min value is within 80% of the max value.
| dbms | 256us | 1ms | 4ms | 16ms | 64ms | 256ms | 1s | 4s | 16s | gt | max |
|---|---|---|---|---|---|---|---|---|---|---|---|
| fbmy5635_202203072101.cy9c5_u | 46.313 | 53.663 | 0.013 | 0.011 | nonzero | 0.001 | 0.081 | ||||
| fbmy5635_202205192101.cy9c5_u | 40.628 | 59.346 | 0.014 | 0.011 | nonzero | 0.001 | 0.080 | ||||
| fbmy5635_202208092101.cy9c5_u | 39.869 | 60.103 | 0.016 | 0.011 | nonzero | nonzero | 0.079 | ||||
| fbmy5635_202210112144.cy9c5_u | 39.171 | 60.802 | 0.016 | 0.011 | nonzero | 0.001 | 0.079 | ||||
| fbmy5635_202302162102.cy9c5_u | 38.292 | 61.643 | 0.024 | 0.016 | 0.025 | 0.033 | |||||
| fbmy5635_202304122154.cy9c5_u | 38.447 | 61.487 | 0.025 | 0.016 | 0.026 | 0.050 | |||||
| fbmy5635_202305292102.cy9c5_u | 40.280 | 59.653 | 0.025 | 0.016 | 0.026 | nonzero | 0.160 | ||||
| fbmy5635_20230529_832.cy9c5_u | 35.712 | 64.222 | 0.030 | 0.021 | 0.015 | 0.049 | |||||
| fbmy5635_20230529_843.cy9c5_u | 31.987 | 67.947 | 0.028 | 0.026 | 0.012 | 0.051 | |||||
| fbmy5635_20230529_850.cy9c5_u | 31.926 | 68.010 | 0.031 | 0.027 | 0.006 | nonzero | 0.090 |
Insert response time histogram: each cell has the percentage of responses that take <= the time in the header and max is the max response time in seconds. For max values in the top 25% of the range have a red background and in the bottom 25% of the range have a green background. The red background is not used when the min value is within 80% of the max value.
| dbms | 256us | 1ms | 4ms | 16ms | 64ms | 256ms | 1s | 4s | 16s | gt | max |
|---|---|---|---|---|---|---|---|---|---|---|---|
| fbmy5635_202203072101.cy9c5_u | 99.854 | 0.144 | 0.002 | nonzero | 0.076 | ||||||
| fbmy5635_202205192101.cy9c5_u | 96.006 | 3.992 | 0.001 | 0.001 | 0.078 | ||||||
| fbmy5635_202208092101.cy9c5_u | 95.354 | 4.644 | 0.001 | 0.001 | 0.079 | ||||||
| fbmy5635_202210112144.cy9c5_u | 80.362 | 19.632 | 0.006 | nonzero | 0.070 | ||||||
| fbmy5635_202302162102.cy9c5_u | 0.004 | 98.404 | 1.381 | 0.212 | 0.030 | ||||||
| fbmy5635_202304122154.cy9c5_u | 0.004 | 98.110 | 1.677 | 0.208 | 0.048 | ||||||
| fbmy5635_202305292102.cy9c5_u | 0.002 | 99.560 | 0.254 | 0.183 | 0.035 | ||||||
| fbmy5635_20230529_832.cy9c5_u | 0.007 | 98.922 | 0.892 | 0.178 | 0.041 | ||||||
| fbmy5635_20230529_843.cy9c5_u | 0.004 | 99.614 | 0.256 | 0.125 | nonzero | 0.067 | |||||
| fbmy5635_20230529_850.cy9c5_u | 0.004 | 99.333 | 0.576 | 0.087 | 0.035 |
Delete response time histogram: each cell has the percentage of responses that take <= the time in the header and max is the max response time in seconds. For max values in the top 25% of the range have a red background and in the bottom 25% of the range have a green background. The red background is not used when the min value is within 80% of the max value.
| dbms | 256us | 1ms | 4ms | 16ms | 64ms | 256ms | 1s | 4s | 16s | gt | max |
|---|---|---|---|---|---|---|---|---|---|---|---|
| fbmy5635_202203072101.cy9c5_u | 0.030 | 99.818 | 0.137 | 0.011 | 0.004 | 0.104 | |||||
| fbmy5635_202205192101.cy9c5_u | 96.593 | 3.397 | 0.007 | 0.003 | 0.101 | ||||||
| fbmy5635_202208092101.cy9c5_u | nonzero | 96.096 | 3.892 | 0.009 | 0.003 | 0.109 | |||||
| fbmy5635_202210112144.cy9c5_u | 81.833 | 18.153 | 0.012 | 0.003 | 0.101 | ||||||
| fbmy5635_202302162102.cy9c5_u | 98.345 | 1.424 | 0.230 | 0.030 | |||||||
| fbmy5635_202304122154.cy9c5_u | nonzero | 98.269 | 1.500 | 0.231 | 0.048 | ||||||
| fbmy5635_202305292102.cy9c5_u | 99.531 | 0.268 | 0.200 | nonzero | 0.175 | ||||||
| fbmy5635_20230529_832.cy9c5_u | 98.924 | 0.880 | 0.197 | 0.044 | |||||||
| fbmy5635_20230529_843.cy9c5_u | 99.580 | 0.270 | 0.150 | nonzero | 0.124 | ||||||
| fbmy5635_20230529_850.cy9c5_u | 99.319 | 0.574 | 0.106 | nonzero | 0.070 |
Performance metrics for the DBMS listed above. Some are normalized by throughput, others are not. Legend for results is here.
ips	qps	rps	rmbps	wps	wmbps	rpq	rkbpq	wpi	wkbpi	csps	cpups	cspq	cpupq	dbgb1	dbgb2	rss	maxop	p50	p99	tag
11907	81396	1057	8.4	483.5	55.2	0.013	0.105	0.041	4.749	410733	33.3	5.046	327	836.2	837.6	185.7	0.081	3405	2941	12000m.fbmy5635_202203072101.cy9c5_u
11907	78354	1089	8.4	484.6	54.9	0.014	0.109	0.041	4.719	398079	33.4	5.081	341	835.6	837.1	185.7	0.080	3228	2781	12000m.fbmy5635_202205192101.cy9c5_u
11904	77883	1127	8.6	491.4	55.4	0.014	0.114	0.041	4.770	391521	33.5	5.027	344	836.8	838.4	185.7	0.079	3276	2797	12000m.fbmy5635_202208092101.cy9c5_u
11907	77681	1102	8.5	484.2	54.2	0.014	0.112	0.041	4.659	390825	33.6	5.031	346	835.8	837.3	185.8	0.079	3277	2829	12000m.fbmy5635_202210112144.cy9c5_u
11871	76543	715	10.0	391.6	42.2	0.009	0.133	0.033	3.637	368386	33.0	4.813	345	841.8	843.3	186.0	0.033	3277	2366	12000m.fbmy5635_202302162102.cy9c5_u
11884	76638	764	10.1	388.1	42.1	0.010	0.136	0.033	3.624	369661	33.0	4.823	344	842.7	844.2	185.8	0.050	3196	2206	12000m.fbmy5635_202304122154.cy9c5_u
11871	77186	642	9.8	387.8	42.6	0.008	0.130	0.033	3.672	371530	32.9	4.813	341	843.0	844.4	185.6	0.160	3245	2334	12000m.fbmy5635_202305292102.cy9c5_u
11878	75309	742	10.3	395.0	43.6	0.010	0.140	0.033	3.761	365871	34.0	4.858	361	841.7	843.1	185.8	0.049	3149	2366	12000m.fbmy5635_20230529_832.cy9c5_u
11884	74008	697	9.6	382.2	42.0	0.009	0.133	0.032	3.617	357521	34.0	4.831	368	843.5	844.9	185.7	0.051	3117	2317	12000m.fbmy5635_20230529_843.cy9c5_u
11891	74317	2704	17.5	384.4	42.6	0.036	0.241	0.032	3.671	360325	33.9	4.848	365	843.7	845.1	185.9	0.090	3085	2350	12000m.fbmy5635_20230529_850.cy9c5_u
q1000.1
q1000.1: range queries with 1000 insert/s per client. Graphs for performance per 1-second interval are here.
Average throughput:
Query response time histogram: each cell has the percentage of responses that take <= the time in the header and max is the max response time in seconds. For max values in the top 25% of the range have a red background and in the bottom 25% of the range have a green background. The red background is not used when the min value is within 80% of the max value.
| dbms | 256us | 1ms | 4ms | 16ms | 64ms | 256ms | 1s | 4s | 16s | gt | max |
|---|---|---|---|---|---|---|---|---|---|---|---|
| fbmy5635_202203072101.cy9c5_u | 31.908 | 68.028 | 0.039 | 0.024 | nonzero | nonzero | nonzero | 0.306 | |||
| fbmy5635_202205192101.cy9c5_u | 25.245 | 74.687 | 0.044 | 0.025 | nonzero | nonzero | 0.112 | ||||
| fbmy5635_202208092101.cy9c5_u | 24.323 | 75.604 | 0.048 | 0.025 | nonzero | nonzero | 0.095 | ||||
| fbmy5635_202210112144.cy9c5_u | 24.979 | 74.952 | 0.044 | 0.025 | nonzero | 0.059 | |||||
| fbmy5635_202302162102.cy9c5_u | 23.333 | 76.591 | 0.027 | 0.018 | 0.031 | nonzero | 0.077 | ||||
| fbmy5635_202304122154.cy9c5_u | 24.026 | 75.891 | 0.033 | 0.017 | 0.032 | nonzero | 0.077 | ||||
| fbmy5635_202305292102.cy9c5_u | 24.817 | 75.105 | 0.028 | 0.019 | 0.031 | nonzero | 0.094 | ||||
| fbmy5635_20230529_832.cy9c5_u | 21.895 | 78.018 | 0.041 | 0.016 | 0.030 | nonzero | 0.087 | ||||
| fbmy5635_20230529_843.cy9c5_u | 17.267 | 82.649 | 0.037 | 0.018 | 0.029 | nonzero | 0.109 | ||||
| fbmy5635_20230529_850.cy9c5_u | 18.391 | 81.524 | 0.040 | 0.023 | 0.021 | nonzero | 0.068 |
Insert response time histogram: each cell has the percentage of responses that take <= the time in the header and max is the max response time in seconds. For max values in the top 25% of the range have a red background and in the bottom 25% of the range have a green background. The red background is not used when the min value is within 80% of the max value.
| dbms | 256us | 1ms | 4ms | 16ms | 64ms | 256ms | 1s | 4s | 16s | gt | max |
|---|---|---|---|---|---|---|---|---|---|---|---|
| fbmy5635_202203072101.cy9c5_u | 31.225 | 44.542 | 24.232 | 0.001 | 0.070 | ||||||
| fbmy5635_202205192101.cy9c5_u | 18.145 | 50.747 | 31.107 | nonzero | 0.066 | ||||||
| fbmy5635_202208092101.cy9c5_u | 14.774 | 36.236 | 48.990 | 0.055 | |||||||
| fbmy5635_202210112144.cy9c5_u | 15.694 | 75.899 | 8.407 | 0.057 | |||||||
| fbmy5635_202302162102.cy9c5_u | 13.544 | 81.073 | 5.366 | 0.017 | 0.099 | ||||||
| fbmy5635_202304122154.cy9c5_u | 28.103 | 23.078 | 48.802 | 0.017 | 0.109 | ||||||
| fbmy5635_202305292102.cy9c5_u | 34.847 | 34.227 | 30.899 | 0.027 | 0.105 | ||||||
| fbmy5635_20230529_832.cy9c5_u | 18.535 | 28.755 | 52.704 | 0.005 | 0.101 | ||||||
| fbmy5635_20230529_843.cy9c5_u | nonzero | 15.408 | 83.101 | 1.490 | 0.001 | 0.065 | |||||
| fbmy5635_20230529_850.cy9c5_u | 26.198 | 72.441 | 1.360 | 0.001 | 0.078 |
Delete response time histogram: each cell has the percentage of responses that take <= the time in the header and max is the max response time in seconds. For max values in the top 25% of the range have a red background and in the bottom 25% of the range have a green background. The red background is not used when the min value is within 80% of the max value.
| dbms | 256us | 1ms | 4ms | 16ms | 64ms | 256ms | 1s | 4s | 16s | gt | max |
|---|---|---|---|---|---|---|---|---|---|---|---|
| fbmy5635_202203072101.cy9c5_u | nonzero | 31.555 | 44.727 | 23.714 | 0.002 | nonzero | 0.322 | ||||
| fbmy5635_202205192101.cy9c5_u | 18.688 | 50.970 | 30.341 | 0.001 | 0.115 | ||||||
| fbmy5635_202208092101.cy9c5_u | 14.944 | 37.018 | 48.037 | 0.001 | 0.102 | ||||||
| fbmy5635_202210112144.cy9c5_u | 16.575 | 75.385 | 8.039 | 0.001 | 0.096 | ||||||
| fbmy5635_202302162102.cy9c5_u | 12.887 | 81.468 | 5.627 | 0.019 | 0.098 | ||||||
| fbmy5635_202304122154.cy9c5_u | 27.724 | 22.790 | 49.467 | 0.018 | 0.109 | ||||||
| fbmy5635_202305292102.cy9c5_u | 33.745 | 34.671 | 31.558 | 0.026 | 0.112 | ||||||
| fbmy5635_20230529_832.cy9c5_u | 18.160 | 28.265 | 53.570 | 0.005 | 0.103 | ||||||
| fbmy5635_20230529_843.cy9c5_u | 14.782 | 83.665 | 1.553 | 0.001 | 0.121 | ||||||
| fbmy5635_20230529_850.cy9c5_u | 25.716 | 72.829 | 1.454 | 0.001 | 0.078 |
Performance metrics for the DBMS listed above. Some are normalized by throughput, others are not. Legend for results is here.
ips	qps	rps	rmbps	wps	wmbps	rpq	rkbpq	wpi	wkbpi	csps	cpups	cspq	cpupq	dbgb1	dbgb2	rss	maxop	p50	p99	tag
23821	74690	2277	18.3	978.4	111.3	0.030	0.251	0.041	4.786	418543	36.8	5.604	394	835.9	837.7	187.0	0.306	3101	2653	12000m.fbmy5635_202203072101.cy9c5_u
23828	71104	2326	18.5	975.3	110.9	0.033	0.267	0.041	4.765	403580	37.5	5.676	422	836.1	838.1	186.9	0.112	2909	2509	12000m.fbmy5635_202205192101.cy9c5_u
23828	70878	2317	18.7	982.4	112.2	0.033	0.270	0.041	4.821	397708	37.5	5.611	423	836.5	836.5	187.0	0.095	2957	2541	12000m.fbmy5635_202208092101.cy9c5_u
23821	70968	2597	19.5	985.0	111.2	0.037	0.281	0.041	4.780	396644	37.5	5.589	423	836.1	836.1	187.1	0.059	2989	2557	12000m.fbmy5635_202210112144.cy9c5_u
23749	69227	1433	15.1	770.9	84.9	0.021	0.223	0.032	3.659	364086	36.6	5.259	423	844.9	846.8	187.2	0.077	2925	1934	12000m.fbmy5635_202302162102.cy9c5_u
23756	69574	1467	16.0	774.6	85.9	0.021	0.236	0.033	3.701	365843	36.7	5.258	422	844.9	846.9	186.9	0.077	2941	1998	12000m.fbmy5635_202304122154.cy9c5_u
23736	69814	1278	16.8	806.4	88.7	0.018	0.246	0.034	3.828	366307	36.9	5.247	423	842.3	844.3	186.7	0.094	2957	1902	12000m.fbmy5635_202305292102.cy9c5_u
23743	68239	1280	16.1	774.6	85.9	0.019	0.241	0.033	3.705	363009	37.7	5.320	442	845.7	847.0	187.0	0.087	2893	1982	12000m.fbmy5635_20230529_832.cy9c5_u
23756	66478	1330	17.3	800.5	89.5	0.020	0.267	0.034	3.856	351459	38.2	5.287	460	842.7	844.7	186.8	0.109	2782	1854	12000m.fbmy5635_20230529_843.cy9c5_u
23769	67062	6479	36.8	776.8	86.7	0.097	0.561	0.033	3.734	359246	38.2	5.357	456	844.2	846.1	187.1	0.068	2782	1950	12000m.fbmy5635_20230529_850.cy9c5_u
l.i0
l.i0: load without secondary indexes
Performance metrics for all DBMS, not just the ones listed above. Some are normalized by throughput, others are not. Legend for results is here.
ips	qps	rps	rmbps	wps	wmbps	rpq	rkbpq	wpi	wkbpi	csps	cpups	cspq	cpupq	dbgb1	dbgb2	rss	maxop	p50	p99	tag
633279	0	11	0.2	3327.8	366.0	0.000	0.000	0.005	0.592	485180	42.2	0.766	53	376.5	377.8	170.6	0.401	26573	17083	12000m.fbmy5635_202203072101.cy9c5_u
611839	0	20	0.5	3199.2	356.2	0.000	0.001	0.005	0.596	494213	42.5	0.808	56	376.4	377.9	169.9	0.363	25675	16883	12000m.fbmy5635_202205192101.cy9c5_u
605999	0	11	0.2	3139.5	351.1	0.000	0.000	0.005	0.593	484949	42.0	0.800	55	376.4	377.8	167.7	0.366	25474	16783	12000m.fbmy5635_202208092101.cy9c5_u
604108	0	15	0.3	3165.1	356.5	0.000	0.000	0.005	0.604	485062	42.1	0.803	56	376.5	378.0	169.7	0.292	25375	16184	12000m.fbmy5635_202210112144.cy9c5_u
635526	0	41	0.4	2160.9	237.7	0.000	0.001	0.003	0.383	261223	35.9	0.411	45	376.2	377.6	99.6	0.176	26973	21179	12000m.fbmy5635_202302162102.cy9c5_u
634753	0	47	0.5	2138.8	234.8	0.000	0.001	0.003	0.379	260430	35.8	0.410	45	376.2	377.6	98.6	0.237	26773	21479	12000m.fbmy5635_202304122154.cy9c5_u
633012	0	42	0.5	2133.8	236.3	0.000	0.001	0.003	0.382	281333	36.5	0.444	46	376.4	377.7	98.6	0.325	26773	21279	12000m.fbmy5635_202305292102.cy9c5_u
640205	0	43	0.5	2153.7	238.0	0.000	0.001	0.003	0.381	308274	39.1	0.482	49	376.3	377.6	98.4	0.254	27173	20779	12000m.fbmy5635_20230529_832.cy9c5_u
633513	0	62	0.6	2128.4	234.7	0.000	0.001	0.003	0.379	310643	39.5	0.490	50	376.4	377.7	98.2	0.353	26873	20380	12000m.fbmy5635_20230529_843.cy9c5_u
636638	0	199	1.3	2135.4	235.4	0.000	0.002	0.003	0.379	293754	38.9	0.461	49	376.3	377.6	97.8	0.237	27073	20277	12000m.fbmy5635_20230529_850.cy9c5_u
l.x
l.x: create secondary indexes
Performance metrics for all DBMS, not just the ones listed above. Some are normalized by throughput, others are not. Legend for results is here.
ips	qps	rps	rmbps	wps	wmbps	rpq	rkbpq	wpi	wkbpi	csps	cpups	cspq	cpupq	dbgb1	dbgb2	rss	maxop	p50	p99	tag
1447888	0	8250	213.5	1764.0	181.6	0.006	0.151	0.001	0.128	41693	30.3	0.029	17	772.1	773.4	207.0	0.005	NA	NA	12000m.fbmy5635_202203072101.cy9c5_u
1410615	0	6709	209.8	1721.8	175.5	0.005	0.152	0.001	0.127	40595	30.1	0.029	17	772.0	773.5	207.0	0.004	NA	NA	12000m.fbmy5635_202205192101.cy9c5_u
1415440	0	7654	210.1	1727.4	177.6	0.005	0.152	0.001	0.128	40876	30.2	0.029	17	772.0	773.4	207.0	0.003	NA	NA	12000m.fbmy5635_202208092101.cy9c5_u
1409455	0	6322	209.1	1719.9	177.4	0.004	0.152	0.001	0.129	42432	30.2	0.030	17	772.0	773.5	207.0	0.003	NA	NA	12000m.fbmy5635_202210112144.cy9c5_u
1396985	0	9474	201.0	1704.9	169.6	0.007	0.147	0.001	0.124	39465	29.8	0.028	17	771.8	773.1	208.8	0.002	NA	NA	12000m.fbmy5635_202302162102.cy9c5_u
1392608	0	7166	204.8	1699.2	174.0	0.005	0.151	0.001	0.128	40025	29.8	0.029	17	771.8	773.1	208.8	0.005	NA	NA	12000m.fbmy5635_202304122154.cy9c5_u
1412441	0	8497	208.5	1723.8	174.6	0.006	0.151	0.001	0.127	39023	29.9	0.028	17	771.9	773.3	208.8	0.003	NA	NA	12000m.fbmy5635_202305292102.cy9c5_u
1402536	0	7697	207.2	1714.0	170.1	0.005	0.151	0.001	0.124	47651	31.0	0.034	18	771.9	773.2	208.6	0.003	NA	NA	12000m.fbmy5635_20230529_832.cy9c5_u
1398776	0	7391	206.1	1708.5	170.6	0.005	0.151	0.001	0.125	51057	30.9	0.037	18	771.9	773.3	208.7	0.003	NA	NA	12000m.fbmy5635_20230529_843.cy9c5_u
1387616	0	5559	206.7	1699.2	167.2	0.004	0.153	0.001	0.123	48870	30.9	0.035	18	771.9	773.2	208.7	0.003	NA	NA	12000m.fbmy5635_20230529_850.cy9c5_u
l.i1
l.i1: continue load after secondary indexes created
Performance metrics for all DBMS, not just the ones listed above. Some are normalized by throughput, others are not. Legend for results is here.
ips	qps	rps	rmbps	wps	wmbps	rpq	rkbpq	wpi	wkbpi	csps	cpups	cspq	cpupq	dbgb1	dbgb2	rss	maxop	p50	p99	tag
67839	0	1186	23.0	2504.3	285.3	0.017	0.348	0.037	4.306	148054	17.7	2.182	209	836.1	836.4	180.3	0.125	2847	2497	12000m.fbmy5635_202203072101.cy9c5_u
64918	0	1068	21.7	2384.6	272.8	0.016	0.343	0.037	4.303	141784	18.0	2.184	222	837.6	838.0	180.3	0.143	2697	2397	12000m.fbmy5635_202205192101.cy9c5_u
64260	0	1043	21.4	2375.2	271.5	0.016	0.341	0.037	4.326	139915	17.9	2.177	223	836.5	837.0	180.3	0.132	2697	2348	12000m.fbmy5635_202208092101.cy9c5_u
64144	0	1035	21.5	2369.7	270.7	0.016	0.343	0.037	4.322	141158	18.0	2.201	224	839.4	839.9	180.3	0.126	2697	2348	12000m.fbmy5635_202210112144.cy9c5_u
57895	0	797	14.5	1674.2	187.4	0.014	0.257	0.029	3.314	115102	15.8	1.988	218	844.0	844.4	181.9	0.161	2448	1798	12000m.fbmy5635_202302162102.cy9c5_u
58002	0	805	14.5	1676.9	188.7	0.014	0.255	0.029	3.332	116196	15.7	2.003	217	844.5	844.9	182.0	0.200	2448	1848	12000m.fbmy5635_202304122154.cy9c5_u
57898	0	808	14.7	1669.9	188.0	0.014	0.260	0.029	3.325	115552	16.0	1.996	221	841.0	841.4	182.0	0.178	2448	1798	12000m.fbmy5635_202305292102.cy9c5_u
58477	0	1870	19.0	1689.4	187.0	0.032	0.333	0.029	3.275	116816	17.1	1.998	234	844.3	844.6	181.9	0.199	2448	1849	12000m.fbmy5635_20230529_832.cy9c5_u
58244	0	1838	18.5	1670.0	186.0	0.032	0.325	0.029	3.269	112886	17.2	1.938	236	845.0	845.4	181.9	0.179	2448	1848	12000m.fbmy5635_20230529_843.cy9c5_u
58204	0	9204	50.0	1672.2	186.4	0.158	0.879	0.029	3.280	128959	17.3	2.216	238	843.4	843.8	181.9	0.209	2448	1948	12000m.fbmy5635_20230529_850.cy9c5_u
q100.1
q100.1: range queries with 100 insert/s per client
Performance metrics for all DBMS, not just the ones listed above. Some are normalized by throughput, others are not. Legend for results is here.
ips	qps	rps	rmbps	wps	wmbps	rpq	rkbpq	wpi	wkbpi	csps	cpups	cspq	cpupq	dbgb1	dbgb2	rss	maxop	p50	p99	tag
2381	85825	3442	27.7	123.6	13.0	0.040	0.331	0.052	5.587	415690	31.2	4.843	291	834.9	835.1	181.9	0.076	3596	2366	12000m.fbmy5635_202203072101.cy9c5_u
2381	82795	3458	27.5	125.4	13.5	0.042	0.340	0.053	5.803	402367	31.2	4.860	301	834.5	834.7	181.9	0.071	3453	2286	12000m.fbmy5635_202205192101.cy9c5_u
2381	82368	3441	27.9	122.6	13.1	0.042	0.347	0.051	5.631	397451	31.2	4.825	303	835.3	835.6	182.0	0.079	3469	2190	12000m.fbmy5635_202208092101.cy9c5_u
2381	82498	3455	27.3	120.8	12.6	0.042	0.338	0.051	5.407	396545	31.0	4.807	301	834.3	834.6	181.7	0.066	3516	2318	12000m.fbmy5635_202210112144.cy9c5_u
2374	81526	2905	26.0	104.4	10.7	0.036	0.326	0.044	4.633	381953	31.0	4.685	304	840.4	840.6	182.7	0.076	3501	2221	12000m.fbmy5635_202302162102.cy9c5_u
2377	82130	2938	26.1	106.2	10.9	0.036	0.326	0.045	4.686	385839	31.1	4.698	303	840.7	840.9	182.7	0.083	3405	2222	12000m.fbmy5635_202304122154.cy9c5_u
2375	82115	2960	26.0	108.6	11.2	0.036	0.325	0.046	4.840	385978	30.9	4.700	301	840.2	840.5	182.7	0.084	3406	2094	12000m.fbmy5635_202305292102.cy9c5_u
2376	80494	3052	26.7	105.0	11.0	0.038	0.339	0.044	4.728	380833	31.8	4.731	316	840.2	840.4	182.9	0.084	3357	2046	12000m.fbmy5635_20230529_832.cy9c5_u
2377	78885	3072	27.3	106.1	11.3	0.039	0.354	0.045	4.847	372321	31.8	4.720	322	840.7	841.0	182.6	0.088	3341	2238	12000m.fbmy5635_20230529_843.cy9c5_u
2379	78975	4113	31.1	112.4	11.8	0.052	0.403	0.047	5.085	372860	31.9	4.721	323	840.7	840.9	183.2	0.086	3309	2174	12000m.fbmy5635_20230529_850.cy9c5_u
q500.1
q500.1: range queries with 500 insert/s per client
Performance metrics for all DBMS, not just the ones listed above. Some are normalized by throughput, others are not. Legend for results is here.
ips	qps	rps	rmbps	wps	wmbps	rpq	rkbpq	wpi	wkbpi	csps	cpups	cspq	cpupq	dbgb1	dbgb2	rss	maxop	p50	p99	tag
11907	81396	1057	8.4	483.5	55.2	0.013	0.105	0.041	4.749	410733	33.3	5.046	327	836.2	837.6	185.7	0.081	3405	2941	12000m.fbmy5635_202203072101.cy9c5_u
11907	78354	1089	8.4	484.6	54.9	0.014	0.109	0.041	4.719	398079	33.4	5.081	341	835.6	837.1	185.7	0.080	3228	2781	12000m.fbmy5635_202205192101.cy9c5_u
11904	77883	1127	8.6	491.4	55.4	0.014	0.114	0.041	4.770	391521	33.5	5.027	344	836.8	838.4	185.7	0.079	3276	2797	12000m.fbmy5635_202208092101.cy9c5_u
11907	77681	1102	8.5	484.2	54.2	0.014	0.112	0.041	4.659	390825	33.6	5.031	346	835.8	837.3	185.8	0.079	3277	2829	12000m.fbmy5635_202210112144.cy9c5_u
11871	76543	715	10.0	391.6	42.2	0.009	0.133	0.033	3.637	368386	33.0	4.813	345	841.8	843.3	186.0	0.033	3277	2366	12000m.fbmy5635_202302162102.cy9c5_u
11884	76638	764	10.1	388.1	42.1	0.010	0.136	0.033	3.624	369661	33.0	4.823	344	842.7	844.2	185.8	0.050	3196	2206	12000m.fbmy5635_202304122154.cy9c5_u
11871	77186	642	9.8	387.8	42.6	0.008	0.130	0.033	3.672	371530	32.9	4.813	341	843.0	844.4	185.6	0.160	3245	2334	12000m.fbmy5635_202305292102.cy9c5_u
11878	75309	742	10.3	395.0	43.6	0.010	0.140	0.033	3.761	365871	34.0	4.858	361	841.7	843.1	185.8	0.049	3149	2366	12000m.fbmy5635_20230529_832.cy9c5_u
11884	74008	697	9.6	382.2	42.0	0.009	0.133	0.032	3.617	357521	34.0	4.831	368	843.5	844.9	185.7	0.051	3117	2317	12000m.fbmy5635_20230529_843.cy9c5_u
11891	74317	2704	17.5	384.4	42.6	0.036	0.241	0.032	3.671	360325	33.9	4.848	365	843.7	845.1	185.9	0.090	3085	2350	12000m.fbmy5635_20230529_850.cy9c5_u
q1000.1
q1000.1: range queries with 1000 insert/s per client
Performance metrics for all DBMS, not just the ones listed above. Some are normalized by throughput, others are not. Legend for results is here.
ips	qps	rps	rmbps	wps	wmbps	rpq	rkbpq	wpi	wkbpi	csps	cpups	cspq	cpupq	dbgb1	dbgb2	rss	maxop	p50	p99	tag
23821	74690	2277	18.3	978.4	111.3	0.030	0.251	0.041	4.786	418543	36.8	5.604	394	835.9	837.7	187.0	0.306	3101	2653	12000m.fbmy5635_202203072101.cy9c5_u
23828	71104	2326	18.5	975.3	110.9	0.033	0.267	0.041	4.765	403580	37.5	5.676	422	836.1	838.1	186.9	0.112	2909	2509	12000m.fbmy5635_202205192101.cy9c5_u
23828	70878	2317	18.7	982.4	112.2	0.033	0.270	0.041	4.821	397708	37.5	5.611	423	836.5	836.5	187.0	0.095	2957	2541	12000m.fbmy5635_202208092101.cy9c5_u
23821	70968	2597	19.5	985.0	111.2	0.037	0.281	0.041	4.780	396644	37.5	5.589	423	836.1	836.1	187.1	0.059	2989	2557	12000m.fbmy5635_202210112144.cy9c5_u
23749	69227	1433	15.1	770.9	84.9	0.021	0.223	0.032	3.659	364086	36.6	5.259	423	844.9	846.8	187.2	0.077	2925	1934	12000m.fbmy5635_202302162102.cy9c5_u
23756	69574	1467	16.0	774.6	85.9	0.021	0.236	0.033	3.701	365843	36.7	5.258	422	844.9	846.9	186.9	0.077	2941	1998	12000m.fbmy5635_202304122154.cy9c5_u
23736	69814	1278	16.8	806.4	88.7	0.018	0.246	0.034	3.828	366307	36.9	5.247	423	842.3	844.3	186.7	0.094	2957	1902	12000m.fbmy5635_202305292102.cy9c5_u
23743	68239	1280	16.1	774.6	85.9	0.019	0.241	0.033	3.705	363009	37.7	5.320	442	845.7	847.0	187.0	0.087	2893	1982	12000m.fbmy5635_20230529_832.cy9c5_u
23756	66478	1330	17.3	800.5	89.5	0.020	0.267	0.034	3.856	351459	38.2	5.287	460	842.7	844.7	186.8	0.109	2782	1854	12000m.fbmy5635_20230529_843.cy9c5_u
23769	67062	6479	36.8	776.8	86.7	0.097	0.561	0.033	3.734	359246	38.2	5.357	456	844.2	846.1	187.1	0.068	2782	1950	12000m.fbmy5635_20230529_850.cy9c5_u
l.i0
- l.i0: load without secondary indexes
- Legend for results is here.
- Each entry lists the percentage of responses that fit in that bucket (slower than max time for previous bucket, faster than min time for next bucket).
Insert response time histogram
256us	1ms	4ms	16ms	64ms	256ms	1s	4s	16s	gt	max	tag
0.000	0.017	74.881	25.059	0.004	0.040	nonzero	0.000	0.000	0.000	0.401	fbmy5635_202203072101.cy9c5_u
0.000	0.011	67.565	32.381	0.003	0.041	nonzero	0.000	0.000	0.000	0.363	fbmy5635_202205192101.cy9c5_u
0.000	0.010	65.970	33.978	0.003	0.040	nonzero	0.000	0.000	0.000	0.366	fbmy5635_202208092101.cy9c5_u
0.000	0.011	65.110	34.836	0.003	0.040	nonzero	0.000	0.000	0.000	0.292	fbmy5635_202210112144.cy9c5_u
0.000	0.007	76.096	23.853	0.002	0.041	0.000	0.000	0.000	0.000	0.176	fbmy5635_202302162102.cy9c5_u
0.000	0.008	75.319	24.629	0.002	0.042	0.000	0.000	0.000	0.000	0.237	fbmy5635_202304122154.cy9c5_u
0.000	0.006	75.466	24.485	0.002	0.041	nonzero	0.000	0.000	0.000	0.325	fbmy5635_202305292102.cy9c5_u
0.000	0.005	77.525	22.427	0.003	0.040	0.000	0.000	0.000	0.000	0.254	fbmy5635_20230529_832.cy9c5_u
0.000	0.005	75.147	24.805	0.002	0.041	nonzero	0.000	0.000	0.000	0.353	fbmy5635_20230529_843.cy9c5_u
0.000	0.004	76.998	22.943	0.010	0.046	0.000	0.000	0.000	0.000	0.237	fbmy5635_20230529_850.cy9c5_u
l.x
- l.x: create secondary indexes
- Legend for results is here.
- Each entry lists the percentage of responses that fit in that bucket (slower than max time for previous bucket, faster than min time for next bucket).
TODO - determine whether there is data for create index response time
l.i1
- l.i1: continue load after secondary indexes created
- Legend for results is here.
- Each entry lists the percentage of responses that fit in that bucket (slower than max time for previous bucket, faster than min time for next bucket).
Insert response time histogram
256us	1ms	4ms	16ms	64ms	256ms	1s	4s	16s	gt	max	tag
0.000	nonzero	0.040	27.431	72.520	0.008	0.000	0.000	0.000	0.000	0.125	fbmy5635_202203072101.cy9c5_u
0.000	0.000	0.033	21.368	78.591	0.008	0.000	0.000	0.000	0.000	0.143	fbmy5635_202205192101.cy9c5_u
0.000	0.000	0.038	20.205	79.751	0.006	0.000	0.000	0.000	0.000	0.132	fbmy5635_202208092101.cy9c5_u
0.000	0.000	0.034	20.051	79.908	0.008	0.000	0.000	0.000	0.000	0.126	fbmy5635_202210112144.cy9c5_u
0.000	0.000	0.035	11.916	88.028	0.021	0.000	0.000	0.000	0.000	0.161	fbmy5635_202302162102.cy9c5_u
0.000	0.000	0.035	11.852	88.094	0.019	0.000	0.000	0.000	0.000	0.200	fbmy5635_202304122154.cy9c5_u
0.000	0.000	0.044	11.863	88.074	0.020	0.000	0.000	0.000	0.000	0.178	fbmy5635_202305292102.cy9c5_u
0.000	0.000	0.033	13.071	86.884	0.012	0.000	0.000	0.000	0.000	0.199	fbmy5635_20230529_832.cy9c5_u
0.000	0.000	0.039	12.856	87.090	0.015	0.000	0.000	0.000	0.000	0.179	fbmy5635_20230529_843.cy9c5_u
0.000	0.000	0.029	12.560	87.400	0.010	0.000	0.000	0.000	0.000	0.209	fbmy5635_20230529_850.cy9c5_u
Delete response time histogram
256us	1ms	4ms	16ms	64ms	256ms	1s	4s	16s	gt	max	tag
0.000	0.001	0.040	29.752	70.198	0.009	nonzero	0.000	0.000	0.000	0.294	fbmy5635_202203072101.cy9c5_u
0.000	0.001	0.033	22.722	77.236	0.008	nonzero	0.000	0.000	0.000	0.294	fbmy5635_202205192101.cy9c5_u
0.000	0.001	0.037	21.545	78.411	0.007	nonzero	0.000	0.000	0.000	0.270	fbmy5635_202208092101.cy9c5_u
0.000	0.001	0.033	21.232	78.725	0.008	0.000	0.000	0.000	0.000	0.253	fbmy5635_202210112144.cy9c5_u
0.000	nonzero	0.036	11.418	88.523	0.022	nonzero	0.000	0.000	0.000	0.264	fbmy5635_202302162102.cy9c5_u
0.000	nonzero	0.036	11.298	88.646	0.021	0.000	0.000	0.000	0.000	0.200	fbmy5635_202304122154.cy9c5_u
0.000	nonzero	0.045	11.448	88.486	0.020	0.000	0.000	0.000	0.000	0.231	fbmy5635_202305292102.cy9c5_u
0.000	nonzero	0.034	12.725	87.227	0.014	0.000	0.000	0.000	0.000	0.199	fbmy5635_20230529_832.cy9c5_u
0.000	nonzero	0.040	12.324	87.619	0.016	0.000	0.000	0.000	0.000	0.191	fbmy5635_20230529_843.cy9c5_u
0.000	nonzero	0.029	12.132	87.827	0.011	nonzero	0.000	0.000	0.000	0.321	fbmy5635_20230529_850.cy9c5_u
q100.1
- q100.1: range queries with 100 insert/s per client
- Legend for results is here.
- Each entry lists the percentage of responses that fit in that bucket (slower than max time for previous bucket, faster than min time for next bucket).
Query response time histogram
256us	1ms	4ms	16ms	64ms	256ms	1s	4s	16s	gt	max	tag
56.721	43.196	0.081	0.002	nonzero	nonzero	0.000	0.000	0.000	0.000	0.076	fbmy5635_202203072101.cy9c5_u
51.255	48.644	0.098	0.003	nonzero	nonzero	0.000	0.000	0.000	0.000	0.071	fbmy5635_202205192101.cy9c5_u
50.845	49.044	0.108	0.003	nonzero	nonzero	0.000	0.000	0.000	0.000	0.079	fbmy5635_202208092101.cy9c5_u
50.819	49.088	0.090	0.003	nonzero	nonzero	0.000	0.000	0.000	0.000	0.066	fbmy5635_202210112144.cy9c5_u
47.826	52.095	0.068	0.006	0.004	nonzero	0.000	0.000	0.000	0.000	0.076	fbmy5635_202302162102.cy9c5_u
48.816	51.104	0.071	0.006	0.004	nonzero	0.000	0.000	0.000	0.000	0.083	fbmy5635_202304122154.cy9c5_u
49.325	50.593	0.072	0.006	0.004	nonzero	0.000	0.000	0.000	0.000	0.084	fbmy5635_202305292102.cy9c5_u
46.160	53.747	0.083	0.007	0.002	nonzero	0.000	0.000	0.000	0.000	0.084	fbmy5635_20230529_832.cy9c5_u
42.356	57.547	0.088	0.008	0.002	nonzero	0.000	0.000	0.000	0.000	0.088	fbmy5635_20230529_843.cy9c5_u
42.413	57.486	0.093	0.007	0.001	0.001	0.000	0.000	0.000	0.000	0.086	fbmy5635_20230529_850.cy9c5_u
Insert response time histogram
256us	1ms	4ms	16ms	64ms	256ms	1s	4s	16s	gt	max	tag
0.000	0.003	99.956	0.041	0.000	0.000	0.000	0.000	0.000	0.000	0.013	fbmy5635_202203072101.cy9c5_u
0.000	0.000	99.966	0.032	0.001	0.001	0.000	0.000	0.000	0.000	0.077	fbmy5635_202205192101.cy9c5_u
0.000	0.000	99.869	0.131	0.000	0.000	0.000	0.000	0.000	0.000	0.012	fbmy5635_202208092101.cy9c5_u
0.000	0.000	99.957	0.043	0.000	0.000	0.000	0.000	0.000	0.000	0.012	fbmy5635_202210112144.cy9c5_u
0.000	0.013	99.739	0.201	0.047	0.000	0.000	0.000	0.000	0.000	0.043	fbmy5635_202302162102.cy9c5_u
0.000	0.013	99.730	0.204	0.054	0.000	0.000	0.000	0.000	0.000	0.026	fbmy5635_202304122154.cy9c5_u
0.000	0.008	99.727	0.202	0.064	0.000	0.000	0.000	0.000	0.000	0.054	fbmy5635_202305292102.cy9c5_u
0.000	0.016	99.753	0.192	0.039	0.000	0.000	0.000	0.000	0.000	0.057	fbmy5635_20230529_832.cy9c5_u
0.000	0.006	99.781	0.189	0.024	0.001	0.000	0.000	0.000	0.000	0.079	fbmy5635_20230529_843.cy9c5_u
0.000	0.010	99.609	0.354	0.026	0.001	0.000	0.000	0.000	0.000	0.081	fbmy5635_20230529_850.cy9c5_u
Delete response time histogram
256us	1ms	4ms	16ms	64ms	256ms	1s	4s	16s	gt	max	tag
0.000	0.067	99.883	0.048	0.002	0.001	0.000	0.000	0.000	0.000	0.085	fbmy5635_202203072101.cy9c5_u
0.000	0.010	99.953	0.033	0.002	0.002	0.000	0.000	0.000	0.000	0.077	fbmy5635_202205192101.cy9c5_u
0.000	0.001	99.904	0.091	0.003	0.001	0.000	0.000	0.000	0.000	0.075	fbmy5635_202208092101.cy9c5_u
0.000	0.001	99.948	0.048	0.002	0.001	0.000	0.000	0.000	0.000	0.065	fbmy5635_202210112144.cy9c5_u
0.000	0.001	99.727	0.207	0.064	0.001	0.000	0.000	0.000	0.000	0.077	fbmy5635_202302162102.cy9c5_u
0.000	0.000	99.716	0.213	0.071	0.000	0.000	0.000	0.000	0.000	0.027	fbmy5635_202304122154.cy9c5_u
0.000	0.000	99.696	0.220	0.083	0.002	0.000	0.000	0.000	0.000	0.075	fbmy5635_202305292102.cy9c5_u
0.000	0.000	99.730	0.218	0.051	0.001	0.000	0.000	0.000	0.000	0.077	fbmy5635_20230529_832.cy9c5_u
0.000	0.000	99.759	0.199	0.039	0.002	0.000	0.000	0.000	0.000	0.081	fbmy5635_20230529_843.cy9c5_u
0.000	0.000	99.680	0.285	0.030	0.005	0.000	0.000	0.000	0.000	0.082	fbmy5635_20230529_850.cy9c5_u
q500.1
- q500.1: range queries with 500 insert/s per client
- Legend for results is here.
- Each entry lists the percentage of responses that fit in that bucket (slower than max time for previous bucket, faster than min time for next bucket).
Query response time histogram
256us	1ms	4ms	16ms	64ms	256ms	1s	4s	16s	gt	max	tag
46.313	53.663	0.013	0.011	nonzero	0.001	0.000	0.000	0.000	0.000	0.081	fbmy5635_202203072101.cy9c5_u
40.628	59.346	0.014	0.011	nonzero	0.001	0.000	0.000	0.000	0.000	0.080	fbmy5635_202205192101.cy9c5_u
39.869	60.103	0.016	0.011	nonzero	nonzero	0.000	0.000	0.000	0.000	0.079	fbmy5635_202208092101.cy9c5_u
39.171	60.802	0.016	0.011	nonzero	0.001	0.000	0.000	0.000	0.000	0.079	fbmy5635_202210112144.cy9c5_u
38.292	61.643	0.024	0.016	0.025	0.000	0.000	0.000	0.000	0.000	0.033	fbmy5635_202302162102.cy9c5_u
38.447	61.487	0.025	0.016	0.026	0.000	0.000	0.000	0.000	0.000	0.050	fbmy5635_202304122154.cy9c5_u
40.280	59.653	0.025	0.016	0.026	nonzero	0.000	0.000	0.000	0.000	0.160	fbmy5635_202305292102.cy9c5_u
35.712	64.222	0.030	0.021	0.015	0.000	0.000	0.000	0.000	0.000	0.049	fbmy5635_20230529_832.cy9c5_u
31.987	67.947	0.028	0.026	0.012	0.000	0.000	0.000	0.000	0.000	0.051	fbmy5635_20230529_843.cy9c5_u
31.926	68.010	0.031	0.027	0.006	nonzero	0.000	0.000	0.000	0.000	0.090	fbmy5635_20230529_850.cy9c5_u
Insert response time histogram
256us	1ms	4ms	16ms	64ms	256ms	1s	4s	16s	gt	max	tag
0.000	0.000	99.854	0.144	0.002	nonzero	0.000	0.000	0.000	0.000	0.076	fbmy5635_202203072101.cy9c5_u
0.000	0.000	96.006	3.992	0.001	0.001	0.000	0.000	0.000	0.000	0.078	fbmy5635_202205192101.cy9c5_u
0.000	0.000	95.354	4.644	0.001	0.001	0.000	0.000	0.000	0.000	0.079	fbmy5635_202208092101.cy9c5_u
0.000	0.000	80.362	19.632	0.006	nonzero	0.000	0.000	0.000	0.000	0.070	fbmy5635_202210112144.cy9c5_u
0.000	0.004	98.404	1.381	0.212	0.000	0.000	0.000	0.000	0.000	0.030	fbmy5635_202302162102.cy9c5_u
0.000	0.004	98.110	1.677	0.208	0.000	0.000	0.000	0.000	0.000	0.048	fbmy5635_202304122154.cy9c5_u
0.000	0.002	99.560	0.254	0.183	0.000	0.000	0.000	0.000	0.000	0.035	fbmy5635_202305292102.cy9c5_u
0.000	0.007	98.922	0.892	0.178	0.000	0.000	0.000	0.000	0.000	0.041	fbmy5635_20230529_832.cy9c5_u
0.000	0.004	99.614	0.256	0.125	nonzero	0.000	0.000	0.000	0.000	0.067	fbmy5635_20230529_843.cy9c5_u
0.000	0.004	99.333	0.576	0.087	0.000	0.000	0.000	0.000	0.000	0.035	fbmy5635_20230529_850.cy9c5_u
Delete response time histogram
256us	1ms	4ms	16ms	64ms	256ms	1s	4s	16s	gt	max	tag
0.000	0.030	99.818	0.137	0.011	0.004	0.000	0.000	0.000	0.000	0.104	fbmy5635_202203072101.cy9c5_u
0.000	0.000	96.593	3.397	0.007	0.003	0.000	0.000	0.000	0.000	0.101	fbmy5635_202205192101.cy9c5_u
0.000	nonzero	96.096	3.892	0.009	0.003	0.000	0.000	0.000	0.000	0.109	fbmy5635_202208092101.cy9c5_u
0.000	0.000	81.833	18.153	0.012	0.003	0.000	0.000	0.000	0.000	0.101	fbmy5635_202210112144.cy9c5_u
0.000	0.000	98.345	1.424	0.230	0.000	0.000	0.000	0.000	0.000	0.030	fbmy5635_202302162102.cy9c5_u
0.000	nonzero	98.269	1.500	0.231	0.000	0.000	0.000	0.000	0.000	0.048	fbmy5635_202304122154.cy9c5_u
0.000	0.000	99.531	0.268	0.200	nonzero	0.000	0.000	0.000	0.000	0.175	fbmy5635_202305292102.cy9c5_u
0.000	0.000	98.924	0.880	0.197	0.000	0.000	0.000	0.000	0.000	0.044	fbmy5635_20230529_832.cy9c5_u
0.000	0.000	99.580	0.270	0.150	nonzero	0.000	0.000	0.000	0.000	0.124	fbmy5635_20230529_843.cy9c5_u
0.000	0.000	99.319	0.574	0.106	nonzero	0.000	0.000	0.000	0.000	0.070	fbmy5635_20230529_850.cy9c5_u
q1000.1
- q1000.1: range queries with 1000 insert/s per client
- Legend for results is here.
- Each entry lists the percentage of responses that fit in that bucket (slower than max time for previous bucket, faster than min time for next bucket).
Query response time histogram
256us	1ms	4ms	16ms	64ms	256ms	1s	4s	16s	gt	max	tag
31.908	68.028	0.039	0.024	nonzero	nonzero	nonzero	0.000	0.000	0.000	0.306	fbmy5635_202203072101.cy9c5_u
25.245	74.687	0.044	0.025	nonzero	nonzero	0.000	0.000	0.000	0.000	0.112	fbmy5635_202205192101.cy9c5_u
24.323	75.604	0.048	0.025	nonzero	nonzero	0.000	0.000	0.000	0.000	0.095	fbmy5635_202208092101.cy9c5_u
24.979	74.952	0.044	0.025	nonzero	0.000	0.000	0.000	0.000	0.000	0.059	fbmy5635_202210112144.cy9c5_u
23.333	76.591	0.027	0.018	0.031	nonzero	0.000	0.000	0.000	0.000	0.077	fbmy5635_202302162102.cy9c5_u
24.026	75.891	0.033	0.017	0.032	nonzero	0.000	0.000	0.000	0.000	0.077	fbmy5635_202304122154.cy9c5_u
24.817	75.105	0.028	0.019	0.031	nonzero	0.000	0.000	0.000	0.000	0.094	fbmy5635_202305292102.cy9c5_u
21.895	78.018	0.041	0.016	0.030	nonzero	0.000	0.000	0.000	0.000	0.087	fbmy5635_20230529_832.cy9c5_u
17.267	82.649	0.037	0.018	0.029	nonzero	0.000	0.000	0.000	0.000	0.109	fbmy5635_20230529_843.cy9c5_u
18.391	81.524	0.040	0.023	0.021	nonzero	0.000	0.000	0.000	0.000	0.068	fbmy5635_20230529_850.cy9c5_u
Insert response time histogram
256us	1ms	4ms	16ms	64ms	256ms	1s	4s	16s	gt	max	tag
0.000	0.000	31.225	44.542	24.232	0.001	0.000	0.000	0.000	0.000	0.070	fbmy5635_202203072101.cy9c5_u
0.000	0.000	18.145	50.747	31.107	nonzero	0.000	0.000	0.000	0.000	0.066	fbmy5635_202205192101.cy9c5_u
0.000	0.000	14.774	36.236	48.990	0.000	0.000	0.000	0.000	0.000	0.055	fbmy5635_202208092101.cy9c5_u
0.000	0.000	15.694	75.899	8.407	0.000	0.000	0.000	0.000	0.000	0.057	fbmy5635_202210112144.cy9c5_u
0.000	0.000	13.544	81.073	5.366	0.017	0.000	0.000	0.000	0.000	0.099	fbmy5635_202302162102.cy9c5_u
0.000	0.000	28.103	23.078	48.802	0.017	0.000	0.000	0.000	0.000	0.109	fbmy5635_202304122154.cy9c5_u
0.000	0.000	34.847	34.227	30.899	0.027	0.000	0.000	0.000	0.000	0.105	fbmy5635_202305292102.cy9c5_u
0.000	0.000	18.535	28.755	52.704	0.005	0.000	0.000	0.000	0.000	0.101	fbmy5635_20230529_832.cy9c5_u
0.000	nonzero	15.408	83.101	1.490	0.001	0.000	0.000	0.000	0.000	0.065	fbmy5635_20230529_843.cy9c5_u
0.000	0.000	26.198	72.441	1.360	0.001	0.000	0.000	0.000	0.000	0.078	fbmy5635_20230529_850.cy9c5_u
Delete response time histogram
256us	1ms	4ms	16ms	64ms	256ms	1s	4s	16s	gt	max	tag
0.000	nonzero	31.555	44.727	23.714	0.002	nonzero	0.000	0.000	0.000	0.322	fbmy5635_202203072101.cy9c5_u
0.000	0.000	18.688	50.970	30.341	0.001	0.000	0.000	0.000	0.000	0.115	fbmy5635_202205192101.cy9c5_u
0.000	0.000	14.944	37.018	48.037	0.001	0.000	0.000	0.000	0.000	0.102	fbmy5635_202208092101.cy9c5_u
0.000	0.000	16.575	75.385	8.039	0.001	0.000	0.000	0.000	0.000	0.096	fbmy5635_202210112144.cy9c5_u
0.000	0.000	12.887	81.468	5.627	0.019	0.000	0.000	0.000	0.000	0.098	fbmy5635_202302162102.cy9c5_u
0.000	0.000	27.724	22.790	49.467	0.018	0.000	0.000	0.000	0.000	0.109	fbmy5635_202304122154.cy9c5_u
0.000	0.000	33.745	34.671	31.558	0.026	0.000	0.000	0.000	0.000	0.112	fbmy5635_202305292102.cy9c5_u
0.000	0.000	18.160	28.265	53.570	0.005	0.000	0.000	0.000	0.000	0.103	fbmy5635_20230529_832.cy9c5_u
0.000	0.000	14.782	83.665	1.553	0.001	0.000	0.000	0.000	0.000	0.121	fbmy5635_20230529_843.cy9c5_u
0.000	0.000	25.716	72.829	1.454	0.001	0.000	0.000	0.000	0.000	0.078	fbmy5635_20230529_850.cy9c5_u