Introduction
This is a report for the insert benchmark with 480M docs and 24 client(s). It is generated by scripts (bash, awk, sed) and Tufte might not be impressed. An overview of the insert benchmark is here and a short update is here. Below, by DBMS, I mean DBMS+version.config. An example is my8020.c10b40 where my means MySQL, 8020 is version 8.0.20 and c10b40 is the name for the configuration file.
The test server has 80 cores, hyperthreads enabled, 256G RAM and fast NVMe with XFS. The benchmark was run with 24 clients and there were 1 or 3 connections per client (1 for queries or inserts without rate limits, 1+1 for rate limited inserts+deletes). There are 24 tables, with a client per table. It loads 20M rows per-table without secondary indexes, creates secondary indexes, then inserts 50M rows per-table with a delete per insert to avoid growing the table. It then does 3 read+write tests for 3600s each that do queries as fast as possible with 100, 500 and then 1000 inserts/second/client concurrent with the queries and 1000 deletes/second to avoid growing the table. The database is cached by RocksDB.
The tested DBMS are:
- fbmy5635_202203072101.cy9c_u - FB MySQL 5.6.35 compiled at git hash e7d976ee (7 Mar 2022 tag) with RocksDB 6.28.2, cy9c_u (base) config
- fbmy5635_202205192101.cy9c_u - FB MySQL 5.6.35 compiled at git hash d503bd77 (19 May 2022 tag) with RocksDB 7.2.2, cy9c_u (base) config
- fbmy5635_202208092101.cy9c_u - FB MySQL 5.6.35 compiled at git hash 877a0e58 (9 Aug 2022 tag) with RocksDB 7.3.1, cy9c_u (base) config
- fbmy5635_202210112144.cy9c_u - FB MySQL 5.6.35 compiled at git hash c691c716 (11 Oct 2022 tag) with RocksDB 7.3.1, cy9c_u (base) config
- fbmy5635_202302162102.cy9c_u - FB MySQL 5.6.35 compiled at git hash 21a2b0aa (16 Feb 2023 tag) with RocksDB 7.10.0, cy9c_u (base) config
- fbmy5635_202304122154.cy9c_u - FB MySQL 5.6.35 compiled at git hash 205c31dd (12 Apr 2023 tag) with RocksDB 7.10.2, cy9c_u (base) config
- fbmy5635_202305292102.cy9c_u - FB MySQL 5.6.35 compiled at git hash b739eac1 (29 May 2023 tag) with RocksDB 8.2.1, cy9c_u (base) config
- fbmy5635_20230529_832.cy9c_u - FB MySQL 5.6.35 compiled at git hash b739eac1 (29 May 2023 tag) with RocksDB 8.3.2, cy9c_u (base) config
- fbmy5635_20230529_843.cy9c_u - FB MySQL 5.6.35 compiled at git hash b739eac1 (29 May 2023 tag) with RocksDB 8.4.3, cy9c_u (base) config
- fbmy5635_20230529_850.cy9c_u - FB MySQL 5.6.35 compiled at git hash b739eac1 (29 May 2023 tag) with RocksDB 8.5.0, cy9c_u (base) config
Contents
- Summary
- l.i0: load without secondary indexes
- l.x: create secondary indexes
- l.i1: continue load after secondary indexes created
- q100.1: range queries with 100 insert/s per client
- q500.1: range queries with 500 insert/s per client
- q1000.1: range queries with 1000 insert/s per client
Summary
The numbers are inserts/s for l.i0 and l.i1, indexed docs (or rows) /s for l.x and queries/s for q100, q500, q1000. The values are the average rate over the entire test for inserts (IPS) and queries (QPS). The range of values for IPS and QPS is split into 3 parts: bottom 25%, middle 50%, top 25%. Values in the bottom 25% have a red background, values in the top 25% have a green background and values in the middle have no color. A gray background is used for values that can be ignored because the DBMS did not sustain the target insert rate. Red backgrounds are not used when the minimum value is within 80% of the max value.
| dbms | l.i0 | l.x | l.i1 | q100.1 | q500.1 | q1000.1 |
|---|---|---|---|---|---|---|
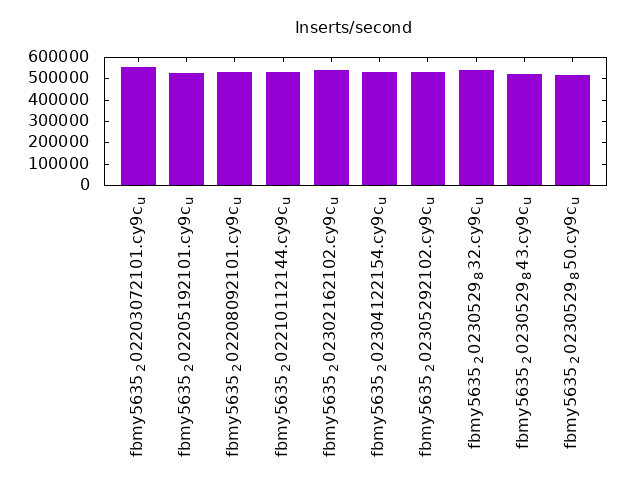
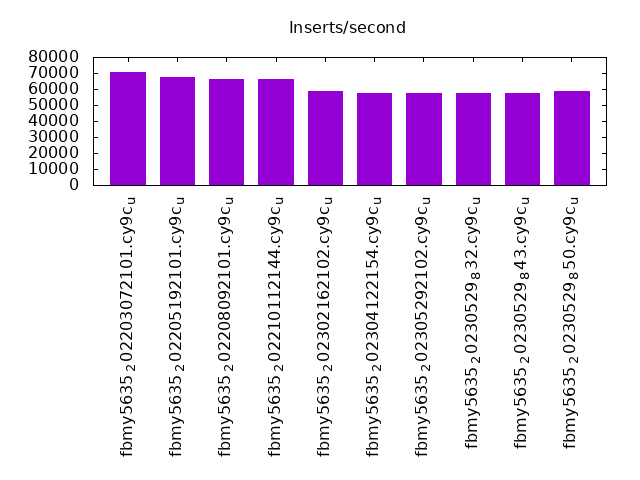
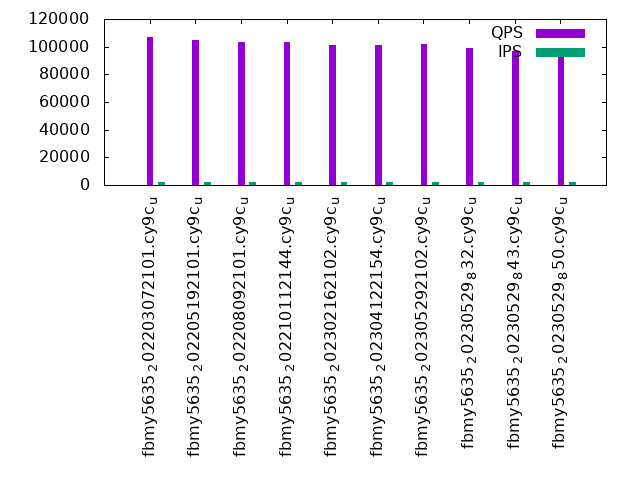
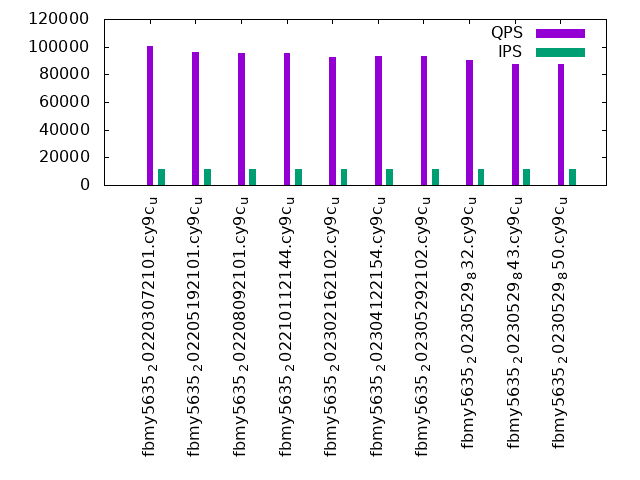
| fbmy5635_202203072101.cy9c_u | 551091 | 1428869 | 70734 | 106833 | 100813 | 87179 |
| fbmy5635_202205192101.cy9c_u | 526316 | 1403801 | 67302 | 104482 | 95911 | 83120 |
| fbmy5635_202208092101.cy9c_u | 528634 | 1403801 | 66464 | 103340 | 95167 | 83973 |
| fbmy5635_202210112144.cy9c_u | 528053 | 1399708 | 66489 | 103425 | 95203 | 82775 |
| fbmy5635_202302162102.cy9c_u | 541150 | 1407918 | 58887 | 101221 | 92228 | 81267 |
| fbmy5635_202304122154.cy9c_u | 529801 | 1403801 | 57290 | 101199 | 93164 | 81708 |
| fbmy5635_202305292102.cy9c_u | 529801 | 1403801 | 57293 | 101644 | 92902 | 81594 |
| fbmy5635_20230529_832.cy9c_u | 541150 | 1403801 | 57512 | 99011 | 90599 | 80171 |
| fbmy5635_20230529_843.cy9c_u | 518919 | 1383573 | 57441 | 97081 | 87620 | 77262 |
| fbmy5635_20230529_850.cy9c_u | 515575 | 1387572 | 58694 | 97178 | 87805 | 77822 |
This table has relative throughput, throughput for the DBMS relative to the DBMS in the first line, using the absolute throughput from the previous table. Values less than 0.95 have a yellow background. Values greater than 1.05 have a blue background.
| dbms | l.i0 | l.x | l.i1 | q100.1 | q500.1 | q1000.1 |
|---|---|---|---|---|---|---|
| fbmy5635_202203072101.cy9c_u | 1.00 | 1.00 | 1.00 | 1.00 | 1.00 | 1.00 |
| fbmy5635_202205192101.cy9c_u | 0.96 | 0.98 | 0.95 | 0.98 | 0.95 | 0.95 |
| fbmy5635_202208092101.cy9c_u | 0.96 | 0.98 | 0.94 | 0.97 | 0.94 | 0.96 |
| fbmy5635_202210112144.cy9c_u | 0.96 | 0.98 | 0.94 | 0.97 | 0.94 | 0.95 |
| fbmy5635_202302162102.cy9c_u | 0.98 | 0.99 | 0.83 | 0.95 | 0.91 | 0.93 |
| fbmy5635_202304122154.cy9c_u | 0.96 | 0.98 | 0.81 | 0.95 | 0.92 | 0.94 |
| fbmy5635_202305292102.cy9c_u | 0.96 | 0.98 | 0.81 | 0.95 | 0.92 | 0.94 |
| fbmy5635_20230529_832.cy9c_u | 0.98 | 0.98 | 0.81 | 0.93 | 0.90 | 0.92 |
| fbmy5635_20230529_843.cy9c_u | 0.94 | 0.97 | 0.81 | 0.91 | 0.87 | 0.89 |
| fbmy5635_20230529_850.cy9c_u | 0.94 | 0.97 | 0.83 | 0.91 | 0.87 | 0.89 |
This lists the average rate of inserts/s for the tests that do inserts concurrent with queries. For such tests the query rate is listed in the table above. The read+write tests are setup so that the insert rate should match the target rate every second. Cells that are not at least 95% of the target have a red background to indicate a failure to satisfy the target.
| dbms | q100.1 | q500.1 | q1000.1 |
|---|---|---|---|
| fbmy5635_202203072101.cy9c_u | 2381 | 11907 | 23828 |
| fbmy5635_202205192101.cy9c_u | 2381 | 11907 | 23821 |
| fbmy5635_202208092101.cy9c_u | 2381 | 11907 | 23821 |
| fbmy5635_202210112144.cy9c_u | 2381 | 11907 | 23828 |
| fbmy5635_202302162102.cy9c_u | 2381 | 11907 | 23828 |
| fbmy5635_202304122154.cy9c_u | 2381 | 11907 | 23828 |
| fbmy5635_202305292102.cy9c_u | 2381 | 11907 | 23834 |
| fbmy5635_20230529_832.cy9c_u | 2381 | 11911 | 23828 |
| fbmy5635_20230529_843.cy9c_u | 2381 | 11907 | 23828 |
| fbmy5635_20230529_850.cy9c_u | 2381 | 11907 | 23828 |
| target | 2400 | 12000 | 24000 |
l.i0
l.i0: load without secondary indexes. Graphs for performance per 1-second interval are here.
Average throughput:
Insert response time histogram: each cell has the percentage of responses that take <= the time in the header and max is the max response time in seconds. For the max column values in the top 25% of the range have a red background and in the bottom 25% of the range have a green background. The red background is not used when the min value is within 80% of the max value.
| dbms | 256us | 1ms | 4ms | 16ms | 64ms | 256ms | 1s | 4s | 16s | gt | max |
|---|---|---|---|---|---|---|---|---|---|---|---|
| fbmy5635_202203072101.cy9c_u | 0.364 | 48.064 | 51.530 | 0.001 | 0.041 | 0.100 | |||||
| fbmy5635_202205192101.cy9c_u | 0.270 | 39.209 | 60.480 | 0.041 | 0.100 | ||||||
| fbmy5635_202208092101.cy9c_u | 0.267 | 38.366 | 61.325 | 0.002 | 0.041 | 0.110 | |||||
| fbmy5635_202210112144.cy9c_u | 0.277 | 40.677 | 59.003 | 0.002 | 0.041 | 0.102 | |||||
| fbmy5635_202302162102.cy9c_u | 0.204 | 46.894 | 52.860 | 0.001 | 0.041 | 0.097 | |||||
| fbmy5635_202304122154.cy9c_u | 0.203 | 42.912 | 56.844 | 0.001 | 0.041 | 0.100 | |||||
| fbmy5635_202305292102.cy9c_u | 0.169 | 44.519 | 55.271 | nonzero | 0.041 | 0.111 | |||||
| fbmy5635_20230529_832.cy9c_u | 0.154 | 44.826 | 54.977 | 0.001 | 0.041 | 0.096 | |||||
| fbmy5635_20230529_843.cy9c_u | 0.129 | 37.458 | 62.371 | 0.001 | 0.041 | 0.103 | |||||
| fbmy5635_20230529_850.cy9c_u | 0.123 | 38.193 | 61.642 | 0.001 | 0.041 | 0.117 |
Performance metrics for the DBMS listed above. Some are normalized by throughput, others are not. Legend for results is here.
ips	qps	rps	rmbps	wps	wmbps	rpq	rkbpq	wpi	wkbpi	csps	cpups	cspq	cpupq	dbgb1	dbgb2	rss	maxop	p50	p99	tag
551091	0	0	0.0	2236.1	262.8	0.000	0.000	0.004	0.488	721907	39.4	1.310	57	15.6	16.7	5.0	0.100	23476	14186	480m.fbmy5635_202203072101.cy9c_u
526316	0	0	0.0	2081.5	247.3	0.000	0.000	0.004	0.481	719241	38.7	1.367	59	15.6	16.7	4.8	0.100	22093	14186	480m.fbmy5635_202205192101.cy9c_u
528634	0	0	0.0	2095.3	250.1	0.000	0.000	0.004	0.484	710411	38.9	1.344	59	15.9	17.1	4.8	0.110	22375	13985	480m.fbmy5635_202208092101.cy9c_u
528053	0	0	0.0	2102.3	249.8	0.000	0.000	0.004	0.484	668029	38.9	1.265	59	15.9	17.0	4.9	0.102	22480	13586	480m.fbmy5635_202210112144.cy9c_u
541150	0	0	0.0	1767.8	208.2	0.000	0.000	0.003	0.394	658328	38.6	1.217	57	15.2	16.3	3.7	0.097	23576	14585	480m.fbmy5635_202302162102.cy9c_u
529801	0	0	0.0	1761.3	206.8	0.000	0.000	0.003	0.400	664892	38.6	1.255	58	15.8	17.0	3.9	0.100	22776	14683	480m.fbmy5635_202304122154.cy9c_u
529801	0	0	0.0	1706.5	200.0	0.000	0.000	0.003	0.387	659103	38.7	1.244	58	15.3	16.4	3.7	0.111	22478	13788	480m.fbmy5635_202305292102.cy9c_u
541150	0	0	0.0	1719.9	201.3	0.000	0.000	0.003	0.381	634107	40.0	1.172	59	15.4	16.6	3.7	0.096	23279	14785	480m.fbmy5635_20230529_832.cy9c_u
518919	0	0	0.0	1651.2	194.0	0.000	0.000	0.003	0.383	614343	39.8	1.184	61	15.7	16.8	3.8	0.103	22477	14387	480m.fbmy5635_20230529_843.cy9c_u
515575	0	0	0.0	1634.2	191.5	0.000	0.000	0.003	0.380	634367	39.4	1.230	61	15.3	16.5	3.7	0.117	22176	14086	480m.fbmy5635_20230529_850.cy9c_u
l.x
l.x: create secondary indexes.
Average throughput:

Performance metrics for the DBMS listed above. Some are normalized by throughput, others are not. Legend for results is here.
ips	qps	rps	rmbps	wps	wmbps	rpq	rkbpq	wpi	wkbpi	csps	cpups	cspq	cpupq	dbgb1	dbgb2	rss	maxop	p50	p99	tag
1428869	0	30	0.2	1971.4	216.9	0.000	0.000	0.001	0.155	32381	28.2	0.023	16	32.4	33.5	47.1	0.003	NA	NA	480m.fbmy5635_202203072101.cy9c_u
1403801	0	29	0.2	1918.9	211.5	0.000	0.000	0.001	0.154	32858	28.4	0.023	16	32.3	33.5	44.5	0.003	NA	NA	480m.fbmy5635_202205192101.cy9c_u
1403801	0	29	0.2	1926.5	211.5	0.000	0.000	0.001	0.154	33232	28.6	0.024	16	32.4	33.5	46.1	0.003	NA	NA	480m.fbmy5635_202208092101.cy9c_u
1399708	0	29	0.2	1909.7	209.5	0.000	0.000	0.001	0.153	33596	28.5	0.024	16	32.4	33.6	45.0	0.002	NA	NA	480m.fbmy5635_202210112144.cy9c_u
1407918	0	29	0.2	1796.9	195.6	0.000	0.000	0.001	0.142	31937	28.0	0.023	16	32.3	33.5	42.0	0.003	NA	NA	480m.fbmy5635_202302162102.cy9c_u
1403801	0	29	0.2	1805.3	197.3	0.000	0.000	0.001	0.144	31130	28.0	0.022	16	32.4	33.5	39.9	0.003	NA	NA	480m.fbmy5635_202304122154.cy9c_u
1403801	0	29	0.2	1803.7	196.8	0.000	0.000	0.001	0.144	31029	27.9	0.022	16	32.3	33.5	39.0	0.002	NA	NA	480m.fbmy5635_202305292102.cy9c_u
1403801	0	29	0.2	1793.1	195.2	0.000	0.000	0.001	0.142	33181	28.8	0.024	16	32.3	33.5	40.5	0.002	NA	NA	480m.fbmy5635_20230529_832.cy9c_u
1383573	0	29	0.2	1811.3	198.4	0.000	0.000	0.001	0.147	34733	28.9	0.025	17	32.3	33.5	41.7	0.003	NA	NA	480m.fbmy5635_20230529_843.cy9c_u
1387572	0	29	0.2	1774.9	193.3	0.000	0.000	0.001	0.143	34035	29.1	0.025	17	32.4	33.5	41.4	0.003	NA	NA	480m.fbmy5635_20230529_850.cy9c_u
l.i1
l.i1: continue load after secondary indexes created. Graphs for performance per 1-second interval are here.
Average throughput:
Insert response time histogram: each cell has the percentage of responses that take <= the time in the header and max is the max response time in seconds. For the max column values in the top 25% of the range have a red background and in the bottom 25% of the range have a green background. The red background is not used when the min value is within 80% of the max value.
| dbms | 256us | 1ms | 4ms | 16ms | 64ms | 256ms | 1s | 4s | 16s | gt | max |
|---|---|---|---|---|---|---|---|---|---|---|---|
| fbmy5635_202203072101.cy9c_u | 0.001 | 0.051 | 31.710 | 68.238 | 0.001 | 0.091 | |||||
| fbmy5635_202205192101.cy9c_u | nonzero | 0.043 | 24.771 | 75.184 | 0.002 | 0.218 | |||||
| fbmy5635_202208092101.cy9c_u | 0.049 | 23.204 | 76.744 | 0.004 | 0.142 | ||||||
| fbmy5635_202210112144.cy9c_u | 0.046 | 23.245 | 76.706 | 0.004 | 0.160 | ||||||
| fbmy5635_202302162102.cy9c_u | 0.046 | 13.080 | 86.641 | 0.232 | 0.001 | 0.340 | |||||
| fbmy5635_202304122154.cy9c_u | 0.040 | 13.382 | 86.058 | 0.499 | 0.017 | 0.004 | 1.050 | ||||
| fbmy5635_202305292102.cy9c_u | 0.042 | 13.635 | 85.783 | 0.516 | 0.021 | 0.003 | 1.341 | ||||
| fbmy5635_20230529_832.cy9c_u | 0.050 | 14.537 | 84.833 | 0.574 | 0.006 | 0.363 | |||||
| fbmy5635_20230529_843.cy9c_u | 0.063 | 13.791 | 85.684 | 0.446 | 0.016 | 0.544 | |||||
| fbmy5635_20230529_850.cy9c_u | 0.040 | 13.558 | 86.192 | 0.189 | 0.020 | 0.808 |
Delete response time histogram: each cell has the percentage of responses that take <= the time in the header and max is the max response time in seconds. For the max column values in the top 25% of the range have a red background and in the bottom 25% of the range have a green background. The red background is not used when the min value is within 80% of the max value.
| dbms | 256us | 1ms | 4ms | 16ms | 64ms | 256ms | 1s | 4s | 16s | gt | max |
|---|---|---|---|---|---|---|---|---|---|---|---|
| fbmy5635_202203072101.cy9c_u | 0.003 | 0.050 | 37.218 | 62.728 | 0.001 | 0.168 | |||||
| fbmy5635_202205192101.cy9c_u | nonzero | 0.044 | 27.279 | 72.673 | 0.003 | nonzero | 0.274 | ||||
| fbmy5635_202208092101.cy9c_u | nonzero | 0.049 | 26.032 | 73.913 | 0.005 | nonzero | 0.281 | ||||
| fbmy5635_202210112144.cy9c_u | 0.002 | 0.045 | 25.742 | 74.205 | 0.005 | nonzero | 0.275 | ||||
| fbmy5635_202302162102.cy9c_u | nonzero | 0.047 | 13.914 | 85.797 | 0.240 | 0.002 | 0.849 | ||||
| fbmy5635_202304122154.cy9c_u | nonzero | 0.040 | 13.835 | 85.595 | 0.509 | 0.017 | 0.004 | 1.051 | |||
| fbmy5635_202305292102.cy9c_u | nonzero | 0.043 | 13.968 | 85.438 | 0.527 | 0.021 | 0.003 | 1.341 | |||
| fbmy5635_20230529_832.cy9c_u | nonzero | 0.050 | 14.856 | 84.495 | 0.592 | 0.006 | 0.937 | ||||
| fbmy5635_20230529_843.cy9c_u | nonzero | 0.064 | 14.129 | 85.334 | 0.457 | 0.016 | 0.799 | ||||
| fbmy5635_20230529_850.cy9c_u | 0.041 | 14.338 | 85.407 | 0.194 | 0.020 | 0.912 |
Performance metrics for the DBMS listed above. Some are normalized by throughput, others are not. Legend for results is here.
ips	qps	rps	rmbps	wps	wmbps	rpq	rkbpq	wpi	wkbpi	csps	cpups	cspq	cpupq	dbgb1	dbgb2	rss	maxop	p50	p99	tag
70734	0	97	1.1	1851.9	220.9	0.001	0.017	0.026	3.199	207064	17.3	2.927	196	42.2	42.3	177.3	0.091	2947	2647	480m.fbmy5635_202203072101.cy9c_u
67302	0	124	1.1	1706.8	204.0	0.002	0.017	0.025	3.104	193528	16.9	2.876	201	46.0	46.1	177.1	0.218	2798	2498	480m.fbmy5635_202205192101.cy9c_u
66464	0	140	1.2	1722.1	205.5	0.002	0.018	0.026	3.167	188717	17.0	2.839	205	46.0	46.1	177.3	0.142	2797	2497	480m.fbmy5635_202208092101.cy9c_u
66489	0	137	1.2	1710.2	204.1	0.002	0.018	0.026	3.144	190236	17.1	2.861	206	44.5	44.6	177.3	0.160	2797	2497	480m.fbmy5635_202210112144.cy9c_u
58887	0	74	0.9	1235.3	146.3	0.001	0.016	0.021	2.545	208901	16.1	3.547	219	38.8	39.0	178.1	0.340	2498	799	480m.fbmy5635_202302162102.cy9c_u
57290	0	107	1.0	1144.9	135.0	0.002	0.018	0.020	2.414	244208	16.5	4.263	230	44.9	45.0	177.9	1.050	2497	300	480m.fbmy5635_202304122154.cy9c_u
57293	0	115	1.0	1142.2	134.7	0.002	0.018	0.020	2.408	248925	16.9	4.345	236	49.6	49.8	177.9	1.341	2497	300	480m.fbmy5635_202305292102.cy9c_u
57512	0	147	1.3	1157.2	136.1	0.003	0.024	0.020	2.423	240384	17.7	4.180	246	45.1	45.3	177.9	0.363	2497	400	480m.fbmy5635_20230529_832.cy9c_u
57441	0	120	1.2	1147.5	135.2	0.002	0.021	0.020	2.410	235831	18.1	4.106	252	42.8	43.0	178.2	0.544	2497	400	480m.fbmy5635_20230529_843.cy9c_u
58694	0	82	0.9	1236.8	146.0	0.001	0.016	0.021	2.548	203875	17.7	3.474	241	39.9	40.0	178.0	0.808	2498	599	480m.fbmy5635_20230529_850.cy9c_u
q100.1
q100.1: range queries with 100 insert/s per client. Graphs for performance per 1-second interval are here.
Average throughput:
Query response time histogram: each cell has the percentage of responses that take <= the time in the header and max is the max response time in seconds. For max values in the top 25% of the range have a red background and in the bottom 25% of the range have a green background. The red background is not used when the min value is within 80% of the max value.
| dbms | 256us | 1ms | 4ms | 16ms | 64ms | 256ms | 1s | 4s | 16s | gt | max |
|---|---|---|---|---|---|---|---|---|---|---|---|
| fbmy5635_202203072101.cy9c_u | 84.488 | 15.511 | 0.001 | nonzero | nonzero | 0.035 | |||||
| fbmy5635_202205192101.cy9c_u | 81.186 | 18.813 | 0.001 | nonzero | nonzero | 0.018 | |||||
| fbmy5635_202208092101.cy9c_u | 79.756 | 20.243 | 0.001 | nonzero | nonzero | 0.055 | |||||
| fbmy5635_202210112144.cy9c_u | 79.648 | 20.351 | 0.001 | nonzero | nonzero | 0.067 | |||||
| fbmy5635_202302162102.cy9c_u | 75.991 | 24.008 | 0.001 | nonzero | nonzero | 0.047 | |||||
| fbmy5635_202304122154.cy9c_u | 75.956 | 24.043 | 0.001 | nonzero | nonzero | 0.054 | |||||
| fbmy5635_202305292102.cy9c_u | 76.670 | 23.328 | 0.001 | nonzero | nonzero | 0.063 | |||||
| fbmy5635_20230529_832.cy9c_u | 72.627 | 27.372 | 0.001 | nonzero | nonzero | 0.033 | |||||
| fbmy5635_20230529_843.cy9c_u | 69.420 | 30.578 | 0.001 | nonzero | nonzero | nonzero | 0.074 | ||||
| fbmy5635_20230529_850.cy9c_u | 69.438 | 30.561 | 0.001 | nonzero | nonzero | nonzero | 0.076 |
Insert response time histogram: each cell has the percentage of responses that take <= the time in the header and max is the max response time in seconds. For max values in the top 25% of the range have a red background and in the bottom 25% of the range have a green background. The red background is not used when the min value is within 80% of the max value.
| dbms | 256us | 1ms | 4ms | 16ms | 64ms | 256ms | 1s | 4s | 16s | gt | max |
|---|---|---|---|---|---|---|---|---|---|---|---|
| fbmy5635_202203072101.cy9c_u | 99.998 | 0.002 | 0.005 | ||||||||
| fbmy5635_202205192101.cy9c_u | 99.997 | 0.002 | 0.001 | 0.040 | |||||||
| fbmy5635_202208092101.cy9c_u | 99.998 | 0.002 | 0.005 | ||||||||
| fbmy5635_202210112144.cy9c_u | 99.999 | 0.001 | 0.006 | ||||||||
| fbmy5635_202302162102.cy9c_u | 99.995 | 0.005 | 0.007 | ||||||||
| fbmy5635_202304122154.cy9c_u | 99.975 | 0.025 | 0.006 | ||||||||
| fbmy5635_202305292102.cy9c_u | 99.913 | 0.087 | 0.007 | ||||||||
| fbmy5635_20230529_832.cy9c_u | 99.986 | 0.014 | 0.007 | ||||||||
| fbmy5635_20230529_843.cy9c_u | 99.998 | 0.002 | 0.005 | ||||||||
| fbmy5635_20230529_850.cy9c_u | 99.972 | 0.028 | 0.007 |
Delete response time histogram: each cell has the percentage of responses that take <= the time in the header and max is the max response time in seconds. For max values in the top 25% of the range have a red background and in the bottom 25% of the range have a green background. The red background is not used when the min value is within 80% of the max value.
| dbms | 256us | 1ms | 4ms | 16ms | 64ms | 256ms | 1s | 4s | 16s | gt | max |
|---|---|---|---|---|---|---|---|---|---|---|---|
| fbmy5635_202203072101.cy9c_u | 0.094 | 99.903 | 0.002 | 0.001 | 0.059 | ||||||
| fbmy5635_202205192101.cy9c_u | 0.002 | 99.992 | 0.002 | 0.003 | 0.001 | 0.076 | |||||
| fbmy5635_202208092101.cy9c_u | 0.002 | 99.994 | 0.001 | 0.003 | 0.058 | ||||||
| fbmy5635_202210112144.cy9c_u | 0.001 | 99.995 | 0.001 | 0.002 | 0.001 | 0.073 | |||||
| fbmy5635_202302162102.cy9c_u | 0.001 | 99.991 | 0.006 | 0.001 | 0.001 | 0.065 | |||||
| fbmy5635_202304122154.cy9c_u | 0.001 | 99.987 | 0.011 | 0.001 | 0.020 | ||||||
| fbmy5635_202305292102.cy9c_u | 99.950 | 0.044 | 0.006 | 0.001 | 0.064 | ||||||
| fbmy5635_20230529_832.cy9c_u | 99.986 | 0.012 | 0.002 | 0.045 | |||||||
| fbmy5635_20230529_843.cy9c_u | 0.001 | 99.990 | 0.008 | 0.001 | 0.001 | 0.082 | |||||
| fbmy5635_20230529_850.cy9c_u | 99.986 | 0.011 | 0.002 | 0.001 | 0.078 |
Performance metrics for the DBMS listed above. Some are normalized by throughput, others are not. Legend for results is here.
ips	qps	rps	rmbps	wps	wmbps	rpq	rkbpq	wpi	wkbpi	csps	cpups	cspq	cpupq	dbgb1	dbgb2	rss	maxop	p50	p99	tag
2381	106833	5	0.1	98.0	11.1	0.000	0.001	0.041	4.779	485770	31.3	4.547	234	36.0	37.9	178.7	0.035	4460	3916	480m.fbmy5635_202203072101.cy9c_u
2381	104482	11	0.1	133.1	15.5	0.000	0.001	0.056	6.666	478410	31.6	4.579	242	35.8	37.7	178.7	0.018	4396	3836	480m.fbmy5635_202205192101.cy9c_u
2381	103340	20	0.2	117.9	13.3	0.000	0.002	0.050	5.739	467533	31.5	4.524	244	35.7	37.6	178.5	0.055	4348	3788	480m.fbmy5635_202208092101.cy9c_u
2381	103425	17	0.2	144.4	16.7	0.000	0.002	0.061	7.166	467807	31.7	4.523	245	35.7	37.6	179.0	0.067	4316	3756	480m.fbmy5635_202210112144.cy9c_u
2381	101221	14	0.3	83.0	9.3	0.000	0.003	0.035	3.987	452000	31.5	4.465	249	36.9	38.9	179.5	0.047	4251	3724	480m.fbmy5635_202302162102.cy9c_u
2381	101199	8	0.2	85.2	9.5	0.000	0.002	0.036	4.096	451916	31.4	4.466	248	36.6	38.6	179.4	0.054	4220	3724	480m.fbmy5635_202304122154.cy9c_u
2381	101644	16	0.4	95.4	10.8	0.000	0.004	0.040	4.645	456455	31.6	4.491	249	36.9	38.9	179.7	0.063	4188	3628	480m.fbmy5635_202305292102.cy9c_u
2381	99011	14	0.3	87.1	9.8	0.000	0.003	0.037	4.205	445413	32.3	4.499	261	36.7	38.7	179.6	0.033	4204	3548	480m.fbmy5635_20230529_832.cy9c_u
2381	97081	17	0.4	90.2	10.2	0.000	0.004	0.038	4.366	437948	32.3	4.511	266	36.9	38.9	179.6	0.074	4092	3613	480m.fbmy5635_20230529_843.cy9c_u
2381	97178	17	0.2	74.9	8.2	0.000	0.002	0.031	3.543	437149	32.1	4.498	264	36.9	38.9	179.3	0.076	4044	3580	480m.fbmy5635_20230529_850.cy9c_u
q500.1
q500.1: range queries with 500 insert/s per client. Graphs for performance per 1-second interval are here.
Average throughput:
Query response time histogram: each cell has the percentage of responses that take <= the time in the header and max is the max response time in seconds. For max values in the top 25% of the range have a red background and in the bottom 25% of the range have a green background. The red background is not used when the min value is within 80% of the max value.
| dbms | 256us | 1ms | 4ms | 16ms | 64ms | 256ms | 1s | 4s | 16s | gt | max |
|---|---|---|---|---|---|---|---|---|---|---|---|
| fbmy5635_202203072101.cy9c_u | 76.116 | 23.882 | 0.001 | nonzero | nonzero | nonzero | 0.082 | ||||
| fbmy5635_202205192101.cy9c_u | 67.040 | 32.958 | 0.001 | nonzero | nonzero | nonzero | 0.079 | ||||
| fbmy5635_202208092101.cy9c_u | 65.812 | 34.187 | 0.001 | nonzero | nonzero | nonzero | 0.083 | ||||
| fbmy5635_202210112144.cy9c_u | 65.754 | 34.244 | 0.001 | nonzero | nonzero | nonzero | 0.082 | ||||
| fbmy5635_202302162102.cy9c_u | 59.718 | 40.279 | 0.002 | nonzero | nonzero | nonzero | 0.082 | ||||
| fbmy5635_202304122154.cy9c_u | 61.675 | 38.322 | 0.002 | nonzero | nonzero | nonzero | 0.081 | ||||
| fbmy5635_202305292102.cy9c_u | 61.034 | 38.963 | 0.002 | nonzero | nonzero | nonzero | 0.081 | ||||
| fbmy5635_20230529_832.cy9c_u | 56.428 | 43.569 | 0.003 | nonzero | nonzero | nonzero | 0.086 | ||||
| fbmy5635_20230529_843.cy9c_u | 49.886 | 50.111 | 0.003 | nonzero | nonzero | nonzero | 0.111 | ||||
| fbmy5635_20230529_850.cy9c_u | 50.325 | 49.672 | 0.003 | nonzero | nonzero | nonzero | 0.089 |
Insert response time histogram: each cell has the percentage of responses that take <= the time in the header and max is the max response time in seconds. For max values in the top 25% of the range have a red background and in the bottom 25% of the range have a green background. The red background is not used when the min value is within 80% of the max value.
| dbms | 256us | 1ms | 4ms | 16ms | 64ms | 256ms | 1s | 4s | 16s | gt | max |
|---|---|---|---|---|---|---|---|---|---|---|---|
| fbmy5635_202203072101.cy9c_u | 0.001 | 98.931 | 1.065 | 0.002 | 0.001 | 0.077 | |||||
| fbmy5635_202205192101.cy9c_u | 99.956 | 0.041 | 0.002 | nonzero | 0.079 | ||||||
| fbmy5635_202208092101.cy9c_u | 88.062 | 11.935 | 0.002 | 0.002 | 0.084 | ||||||
| fbmy5635_202210112144.cy9c_u | 93.970 | 6.026 | 0.002 | 0.001 | 0.082 | ||||||
| fbmy5635_202302162102.cy9c_u | 29.732 | 61.609 | 8.657 | 0.002 | 0.091 | ||||||
| fbmy5635_202304122154.cy9c_u | 25.330 | 72.294 | 2.373 | 0.004 | 0.094 | ||||||
| fbmy5635_202305292102.cy9c_u | 21.302 | 75.608 | 3.087 | 0.002 | 0.089 | ||||||
| fbmy5635_20230529_832.cy9c_u | 29.798 | 68.817 | 1.383 | 0.002 | 0.086 | ||||||
| fbmy5635_20230529_843.cy9c_u | 8.861 | 62.721 | 28.416 | 0.002 | 0.098 | ||||||
| fbmy5635_20230529_850.cy9c_u | 23.008 | 64.893 | 12.095 | 0.004 | 0.106 |
Delete response time histogram: each cell has the percentage of responses that take <= the time in the header and max is the max response time in seconds. For max values in the top 25% of the range have a red background and in the bottom 25% of the range have a green background. The red background is not used when the min value is within 80% of the max value.
| dbms | 256us | 1ms | 4ms | 16ms | 64ms | 256ms | 1s | 4s | 16s | gt | max |
|---|---|---|---|---|---|---|---|---|---|---|---|
| fbmy5635_202203072101.cy9c_u | 0.067 | 99.188 | 0.735 | 0.008 | 0.002 | 0.090 | |||||
| fbmy5635_202205192101.cy9c_u | 0.002 | 99.955 | 0.030 | 0.009 | 0.003 | 0.088 | |||||
| fbmy5635_202208092101.cy9c_u | nonzero | 89.873 | 10.114 | 0.009 | 0.003 | 0.088 | |||||
| fbmy5635_202210112144.cy9c_u | 95.055 | 4.934 | 0.008 | 0.003 | 0.091 | ||||||
| fbmy5635_202302162102.cy9c_u | 31.269 | 60.820 | 7.908 | 0.002 | 0.091 | ||||||
| fbmy5635_202304122154.cy9c_u | 28.750 | 69.128 | 2.117 | 0.005 | 0.097 | ||||||
| fbmy5635_202305292102.cy9c_u | 24.081 | 73.198 | 2.717 | 0.004 | 0.094 | ||||||
| fbmy5635_20230529_832.cy9c_u | 32.236 | 66.571 | 1.190 | 0.003 | 0.087 | ||||||
| fbmy5635_20230529_843.cy9c_u | 9.593 | 64.199 | 26.205 | 0.003 | 0.098 | ||||||
| fbmy5635_20230529_850.cy9c_u | 24.010 | 64.950 | 11.033 | 0.007 | 0.103 |
Performance metrics for the DBMS listed above. Some are normalized by throughput, others are not. Legend for results is here.
ips	qps	rps	rmbps	wps	wmbps	rpq	rkbpq	wpi	wkbpi	csps	cpups	cspq	cpupq	dbgb1	dbgb2	rss	maxop	p50	p99	tag
11907	100813	24	0.3	381.7	44.5	0.000	0.003	0.032	3.828	474091	33.1	4.703	263	36.0	37.2	183.5	0.082	4172	3676	480m.fbmy5635_202203072101.cy9c_u
11907	95911	26	0.3	377.4	44.3	0.000	0.003	0.032	3.814	457276	33.2	4.768	277	36.4	37.6	183.5	0.079	3964	3453	480m.fbmy5635_202205192101.cy9c_u
11907	95167	17	0.2	379.7	44.4	0.000	0.002	0.032	3.815	449066	33.3	4.719	280	36.1	37.3	183.3	0.083	3980	3453	480m.fbmy5635_202208092101.cy9c_u
11907	95203	21	0.3	377.1	44.1	0.000	0.003	0.032	3.795	447943	33.4	4.705	281	36.5	37.7	183.9	0.082	3980	3469	480m.fbmy5635_202210112144.cy9c_u
11907	92228	16	0.2	308.8	35.8	0.000	0.002	0.026	3.082	431543	33.4	4.679	290	37.3	38.6	183.0	0.082	3884	3357	480m.fbmy5635_202302162102.cy9c_u
11907	93164	21	0.3	309.2	35.8	0.000	0.003	0.026	3.079	435074	33.4	4.670	287	36.8	38.0	183.1	0.081	3884	3389	480m.fbmy5635_202304122154.cy9c_u
11907	92902	17	0.2	301.8	34.9	0.000	0.002	0.025	3.004	436837	33.4	4.702	288	36.8	38.0	183.0	0.081	3900	3388	480m.fbmy5635_202305292102.cy9c_u
11911	90599	20	0.3	304.2	35.2	0.000	0.003	0.026	3.027	427095	34.2	4.714	302	37.0	38.2	183.0	0.086	3788	3292	480m.fbmy5635_20230529_832.cy9c_u
11907	87620	19	0.2	302.5	35.1	0.000	0.003	0.025	3.018	416329	34.4	4.752	314	37.0	38.3	183.0	0.111	3661	3149	480m.fbmy5635_20230529_843.cy9c_u
11907	87805	75	0.4	304.4	35.2	0.001	0.004	0.026	3.030	416128	34.3	4.739	313	37.1	38.3	182.9	0.089	3661	3196	480m.fbmy5635_20230529_850.cy9c_u
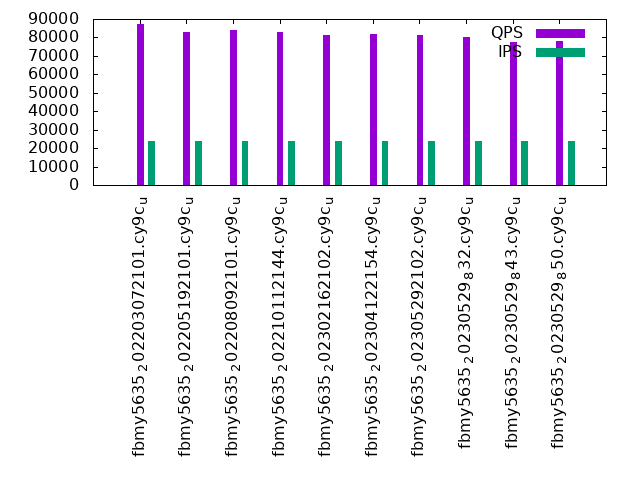
q1000.1
q1000.1: range queries with 1000 insert/s per client. Graphs for performance per 1-second interval are here.
Average throughput:
Query response time histogram: each cell has the percentage of responses that take <= the time in the header and max is the max response time in seconds. For max values in the top 25% of the range have a red background and in the bottom 25% of the range have a green background. The red background is not used when the min value is within 80% of the max value.
| dbms | 256us | 1ms | 4ms | 16ms | 64ms | 256ms | 1s | 4s | 16s | gt | max |
|---|---|---|---|---|---|---|---|---|---|---|---|
| fbmy5635_202203072101.cy9c_u | 48.164 | 51.829 | 0.007 | nonzero | nonzero | nonzero | 0.112 | ||||
| fbmy5635_202205192101.cy9c_u | 38.981 | 61.010 | 0.008 | nonzero | nonzero | nonzero | 0.094 | ||||
| fbmy5635_202208092101.cy9c_u | 40.957 | 59.040 | 0.003 | nonzero | nonzero | nonzero | 0.184 | ||||
| fbmy5635_202210112144.cy9c_u | 38.119 | 61.874 | 0.007 | nonzero | nonzero | nonzero | 0.112 | ||||
| fbmy5635_202302162102.cy9c_u | 34.891 | 65.098 | 0.011 | nonzero | nonzero | nonzero | 0.078 | ||||
| fbmy5635_202304122154.cy9c_u | 35.867 | 64.122 | 0.010 | nonzero | nonzero | nonzero | 0.128 | ||||
| fbmy5635_202305292102.cy9c_u | 35.622 | 64.367 | 0.012 | nonzero | nonzero | nonzero | 0.093 | ||||
| fbmy5635_20230529_832.cy9c_u | 32.757 | 67.230 | 0.012 | nonzero | nonzero | nonzero | 0.091 | ||||
| fbmy5635_20230529_843.cy9c_u | 26.253 | 73.734 | 0.013 | nonzero | nonzero | 0.059 | |||||
| fbmy5635_20230529_850.cy9c_u | 27.428 | 72.558 | 0.014 | nonzero | nonzero | nonzero | 0.100 |
Insert response time histogram: each cell has the percentage of responses that take <= the time in the header and max is the max response time in seconds. For max values in the top 25% of the range have a red background and in the bottom 25% of the range have a green background. The red background is not used when the min value is within 80% of the max value.
| dbms | 256us | 1ms | 4ms | 16ms | 64ms | 256ms | 1s | 4s | 16s | gt | max |
|---|---|---|---|---|---|---|---|---|---|---|---|
| fbmy5635_202203072101.cy9c_u | 24.808 | 46.479 | 28.713 | 0.051 | |||||||
| fbmy5635_202205192101.cy9c_u | 19.455 | 39.786 | 40.757 | 0.001 | 0.098 | ||||||
| fbmy5635_202208092101.cy9c_u | 47.029 | 52.917 | 0.053 | 0.001 | 0.097 | ||||||
| fbmy5635_202210112144.cy9c_u | 27.388 | 41.072 | 31.540 | 0.056 | |||||||
| fbmy5635_202302162102.cy9c_u | 3.646 | 13.131 | 83.220 | 0.003 | 0.136 | ||||||
| fbmy5635_202304122154.cy9c_u | 3.588 | 13.999 | 82.411 | 0.002 | 0.126 | ||||||
| fbmy5635_202305292102.cy9c_u | 1.037 | 14.351 | 84.610 | 0.002 | 0.088 | ||||||
| fbmy5635_20230529_832.cy9c_u | 3.291 | 16.923 | 79.786 | 0.056 | |||||||
| fbmy5635_20230529_843.cy9c_u | 4.245 | 20.516 | 75.232 | 0.007 | 0.127 | ||||||
| fbmy5635_20230529_850.cy9c_u | 3.099 | 13.933 | 82.966 | 0.001 | 0.099 |
Delete response time histogram: each cell has the percentage of responses that take <= the time in the header and max is the max response time in seconds. For max values in the top 25% of the range have a red background and in the bottom 25% of the range have a green background. The red background is not used when the min value is within 80% of the max value.
| dbms | 256us | 1ms | 4ms | 16ms | 64ms | 256ms | 1s | 4s | 16s | gt | max |
|---|---|---|---|---|---|---|---|---|---|---|---|
| fbmy5635_202203072101.cy9c_u | 0.005 | 25.182 | 46.590 | 28.222 | 0.001 | 0.136 | |||||
| fbmy5635_202205192101.cy9c_u | nonzero | 19.650 | 40.238 | 40.110 | 0.002 | 0.137 | |||||
| fbmy5635_202208092101.cy9c_u | 50.484 | 49.462 | 0.051 | 0.002 | 0.097 | ||||||
| fbmy5635_202210112144.cy9c_u | 27.688 | 41.286 | 31.025 | 0.001 | 0.147 | ||||||
| fbmy5635_202302162102.cy9c_u | 3.571 | 14.207 | 82.219 | 0.004 | 0.134 | ||||||
| fbmy5635_202304122154.cy9c_u | 3.585 | 15.257 | 81.155 | 0.003 | 0.128 | ||||||
| fbmy5635_202305292102.cy9c_u | 1.020 | 15.592 | 83.384 | 0.003 | 0.126 | ||||||
| fbmy5635_20230529_832.cy9c_u | 3.259 | 18.306 | 78.434 | 0.001 | 0.137 | ||||||
| fbmy5635_20230529_843.cy9c_u | 4.207 | 22.004 | 73.780 | 0.008 | 0.129 | ||||||
| fbmy5635_20230529_850.cy9c_u | 3.068 | 15.154 | 81.775 | 0.003 | 0.235 |
Performance metrics for the DBMS listed above. Some are normalized by throughput, others are not. Legend for results is here.
ips	qps	rps	rmbps	wps	wmbps	rpq	rkbpq	wpi	wkbpi	csps	cpups	cspq	cpupq	dbgb1	dbgb2	rss	maxop	p50	p99	tag
23828	87179	70	0.5	665.4	78.1	0.001	0.006	0.028	3.357	456969	35.6	5.242	327	38.1	39.8	185.1	0.112	3628	3148	480m.fbmy5635_202203072101.cy9c_u
23821	83120	39	0.3	672.3	78.9	0.000	0.004	0.028	3.392	445239	36.2	5.357	348	37.8	39.5	185.2	0.094	3453	2973	480m.fbmy5635_202205192101.cy9c_u
23821	83973	28	0.3	670.0	78.7	0.000	0.003	0.028	3.383	439450	35.9	5.233	342	37.8	39.5	185.2	0.184	3485	3005	480m.fbmy5635_202208092101.cy9c_u
23828	82775	27	0.2	662.3	77.3	0.000	0.003	0.028	3.323	435779	36.1	5.265	349	38.0	39.7	185.4	0.112	3421	2941	480m.fbmy5635_202210112144.cy9c_u
23828	81267	42	0.5	587.0	68.7	0.001	0.006	0.025	2.951	428043	36.8	5.267	362	37.7	39.4	185.1	0.078	3373	2877	480m.fbmy5635_202302162102.cy9c_u
23828	81708	42	0.5	585.1	68.4	0.001	0.006	0.025	2.939	427012	36.7	5.226	359	37.4	39.0	185.1	0.128	3389	2893	480m.fbmy5635_202304122154.cy9c_u
23834	81594	47	0.5	585.5	68.7	0.001	0.006	0.025	2.952	433158	36.9	5.309	362	37.4	39.1	185.2	0.093	3405	2893	480m.fbmy5635_202305292102.cy9c_u
23828	80171	46	0.5	588.0	68.2	0.001	0.006	0.025	2.931	425611	37.7	5.309	376	37.4	39.1	185.1	0.091	3325	2829	480m.fbmy5635_20230529_832.cy9c_u
23828	77262	37	0.4	582.4	67.4	0.000	0.005	0.024	2.897	413711	37.9	5.355	392	37.7	39.4	185.4	0.059	3213	2717	480m.fbmy5635_20230529_843.cy9c_u
23828	77822	89	0.5	592.6	68.8	0.001	0.007	0.025	2.959	415025	37.9	5.333	390	39.2	40.9	185.3	0.100	3245	2733	480m.fbmy5635_20230529_850.cy9c_u
l.i0
l.i0: load without secondary indexes
Performance metrics for all DBMS, not just the ones listed above. Some are normalized by throughput, others are not. Legend for results is here.
ips	qps	rps	rmbps	wps	wmbps	rpq	rkbpq	wpi	wkbpi	csps	cpups	cspq	cpupq	dbgb1	dbgb2	rss	maxop	p50	p99	tag
551091	0	0	0.0	2236.1	262.8	0.000	0.000	0.004	0.488	721907	39.4	1.310	57	15.6	16.7	5.0	0.100	23476	14186	480m.fbmy5635_202203072101.cy9c_u
526316	0	0	0.0	2081.5	247.3	0.000	0.000	0.004	0.481	719241	38.7	1.367	59	15.6	16.7	4.8	0.100	22093	14186	480m.fbmy5635_202205192101.cy9c_u
528634	0	0	0.0	2095.3	250.1	0.000	0.000	0.004	0.484	710411	38.9	1.344	59	15.9	17.1	4.8	0.110	22375	13985	480m.fbmy5635_202208092101.cy9c_u
528053	0	0	0.0	2102.3	249.8	0.000	0.000	0.004	0.484	668029	38.9	1.265	59	15.9	17.0	4.9	0.102	22480	13586	480m.fbmy5635_202210112144.cy9c_u
541150	0	0	0.0	1767.8	208.2	0.000	0.000	0.003	0.394	658328	38.6	1.217	57	15.2	16.3	3.7	0.097	23576	14585	480m.fbmy5635_202302162102.cy9c_u
529801	0	0	0.0	1761.3	206.8	0.000	0.000	0.003	0.400	664892	38.6	1.255	58	15.8	17.0	3.9	0.100	22776	14683	480m.fbmy5635_202304122154.cy9c_u
529801	0	0	0.0	1706.5	200.0	0.000	0.000	0.003	0.387	659103	38.7	1.244	58	15.3	16.4	3.7	0.111	22478	13788	480m.fbmy5635_202305292102.cy9c_u
541150	0	0	0.0	1719.9	201.3	0.000	0.000	0.003	0.381	634107	40.0	1.172	59	15.4	16.6	3.7	0.096	23279	14785	480m.fbmy5635_20230529_832.cy9c_u
518919	0	0	0.0	1651.2	194.0	0.000	0.000	0.003	0.383	614343	39.8	1.184	61	15.7	16.8	3.8	0.103	22477	14387	480m.fbmy5635_20230529_843.cy9c_u
515575	0	0	0.0	1634.2	191.5	0.000	0.000	0.003	0.380	634367	39.4	1.230	61	15.3	16.5	3.7	0.117	22176	14086	480m.fbmy5635_20230529_850.cy9c_u
l.x
l.x: create secondary indexes
Performance metrics for all DBMS, not just the ones listed above. Some are normalized by throughput, others are not. Legend for results is here.
ips	qps	rps	rmbps	wps	wmbps	rpq	rkbpq	wpi	wkbpi	csps	cpups	cspq	cpupq	dbgb1	dbgb2	rss	maxop	p50	p99	tag
1428869	0	30	0.2	1971.4	216.9	0.000	0.000	0.001	0.155	32381	28.2	0.023	16	32.4	33.5	47.1	0.003	NA	NA	480m.fbmy5635_202203072101.cy9c_u
1403801	0	29	0.2	1918.9	211.5	0.000	0.000	0.001	0.154	32858	28.4	0.023	16	32.3	33.5	44.5	0.003	NA	NA	480m.fbmy5635_202205192101.cy9c_u
1403801	0	29	0.2	1926.5	211.5	0.000	0.000	0.001	0.154	33232	28.6	0.024	16	32.4	33.5	46.1	0.003	NA	NA	480m.fbmy5635_202208092101.cy9c_u
1399708	0	29	0.2	1909.7	209.5	0.000	0.000	0.001	0.153	33596	28.5	0.024	16	32.4	33.6	45.0	0.002	NA	NA	480m.fbmy5635_202210112144.cy9c_u
1407918	0	29	0.2	1796.9	195.6	0.000	0.000	0.001	0.142	31937	28.0	0.023	16	32.3	33.5	42.0	0.003	NA	NA	480m.fbmy5635_202302162102.cy9c_u
1403801	0	29	0.2	1805.3	197.3	0.000	0.000	0.001	0.144	31130	28.0	0.022	16	32.4	33.5	39.9	0.003	NA	NA	480m.fbmy5635_202304122154.cy9c_u
1403801	0	29	0.2	1803.7	196.8	0.000	0.000	0.001	0.144	31029	27.9	0.022	16	32.3	33.5	39.0	0.002	NA	NA	480m.fbmy5635_202305292102.cy9c_u
1403801	0	29	0.2	1793.1	195.2	0.000	0.000	0.001	0.142	33181	28.8	0.024	16	32.3	33.5	40.5	0.002	NA	NA	480m.fbmy5635_20230529_832.cy9c_u
1383573	0	29	0.2	1811.3	198.4	0.000	0.000	0.001	0.147	34733	28.9	0.025	17	32.3	33.5	41.7	0.003	NA	NA	480m.fbmy5635_20230529_843.cy9c_u
1387572	0	29	0.2	1774.9	193.3	0.000	0.000	0.001	0.143	34035	29.1	0.025	17	32.4	33.5	41.4	0.003	NA	NA	480m.fbmy5635_20230529_850.cy9c_u
l.i1
l.i1: continue load after secondary indexes created
Performance metrics for all DBMS, not just the ones listed above. Some are normalized by throughput, others are not. Legend for results is here.
ips	qps	rps	rmbps	wps	wmbps	rpq	rkbpq	wpi	wkbpi	csps	cpups	cspq	cpupq	dbgb1	dbgb2	rss	maxop	p50	p99	tag
70734	0	97	1.1	1851.9	220.9	0.001	0.017	0.026	3.199	207064	17.3	2.927	196	42.2	42.3	177.3	0.091	2947	2647	480m.fbmy5635_202203072101.cy9c_u
67302	0	124	1.1	1706.8	204.0	0.002	0.017	0.025	3.104	193528	16.9	2.876	201	46.0	46.1	177.1	0.218	2798	2498	480m.fbmy5635_202205192101.cy9c_u
66464	0	140	1.2	1722.1	205.5	0.002	0.018	0.026	3.167	188717	17.0	2.839	205	46.0	46.1	177.3	0.142	2797	2497	480m.fbmy5635_202208092101.cy9c_u
66489	0	137	1.2	1710.2	204.1	0.002	0.018	0.026	3.144	190236	17.1	2.861	206	44.5	44.6	177.3	0.160	2797	2497	480m.fbmy5635_202210112144.cy9c_u
58887	0	74	0.9	1235.3	146.3	0.001	0.016	0.021	2.545	208901	16.1	3.547	219	38.8	39.0	178.1	0.340	2498	799	480m.fbmy5635_202302162102.cy9c_u
57290	0	107	1.0	1144.9	135.0	0.002	0.018	0.020	2.414	244208	16.5	4.263	230	44.9	45.0	177.9	1.050	2497	300	480m.fbmy5635_202304122154.cy9c_u
57293	0	115	1.0	1142.2	134.7	0.002	0.018	0.020	2.408	248925	16.9	4.345	236	49.6	49.8	177.9	1.341	2497	300	480m.fbmy5635_202305292102.cy9c_u
57512	0	147	1.3	1157.2	136.1	0.003	0.024	0.020	2.423	240384	17.7	4.180	246	45.1	45.3	177.9	0.363	2497	400	480m.fbmy5635_20230529_832.cy9c_u
57441	0	120	1.2	1147.5	135.2	0.002	0.021	0.020	2.410	235831	18.1	4.106	252	42.8	43.0	178.2	0.544	2497	400	480m.fbmy5635_20230529_843.cy9c_u
58694	0	82	0.9	1236.8	146.0	0.001	0.016	0.021	2.548	203875	17.7	3.474	241	39.9	40.0	178.0	0.808	2498	599	480m.fbmy5635_20230529_850.cy9c_u
q100.1
q100.1: range queries with 100 insert/s per client
Performance metrics for all DBMS, not just the ones listed above. Some are normalized by throughput, others are not. Legend for results is here.
ips	qps	rps	rmbps	wps	wmbps	rpq	rkbpq	wpi	wkbpi	csps	cpups	cspq	cpupq	dbgb1	dbgb2	rss	maxop	p50	p99	tag
2381	106833	5	0.1	98.0	11.1	0.000	0.001	0.041	4.779	485770	31.3	4.547	234	36.0	37.9	178.7	0.035	4460	3916	480m.fbmy5635_202203072101.cy9c_u
2381	104482	11	0.1	133.1	15.5	0.000	0.001	0.056	6.666	478410	31.6	4.579	242	35.8	37.7	178.7	0.018	4396	3836	480m.fbmy5635_202205192101.cy9c_u
2381	103340	20	0.2	117.9	13.3	0.000	0.002	0.050	5.739	467533	31.5	4.524	244	35.7	37.6	178.5	0.055	4348	3788	480m.fbmy5635_202208092101.cy9c_u
2381	103425	17	0.2	144.4	16.7	0.000	0.002	0.061	7.166	467807	31.7	4.523	245	35.7	37.6	179.0	0.067	4316	3756	480m.fbmy5635_202210112144.cy9c_u
2381	101221	14	0.3	83.0	9.3	0.000	0.003	0.035	3.987	452000	31.5	4.465	249	36.9	38.9	179.5	0.047	4251	3724	480m.fbmy5635_202302162102.cy9c_u
2381	101199	8	0.2	85.2	9.5	0.000	0.002	0.036	4.096	451916	31.4	4.466	248	36.6	38.6	179.4	0.054	4220	3724	480m.fbmy5635_202304122154.cy9c_u
2381	101644	16	0.4	95.4	10.8	0.000	0.004	0.040	4.645	456455	31.6	4.491	249	36.9	38.9	179.7	0.063	4188	3628	480m.fbmy5635_202305292102.cy9c_u
2381	99011	14	0.3	87.1	9.8	0.000	0.003	0.037	4.205	445413	32.3	4.499	261	36.7	38.7	179.6	0.033	4204	3548	480m.fbmy5635_20230529_832.cy9c_u
2381	97081	17	0.4	90.2	10.2	0.000	0.004	0.038	4.366	437948	32.3	4.511	266	36.9	38.9	179.6	0.074	4092	3613	480m.fbmy5635_20230529_843.cy9c_u
2381	97178	17	0.2	74.9	8.2	0.000	0.002	0.031	3.543	437149	32.1	4.498	264	36.9	38.9	179.3	0.076	4044	3580	480m.fbmy5635_20230529_850.cy9c_u
q500.1
q500.1: range queries with 500 insert/s per client
Performance metrics for all DBMS, not just the ones listed above. Some are normalized by throughput, others are not. Legend for results is here.
ips	qps	rps	rmbps	wps	wmbps	rpq	rkbpq	wpi	wkbpi	csps	cpups	cspq	cpupq	dbgb1	dbgb2	rss	maxop	p50	p99	tag
11907	100813	24	0.3	381.7	44.5	0.000	0.003	0.032	3.828	474091	33.1	4.703	263	36.0	37.2	183.5	0.082	4172	3676	480m.fbmy5635_202203072101.cy9c_u
11907	95911	26	0.3	377.4	44.3	0.000	0.003	0.032	3.814	457276	33.2	4.768	277	36.4	37.6	183.5	0.079	3964	3453	480m.fbmy5635_202205192101.cy9c_u
11907	95167	17	0.2	379.7	44.4	0.000	0.002	0.032	3.815	449066	33.3	4.719	280	36.1	37.3	183.3	0.083	3980	3453	480m.fbmy5635_202208092101.cy9c_u
11907	95203	21	0.3	377.1	44.1	0.000	0.003	0.032	3.795	447943	33.4	4.705	281	36.5	37.7	183.9	0.082	3980	3469	480m.fbmy5635_202210112144.cy9c_u
11907	92228	16	0.2	308.8	35.8	0.000	0.002	0.026	3.082	431543	33.4	4.679	290	37.3	38.6	183.0	0.082	3884	3357	480m.fbmy5635_202302162102.cy9c_u
11907	93164	21	0.3	309.2	35.8	0.000	0.003	0.026	3.079	435074	33.4	4.670	287	36.8	38.0	183.1	0.081	3884	3389	480m.fbmy5635_202304122154.cy9c_u
11907	92902	17	0.2	301.8	34.9	0.000	0.002	0.025	3.004	436837	33.4	4.702	288	36.8	38.0	183.0	0.081	3900	3388	480m.fbmy5635_202305292102.cy9c_u
11911	90599	20	0.3	304.2	35.2	0.000	0.003	0.026	3.027	427095	34.2	4.714	302	37.0	38.2	183.0	0.086	3788	3292	480m.fbmy5635_20230529_832.cy9c_u
11907	87620	19	0.2	302.5	35.1	0.000	0.003	0.025	3.018	416329	34.4	4.752	314	37.0	38.3	183.0	0.111	3661	3149	480m.fbmy5635_20230529_843.cy9c_u
11907	87805	75	0.4	304.4	35.2	0.001	0.004	0.026	3.030	416128	34.3	4.739	313	37.1	38.3	182.9	0.089	3661	3196	480m.fbmy5635_20230529_850.cy9c_u
q1000.1
q1000.1: range queries with 1000 insert/s per client
Performance metrics for all DBMS, not just the ones listed above. Some are normalized by throughput, others are not. Legend for results is here.
ips	qps	rps	rmbps	wps	wmbps	rpq	rkbpq	wpi	wkbpi	csps	cpups	cspq	cpupq	dbgb1	dbgb2	rss	maxop	p50	p99	tag
23828	87179	70	0.5	665.4	78.1	0.001	0.006	0.028	3.357	456969	35.6	5.242	327	38.1	39.8	185.1	0.112	3628	3148	480m.fbmy5635_202203072101.cy9c_u
23821	83120	39	0.3	672.3	78.9	0.000	0.004	0.028	3.392	445239	36.2	5.357	348	37.8	39.5	185.2	0.094	3453	2973	480m.fbmy5635_202205192101.cy9c_u
23821	83973	28	0.3	670.0	78.7	0.000	0.003	0.028	3.383	439450	35.9	5.233	342	37.8	39.5	185.2	0.184	3485	3005	480m.fbmy5635_202208092101.cy9c_u
23828	82775	27	0.2	662.3	77.3	0.000	0.003	0.028	3.323	435779	36.1	5.265	349	38.0	39.7	185.4	0.112	3421	2941	480m.fbmy5635_202210112144.cy9c_u
23828	81267	42	0.5	587.0	68.7	0.001	0.006	0.025	2.951	428043	36.8	5.267	362	37.7	39.4	185.1	0.078	3373	2877	480m.fbmy5635_202302162102.cy9c_u
23828	81708	42	0.5	585.1	68.4	0.001	0.006	0.025	2.939	427012	36.7	5.226	359	37.4	39.0	185.1	0.128	3389	2893	480m.fbmy5635_202304122154.cy9c_u
23834	81594	47	0.5	585.5	68.7	0.001	0.006	0.025	2.952	433158	36.9	5.309	362	37.4	39.1	185.2	0.093	3405	2893	480m.fbmy5635_202305292102.cy9c_u
23828	80171	46	0.5	588.0	68.2	0.001	0.006	0.025	2.931	425611	37.7	5.309	376	37.4	39.1	185.1	0.091	3325	2829	480m.fbmy5635_20230529_832.cy9c_u
23828	77262	37	0.4	582.4	67.4	0.000	0.005	0.024	2.897	413711	37.9	5.355	392	37.7	39.4	185.4	0.059	3213	2717	480m.fbmy5635_20230529_843.cy9c_u
23828	77822	89	0.5	592.6	68.8	0.001	0.007	0.025	2.959	415025	37.9	5.333	390	39.2	40.9	185.3	0.100	3245	2733	480m.fbmy5635_20230529_850.cy9c_u
l.i0
- l.i0: load without secondary indexes
- Legend for results is here.
- Each entry lists the percentage of responses that fit in that bucket (slower than max time for previous bucket, faster than min time for next bucket).
Insert response time histogram
256us	1ms	4ms	16ms	64ms	256ms	1s	4s	16s	gt	max	tag
0.000	0.364	48.064	51.530	0.001	0.041	0.000	0.000	0.000	0.000	0.100	fbmy5635_202203072101.cy9c_u
0.000	0.270	39.209	60.480	0.000	0.041	0.000	0.000	0.000	0.000	0.100	fbmy5635_202205192101.cy9c_u
0.000	0.267	38.366	61.325	0.002	0.041	0.000	0.000	0.000	0.000	0.110	fbmy5635_202208092101.cy9c_u
0.000	0.277	40.677	59.003	0.002	0.041	0.000	0.000	0.000	0.000	0.102	fbmy5635_202210112144.cy9c_u
0.000	0.204	46.894	52.860	0.001	0.041	0.000	0.000	0.000	0.000	0.097	fbmy5635_202302162102.cy9c_u
0.000	0.203	42.912	56.844	0.001	0.041	0.000	0.000	0.000	0.000	0.100	fbmy5635_202304122154.cy9c_u
0.000	0.169	44.519	55.271	nonzero	0.041	0.000	0.000	0.000	0.000	0.111	fbmy5635_202305292102.cy9c_u
0.000	0.154	44.826	54.977	0.001	0.041	0.000	0.000	0.000	0.000	0.096	fbmy5635_20230529_832.cy9c_u
0.000	0.129	37.458	62.371	0.001	0.041	0.000	0.000	0.000	0.000	0.103	fbmy5635_20230529_843.cy9c_u
0.000	0.123	38.193	61.642	0.001	0.041	0.000	0.000	0.000	0.000	0.117	fbmy5635_20230529_850.cy9c_u
l.x
- l.x: create secondary indexes
- Legend for results is here.
- Each entry lists the percentage of responses that fit in that bucket (slower than max time for previous bucket, faster than min time for next bucket).
TODO - determine whether there is data for create index response time
l.i1
- l.i1: continue load after secondary indexes created
- Legend for results is here.
- Each entry lists the percentage of responses that fit in that bucket (slower than max time for previous bucket, faster than min time for next bucket).
Insert response time histogram
256us	1ms	4ms	16ms	64ms	256ms	1s	4s	16s	gt	max	tag
0.000	0.001	0.051	31.710	68.238	0.001	0.000	0.000	0.000	0.000	0.091	fbmy5635_202203072101.cy9c_u
0.000	nonzero	0.043	24.771	75.184	0.002	0.000	0.000	0.000	0.000	0.218	fbmy5635_202205192101.cy9c_u
0.000	0.000	0.049	23.204	76.744	0.004	0.000	0.000	0.000	0.000	0.142	fbmy5635_202208092101.cy9c_u
0.000	0.000	0.046	23.245	76.706	0.004	0.000	0.000	0.000	0.000	0.160	fbmy5635_202210112144.cy9c_u
0.000	0.000	0.046	13.080	86.641	0.232	0.001	0.000	0.000	0.000	0.340	fbmy5635_202302162102.cy9c_u
0.000	0.000	0.040	13.382	86.058	0.499	0.017	0.004	0.000	0.000	1.050	fbmy5635_202304122154.cy9c_u
0.000	0.000	0.042	13.635	85.783	0.516	0.021	0.003	0.000	0.000	1.341	fbmy5635_202305292102.cy9c_u
0.000	0.000	0.050	14.537	84.833	0.574	0.006	0.000	0.000	0.000	0.363	fbmy5635_20230529_832.cy9c_u
0.000	0.000	0.063	13.791	85.684	0.446	0.016	0.000	0.000	0.000	0.544	fbmy5635_20230529_843.cy9c_u
0.000	0.000	0.040	13.558	86.192	0.189	0.020	0.000	0.000	0.000	0.808	fbmy5635_20230529_850.cy9c_u
Delete response time histogram
256us	1ms	4ms	16ms	64ms	256ms	1s	4s	16s	gt	max	tag
0.000	0.003	0.050	37.218	62.728	0.001	0.000	0.000	0.000	0.000	0.168	fbmy5635_202203072101.cy9c_u
0.000	nonzero	0.044	27.279	72.673	0.003	nonzero	0.000	0.000	0.000	0.274	fbmy5635_202205192101.cy9c_u
0.000	nonzero	0.049	26.032	73.913	0.005	nonzero	0.000	0.000	0.000	0.281	fbmy5635_202208092101.cy9c_u
0.000	0.002	0.045	25.742	74.205	0.005	nonzero	0.000	0.000	0.000	0.275	fbmy5635_202210112144.cy9c_u
0.000	nonzero	0.047	13.914	85.797	0.240	0.002	0.000	0.000	0.000	0.849	fbmy5635_202302162102.cy9c_u
0.000	nonzero	0.040	13.835	85.595	0.509	0.017	0.004	0.000	0.000	1.051	fbmy5635_202304122154.cy9c_u
0.000	nonzero	0.043	13.968	85.438	0.527	0.021	0.003	0.000	0.000	1.341	fbmy5635_202305292102.cy9c_u
0.000	nonzero	0.050	14.856	84.495	0.592	0.006	0.000	0.000	0.000	0.937	fbmy5635_20230529_832.cy9c_u
0.000	nonzero	0.064	14.129	85.334	0.457	0.016	0.000	0.000	0.000	0.799	fbmy5635_20230529_843.cy9c_u
0.000	0.000	0.041	14.338	85.407	0.194	0.020	0.000	0.000	0.000	0.912	fbmy5635_20230529_850.cy9c_u
q100.1
- q100.1: range queries with 100 insert/s per client
- Legend for results is here.
- Each entry lists the percentage of responses that fit in that bucket (slower than max time for previous bucket, faster than min time for next bucket).
Query response time histogram
256us	1ms	4ms	16ms	64ms	256ms	1s	4s	16s	gt	max	tag
84.488	15.511	0.001	nonzero	nonzero	0.000	0.000	0.000	0.000	0.000	0.035	fbmy5635_202203072101.cy9c_u
81.186	18.813	0.001	nonzero	nonzero	0.000	0.000	0.000	0.000	0.000	0.018	fbmy5635_202205192101.cy9c_u
79.756	20.243	0.001	nonzero	nonzero	0.000	0.000	0.000	0.000	0.000	0.055	fbmy5635_202208092101.cy9c_u
79.648	20.351	0.001	nonzero	0.000	nonzero	0.000	0.000	0.000	0.000	0.067	fbmy5635_202210112144.cy9c_u
75.991	24.008	0.001	nonzero	nonzero	0.000	0.000	0.000	0.000	0.000	0.047	fbmy5635_202302162102.cy9c_u
75.956	24.043	0.001	nonzero	nonzero	0.000	0.000	0.000	0.000	0.000	0.054	fbmy5635_202304122154.cy9c_u
76.670	23.328	0.001	nonzero	nonzero	0.000	0.000	0.000	0.000	0.000	0.063	fbmy5635_202305292102.cy9c_u
72.627	27.372	0.001	nonzero	nonzero	0.000	0.000	0.000	0.000	0.000	0.033	fbmy5635_20230529_832.cy9c_u
69.420	30.578	0.001	nonzero	nonzero	nonzero	0.000	0.000	0.000	0.000	0.074	fbmy5635_20230529_843.cy9c_u
69.438	30.561	0.001	nonzero	nonzero	nonzero	0.000	0.000	0.000	0.000	0.076	fbmy5635_20230529_850.cy9c_u
Insert response time histogram
256us	1ms	4ms	16ms	64ms	256ms	1s	4s	16s	gt	max	tag
0.000	0.000	99.998	0.002	0.000	0.000	0.000	0.000	0.000	0.000	0.005	fbmy5635_202203072101.cy9c_u
0.000	0.000	99.997	0.002	0.001	0.000	0.000	0.000	0.000	0.000	0.040	fbmy5635_202205192101.cy9c_u
0.000	0.000	99.998	0.002	0.000	0.000	0.000	0.000	0.000	0.000	0.005	fbmy5635_202208092101.cy9c_u
0.000	0.000	99.999	0.001	0.000	0.000	0.000	0.000	0.000	0.000	0.006	fbmy5635_202210112144.cy9c_u
0.000	0.000	99.995	0.005	0.000	0.000	0.000	0.000	0.000	0.000	0.007	fbmy5635_202302162102.cy9c_u
0.000	0.000	99.975	0.025	0.000	0.000	0.000	0.000	0.000	0.000	0.006	fbmy5635_202304122154.cy9c_u
0.000	0.000	99.913	0.087	0.000	0.000	0.000	0.000	0.000	0.000	0.007	fbmy5635_202305292102.cy9c_u
0.000	0.000	99.986	0.014	0.000	0.000	0.000	0.000	0.000	0.000	0.007	fbmy5635_20230529_832.cy9c_u
0.000	0.000	99.998	0.002	0.000	0.000	0.000	0.000	0.000	0.000	0.005	fbmy5635_20230529_843.cy9c_u
0.000	0.000	99.972	0.028	0.000	0.000	0.000	0.000	0.000	0.000	0.007	fbmy5635_20230529_850.cy9c_u
Delete response time histogram
256us	1ms	4ms	16ms	64ms	256ms	1s	4s	16s	gt	max	tag
0.000	0.094	99.903	0.002	0.001	0.000	0.000	0.000	0.000	0.000	0.059	fbmy5635_202203072101.cy9c_u
0.000	0.002	99.992	0.002	0.003	0.001	0.000	0.000	0.000	0.000	0.076	fbmy5635_202205192101.cy9c_u
0.000	0.002	99.994	0.001	0.003	0.000	0.000	0.000	0.000	0.000	0.058	fbmy5635_202208092101.cy9c_u
0.000	0.001	99.995	0.001	0.002	0.001	0.000	0.000	0.000	0.000	0.073	fbmy5635_202210112144.cy9c_u
0.000	0.001	99.991	0.006	0.001	0.001	0.000	0.000	0.000	0.000	0.065	fbmy5635_202302162102.cy9c_u
0.000	0.001	99.987	0.011	0.001	0.000	0.000	0.000	0.000	0.000	0.020	fbmy5635_202304122154.cy9c_u
0.000	0.000	99.950	0.044	0.006	0.001	0.000	0.000	0.000	0.000	0.064	fbmy5635_202305292102.cy9c_u
0.000	0.000	99.986	0.012	0.002	0.000	0.000	0.000	0.000	0.000	0.045	fbmy5635_20230529_832.cy9c_u
0.000	0.001	99.990	0.008	0.001	0.001	0.000	0.000	0.000	0.000	0.082	fbmy5635_20230529_843.cy9c_u
0.000	0.000	99.986	0.011	0.002	0.001	0.000	0.000	0.000	0.000	0.078	fbmy5635_20230529_850.cy9c_u
q500.1
- q500.1: range queries with 500 insert/s per client
- Legend for results is here.
- Each entry lists the percentage of responses that fit in that bucket (slower than max time for previous bucket, faster than min time for next bucket).
Query response time histogram
256us	1ms	4ms	16ms	64ms	256ms	1s	4s	16s	gt	max	tag
76.116	23.882	0.001	nonzero	nonzero	nonzero	0.000	0.000	0.000	0.000	0.082	fbmy5635_202203072101.cy9c_u
67.040	32.958	0.001	nonzero	nonzero	nonzero	0.000	0.000	0.000	0.000	0.079	fbmy5635_202205192101.cy9c_u
65.812	34.187	0.001	nonzero	nonzero	nonzero	0.000	0.000	0.000	0.000	0.083	fbmy5635_202208092101.cy9c_u
65.754	34.244	0.001	nonzero	nonzero	nonzero	0.000	0.000	0.000	0.000	0.082	fbmy5635_202210112144.cy9c_u
59.718	40.279	0.002	nonzero	nonzero	nonzero	0.000	0.000	0.000	0.000	0.082	fbmy5635_202302162102.cy9c_u
61.675	38.322	0.002	nonzero	nonzero	nonzero	0.000	0.000	0.000	0.000	0.081	fbmy5635_202304122154.cy9c_u
61.034	38.963	0.002	nonzero	nonzero	nonzero	0.000	0.000	0.000	0.000	0.081	fbmy5635_202305292102.cy9c_u
56.428	43.569	0.003	nonzero	nonzero	nonzero	0.000	0.000	0.000	0.000	0.086	fbmy5635_20230529_832.cy9c_u
49.886	50.111	0.003	nonzero	nonzero	nonzero	0.000	0.000	0.000	0.000	0.111	fbmy5635_20230529_843.cy9c_u
50.325	49.672	0.003	nonzero	nonzero	nonzero	0.000	0.000	0.000	0.000	0.089	fbmy5635_20230529_850.cy9c_u
Insert response time histogram
256us	1ms	4ms	16ms	64ms	256ms	1s	4s	16s	gt	max	tag
0.000	0.001	98.931	1.065	0.002	0.001	0.000	0.000	0.000	0.000	0.077	fbmy5635_202203072101.cy9c_u
0.000	0.000	99.956	0.041	0.002	nonzero	0.000	0.000	0.000	0.000	0.079	fbmy5635_202205192101.cy9c_u
0.000	0.000	88.062	11.935	0.002	0.002	0.000	0.000	0.000	0.000	0.084	fbmy5635_202208092101.cy9c_u
0.000	0.000	93.970	6.026	0.002	0.001	0.000	0.000	0.000	0.000	0.082	fbmy5635_202210112144.cy9c_u
0.000	0.000	29.732	61.609	8.657	0.002	0.000	0.000	0.000	0.000	0.091	fbmy5635_202302162102.cy9c_u
0.000	0.000	25.330	72.294	2.373	0.004	0.000	0.000	0.000	0.000	0.094	fbmy5635_202304122154.cy9c_u
0.000	0.000	21.302	75.608	3.087	0.002	0.000	0.000	0.000	0.000	0.089	fbmy5635_202305292102.cy9c_u
0.000	0.000	29.798	68.817	1.383	0.002	0.000	0.000	0.000	0.000	0.086	fbmy5635_20230529_832.cy9c_u
0.000	0.000	8.861	62.721	28.416	0.002	0.000	0.000	0.000	0.000	0.098	fbmy5635_20230529_843.cy9c_u
0.000	0.000	23.008	64.893	12.095	0.004	0.000	0.000	0.000	0.000	0.106	fbmy5635_20230529_850.cy9c_u
Delete response time histogram
256us	1ms	4ms	16ms	64ms	256ms	1s	4s	16s	gt	max	tag
0.000	0.067	99.188	0.735	0.008	0.002	0.000	0.000	0.000	0.000	0.090	fbmy5635_202203072101.cy9c_u
0.000	0.002	99.955	0.030	0.009	0.003	0.000	0.000	0.000	0.000	0.088	fbmy5635_202205192101.cy9c_u
0.000	nonzero	89.873	10.114	0.009	0.003	0.000	0.000	0.000	0.000	0.088	fbmy5635_202208092101.cy9c_u
0.000	0.000	95.055	4.934	0.008	0.003	0.000	0.000	0.000	0.000	0.091	fbmy5635_202210112144.cy9c_u
0.000	0.000	31.269	60.820	7.908	0.002	0.000	0.000	0.000	0.000	0.091	fbmy5635_202302162102.cy9c_u
0.000	0.000	28.750	69.128	2.117	0.005	0.000	0.000	0.000	0.000	0.097	fbmy5635_202304122154.cy9c_u
0.000	0.000	24.081	73.198	2.717	0.004	0.000	0.000	0.000	0.000	0.094	fbmy5635_202305292102.cy9c_u
0.000	0.000	32.236	66.571	1.190	0.003	0.000	0.000	0.000	0.000	0.087	fbmy5635_20230529_832.cy9c_u
0.000	0.000	9.593	64.199	26.205	0.003	0.000	0.000	0.000	0.000	0.098	fbmy5635_20230529_843.cy9c_u
0.000	0.000	24.010	64.950	11.033	0.007	0.000	0.000	0.000	0.000	0.103	fbmy5635_20230529_850.cy9c_u
q1000.1
- q1000.1: range queries with 1000 insert/s per client
- Legend for results is here.
- Each entry lists the percentage of responses that fit in that bucket (slower than max time for previous bucket, faster than min time for next bucket).
Query response time histogram
256us	1ms	4ms	16ms	64ms	256ms	1s	4s	16s	gt	max	tag
48.164	51.829	0.007	nonzero	nonzero	nonzero	0.000	0.000	0.000	0.000	0.112	fbmy5635_202203072101.cy9c_u
38.981	61.010	0.008	nonzero	nonzero	nonzero	0.000	0.000	0.000	0.000	0.094	fbmy5635_202205192101.cy9c_u
40.957	59.040	0.003	nonzero	nonzero	nonzero	0.000	0.000	0.000	0.000	0.184	fbmy5635_202208092101.cy9c_u
38.119	61.874	0.007	nonzero	nonzero	nonzero	0.000	0.000	0.000	0.000	0.112	fbmy5635_202210112144.cy9c_u
34.891	65.098	0.011	nonzero	nonzero	nonzero	0.000	0.000	0.000	0.000	0.078	fbmy5635_202302162102.cy9c_u
35.867	64.122	0.010	nonzero	nonzero	nonzero	0.000	0.000	0.000	0.000	0.128	fbmy5635_202304122154.cy9c_u
35.622	64.367	0.012	nonzero	nonzero	nonzero	0.000	0.000	0.000	0.000	0.093	fbmy5635_202305292102.cy9c_u
32.757	67.230	0.012	nonzero	nonzero	nonzero	0.000	0.000	0.000	0.000	0.091	fbmy5635_20230529_832.cy9c_u
26.253	73.734	0.013	nonzero	nonzero	0.000	0.000	0.000	0.000	0.000	0.059	fbmy5635_20230529_843.cy9c_u
27.428	72.558	0.014	nonzero	nonzero	nonzero	0.000	0.000	0.000	0.000	0.100	fbmy5635_20230529_850.cy9c_u
Insert response time histogram
256us	1ms	4ms	16ms	64ms	256ms	1s	4s	16s	gt	max	tag
0.000	0.000	24.808	46.479	28.713	0.000	0.000	0.000	0.000	0.000	0.051	fbmy5635_202203072101.cy9c_u
0.000	0.000	19.455	39.786	40.757	0.001	0.000	0.000	0.000	0.000	0.098	fbmy5635_202205192101.cy9c_u
0.000	0.000	47.029	52.917	0.053	0.001	0.000	0.000	0.000	0.000	0.097	fbmy5635_202208092101.cy9c_u
0.000	0.000	27.388	41.072	31.540	0.000	0.000	0.000	0.000	0.000	0.056	fbmy5635_202210112144.cy9c_u
0.000	0.000	3.646	13.131	83.220	0.003	0.000	0.000	0.000	0.000	0.136	fbmy5635_202302162102.cy9c_u
0.000	0.000	3.588	13.999	82.411	0.002	0.000	0.000	0.000	0.000	0.126	fbmy5635_202304122154.cy9c_u
0.000	0.000	1.037	14.351	84.610	0.002	0.000	0.000	0.000	0.000	0.088	fbmy5635_202305292102.cy9c_u
0.000	0.000	3.291	16.923	79.786	0.000	0.000	0.000	0.000	0.000	0.056	fbmy5635_20230529_832.cy9c_u
0.000	0.000	4.245	20.516	75.232	0.007	0.000	0.000	0.000	0.000	0.127	fbmy5635_20230529_843.cy9c_u
0.000	0.000	3.099	13.933	82.966	0.001	0.000	0.000	0.000	0.000	0.099	fbmy5635_20230529_850.cy9c_u
Delete response time histogram
256us	1ms	4ms	16ms	64ms	256ms	1s	4s	16s	gt	max	tag
0.000	0.005	25.182	46.590	28.222	0.001	0.000	0.000	0.000	0.000	0.136	fbmy5635_202203072101.cy9c_u
0.000	nonzero	19.650	40.238	40.110	0.002	0.000	0.000	0.000	0.000	0.137	fbmy5635_202205192101.cy9c_u
0.000	0.000	50.484	49.462	0.051	0.002	0.000	0.000	0.000	0.000	0.097	fbmy5635_202208092101.cy9c_u
0.000	0.000	27.688	41.286	31.025	0.001	0.000	0.000	0.000	0.000	0.147	fbmy5635_202210112144.cy9c_u
0.000	0.000	3.571	14.207	82.219	0.004	0.000	0.000	0.000	0.000	0.134	fbmy5635_202302162102.cy9c_u
0.000	0.000	3.585	15.257	81.155	0.003	0.000	0.000	0.000	0.000	0.128	fbmy5635_202304122154.cy9c_u
0.000	0.000	1.020	15.592	83.384	0.003	0.000	0.000	0.000	0.000	0.126	fbmy5635_202305292102.cy9c_u
0.000	0.000	3.259	18.306	78.434	0.001	0.000	0.000	0.000	0.000	0.137	fbmy5635_20230529_832.cy9c_u
0.000	0.000	4.207	22.004	73.780	0.008	0.000	0.000	0.000	0.000	0.129	fbmy5635_20230529_843.cy9c_u
0.000	0.000	3.068	15.154	81.775	0.003	0.000	0.000	0.000	0.000	0.235	fbmy5635_20230529_850.cy9c_u