Introduction
This is a report for the insert benchmark with 800M docs and 1 client(s). It is generated by scripts (bash, awk, sed) and Tufte might not be impressed. An overview of the insert benchmark is here and a short update is here. Below, by DBMS, I mean DBMS+version.config. An example is my8020.c10b40 where my means MySQL, 8020 is version 8.0.20 and c10b40 is the name for the configuration file.
The test server has 8 AMD cores, 16G RAM and an NVMe SSD. It is described here as the Beelink. The benchmark was run with 1 client and there were 1 or 3 connections per client (1 for queries or inserts without rate limits, 1+1 for rate limited inserts+deletes). It uses 1 table. It loads 800M rows per table without secondary indexes, creates secondary indexes, then inserts 100M rows per table with a delete per insert to avoid growing the table. It then does 3 read+write tests for 3600s each that do queries as fast as possible with 100, 500 and then 1000 inserts/second/client concurrent with the queries and 1000 deletes/second to avoid growing the table. The database is larger than RAM. Clients and the DBMS share one server. The per-database configs are in the per-database subdirectories here.
The tested DBMS are:
- fbmy5635_rel_202104072149.cy10a5_bee - MyRocks 5.6.35 from 20210407 at git hash (f896415fa0 MySQL, 0f8c041ea RocksDB), RocksDB 6.19, cy10a5_bee config that adds rocksdb_max_subcompactions=2
- fbmy5635_rel_202203072101.cy10a5_bee - MyRocks 5.6.35 from 20220307 at git hash (e7d976ee MySQL, df4d3cf6fd RocksDB), RocksDB 6.28.2, cy10a5_bee config that adds rocksdb_max_subcompactions=2
- fbmy5635_rel_202205192101.cy10a5_bee - MyRocks 5.6.35 from 20220519 at git hash (d503bd77 MySQL, f2f26b15 RocksDB), RocksDB 7.2.2, cy10a5_bee config that adds rocksdb_max_subcompactions=2
- fbmy5635_rel_202208092101.cy10a5_bee - MyRocks 5.6.35 from 20220809 at git hash (877a0e585 MySQL, 8e0f4952 RocksDB), RocksDB 7.3.1, cy10a5_bee config that adds rocksdb_max_subcompactions=2
- fbmy5635_rel_202210112144.cy10a5_bee - MyRocks 5.6.35 from 20221011 at git hash (c691c7160 MySQL, 8e0f4952 RocksDB), RocksDB 7.3.1, cy10a5_bee config that adds rocksdb_max_subcompactions=2
- fbmy5635_rel_202302162102.cy10a5_bee - MyRocks 5.6.35 from 20230216 at git hash (21a2b0aa MySQL, e5dcebf7 RocksDB), RocksDB 7.10.0, cy10a5_bee config that adds rocksdb_max_subcompactions=2
- fbmy5635_rel_202304122154.cy10a5_bee - MyRocks 5.6.35 from 20230412 at git hash (205c31dd MySQL, 3258b5c3 RocksDB), RocksDB 7.10.2, cy10a5_bee config that adds rocksdb_max_subcompactions=2
- fbmy5635_rel_202305292102.cy10a5_bee - MyRocks 5.6.35 from 20230529 at git hash (b739eac1 MySQL, 03057204 RocksDB), RocksDB 8.2.1, cy10a5_bee config that adds rocksdb_max_subcompactions=2
- fbmy5635_rel_20230529_832.cy10a5_bee - MyRocks 5.6.35 from 20230529 at git hash (b739eac1 MySQL), but with RocksDB 8.3.2, cy10a5_bee config that adds rocksdb_max_subcompactions=2
- fbmy5635_rel_20230529_843.cy10a5_bee - MyRocks 5.6.35 from 20230529 at git hash (b739eac1 MySQL), but with RocksDB 8.3.2, cy10a5_bee config that adds rocksdb_max_subcompactions=2
- fbmy5635_rel_20230529_850.cy10a5_bee - MyRocks 5.6.35 from 20230529 at git hash (b739eac1 MySQL), but with RocksDB 8.3.2, cy10a5_bee config that adds rocksdb_max_subcompactions=2
Contents
- Summary
- l.i0: load without secondary indexes
- l.x: create secondary indexes
- l.i1: continue load after secondary indexes created
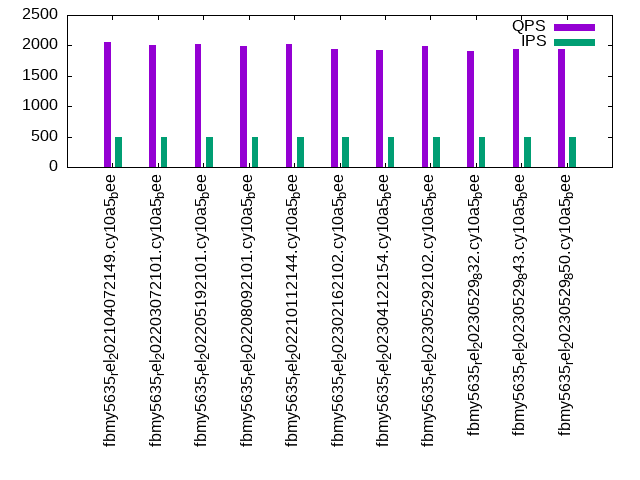
- q100.1: range queries with 100 insert/s per client
- q500.1: range queries with 500 insert/s per client
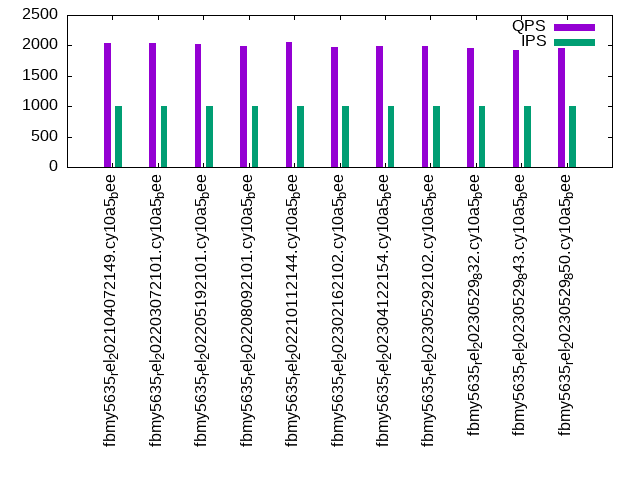
- q1000.1: range queries with 1000 insert/s per client
Summary
The numbers are inserts/s for l.i0 and l.i1, indexed docs (or rows) /s for l.x and queries/s for q*.2. The values are the average rate over the entire test for inserts (IPS) and queries (QPS). The range of values for IPS and QPS is split into 3 parts: bottom 25%, middle 50%, top 25%. Values in the bottom 25% have a red background, values in the top 25% have a green background and values in the middle have no color. A gray background is used for values that can be ignored because the DBMS did not sustain the target insert rate. Red backgrounds are not used when the minimum value is within 80% of the max value.
| dbms | l.i0 | l.x | l.i1 | q100.1 | q500.1 | q1000.1 |
|---|---|---|---|---|---|---|
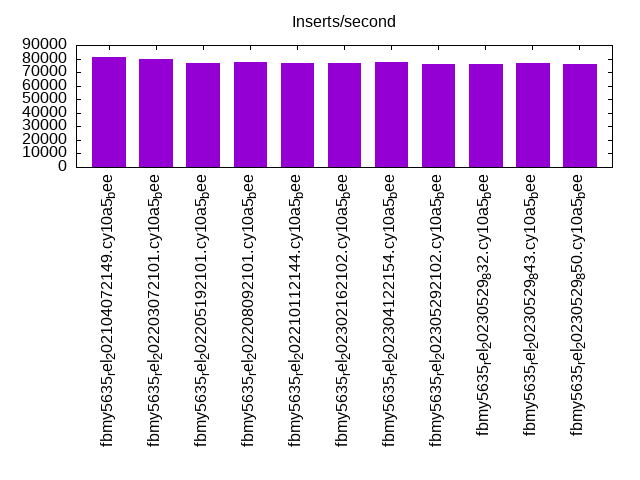
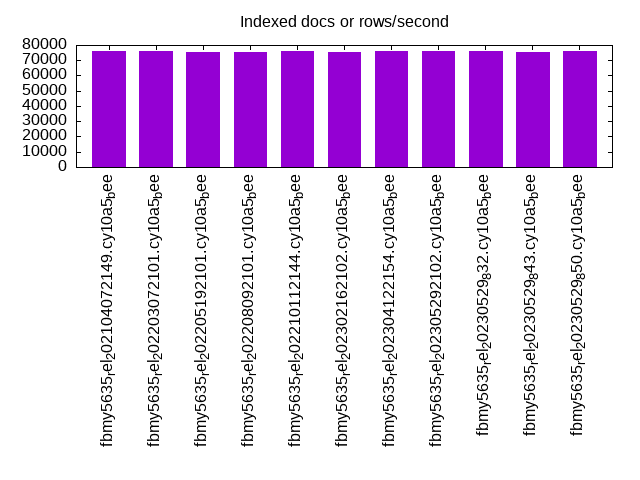
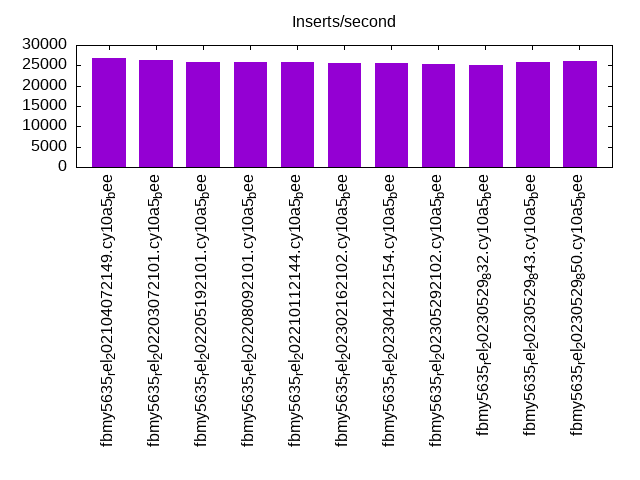
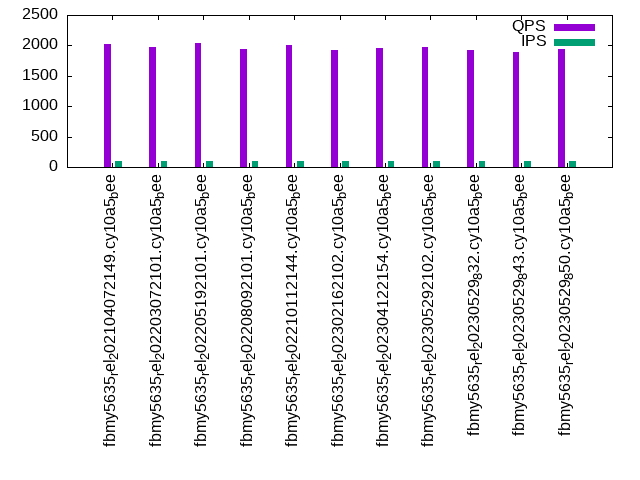
| fbmy5635_rel_202104072149.cy10a5_bee | 81086 | 76019 | 26745 | 2028 | 2048 | 2044 |
| fbmy5635_rel_202203072101.cy10a5_bee | 79499 | 76026 | 26233 | 1979 | 2001 | 2043 |
| fbmy5635_rel_202205192101.cy10a5_bee | 76716 | 75481 | 25753 | 2038 | 2019 | 2026 |
| fbmy5635_rel_202208092101.cy10a5_bee | 77250 | 75212 | 25840 | 1949 | 1984 | 1985 |
| fbmy5635_rel_202210112144.cy10a5_bee | 76967 | 75753 | 25773 | 2002 | 2024 | 2051 |
| fbmy5635_rel_202302162102.cy10a5_bee | 76908 | 75417 | 25588 | 1930 | 1940 | 1972 |
| fbmy5635_rel_202304122154.cy10a5_bee | 77265 | 75738 | 25562 | 1956 | 1922 | 1984 |
| fbmy5635_rel_202305292102.cy10a5_bee | 75944 | 75860 | 25381 | 1972 | 1997 | 1987 |
| fbmy5635_rel_20230529_832.cy10a5_bee | 76307 | 76004 | 25107 | 1926 | 1914 | 1951 |
| fbmy5635_rel_20230529_843.cy10a5_bee | 76621 | 75467 | 25813 | 1888 | 1933 | 1919 |
| fbmy5635_rel_20230529_850.cy10a5_bee | 76067 | 76004 | 26076 | 1944 | 1940 | 1957 |
This table has relative throughput, throughput for the DBMS relative to the DBMS in the first line, using the absolute throughput from the previous table. Values less than 0.95 have a yellow background. Values greater than 1.05 have a blue background.
| dbms | l.i0 | l.x | l.i1 | q100.1 | q500.1 | q1000.1 |
|---|---|---|---|---|---|---|
| fbmy5635_rel_202104072149.cy10a5_bee | 1.00 | 1.00 | 1.00 | 1.00 | 1.00 | 1.00 |
| fbmy5635_rel_202203072101.cy10a5_bee | 0.98 | 1.00 | 0.98 | 0.98 | 0.98 | 1.00 |
| fbmy5635_rel_202205192101.cy10a5_bee | 0.95 | 0.99 | 0.96 | 1.00 | 0.99 | 0.99 |
| fbmy5635_rel_202208092101.cy10a5_bee | 0.95 | 0.99 | 0.97 | 0.96 | 0.97 | 0.97 |
| fbmy5635_rel_202210112144.cy10a5_bee | 0.95 | 1.00 | 0.96 | 0.99 | 0.99 | 1.00 |
| fbmy5635_rel_202302162102.cy10a5_bee | 0.95 | 0.99 | 0.96 | 0.95 | 0.95 | 0.96 |
| fbmy5635_rel_202304122154.cy10a5_bee | 0.95 | 1.00 | 0.96 | 0.96 | 0.94 | 0.97 |
| fbmy5635_rel_202305292102.cy10a5_bee | 0.94 | 1.00 | 0.95 | 0.97 | 0.98 | 0.97 |
| fbmy5635_rel_20230529_832.cy10a5_bee | 0.94 | 1.00 | 0.94 | 0.95 | 0.93 | 0.95 |
| fbmy5635_rel_20230529_843.cy10a5_bee | 0.94 | 0.99 | 0.97 | 0.93 | 0.94 | 0.94 |
| fbmy5635_rel_20230529_850.cy10a5_bee | 0.94 | 1.00 | 0.97 | 0.96 | 0.95 | 0.96 |
This lists the average rate of inserts/s for the tests that do inserts concurrent with queries. For such tests the query rate is listed in the table above. The read+write tests are setup so that the insert rate should match the target rate every second. Cells that are not at least 95% of the target have a red background to indicate a failure to satisfy the target.
| dbms | q100.1 | q500.1 | q1000.1 |
|---|---|---|---|
| fbmy5635_rel_202104072149.cy10a5_bee | 100 | 499 | 999 |
| fbmy5635_rel_202203072101.cy10a5_bee | 100 | 499 | 998 |
| fbmy5635_rel_202205192101.cy10a5_bee | 100 | 499 | 999 |
| fbmy5635_rel_202208092101.cy10a5_bee | 100 | 499 | 999 |
| fbmy5635_rel_202210112144.cy10a5_bee | 100 | 499 | 998 |
| fbmy5635_rel_202302162102.cy10a5_bee | 100 | 499 | 998 |
| fbmy5635_rel_202304122154.cy10a5_bee | 100 | 499 | 999 |
| fbmy5635_rel_202305292102.cy10a5_bee | 100 | 499 | 998 |
| fbmy5635_rel_20230529_832.cy10a5_bee | 100 | 499 | 998 |
| fbmy5635_rel_20230529_843.cy10a5_bee | 100 | 499 | 998 |
| fbmy5635_rel_20230529_850.cy10a5_bee | 100 | 499 | 999 |
| target | 100 | 500 | 1000 |
l.i0
l.i0: load without secondary indexes. Graphs for performance per 1-second interval are here.
Average throughput:
Insert response time histogram: each cell has the percentage of responses that take <= the time in the header and max is the max response time in seconds. For the max column values in the top 25% of the range have a red background and in the bottom 25% of the range have a green background. The red background is not used when the min value is within 80% of the max value.
| dbms | 256us | 1ms | 4ms | 16ms | 64ms | 256ms | 1s | 4s | 16s | gt | max |
|---|---|---|---|---|---|---|---|---|---|---|---|
| fbmy5635_rel_202104072149.cy10a5_bee | nonzero | 99.873 | 0.123 | 0.002 | 0.002 | 0.123 | |||||
| fbmy5635_rel_202203072101.cy10a5_bee | 99.871 | 0.125 | 0.003 | 0.001 | 0.118 | ||||||
| fbmy5635_rel_202205192101.cy10a5_bee | 99.867 | 0.129 | 0.003 | 0.001 | 0.098 | ||||||
| fbmy5635_rel_202208092101.cy10a5_bee | 99.867 | 0.129 | 0.002 | 0.002 | 0.133 | ||||||
| fbmy5635_rel_202210112144.cy10a5_bee | 99.867 | 0.129 | 0.002 | 0.002 | 0.099 | ||||||
| fbmy5635_rel_202302162102.cy10a5_bee | 99.867 | 0.129 | 0.003 | 0.001 | 0.115 | ||||||
| fbmy5635_rel_202304122154.cy10a5_bee | 99.868 | 0.128 | 0.003 | 0.001 | 0.091 | ||||||
| fbmy5635_rel_202305292102.cy10a5_bee | 99.865 | 0.131 | 0.003 | 0.001 | 0.089 | ||||||
| fbmy5635_rel_20230529_832.cy10a5_bee | 99.866 | 0.130 | 0.003 | 0.001 | 0.091 | ||||||
| fbmy5635_rel_20230529_843.cy10a5_bee | 99.866 | 0.130 | 0.003 | 0.001 | 0.120 | ||||||
| fbmy5635_rel_20230529_850.cy10a5_bee | 99.865 | 0.130 | 0.003 | 0.001 | 0.097 |
Performance metrics for the DBMS listed above. Some are normalized by throughput, others are not. Legend for results is here.
ips	qps	rps	rmbps	wps	wmbps	rpq	rkbpq	wpi	wkbpi	csps	cpups	cspq	cpupq	dbgb1	dbgb2	rss	maxop	p50	p99	tag
81086	0	0	0.0	43.8	14.6	0.000	0.000	0.001	0.184	8054	23.3	0.099	23	25.1	26.7	1.6	0.123	81406	73348	800m.fbmy5635_rel_202104072149.cy10a5_bee
79499	0	0	0.0	43.1	14.3	0.000	0.000	0.001	0.184	7888	23.0	0.099	23	25.1	25.7	1.5	0.118	79753	72717	800m.fbmy5635_rel_202203072101.cy10a5_bee
76716	0	0	0.0	41.4	13.8	0.000	0.000	0.001	0.184	7610	21.9	0.099	23	25.1	25.7	1.5	0.098	76912	70819	800m.fbmy5635_rel_202205192101.cy10a5_bee
77250	0	0	0.0	43.7	13.9	0.000	0.000	0.001	0.184	7685	22.4	0.099	23	25.1	25.7	1.5	0.133	77512	70722	800m.fbmy5635_rel_202208092101.cy10a5_bee
76967	0	0	0.0	43.5	13.8	0.000	0.000	0.001	0.184	7650	22.0	0.099	23	25.1	25.7	1.5	0.099	77212	70322	800m.fbmy5635_rel_202210112144.cy10a5_bee
76908	0	0	0.0	41.7	13.8	0.000	0.000	0.001	0.184	7624	22.3	0.099	23	25.1	25.7	1.5	0.115	77112	70921	800m.fbmy5635_rel_202302162102.cy10a5_bee
77265	0	0	0.0	42.0	13.9	0.000	0.000	0.001	0.184	7665	22.3	0.099	23	25.1	25.7	1.5	0.091	77512	71312	800m.fbmy5635_rel_202304122154.cy10a5_bee
75944	0	0	0.0	41.2	13.7	0.000	0.000	0.001	0.184	7546	21.3	0.099	22	25.1	25.7	1.5	0.089	76110	69922	800m.fbmy5635_rel_202305292102.cy10a5_bee
76307	0	0	0.0	41.5	13.7	0.000	0.000	0.001	0.184	7571	21.6	0.099	23	25.1	25.7	1.5	0.091	76511	70320	800m.fbmy5635_rel_20230529_832.cy10a5_bee
76621	0	0	0.0	41.5	13.8	0.000	0.000	0.001	0.184	7610	22.1	0.099	23	25.1	25.7	1.5	0.120	76812	70520	800m.fbmy5635_rel_20230529_843.cy10a5_bee
76067	0	0	0.0	41.3	13.7	0.000	0.000	0.001	0.184	7553	21.7	0.099	23	25.1	25.7	1.5	0.097	76212	69953	800m.fbmy5635_rel_20230529_850.cy10a5_bee
l.x
l.x: create secondary indexes.
Average throughput:
Performance metrics for the DBMS listed above. Some are normalized by throughput, others are not. Legend for results is here.
ips	qps	rps	rmbps	wps	wmbps	rpq	rkbpq	wpi	wkbpi	csps	cpups	cspq	cpupq	dbgb1	dbgb2	rss	maxop	p50	p99	tag
76019	0	102	15.9	31.1	11.1	0.001	0.214	0.000	0.149	297	11.7	0.004	12	51.0	52.6	8.8	0.007	NA	NA	800m.fbmy5635_rel_202104072149.cy10a5_bee
76026	0	101	15.9	31.4	11.1	0.001	0.214	0.000	0.150	296	11.7	0.004	12	51.1	51.7	8.8	0.008	NA	NA	800m.fbmy5635_rel_202203072101.cy10a5_bee
75481	0	100	15.8	30.3	11.0	0.001	0.214	0.000	0.150	295	11.7	0.004	12	51.0	51.7	8.8	0.006	NA	NA	800m.fbmy5635_rel_202205192101.cy10a5_bee
75212	0	100	15.7	32.5	11.0	0.001	0.214	0.000	0.150	339	11.7	0.005	12	51.1	51.7	8.8	0.008	NA	NA	800m.fbmy5635_rel_202208092101.cy10a5_bee
75753	0	101	15.8	33.6	11.1	0.001	0.214	0.000	0.150	345	11.7	0.005	12	51.0	51.7	8.8	0.007	NA	NA	800m.fbmy5635_rel_202210112144.cy10a5_bee
75417	0	100	15.8	31.4	11.0	0.001	0.214	0.000	0.150	290	11.7	0.004	12	51.0	51.7	8.8	0.007	NA	NA	800m.fbmy5635_rel_202302162102.cy10a5_bee
75738	0	101	15.8	30.0	11.1	0.001	0.214	0.000	0.149	305	11.7	0.004	12	51.0	51.7	8.8	0.008	NA	NA	800m.fbmy5635_rel_202304122154.cy10a5_bee
75860	0	101	15.9	30.1	11.1	0.001	0.214	0.000	0.149	298	11.7	0.004	12	51.0	51.7	8.8	0.009	NA	NA	800m.fbmy5635_rel_202305292102.cy10a5_bee
76004	0	101	15.9	31.0	11.1	0.001	0.214	0.000	0.150	293	11.7	0.004	12	51.0	51.7	8.8	0.007	NA	NA	800m.fbmy5635_rel_20230529_832.cy10a5_bee
75467	0	100	15.8	30.1	11.0	0.001	0.214	0.000	0.150	299	11.7	0.004	12	51.0	51.7	8.8	0.010	NA	NA	800m.fbmy5635_rel_20230529_843.cy10a5_bee
76004	0	101	15.9	30.2	11.1	0.001	0.214	0.000	0.150	298	11.7	0.004	12	51.0	51.7	8.8	0.006	NA	NA	800m.fbmy5635_rel_20230529_850.cy10a5_bee
l.i1
l.i1: continue load after secondary indexes created. Graphs for performance per 1-second interval are here.
Average throughput:
Insert response time histogram: each cell has the percentage of responses that take <= the time in the header and max is the max response time in seconds. For the max column values in the top 25% of the range have a red background and in the bottom 25% of the range have a green background. The red background is not used when the min value is within 80% of the max value.
| dbms | 256us | 1ms | 4ms | 16ms | 64ms | 256ms | 1s | 4s | 16s | gt | max |
|---|---|---|---|---|---|---|---|---|---|---|---|
| fbmy5635_rel_202104072149.cy10a5_bee | 99.771 | 0.222 | 0.006 | 0.002 | 0.099 | ||||||
| fbmy5635_rel_202203072101.cy10a5_bee | 99.778 | 0.215 | 0.005 | 0.002 | 0.108 | ||||||
| fbmy5635_rel_202205192101.cy10a5_bee | 99.766 | 0.226 | 0.006 | 0.002 | 0.125 | ||||||
| fbmy5635_rel_202208092101.cy10a5_bee | 99.769 | 0.225 | 0.003 | 0.003 | 0.154 | ||||||
| fbmy5635_rel_202210112144.cy10a5_bee | 99.770 | 0.222 | 0.004 | 0.003 | 0.134 | ||||||
| fbmy5635_rel_202302162102.cy10a5_bee | 99.784 | 0.210 | 0.005 | 0.001 | 0.113 | ||||||
| fbmy5635_rel_202304122154.cy10a5_bee | 99.771 | 0.223 | 0.005 | 0.002 | 0.141 | ||||||
| fbmy5635_rel_202305292102.cy10a5_bee | 99.779 | 0.215 | 0.005 | 0.002 | 0.102 | ||||||
| fbmy5635_rel_20230529_832.cy10a5_bee | 99.777 | 0.217 | 0.004 | 0.002 | 0.131 | ||||||
| fbmy5635_rel_20230529_843.cy10a5_bee | 99.764 | 0.229 | 0.005 | 0.002 | 0.118 | ||||||
| fbmy5635_rel_20230529_850.cy10a5_bee | 99.777 | 0.217 | 0.005 | 0.002 | 0.114 |
Delete response time histogram: each cell has the percentage of responses that take <= the time in the header and max is the max response time in seconds. For the max column values in the top 25% of the range have a red background and in the bottom 25% of the range have a green background. The red background is not used when the min value is within 80% of the max value.
| dbms | 256us | 1ms | 4ms | 16ms | 64ms | 256ms | 1s | 4s | 16s | gt | max |
|---|---|---|---|---|---|---|---|---|---|---|---|
| fbmy5635_rel_202104072149.cy10a5_bee | 99.708 | 0.279 | 0.012 | 0.002 | 0.100 | ||||||
| fbmy5635_rel_202203072101.cy10a5_bee | 99.686 | 0.301 | 0.011 | 0.002 | 0.108 | ||||||
| fbmy5635_rel_202205192101.cy10a5_bee | 99.688 | 0.298 | 0.012 | 0.002 | 0.125 | ||||||
| fbmy5635_rel_202208092101.cy10a5_bee | 99.700 | 0.288 | 0.009 | 0.003 | 0.153 | ||||||
| fbmy5635_rel_202210112144.cy10a5_bee | 99.693 | 0.294 | 0.010 | 0.003 | 0.134 | ||||||
| fbmy5635_rel_202302162102.cy10a5_bee | 99.712 | 0.278 | 0.008 | 0.002 | 0.113 | ||||||
| fbmy5635_rel_202304122154.cy10a5_bee | 99.721 | 0.269 | 0.009 | 0.002 | 0.140 | ||||||
| fbmy5635_rel_202305292102.cy10a5_bee | 99.712 | 0.278 | 0.008 | 0.002 | 0.102 | ||||||
| fbmy5635_rel_20230529_832.cy10a5_bee | 99.707 | 0.283 | 0.008 | 0.002 | 0.130 | ||||||
| fbmy5635_rel_20230529_843.cy10a5_bee | 99.703 | 0.287 | 0.009 | 0.002 | 0.118 | ||||||
| fbmy5635_rel_20230529_850.cy10a5_bee | 99.707 | 0.282 | 0.009 | 0.001 | 0.114 |
Performance metrics for the DBMS listed above. Some are normalized by throughput, others are not. Legend for results is here.
ips	qps	rps	rmbps	wps	wmbps	rpq	rkbpq	wpi	wkbpi	csps	cpups	cspq	cpupq	dbgb1	dbgb2	rss	maxop	p50	p99	tag
26745	0	418	31.1	201.0	75.2	0.016	1.189	0.008	2.877	11820	55.4	0.442	166	58.6	59.9	8.6	0.099	26770	23473	800m.fbmy5635_rel_202104072149.cy10a5_bee
26233	0	431	33.3	200.4	76.1	0.016	1.298	0.008	2.972	11591	55.8	0.442	170	58.0	58.0	8.6	0.108	26220	23023	800m.fbmy5635_rel_202203072101.cy10a5_bee
25753	0	416	31.8	195.1	73.8	0.016	1.264	0.008	2.934	11447	55.2	0.445	171	57.7	57.7	8.6	0.125	25771	22475	800m.fbmy5635_rel_202205192101.cy10a5_bee
25840	0	412	31.3	197.8	74.1	0.016	1.239	0.008	2.936	11485	55.1	0.444	171	57.8	57.9	8.6	0.154	25870	22575	800m.fbmy5635_rel_202208092101.cy10a5_bee
25773	0	435	34.0	199.8	74.8	0.017	1.352	0.008	2.974	11472	55.5	0.445	172	57.7	57.7	8.7	0.134	25821	22525	800m.fbmy5635_rel_202210112144.cy10a5_bee
25588	0	368	25.8	161.4	61.0	0.014	1.031	0.006	2.440	11450	52.8	0.447	165	57.7	57.7	8.6	0.113	25671	22025	800m.fbmy5635_rel_202302162102.cy10a5_bee
25562	0	374	26.5	161.0	60.6	0.015	1.060	0.006	2.428	11421	52.6	0.447	165	57.8	57.8	8.6	0.141	25570	21926	800m.fbmy5635_rel_202304122154.cy10a5_bee
25381	0	378	27.0	159.9	60.3	0.015	1.091	0.006	2.434	11340	52.9	0.447	167	57.1	57.1	8.6	0.102	25422	21676	800m.fbmy5635_rel_202305292102.cy10a5_bee
25107	0	362	25.3	160.0	59.9	0.014	1.030	0.006	2.442	11104	53.5	0.442	170	58.3	58.3	8.6	0.131	25072	21526	800m.fbmy5635_rel_20230529_832.cy10a5_bee
25813	0	338	22.0	173.8	64.8	0.013	0.872	0.007	2.572	11413	57.1	0.442	177	58.6	58.6	8.6	0.118	25772	22523	800m.fbmy5635_rel_20230529_843.cy10a5_bee
26076	0	3381	21.5	174.7	65.1	0.130	0.845	0.007	2.558	17359	55.4	0.666	170	57.8	59.8	8.6	0.114	26070	22525	800m.fbmy5635_rel_20230529_850.cy10a5_bee
q100.1
q100.1: range queries with 100 insert/s per client. Graphs for performance per 1-second interval are here.
Average throughput:
Query response time histogram: each cell has the percentage of responses that take <= the time in the header and max is the max response time in seconds. For max values in the top 25% of the range have a red background and in the bottom 25% of the range have a green background. The red background is not used when the min value is within 80% of the max value.
| dbms | 256us | 1ms | 4ms | 16ms | 64ms | 256ms | 1s | 4s | 16s | gt | max |
|---|---|---|---|---|---|---|---|---|---|---|---|
| fbmy5635_rel_202104072149.cy10a5_bee | 3.071 | 94.805 | 2.118 | 0.006 | 0.001 | nonzero | 0.080 | ||||
| fbmy5635_rel_202203072101.cy10a5_bee | 2.015 | 95.274 | 2.700 | 0.010 | nonzero | 0.048 | |||||
| fbmy5635_rel_202205192101.cy10a5_bee | 2.634 | 95.476 | 1.871 | 0.018 | nonzero | 0.059 | |||||
| fbmy5635_rel_202208092101.cy10a5_bee | 1.509 | 95.499 | 2.977 | 0.015 | nonzero | 0.050 | |||||
| fbmy5635_rel_202210112144.cy10a5_bee | 2.159 | 95.306 | 2.522 | 0.012 | nonzero | 0.058 | |||||
| fbmy5635_rel_202302162102.cy10a5_bee | 2.193 | 91.186 | 6.608 | 0.013 | nonzero | 0.039 | |||||
| fbmy5635_rel_202304122154.cy10a5_bee | 2.054 | 92.119 | 5.817 | 0.009 | 0.001 | 0.048 | |||||
| fbmy5635_rel_202305292102.cy10a5_bee | 1.896 | 92.465 | 5.632 | 0.007 | nonzero | 0.038 | |||||
| fbmy5635_rel_20230529_832.cy10a5_bee | 2.241 | 91.527 | 6.219 | 0.013 | 0.001 | 0.056 | |||||
| fbmy5635_rel_20230529_843.cy10a5_bee | 1.670 | 90.794 | 7.525 | 0.010 | nonzero | 0.048 | |||||
| fbmy5635_rel_20230529_850.cy10a5_bee | 2.845 | 91.151 | 5.994 | 0.010 | nonzero | 0.062 |
Insert response time histogram: each cell has the percentage of responses that take <= the time in the header and max is the max response time in seconds. For max values in the top 25% of the range have a red background and in the bottom 25% of the range have a green background. The red background is not used when the min value is within 80% of the max value.
| dbms | 256us | 1ms | 4ms | 16ms | 64ms | 256ms | 1s | 4s | 16s | gt | max |
|---|---|---|---|---|---|---|---|---|---|---|---|
| fbmy5635_rel_202104072149.cy10a5_bee | 99.389 | 0.611 | 0.011 | ||||||||
| fbmy5635_rel_202203072101.cy10a5_bee | 99.264 | 0.736 | 0.015 | ||||||||
| fbmy5635_rel_202205192101.cy10a5_bee | 99.417 | 0.569 | 0.014 | 0.019 | |||||||
| fbmy5635_rel_202208092101.cy10a5_bee | 99.208 | 0.778 | 0.014 | 0.017 | |||||||
| fbmy5635_rel_202210112144.cy10a5_bee | 99.333 | 0.667 | 0.015 | ||||||||
| fbmy5635_rel_202302162102.cy10a5_bee | 99.264 | 0.722 | 0.014 | 0.016 | |||||||
| fbmy5635_rel_202304122154.cy10a5_bee | 99.444 | 0.556 | 0.011 | ||||||||
| fbmy5635_rel_202305292102.cy10a5_bee | 99.306 | 0.694 | 0.016 | ||||||||
| fbmy5635_rel_20230529_832.cy10a5_bee | 99.347 | 0.653 | 0.015 | ||||||||
| fbmy5635_rel_20230529_843.cy10a5_bee | 99.319 | 0.667 | 0.014 | 0.025 | |||||||
| fbmy5635_rel_20230529_850.cy10a5_bee | 99.403 | 0.597 | 0.014 |
Delete response time histogram: each cell has the percentage of responses that take <= the time in the header and max is the max response time in seconds. For max values in the top 25% of the range have a red background and in the bottom 25% of the range have a green background. The red background is not used when the min value is within 80% of the max value.
| dbms | 256us | 1ms | 4ms | 16ms | 64ms | 256ms | 1s | 4s | 16s | gt | max |
|---|---|---|---|---|---|---|---|---|---|---|---|
| fbmy5635_rel_202104072149.cy10a5_bee | 96.486 | 3.514 | 0.013 | ||||||||
| fbmy5635_rel_202203072101.cy10a5_bee | 90.014 | 9.819 | 0.167 | 0.022 | |||||||
| fbmy5635_rel_202205192101.cy10a5_bee | 86.361 | 13.403 | 0.236 | 0.022 | |||||||
| fbmy5635_rel_202208092101.cy10a5_bee | 83.125 | 16.694 | 0.181 | 0.023 | |||||||
| fbmy5635_rel_202210112144.cy10a5_bee | 88.917 | 10.875 | 0.208 | 0.023 | |||||||
| fbmy5635_rel_202302162102.cy10a5_bee | 85.889 | 13.875 | 0.236 | 0.023 | |||||||
| fbmy5635_rel_202304122154.cy10a5_bee | 89.319 | 10.583 | 0.097 | 0.018 | |||||||
| fbmy5635_rel_202305292102.cy10a5_bee | 94.139 | 5.778 | 0.083 | 0.050 | |||||||
| fbmy5635_rel_20230529_832.cy10a5_bee | 85.208 | 14.583 | 0.208 | 0.023 | |||||||
| fbmy5635_rel_20230529_843.cy10a5_bee | 86.625 | 13.264 | 0.111 | 0.017 | |||||||
| fbmy5635_rel_20230529_850.cy10a5_bee | 89.431 | 10.444 | 0.125 | 0.025 |
Performance metrics for the DBMS listed above. Some are normalized by throughput, others are not. Legend for results is here.
ips	qps	rps	rmbps	wps	wmbps	rpq	rkbpq	wpi	wkbpi	csps	cpups	cspq	cpupq	dbgb1	dbgb2	rss	maxop	p50	p99	tag
100	2028	388	5.9	9.3	2.2	0.191	2.954	0.093	22.880	8419	13.4	4.151	529	55.7	57.0	9.7	0.080	2029	1295	800m.fbmy5635_rel_202104072149.cy10a5_bee
100	1979	292	5.3	9.4	2.3	0.148	2.720	0.094	23.952	8167	13.5	4.128	546	55.6	55.7	9.9	0.048	1982	1310	800m.fbmy5635_rel_202203072101.cy10a5_bee
100	2038	282	5.0	9.8	2.4	0.138	2.493	0.098	24.887	8428	13.6	4.136	534	55.7	55.8	9.9	0.059	2045	1263	800m.fbmy5635_rel_202205192101.cy10a5_bee
100	1949	271	4.9	11.7	2.3	0.139	2.594	0.117	23.679	8065	13.5	4.137	554	55.7	55.8	10.0	0.050	1933	1310	800m.fbmy5635_rel_202208092101.cy10a5_bee
100	2002	294	5.3	12.1	2.6	0.147	2.707	0.121	26.202	8287	13.5	4.140	540	55.5	55.6	9.9	0.058	1982	1310	800m.fbmy5635_rel_202210112144.cy10a5_bee
100	1930	274	4.2	8.5	2.0	0.142	2.216	0.086	20.303	8001	13.2	4.145	547	55.7	55.8	9.9	0.039	1902	1215	800m.fbmy5635_rel_202302162102.cy10a5_bee
100	1956	273	4.2	8.9	2.1	0.140	2.212	0.089	21.241	8094	13.2	4.138	540	55.7	55.8	9.7	0.048	1949	1279	800m.fbmy5635_rel_202304122154.cy10a5_bee
100	1972	266	4.2	8.2	1.9	0.135	2.171	0.083	19.342	8273	13.4	4.195	544	55.7	55.8	9.8	0.038	1950	1263	800m.fbmy5635_rel_202305292102.cy10a5_bee
100	1926	301	4.7	9.0	2.1	0.156	2.486	0.090	22.045	8011	13.4	4.159	557	55.7	55.7	9.7	0.056	1902	1247	800m.fbmy5635_rel_20230529_832.cy10a5_bee
100	1888	284	4.4	7.9	1.7	0.151	2.402	0.079	17.759	7843	13.3	4.155	564	55.8	55.9	9.6	0.048	1869	1215	800m.fbmy5635_rel_20230529_843.cy10a5_bee
100	1944	632	5.4	9.6	2.3	0.325	2.861	0.096	23.900	8620	13.6	4.435	560	55.7	55.8	9.6	0.062	1967	1263	800m.fbmy5635_rel_20230529_850.cy10a5_bee
q500.1
q500.1: range queries with 500 insert/s per client. Graphs for performance per 1-second interval are here.
Average throughput:
Query response time histogram: each cell has the percentage of responses that take <= the time in the header and max is the max response time in seconds. For max values in the top 25% of the range have a red background and in the bottom 25% of the range have a green background. The red background is not used when the min value is within 80% of the max value.
| dbms | 256us | 1ms | 4ms | 16ms | 64ms | 256ms | 1s | 4s | 16s | gt | max |
|---|---|---|---|---|---|---|---|---|---|---|---|
| fbmy5635_rel_202104072149.cy10a5_bee | 1.430 | 97.168 | 1.398 | 0.005 | nonzero | 0.044 | |||||
| fbmy5635_rel_202203072101.cy10a5_bee | 0.916 | 96.677 | 2.399 | 0.008 | nonzero | 0.032 | |||||
| fbmy5635_rel_202205192101.cy10a5_bee | 0.842 | 97.609 | 1.533 | 0.016 | nonzero | 0.033 | |||||
| fbmy5635_rel_202208092101.cy10a5_bee | 0.916 | 96.336 | 2.739 | 0.009 | nonzero | 0.032 | |||||
| fbmy5635_rel_202210112144.cy10a5_bee | 1.091 | 97.014 | 1.880 | 0.015 | 0.010 | ||||||
| fbmy5635_rel_202302162102.cy10a5_bee | 1.003 | 92.932 | 6.041 | 0.024 | 0.016 | ||||||
| fbmy5635_rel_202304122154.cy10a5_bee | 0.766 | 92.544 | 6.666 | 0.024 | nonzero | 0.042 | |||||
| fbmy5635_rel_202305292102.cy10a5_bee | 1.332 | 93.427 | 5.234 | 0.007 | nonzero | 0.035 | |||||
| fbmy5635_rel_20230529_832.cy10a5_bee | 0.967 | 92.169 | 6.843 | 0.022 | nonzero | 0.020 | |||||
| fbmy5635_rel_20230529_843.cy10a5_bee | 1.593 | 91.487 | 6.912 | 0.009 | nonzero | 0.046 | |||||
| fbmy5635_rel_20230529_850.cy10a5_bee | 1.591 | 91.293 | 7.112 | 0.004 | nonzero | 0.039 |
Insert response time histogram: each cell has the percentage of responses that take <= the time in the header and max is the max response time in seconds. For max values in the top 25% of the range have a red background and in the bottom 25% of the range have a green background. The red background is not used when the min value is within 80% of the max value.
| dbms | 256us | 1ms | 4ms | 16ms | 64ms | 256ms | 1s | 4s | 16s | gt | max |
|---|---|---|---|---|---|---|---|---|---|---|---|
| fbmy5635_rel_202104072149.cy10a5_bee | 99.625 | 0.375 | 0.014 | ||||||||
| fbmy5635_rel_202203072101.cy10a5_bee | 99.639 | 0.358 | 0.003 | 0.047 | |||||||
| fbmy5635_rel_202205192101.cy10a5_bee | 99.631 | 0.367 | 0.003 | 0.046 | |||||||
| fbmy5635_rel_202208092101.cy10a5_bee | 99.675 | 0.319 | 0.006 | 0.053 | |||||||
| fbmy5635_rel_202210112144.cy10a5_bee | 99.647 | 0.350 | 0.003 | 0.029 | |||||||
| fbmy5635_rel_202302162102.cy10a5_bee | 99.639 | 0.358 | 0.003 | 0.046 | |||||||
| fbmy5635_rel_202304122154.cy10a5_bee | 99.678 | 0.319 | 0.003 | 0.040 | |||||||
| fbmy5635_rel_202305292102.cy10a5_bee | 99.736 | 0.261 | 0.003 | 0.046 | |||||||
| fbmy5635_rel_20230529_832.cy10a5_bee | 99.686 | 0.311 | 0.003 | 0.040 | |||||||
| fbmy5635_rel_20230529_843.cy10a5_bee | 99.686 | 0.311 | 0.003 | 0.048 | |||||||
| fbmy5635_rel_20230529_850.cy10a5_bee | 99.675 | 0.322 | 0.003 | 0.044 |
Delete response time histogram: each cell has the percentage of responses that take <= the time in the header and max is the max response time in seconds. For max values in the top 25% of the range have a red background and in the bottom 25% of the range have a green background. The red background is not used when the min value is within 80% of the max value.
| dbms | 256us | 1ms | 4ms | 16ms | 64ms | 256ms | 1s | 4s | 16s | gt | max |
|---|---|---|---|---|---|---|---|---|---|---|---|
| fbmy5635_rel_202104072149.cy10a5_bee | 98.606 | 1.372 | 0.022 | 0.052 | |||||||
| fbmy5635_rel_202203072101.cy10a5_bee | 98.364 | 1.578 | 0.058 | 0.046 | |||||||
| fbmy5635_rel_202205192101.cy10a5_bee | 96.547 | 3.417 | 0.036 | 0.047 | |||||||
| fbmy5635_rel_202208092101.cy10a5_bee | 98.525 | 1.458 | 0.017 | 0.054 | |||||||
| fbmy5635_rel_202210112144.cy10a5_bee | 96.667 | 3.303 | 0.028 | 0.003 | 0.065 | ||||||
| fbmy5635_rel_202302162102.cy10a5_bee | 95.783 | 4.153 | 0.064 | 0.046 | |||||||
| fbmy5635_rel_202304122154.cy10a5_bee | 96.983 | 3.000 | 0.017 | 0.039 | |||||||
| fbmy5635_rel_202305292102.cy10a5_bee | 98.525 | 1.469 | 0.006 | 0.047 | |||||||
| fbmy5635_rel_20230529_832.cy10a5_bee | 95.531 | 4.439 | 0.031 | 0.041 | |||||||
| fbmy5635_rel_20230529_843.cy10a5_bee | 97.875 | 2.108 | 0.017 | 0.047 | |||||||
| fbmy5635_rel_20230529_850.cy10a5_bee | 98.958 | 1.014 | 0.028 | 0.043 |
Performance metrics for the DBMS listed above. Some are normalized by throughput, others are not. Legend for results is here.
ips	qps	rps	rmbps	wps	wmbps	rpq	rkbpq	wpi	wkbpi	csps	cpups	cspq	cpupq	dbgb1	dbgb2	rss	maxop	p50	p99	tag
499	2048	118	1.9	8.1	1.8	0.057	0.969	0.016	3.766	8130	13.3	3.970	520	55.7	57.4	9.2	0.044	2014	1838	800m.fbmy5635_rel_202104072149.cy10a5_bee
499	2001	59	1.5	7.7	1.7	0.029	0.748	0.016	3.583	7944	13.4	3.971	536	55.6	56.1	9.4	0.032	1981	1822	800m.fbmy5635_rel_202203072101.cy10a5_bee
499	2019	42	1.1	7.7	1.7	0.021	0.576	0.015	3.578	8010	13.4	3.968	531	55.7	56.1	9.1	0.033	1998	1822	800m.fbmy5635_rel_202205192101.cy10a5_bee
499	1984	57	1.4	10.0	1.8	0.029	0.709	0.020	3.697	7904	13.4	3.983	540	55.7	56.1	9.2	0.032	1950	1790	800m.fbmy5635_rel_202208092101.cy10a5_bee
499	2024	56	1.5	9.1	1.5	0.028	0.764	0.018	3.086	8082	13.3	3.993	526	55.7	56.2	9.3	0.010	1998	1822	800m.fbmy5635_rel_202210112144.cy10a5_bee
499	1940	29	0.7	6.4	1.3	0.015	0.351	0.013	2.586	7700	13.2	3.969	544	55.8	56.3	9.0	0.016	1902	1742	800m.fbmy5635_rel_202302162102.cy10a5_bee
499	1922	32	0.7	7.0	1.5	0.016	0.349	0.014	3.058	7651	13.3	3.981	554	55.7	56.2	9.3	0.042	1886	1742	800m.fbmy5635_rel_202304122154.cy10a5_bee
499	1997	63	1.4	6.8	1.4	0.032	0.705	0.014	2.869	7971	13.6	3.991	545	55.7	56.2	9.4	0.035	1950	1774	800m.fbmy5635_rel_202305292102.cy10a5_bee
499	1914	29	0.5	5.9	1.1	0.015	0.271	0.012	2.309	7605	13.2	3.973	552	55.8	56.3	9.4	0.020	1870	1726	800m.fbmy5635_rel_20230529_832.cy10a5_bee
499	1933	62	1.5	7.3	1.6	0.032	0.782	0.015	3.224	7689	13.6	3.977	563	55.8	56.2	8.8	0.046	1918	1694	800m.fbmy5635_rel_20230529_843.cy10a5_bee
499	1940	150	1.5	6.5	1.3	0.077	0.817	0.013	2.630	8061	14.1	4.155	581	55.7	56.2	9.1	0.039	1901	1726	800m.fbmy5635_rel_20230529_850.cy10a5_bee
q1000.1
q1000.1: range queries with 1000 insert/s per client. Graphs for performance per 1-second interval are here.
Average throughput:
Query response time histogram: each cell has the percentage of responses that take <= the time in the header and max is the max response time in seconds. For max values in the top 25% of the range have a red background and in the bottom 25% of the range have a green background. The red background is not used when the min value is within 80% of the max value.
| dbms | 256us | 1ms | 4ms | 16ms | 64ms | 256ms | 1s | 4s | 16s | gt | max |
|---|---|---|---|---|---|---|---|---|---|---|---|
| fbmy5635_rel_202104072149.cy10a5_bee | 1.523 | 96.579 | 1.897 | 0.001 | nonzero | 0.044 | |||||
| fbmy5635_rel_202203072101.cy10a5_bee | 1.445 | 96.046 | 2.506 | 0.003 | nonzero | 0.045 | |||||
| fbmy5635_rel_202205192101.cy10a5_bee | 0.955 | 97.117 | 1.918 | 0.011 | nonzero | 0.039 | |||||
| fbmy5635_rel_202208092101.cy10a5_bee | 0.873 | 95.965 | 3.152 | 0.010 | nonzero | 0.048 | |||||
| fbmy5635_rel_202210112144.cy10a5_bee | 1.246 | 96.514 | 2.235 | 0.005 | nonzero | 0.054 | |||||
| fbmy5635_rel_202302162102.cy10a5_bee | 0.834 | 94.197 | 4.954 | 0.015 | nonzero | 0.043 | |||||
| fbmy5635_rel_202304122154.cy10a5_bee | 0.939 | 94.161 | 4.890 | 0.011 | nonzero | 0.032 | |||||
| fbmy5635_rel_202305292102.cy10a5_bee | 0.903 | 94.528 | 4.545 | 0.023 | nonzero | 0.047 | |||||
| fbmy5635_rel_20230529_832.cy10a5_bee | 1.075 | 93.433 | 5.480 | 0.012 | nonzero | 0.042 | |||||
| fbmy5635_rel_20230529_843.cy10a5_bee | 1.154 | 92.039 | 6.798 | 0.009 | nonzero | 0.042 | |||||
| fbmy5635_rel_20230529_850.cy10a5_bee | 1.291 | 92.329 | 6.372 | 0.008 | nonzero | 0.031 |
Insert response time histogram: each cell has the percentage of responses that take <= the time in the header and max is the max response time in seconds. For max values in the top 25% of the range have a red background and in the bottom 25% of the range have a green background. The red background is not used when the min value is within 80% of the max value.
| dbms | 256us | 1ms | 4ms | 16ms | 64ms | 256ms | 1s | 4s | 16s | gt | max |
|---|---|---|---|---|---|---|---|---|---|---|---|
| fbmy5635_rel_202104072149.cy10a5_bee | 99.721 | 0.276 | 0.003 | 0.059 | |||||||
| fbmy5635_rel_202203072101.cy10a5_bee | 99.711 | 0.286 | 0.003 | 0.048 | |||||||
| fbmy5635_rel_202205192101.cy10a5_bee | 99.683 | 0.314 | 0.003 | 0.059 | |||||||
| fbmy5635_rel_202208092101.cy10a5_bee | 99.692 | 0.306 | 0.001 | 0.001 | 0.065 | ||||||
| fbmy5635_rel_202210112144.cy10a5_bee | 99.679 | 0.318 | 0.003 | 0.053 | |||||||
| fbmy5635_rel_202302162102.cy10a5_bee | 99.678 | 0.317 | 0.006 | 0.062 | |||||||
| fbmy5635_rel_202304122154.cy10a5_bee | 99.700 | 0.294 | 0.006 | 0.047 | |||||||
| fbmy5635_rel_202305292102.cy10a5_bee | 99.797 | 0.200 | 0.003 | 0.049 | |||||||
| fbmy5635_rel_20230529_832.cy10a5_bee | 99.728 | 0.271 | 0.001 | 0.055 | |||||||
| fbmy5635_rel_20230529_843.cy10a5_bee | 99.675 | 0.322 | 0.003 | 0.048 | |||||||
| fbmy5635_rel_20230529_850.cy10a5_bee | 99.718 | 0.278 | 0.004 | 0.047 |
Delete response time histogram: each cell has the percentage of responses that take <= the time in the header and max is the max response time in seconds. For max values in the top 25% of the range have a red background and in the bottom 25% of the range have a green background. The red background is not used when the min value is within 80% of the max value.
| dbms | 256us | 1ms | 4ms | 16ms | 64ms | 256ms | 1s | 4s | 16s | gt | max |
|---|---|---|---|---|---|---|---|---|---|---|---|
| fbmy5635_rel_202104072149.cy10a5_bee | 99.661 | 0.335 | 0.004 | 0.058 | |||||||
| fbmy5635_rel_202203072101.cy10a5_bee | 99.515 | 0.479 | 0.006 | 0.053 | |||||||
| fbmy5635_rel_202205192101.cy10a5_bee | 99.332 | 0.651 | 0.017 | 0.060 | |||||||
| fbmy5635_rel_202208092101.cy10a5_bee | 99.315 | 0.674 | 0.010 | 0.001 | 0.065 | ||||||
| fbmy5635_rel_202210112144.cy10a5_bee | 99.572 | 0.424 | 0.004 | 0.052 | |||||||
| fbmy5635_rel_202302162102.cy10a5_bee | 99.257 | 0.729 | 0.014 | 0.063 | |||||||
| fbmy5635_rel_202304122154.cy10a5_bee | 99.219 | 0.768 | 0.013 | 0.047 | |||||||
| fbmy5635_rel_202305292102.cy10a5_bee | 98.794 | 1.196 | 0.010 | 0.050 | |||||||
| fbmy5635_rel_20230529_832.cy10a5_bee | 99.399 | 0.599 | 0.003 | 0.055 | |||||||
| fbmy5635_rel_20230529_843.cy10a5_bee | 99.338 | 0.657 | 0.006 | 0.048 | |||||||
| fbmy5635_rel_20230529_850.cy10a5_bee | 99.386 | 0.607 | 0.007 | 0.048 |
Performance metrics for the DBMS listed above. Some are normalized by throughput, others are not. Legend for results is here.
ips	qps	rps	rmbps	wps	wmbps	rpq	rkbpq	wpi	wkbpi	csps	cpups	cspq	cpupq	dbgb1	dbgb2	rss	maxop	p50	p99	tag
999	2044	234	4.1	12.6	3.5	0.114	2.065	0.013	3.543	8335	14.9	4.078	583	55.8	56.3	8.7	0.044	2014	1838	800m.fbmy5635_rel_202104072149.cy10a5_bee
998	2043	103	2.6	12.4	3.4	0.050	1.296	0.012	3.527	8332	14.7	4.079	576	55.6	56.9	8.8	0.045	2030	1808	800m.fbmy5635_rel_202203072101.cy10a5_bee
999	2026	74	2.0	12.8	3.6	0.037	1.003	0.013	3.698	8263	14.9	4.078	588	55.7	56.9	8.8	0.039	1998	1822	800m.fbmy5635_rel_202205192101.cy10a5_bee
999	1985	98	2.8	15.3	3.7	0.049	1.436	0.015	3.830	8122	15.0	4.091	604	56.0	57.3	8.9	0.048	1934	1774	800m.fbmy5635_rel_202208092101.cy10a5_bee
998	2051	105	2.8	16.2	4.0	0.051	1.400	0.016	4.134	8389	15.1	4.089	589	55.6	56.8	8.8	0.054	2014	1837	800m.fbmy5635_rel_202210112144.cy10a5_bee
998	1972	72	2.0	12.2	3.4	0.037	1.058	0.012	3.496	8044	14.9	4.080	605	55.7	56.9	8.8	0.043	1935	1758	800m.fbmy5635_rel_202302162102.cy10a5_bee
999	1984	63	1.7	10.4	2.8	0.032	0.854	0.010	2.820	8087	14.6	4.076	589	55.8	57.0	8.9	0.032	1934	1790	800m.fbmy5635_rel_202304122154.cy10a5_bee
998	1987	56	1.4	11.2	3.0	0.028	0.721	0.011	3.116	8095	14.7	4.074	592	55.7	56.9	8.8	0.047	1966	1774	800m.fbmy5635_rel_202305292102.cy10a5_bee
998	1951	72	1.6	11.0	3.0	0.037	0.849	0.011	3.046	7964	14.7	4.083	603	56.0	57.2	8.7	0.042	1902	1726	800m.fbmy5635_rel_20230529_832.cy10a5_bee
998	1919	87	1.9	11.1	3.0	0.045	1.027	0.011	3.050	7852	14.8	4.091	617	55.8	57.0	8.8	0.042	1872	1694	800m.fbmy5635_rel_20230529_843.cy10a5_bee
999	1957	234	2.0	11.2	3.0	0.120	1.057	0.011	3.080	8205	14.7	4.193	601	55.7	56.9	8.7	0.031	1918	1726	800m.fbmy5635_rel_20230529_850.cy10a5_bee
l.i0
l.i0: load without secondary indexes
Performance metrics for all DBMS, not just the ones listed above. Some are normalized by throughput, others are not. Legend for results is here.
ips	qps	rps	rmbps	wps	wmbps	rpq	rkbpq	wpi	wkbpi	csps	cpups	cspq	cpupq	dbgb1	dbgb2	rss	maxop	p50	p99	tag
81086	0	0	0.0	43.8	14.6	0.000	0.000	0.001	0.184	8054	23.3	0.099	23	25.1	26.7	1.6	0.123	81406	73348	800m.fbmy5635_rel_202104072149.cy10a5_bee
79499	0	0	0.0	43.1	14.3	0.000	0.000	0.001	0.184	7888	23.0	0.099	23	25.1	25.7	1.5	0.118	79753	72717	800m.fbmy5635_rel_202203072101.cy10a5_bee
76716	0	0	0.0	41.4	13.8	0.000	0.000	0.001	0.184	7610	21.9	0.099	23	25.1	25.7	1.5	0.098	76912	70819	800m.fbmy5635_rel_202205192101.cy10a5_bee
77250	0	0	0.0	43.7	13.9	0.000	0.000	0.001	0.184	7685	22.4	0.099	23	25.1	25.7	1.5	0.133	77512	70722	800m.fbmy5635_rel_202208092101.cy10a5_bee
76967	0	0	0.0	43.5	13.8	0.000	0.000	0.001	0.184	7650	22.0	0.099	23	25.1	25.7	1.5	0.099	77212	70322	800m.fbmy5635_rel_202210112144.cy10a5_bee
76908	0	0	0.0	41.7	13.8	0.000	0.000	0.001	0.184	7624	22.3	0.099	23	25.1	25.7	1.5	0.115	77112	70921	800m.fbmy5635_rel_202302162102.cy10a5_bee
77265	0	0	0.0	42.0	13.9	0.000	0.000	0.001	0.184	7665	22.3	0.099	23	25.1	25.7	1.5	0.091	77512	71312	800m.fbmy5635_rel_202304122154.cy10a5_bee
75944	0	0	0.0	41.2	13.7	0.000	0.000	0.001	0.184	7546	21.3	0.099	22	25.1	25.7	1.5	0.089	76110	69922	800m.fbmy5635_rel_202305292102.cy10a5_bee
76307	0	0	0.0	41.5	13.7	0.000	0.000	0.001	0.184	7571	21.6	0.099	23	25.1	25.7	1.5	0.091	76511	70320	800m.fbmy5635_rel_20230529_832.cy10a5_bee
76621	0	0	0.0	41.5	13.8	0.000	0.000	0.001	0.184	7610	22.1	0.099	23	25.1	25.7	1.5	0.120	76812	70520	800m.fbmy5635_rel_20230529_843.cy10a5_bee
76067	0	0	0.0	41.3	13.7	0.000	0.000	0.001	0.184	7553	21.7	0.099	23	25.1	25.7	1.5	0.097	76212	69953	800m.fbmy5635_rel_20230529_850.cy10a5_bee
l.x
l.x: create secondary indexes
Performance metrics for all DBMS, not just the ones listed above. Some are normalized by throughput, others are not. Legend for results is here.
ips	qps	rps	rmbps	wps	wmbps	rpq	rkbpq	wpi	wkbpi	csps	cpups	cspq	cpupq	dbgb1	dbgb2	rss	maxop	p50	p99	tag
76019	0	102	15.9	31.1	11.1	0.001	0.214	0.000	0.149	297	11.7	0.004	12	51.0	52.6	8.8	0.007	NA	NA	800m.fbmy5635_rel_202104072149.cy10a5_bee
76026	0	101	15.9	31.4	11.1	0.001	0.214	0.000	0.150	296	11.7	0.004	12	51.1	51.7	8.8	0.008	NA	NA	800m.fbmy5635_rel_202203072101.cy10a5_bee
75481	0	100	15.8	30.3	11.0	0.001	0.214	0.000	0.150	295	11.7	0.004	12	51.0	51.7	8.8	0.006	NA	NA	800m.fbmy5635_rel_202205192101.cy10a5_bee
75212	0	100	15.7	32.5	11.0	0.001	0.214	0.000	0.150	339	11.7	0.005	12	51.1	51.7	8.8	0.008	NA	NA	800m.fbmy5635_rel_202208092101.cy10a5_bee
75753	0	101	15.8	33.6	11.1	0.001	0.214	0.000	0.150	345	11.7	0.005	12	51.0	51.7	8.8	0.007	NA	NA	800m.fbmy5635_rel_202210112144.cy10a5_bee
75417	0	100	15.8	31.4	11.0	0.001	0.214	0.000	0.150	290	11.7	0.004	12	51.0	51.7	8.8	0.007	NA	NA	800m.fbmy5635_rel_202302162102.cy10a5_bee
75738	0	101	15.8	30.0	11.1	0.001	0.214	0.000	0.149	305	11.7	0.004	12	51.0	51.7	8.8	0.008	NA	NA	800m.fbmy5635_rel_202304122154.cy10a5_bee
75860	0	101	15.9	30.1	11.1	0.001	0.214	0.000	0.149	298	11.7	0.004	12	51.0	51.7	8.8	0.009	NA	NA	800m.fbmy5635_rel_202305292102.cy10a5_bee
76004	0	101	15.9	31.0	11.1	0.001	0.214	0.000	0.150	293	11.7	0.004	12	51.0	51.7	8.8	0.007	NA	NA	800m.fbmy5635_rel_20230529_832.cy10a5_bee
75467	0	100	15.8	30.1	11.0	0.001	0.214	0.000	0.150	299	11.7	0.004	12	51.0	51.7	8.8	0.010	NA	NA	800m.fbmy5635_rel_20230529_843.cy10a5_bee
76004	0	101	15.9	30.2	11.1	0.001	0.214	0.000	0.150	298	11.7	0.004	12	51.0	51.7	8.8	0.006	NA	NA	800m.fbmy5635_rel_20230529_850.cy10a5_bee
l.i1
l.i1: continue load after secondary indexes created
Performance metrics for all DBMS, not just the ones listed above. Some are normalized by throughput, others are not. Legend for results is here.
ips	qps	rps	rmbps	wps	wmbps	rpq	rkbpq	wpi	wkbpi	csps	cpups	cspq	cpupq	dbgb1	dbgb2	rss	maxop	p50	p99	tag
26745	0	418	31.1	201.0	75.2	0.016	1.189	0.008	2.877	11820	55.4	0.442	166	58.6	59.9	8.6	0.099	26770	23473	800m.fbmy5635_rel_202104072149.cy10a5_bee
26233	0	431	33.3	200.4	76.1	0.016	1.298	0.008	2.972	11591	55.8	0.442	170	58.0	58.0	8.6	0.108	26220	23023	800m.fbmy5635_rel_202203072101.cy10a5_bee
25753	0	416	31.8	195.1	73.8	0.016	1.264	0.008	2.934	11447	55.2	0.445	171	57.7	57.7	8.6	0.125	25771	22475	800m.fbmy5635_rel_202205192101.cy10a5_bee
25840	0	412	31.3	197.8	74.1	0.016	1.239	0.008	2.936	11485	55.1	0.444	171	57.8	57.9	8.6	0.154	25870	22575	800m.fbmy5635_rel_202208092101.cy10a5_bee
25773	0	435	34.0	199.8	74.8	0.017	1.352	0.008	2.974	11472	55.5	0.445	172	57.7	57.7	8.7	0.134	25821	22525	800m.fbmy5635_rel_202210112144.cy10a5_bee
25588	0	368	25.8	161.4	61.0	0.014	1.031	0.006	2.440	11450	52.8	0.447	165	57.7	57.7	8.6	0.113	25671	22025	800m.fbmy5635_rel_202302162102.cy10a5_bee
25562	0	374	26.5	161.0	60.6	0.015	1.060	0.006	2.428	11421	52.6	0.447	165	57.8	57.8	8.6	0.141	25570	21926	800m.fbmy5635_rel_202304122154.cy10a5_bee
25381	0	378	27.0	159.9	60.3	0.015	1.091	0.006	2.434	11340	52.9	0.447	167	57.1	57.1	8.6	0.102	25422	21676	800m.fbmy5635_rel_202305292102.cy10a5_bee
25107	0	362	25.3	160.0	59.9	0.014	1.030	0.006	2.442	11104	53.5	0.442	170	58.3	58.3	8.6	0.131	25072	21526	800m.fbmy5635_rel_20230529_832.cy10a5_bee
25813	0	338	22.0	173.8	64.8	0.013	0.872	0.007	2.572	11413	57.1	0.442	177	58.6	58.6	8.6	0.118	25772	22523	800m.fbmy5635_rel_20230529_843.cy10a5_bee
26076	0	3381	21.5	174.7	65.1	0.130	0.845	0.007	2.558	17359	55.4	0.666	170	57.8	59.8	8.6	0.114	26070	22525	800m.fbmy5635_rel_20230529_850.cy10a5_bee
q100.1
q100.1: range queries with 100 insert/s per client
Performance metrics for all DBMS, not just the ones listed above. Some are normalized by throughput, others are not. Legend for results is here.
ips	qps	rps	rmbps	wps	wmbps	rpq	rkbpq	wpi	wkbpi	csps	cpups	cspq	cpupq	dbgb1	dbgb2	rss	maxop	p50	p99	tag
100	2028	388	5.9	9.3	2.2	0.191	2.954	0.093	22.880	8419	13.4	4.151	529	55.7	57.0	9.7	0.080	2029	1295	800m.fbmy5635_rel_202104072149.cy10a5_bee
100	1979	292	5.3	9.4	2.3	0.148	2.720	0.094	23.952	8167	13.5	4.128	546	55.6	55.7	9.9	0.048	1982	1310	800m.fbmy5635_rel_202203072101.cy10a5_bee
100	2038	282	5.0	9.8	2.4	0.138	2.493	0.098	24.887	8428	13.6	4.136	534	55.7	55.8	9.9	0.059	2045	1263	800m.fbmy5635_rel_202205192101.cy10a5_bee
100	1949	271	4.9	11.7	2.3	0.139	2.594	0.117	23.679	8065	13.5	4.137	554	55.7	55.8	10.0	0.050	1933	1310	800m.fbmy5635_rel_202208092101.cy10a5_bee
100	2002	294	5.3	12.1	2.6	0.147	2.707	0.121	26.202	8287	13.5	4.140	540	55.5	55.6	9.9	0.058	1982	1310	800m.fbmy5635_rel_202210112144.cy10a5_bee
100	1930	274	4.2	8.5	2.0	0.142	2.216	0.086	20.303	8001	13.2	4.145	547	55.7	55.8	9.9	0.039	1902	1215	800m.fbmy5635_rel_202302162102.cy10a5_bee
100	1956	273	4.2	8.9	2.1	0.140	2.212	0.089	21.241	8094	13.2	4.138	540	55.7	55.8	9.7	0.048	1949	1279	800m.fbmy5635_rel_202304122154.cy10a5_bee
100	1972	266	4.2	8.2	1.9	0.135	2.171	0.083	19.342	8273	13.4	4.195	544	55.7	55.8	9.8	0.038	1950	1263	800m.fbmy5635_rel_202305292102.cy10a5_bee
100	1926	301	4.7	9.0	2.1	0.156	2.486	0.090	22.045	8011	13.4	4.159	557	55.7	55.7	9.7	0.056	1902	1247	800m.fbmy5635_rel_20230529_832.cy10a5_bee
100	1888	284	4.4	7.9	1.7	0.151	2.402	0.079	17.759	7843	13.3	4.155	564	55.8	55.9	9.6	0.048	1869	1215	800m.fbmy5635_rel_20230529_843.cy10a5_bee
100	1944	632	5.4	9.6	2.3	0.325	2.861	0.096	23.900	8620	13.6	4.435	560	55.7	55.8	9.6	0.062	1967	1263	800m.fbmy5635_rel_20230529_850.cy10a5_bee
q500.1
q500.1: range queries with 500 insert/s per client
Performance metrics for all DBMS, not just the ones listed above. Some are normalized by throughput, others are not. Legend for results is here.
ips	qps	rps	rmbps	wps	wmbps	rpq	rkbpq	wpi	wkbpi	csps	cpups	cspq	cpupq	dbgb1	dbgb2	rss	maxop	p50	p99	tag
499	2048	118	1.9	8.1	1.8	0.057	0.969	0.016	3.766	8130	13.3	3.970	520	55.7	57.4	9.2	0.044	2014	1838	800m.fbmy5635_rel_202104072149.cy10a5_bee
499	2001	59	1.5	7.7	1.7	0.029	0.748	0.016	3.583	7944	13.4	3.971	536	55.6	56.1	9.4	0.032	1981	1822	800m.fbmy5635_rel_202203072101.cy10a5_bee
499	2019	42	1.1	7.7	1.7	0.021	0.576	0.015	3.578	8010	13.4	3.968	531	55.7	56.1	9.1	0.033	1998	1822	800m.fbmy5635_rel_202205192101.cy10a5_bee
499	1984	57	1.4	10.0	1.8	0.029	0.709	0.020	3.697	7904	13.4	3.983	540	55.7	56.1	9.2	0.032	1950	1790	800m.fbmy5635_rel_202208092101.cy10a5_bee
499	2024	56	1.5	9.1	1.5	0.028	0.764	0.018	3.086	8082	13.3	3.993	526	55.7	56.2	9.3	0.010	1998	1822	800m.fbmy5635_rel_202210112144.cy10a5_bee
499	1940	29	0.7	6.4	1.3	0.015	0.351	0.013	2.586	7700	13.2	3.969	544	55.8	56.3	9.0	0.016	1902	1742	800m.fbmy5635_rel_202302162102.cy10a5_bee
499	1922	32	0.7	7.0	1.5	0.016	0.349	0.014	3.058	7651	13.3	3.981	554	55.7	56.2	9.3	0.042	1886	1742	800m.fbmy5635_rel_202304122154.cy10a5_bee
499	1997	63	1.4	6.8	1.4	0.032	0.705	0.014	2.869	7971	13.6	3.991	545	55.7	56.2	9.4	0.035	1950	1774	800m.fbmy5635_rel_202305292102.cy10a5_bee
499	1914	29	0.5	5.9	1.1	0.015	0.271	0.012	2.309	7605	13.2	3.973	552	55.8	56.3	9.4	0.020	1870	1726	800m.fbmy5635_rel_20230529_832.cy10a5_bee
499	1933	62	1.5	7.3	1.6	0.032	0.782	0.015	3.224	7689	13.6	3.977	563	55.8	56.2	8.8	0.046	1918	1694	800m.fbmy5635_rel_20230529_843.cy10a5_bee
499	1940	150	1.5	6.5	1.3	0.077	0.817	0.013	2.630	8061	14.1	4.155	581	55.7	56.2	9.1	0.039	1901	1726	800m.fbmy5635_rel_20230529_850.cy10a5_bee
q1000.1
q1000.1: range queries with 1000 insert/s per client
Performance metrics for all DBMS, not just the ones listed above. Some are normalized by throughput, others are not. Legend for results is here.
ips	qps	rps	rmbps	wps	wmbps	rpq	rkbpq	wpi	wkbpi	csps	cpups	cspq	cpupq	dbgb1	dbgb2	rss	maxop	p50	p99	tag
999	2044	234	4.1	12.6	3.5	0.114	2.065	0.013	3.543	8335	14.9	4.078	583	55.8	56.3	8.7	0.044	2014	1838	800m.fbmy5635_rel_202104072149.cy10a5_bee
998	2043	103	2.6	12.4	3.4	0.050	1.296	0.012	3.527	8332	14.7	4.079	576	55.6	56.9	8.8	0.045	2030	1808	800m.fbmy5635_rel_202203072101.cy10a5_bee
999	2026	74	2.0	12.8	3.6	0.037	1.003	0.013	3.698	8263	14.9	4.078	588	55.7	56.9	8.8	0.039	1998	1822	800m.fbmy5635_rel_202205192101.cy10a5_bee
999	1985	98	2.8	15.3	3.7	0.049	1.436	0.015	3.830	8122	15.0	4.091	604	56.0	57.3	8.9	0.048	1934	1774	800m.fbmy5635_rel_202208092101.cy10a5_bee
998	2051	105	2.8	16.2	4.0	0.051	1.400	0.016	4.134	8389	15.1	4.089	589	55.6	56.8	8.8	0.054	2014	1837	800m.fbmy5635_rel_202210112144.cy10a5_bee
998	1972	72	2.0	12.2	3.4	0.037	1.058	0.012	3.496	8044	14.9	4.080	605	55.7	56.9	8.8	0.043	1935	1758	800m.fbmy5635_rel_202302162102.cy10a5_bee
999	1984	63	1.7	10.4	2.8	0.032	0.854	0.010	2.820	8087	14.6	4.076	589	55.8	57.0	8.9	0.032	1934	1790	800m.fbmy5635_rel_202304122154.cy10a5_bee
998	1987	56	1.4	11.2	3.0	0.028	0.721	0.011	3.116	8095	14.7	4.074	592	55.7	56.9	8.8	0.047	1966	1774	800m.fbmy5635_rel_202305292102.cy10a5_bee
998	1951	72	1.6	11.0	3.0	0.037	0.849	0.011	3.046	7964	14.7	4.083	603	56.0	57.2	8.7	0.042	1902	1726	800m.fbmy5635_rel_20230529_832.cy10a5_bee
998	1919	87	1.9	11.1	3.0	0.045	1.027	0.011	3.050	7852	14.8	4.091	617	55.8	57.0	8.8	0.042	1872	1694	800m.fbmy5635_rel_20230529_843.cy10a5_bee
999	1957	234	2.0	11.2	3.0	0.120	1.057	0.011	3.080	8205	14.7	4.193	601	55.7	56.9	8.7	0.031	1918	1726	800m.fbmy5635_rel_20230529_850.cy10a5_bee
l.i0
- l.i0: load without secondary indexes
- Legend for results is here.
- Each entry lists the percentage of responses that fit in that bucket (slower than max time for previous bucket, faster than min time for next bucket).
Insert response time histogram
256us	1ms	4ms	16ms	64ms	256ms	1s	4s	16s	gt	max	tag
0.000	nonzero	99.873	0.123	0.002	0.002	0.000	0.000	0.000	0.000	0.123	fbmy5635_rel_202104072149.cy10a5_bee
0.000	0.000	99.871	0.125	0.003	0.001	0.000	0.000	0.000	0.000	0.118	fbmy5635_rel_202203072101.cy10a5_bee
0.000	0.000	99.867	0.129	0.003	0.001	0.000	0.000	0.000	0.000	0.098	fbmy5635_rel_202205192101.cy10a5_bee
0.000	0.000	99.867	0.129	0.002	0.002	0.000	0.000	0.000	0.000	0.133	fbmy5635_rel_202208092101.cy10a5_bee
0.000	0.000	99.867	0.129	0.002	0.002	0.000	0.000	0.000	0.000	0.099	fbmy5635_rel_202210112144.cy10a5_bee
0.000	0.000	99.867	0.129	0.003	0.001	0.000	0.000	0.000	0.000	0.115	fbmy5635_rel_202302162102.cy10a5_bee
0.000	0.000	99.868	0.128	0.003	0.001	0.000	0.000	0.000	0.000	0.091	fbmy5635_rel_202304122154.cy10a5_bee
0.000	0.000	99.865	0.131	0.003	0.001	0.000	0.000	0.000	0.000	0.089	fbmy5635_rel_202305292102.cy10a5_bee
0.000	0.000	99.866	0.130	0.003	0.001	0.000	0.000	0.000	0.000	0.091	fbmy5635_rel_20230529_832.cy10a5_bee
0.000	0.000	99.866	0.130	0.003	0.001	0.000	0.000	0.000	0.000	0.120	fbmy5635_rel_20230529_843.cy10a5_bee
0.000	0.000	99.865	0.130	0.003	0.001	0.000	0.000	0.000	0.000	0.097	fbmy5635_rel_20230529_850.cy10a5_bee
l.x
- l.x: create secondary indexes
- Legend for results is here.
- Each entry lists the percentage of responses that fit in that bucket (slower than max time for previous bucket, faster than min time for next bucket).
TODO - determine whether there is data for create index response time
l.i1
- l.i1: continue load after secondary indexes created
- Legend for results is here.
- Each entry lists the percentage of responses that fit in that bucket (slower than max time for previous bucket, faster than min time for next bucket).
Insert response time histogram
256us	1ms	4ms	16ms	64ms	256ms	1s	4s	16s	gt	max	tag
0.000	0.000	99.771	0.222	0.006	0.002	0.000	0.000	0.000	0.000	0.099	fbmy5635_rel_202104072149.cy10a5_bee
0.000	0.000	99.778	0.215	0.005	0.002	0.000	0.000	0.000	0.000	0.108	fbmy5635_rel_202203072101.cy10a5_bee
0.000	0.000	99.766	0.226	0.006	0.002	0.000	0.000	0.000	0.000	0.125	fbmy5635_rel_202205192101.cy10a5_bee
0.000	0.000	99.769	0.225	0.003	0.003	0.000	0.000	0.000	0.000	0.154	fbmy5635_rel_202208092101.cy10a5_bee
0.000	0.000	99.770	0.222	0.004	0.003	0.000	0.000	0.000	0.000	0.134	fbmy5635_rel_202210112144.cy10a5_bee
0.000	0.000	99.784	0.210	0.005	0.001	0.000	0.000	0.000	0.000	0.113	fbmy5635_rel_202302162102.cy10a5_bee
0.000	0.000	99.771	0.223	0.005	0.002	0.000	0.000	0.000	0.000	0.141	fbmy5635_rel_202304122154.cy10a5_bee
0.000	0.000	99.779	0.215	0.005	0.002	0.000	0.000	0.000	0.000	0.102	fbmy5635_rel_202305292102.cy10a5_bee
0.000	0.000	99.777	0.217	0.004	0.002	0.000	0.000	0.000	0.000	0.131	fbmy5635_rel_20230529_832.cy10a5_bee
0.000	0.000	99.764	0.229	0.005	0.002	0.000	0.000	0.000	0.000	0.118	fbmy5635_rel_20230529_843.cy10a5_bee
0.000	0.000	99.777	0.217	0.005	0.002	0.000	0.000	0.000	0.000	0.114	fbmy5635_rel_20230529_850.cy10a5_bee
Delete response time histogram
256us	1ms	4ms	16ms	64ms	256ms	1s	4s	16s	gt	max	tag
0.000	0.000	99.708	0.279	0.012	0.002	0.000	0.000	0.000	0.000	0.100	fbmy5635_rel_202104072149.cy10a5_bee
0.000	0.000	99.686	0.301	0.011	0.002	0.000	0.000	0.000	0.000	0.108	fbmy5635_rel_202203072101.cy10a5_bee
0.000	0.000	99.688	0.298	0.012	0.002	0.000	0.000	0.000	0.000	0.125	fbmy5635_rel_202205192101.cy10a5_bee
0.000	0.000	99.700	0.288	0.009	0.003	0.000	0.000	0.000	0.000	0.153	fbmy5635_rel_202208092101.cy10a5_bee
0.000	0.000	99.693	0.294	0.010	0.003	0.000	0.000	0.000	0.000	0.134	fbmy5635_rel_202210112144.cy10a5_bee
0.000	0.000	99.712	0.278	0.008	0.002	0.000	0.000	0.000	0.000	0.113	fbmy5635_rel_202302162102.cy10a5_bee
0.000	0.000	99.721	0.269	0.009	0.002	0.000	0.000	0.000	0.000	0.140	fbmy5635_rel_202304122154.cy10a5_bee
0.000	0.000	99.712	0.278	0.008	0.002	0.000	0.000	0.000	0.000	0.102	fbmy5635_rel_202305292102.cy10a5_bee
0.000	0.000	99.707	0.283	0.008	0.002	0.000	0.000	0.000	0.000	0.130	fbmy5635_rel_20230529_832.cy10a5_bee
0.000	0.000	99.703	0.287	0.009	0.002	0.000	0.000	0.000	0.000	0.118	fbmy5635_rel_20230529_843.cy10a5_bee
0.000	0.000	99.707	0.282	0.009	0.001	0.000	0.000	0.000	0.000	0.114	fbmy5635_rel_20230529_850.cy10a5_bee
q100.1
- q100.1: range queries with 100 insert/s per client
- Legend for results is here.
- Each entry lists the percentage of responses that fit in that bucket (slower than max time for previous bucket, faster than min time for next bucket).
Query response time histogram
256us	1ms	4ms	16ms	64ms	256ms	1s	4s	16s	gt	max	tag
3.071	94.805	2.118	0.006	0.001	nonzero	0.000	0.000	0.000	0.000	0.080	fbmy5635_rel_202104072149.cy10a5_bee
2.015	95.274	2.700	0.010	nonzero	0.000	0.000	0.000	0.000	0.000	0.048	fbmy5635_rel_202203072101.cy10a5_bee
2.634	95.476	1.871	0.018	nonzero	0.000	0.000	0.000	0.000	0.000	0.059	fbmy5635_rel_202205192101.cy10a5_bee
1.509	95.499	2.977	0.015	nonzero	0.000	0.000	0.000	0.000	0.000	0.050	fbmy5635_rel_202208092101.cy10a5_bee
2.159	95.306	2.522	0.012	nonzero	0.000	0.000	0.000	0.000	0.000	0.058	fbmy5635_rel_202210112144.cy10a5_bee
2.193	91.186	6.608	0.013	nonzero	0.000	0.000	0.000	0.000	0.000	0.039	fbmy5635_rel_202302162102.cy10a5_bee
2.054	92.119	5.817	0.009	0.001	0.000	0.000	0.000	0.000	0.000	0.048	fbmy5635_rel_202304122154.cy10a5_bee
1.896	92.465	5.632	0.007	nonzero	0.000	0.000	0.000	0.000	0.000	0.038	fbmy5635_rel_202305292102.cy10a5_bee
2.241	91.527	6.219	0.013	0.001	0.000	0.000	0.000	0.000	0.000	0.056	fbmy5635_rel_20230529_832.cy10a5_bee
1.670	90.794	7.525	0.010	nonzero	0.000	0.000	0.000	0.000	0.000	0.048	fbmy5635_rel_20230529_843.cy10a5_bee
2.845	91.151	5.994	0.010	nonzero	0.000	0.000	0.000	0.000	0.000	0.062	fbmy5635_rel_20230529_850.cy10a5_bee
Insert response time histogram
256us	1ms	4ms	16ms	64ms	256ms	1s	4s	16s	gt	max	tag
0.000	0.000	99.389	0.611	0.000	0.000	0.000	0.000	0.000	0.000	0.011	fbmy5635_rel_202104072149.cy10a5_bee
0.000	0.000	99.264	0.736	0.000	0.000	0.000	0.000	0.000	0.000	0.015	fbmy5635_rel_202203072101.cy10a5_bee
0.000	0.000	99.417	0.569	0.014	0.000	0.000	0.000	0.000	0.000	0.019	fbmy5635_rel_202205192101.cy10a5_bee
0.000	0.000	99.208	0.778	0.014	0.000	0.000	0.000	0.000	0.000	0.017	fbmy5635_rel_202208092101.cy10a5_bee
0.000	0.000	99.333	0.667	0.000	0.000	0.000	0.000	0.000	0.000	0.015	fbmy5635_rel_202210112144.cy10a5_bee
0.000	0.000	99.264	0.722	0.014	0.000	0.000	0.000	0.000	0.000	0.016	fbmy5635_rel_202302162102.cy10a5_bee
0.000	0.000	99.444	0.556	0.000	0.000	0.000	0.000	0.000	0.000	0.011	fbmy5635_rel_202304122154.cy10a5_bee
0.000	0.000	99.306	0.694	0.000	0.000	0.000	0.000	0.000	0.000	0.016	fbmy5635_rel_202305292102.cy10a5_bee
0.000	0.000	99.347	0.653	0.000	0.000	0.000	0.000	0.000	0.000	0.015	fbmy5635_rel_20230529_832.cy10a5_bee
0.000	0.000	99.319	0.667	0.014	0.000	0.000	0.000	0.000	0.000	0.025	fbmy5635_rel_20230529_843.cy10a5_bee
0.000	0.000	99.403	0.597	0.000	0.000	0.000	0.000	0.000	0.000	0.014	fbmy5635_rel_20230529_850.cy10a5_bee
Delete response time histogram
256us	1ms	4ms	16ms	64ms	256ms	1s	4s	16s	gt	max	tag
0.000	0.000	96.486	3.514	0.000	0.000	0.000	0.000	0.000	0.000	0.013	fbmy5635_rel_202104072149.cy10a5_bee
0.000	0.000	90.014	9.819	0.167	0.000	0.000	0.000	0.000	0.000	0.022	fbmy5635_rel_202203072101.cy10a5_bee
0.000	0.000	86.361	13.403	0.236	0.000	0.000	0.000	0.000	0.000	0.022	fbmy5635_rel_202205192101.cy10a5_bee
0.000	0.000	83.125	16.694	0.181	0.000	0.000	0.000	0.000	0.000	0.023	fbmy5635_rel_202208092101.cy10a5_bee
0.000	0.000	88.917	10.875	0.208	0.000	0.000	0.000	0.000	0.000	0.023	fbmy5635_rel_202210112144.cy10a5_bee
0.000	0.000	85.889	13.875	0.236	0.000	0.000	0.000	0.000	0.000	0.023	fbmy5635_rel_202302162102.cy10a5_bee
0.000	0.000	89.319	10.583	0.097	0.000	0.000	0.000	0.000	0.000	0.018	fbmy5635_rel_202304122154.cy10a5_bee
0.000	0.000	94.139	5.778	0.083	0.000	0.000	0.000	0.000	0.000	0.050	fbmy5635_rel_202305292102.cy10a5_bee
0.000	0.000	85.208	14.583	0.208	0.000	0.000	0.000	0.000	0.000	0.023	fbmy5635_rel_20230529_832.cy10a5_bee
0.000	0.000	86.625	13.264	0.111	0.000	0.000	0.000	0.000	0.000	0.017	fbmy5635_rel_20230529_843.cy10a5_bee
0.000	0.000	89.431	10.444	0.125	0.000	0.000	0.000	0.000	0.000	0.025	fbmy5635_rel_20230529_850.cy10a5_bee
q500.1
- q500.1: range queries with 500 insert/s per client
- Legend for results is here.
- Each entry lists the percentage of responses that fit in that bucket (slower than max time for previous bucket, faster than min time for next bucket).
Query response time histogram
256us	1ms	4ms	16ms	64ms	256ms	1s	4s	16s	gt	max	tag
1.430	97.168	1.398	0.005	nonzero	0.000	0.000	0.000	0.000	0.000	0.044	fbmy5635_rel_202104072149.cy10a5_bee
0.916	96.677	2.399	0.008	nonzero	0.000	0.000	0.000	0.000	0.000	0.032	fbmy5635_rel_202203072101.cy10a5_bee
0.842	97.609	1.533	0.016	nonzero	0.000	0.000	0.000	0.000	0.000	0.033	fbmy5635_rel_202205192101.cy10a5_bee
0.916	96.336	2.739	0.009	nonzero	0.000	0.000	0.000	0.000	0.000	0.032	fbmy5635_rel_202208092101.cy10a5_bee
1.091	97.014	1.880	0.015	0.000	0.000	0.000	0.000	0.000	0.000	0.010	fbmy5635_rel_202210112144.cy10a5_bee
1.003	92.932	6.041	0.024	0.000	0.000	0.000	0.000	0.000	0.000	0.016	fbmy5635_rel_202302162102.cy10a5_bee
0.766	92.544	6.666	0.024	nonzero	0.000	0.000	0.000	0.000	0.000	0.042	fbmy5635_rel_202304122154.cy10a5_bee
1.332	93.427	5.234	0.007	nonzero	0.000	0.000	0.000	0.000	0.000	0.035	fbmy5635_rel_202305292102.cy10a5_bee
0.967	92.169	6.843	0.022	nonzero	0.000	0.000	0.000	0.000	0.000	0.020	fbmy5635_rel_20230529_832.cy10a5_bee
1.593	91.487	6.912	0.009	nonzero	0.000	0.000	0.000	0.000	0.000	0.046	fbmy5635_rel_20230529_843.cy10a5_bee
1.591	91.293	7.112	0.004	nonzero	0.000	0.000	0.000	0.000	0.000	0.039	fbmy5635_rel_20230529_850.cy10a5_bee
Insert response time histogram
256us	1ms	4ms	16ms	64ms	256ms	1s	4s	16s	gt	max	tag
0.000	0.000	99.625	0.375	0.000	0.000	0.000	0.000	0.000	0.000	0.014	fbmy5635_rel_202104072149.cy10a5_bee
0.000	0.000	99.639	0.358	0.003	0.000	0.000	0.000	0.000	0.000	0.047	fbmy5635_rel_202203072101.cy10a5_bee
0.000	0.000	99.631	0.367	0.003	0.000	0.000	0.000	0.000	0.000	0.046	fbmy5635_rel_202205192101.cy10a5_bee
0.000	0.000	99.675	0.319	0.006	0.000	0.000	0.000	0.000	0.000	0.053	fbmy5635_rel_202208092101.cy10a5_bee
0.000	0.000	99.647	0.350	0.003	0.000	0.000	0.000	0.000	0.000	0.029	fbmy5635_rel_202210112144.cy10a5_bee
0.000	0.000	99.639	0.358	0.003	0.000	0.000	0.000	0.000	0.000	0.046	fbmy5635_rel_202302162102.cy10a5_bee
0.000	0.000	99.678	0.319	0.003	0.000	0.000	0.000	0.000	0.000	0.040	fbmy5635_rel_202304122154.cy10a5_bee
0.000	0.000	99.736	0.261	0.003	0.000	0.000	0.000	0.000	0.000	0.046	fbmy5635_rel_202305292102.cy10a5_bee
0.000	0.000	99.686	0.311	0.003	0.000	0.000	0.000	0.000	0.000	0.040	fbmy5635_rel_20230529_832.cy10a5_bee
0.000	0.000	99.686	0.311	0.003	0.000	0.000	0.000	0.000	0.000	0.048	fbmy5635_rel_20230529_843.cy10a5_bee
0.000	0.000	99.675	0.322	0.003	0.000	0.000	0.000	0.000	0.000	0.044	fbmy5635_rel_20230529_850.cy10a5_bee
Delete response time histogram
256us	1ms	4ms	16ms	64ms	256ms	1s	4s	16s	gt	max	tag
0.000	0.000	98.606	1.372	0.022	0.000	0.000	0.000	0.000	0.000	0.052	fbmy5635_rel_202104072149.cy10a5_bee
0.000	0.000	98.364	1.578	0.058	0.000	0.000	0.000	0.000	0.000	0.046	fbmy5635_rel_202203072101.cy10a5_bee
0.000	0.000	96.547	3.417	0.036	0.000	0.000	0.000	0.000	0.000	0.047	fbmy5635_rel_202205192101.cy10a5_bee
0.000	0.000	98.525	1.458	0.017	0.000	0.000	0.000	0.000	0.000	0.054	fbmy5635_rel_202208092101.cy10a5_bee
0.000	0.000	96.667	3.303	0.028	0.003	0.000	0.000	0.000	0.000	0.065	fbmy5635_rel_202210112144.cy10a5_bee
0.000	0.000	95.783	4.153	0.064	0.000	0.000	0.000	0.000	0.000	0.046	fbmy5635_rel_202302162102.cy10a5_bee
0.000	0.000	96.983	3.000	0.017	0.000	0.000	0.000	0.000	0.000	0.039	fbmy5635_rel_202304122154.cy10a5_bee
0.000	0.000	98.525	1.469	0.006	0.000	0.000	0.000	0.000	0.000	0.047	fbmy5635_rel_202305292102.cy10a5_bee
0.000	0.000	95.531	4.439	0.031	0.000	0.000	0.000	0.000	0.000	0.041	fbmy5635_rel_20230529_832.cy10a5_bee
0.000	0.000	97.875	2.108	0.017	0.000	0.000	0.000	0.000	0.000	0.047	fbmy5635_rel_20230529_843.cy10a5_bee
0.000	0.000	98.958	1.014	0.028	0.000	0.000	0.000	0.000	0.000	0.043	fbmy5635_rel_20230529_850.cy10a5_bee
q1000.1
- q1000.1: range queries with 1000 insert/s per client
- Legend for results is here.
- Each entry lists the percentage of responses that fit in that bucket (slower than max time for previous bucket, faster than min time for next bucket).
Query response time histogram
256us	1ms	4ms	16ms	64ms	256ms	1s	4s	16s	gt	max	tag
1.523	96.579	1.897	0.001	nonzero	0.000	0.000	0.000	0.000	0.000	0.044	fbmy5635_rel_202104072149.cy10a5_bee
1.445	96.046	2.506	0.003	nonzero	0.000	0.000	0.000	0.000	0.000	0.045	fbmy5635_rel_202203072101.cy10a5_bee
0.955	97.117	1.918	0.011	nonzero	0.000	0.000	0.000	0.000	0.000	0.039	fbmy5635_rel_202205192101.cy10a5_bee
0.873	95.965	3.152	0.010	nonzero	0.000	0.000	0.000	0.000	0.000	0.048	fbmy5635_rel_202208092101.cy10a5_bee
1.246	96.514	2.235	0.005	nonzero	0.000	0.000	0.000	0.000	0.000	0.054	fbmy5635_rel_202210112144.cy10a5_bee
0.834	94.197	4.954	0.015	nonzero	0.000	0.000	0.000	0.000	0.000	0.043	fbmy5635_rel_202302162102.cy10a5_bee
0.939	94.161	4.890	0.011	nonzero	0.000	0.000	0.000	0.000	0.000	0.032	fbmy5635_rel_202304122154.cy10a5_bee
0.903	94.528	4.545	0.023	nonzero	0.000	0.000	0.000	0.000	0.000	0.047	fbmy5635_rel_202305292102.cy10a5_bee
1.075	93.433	5.480	0.012	nonzero	0.000	0.000	0.000	0.000	0.000	0.042	fbmy5635_rel_20230529_832.cy10a5_bee
1.154	92.039	6.798	0.009	nonzero	0.000	0.000	0.000	0.000	0.000	0.042	fbmy5635_rel_20230529_843.cy10a5_bee
1.291	92.329	6.372	0.008	nonzero	0.000	0.000	0.000	0.000	0.000	0.031	fbmy5635_rel_20230529_850.cy10a5_bee
Insert response time histogram
256us	1ms	4ms	16ms	64ms	256ms	1s	4s	16s	gt	max	tag
0.000	0.000	99.721	0.276	0.003	0.000	0.000	0.000	0.000	0.000	0.059	fbmy5635_rel_202104072149.cy10a5_bee
0.000	0.000	99.711	0.286	0.003	0.000	0.000	0.000	0.000	0.000	0.048	fbmy5635_rel_202203072101.cy10a5_bee
0.000	0.000	99.683	0.314	0.003	0.000	0.000	0.000	0.000	0.000	0.059	fbmy5635_rel_202205192101.cy10a5_bee
0.000	0.000	99.692	0.306	0.001	0.001	0.000	0.000	0.000	0.000	0.065	fbmy5635_rel_202208092101.cy10a5_bee
0.000	0.000	99.679	0.318	0.003	0.000	0.000	0.000	0.000	0.000	0.053	fbmy5635_rel_202210112144.cy10a5_bee
0.000	0.000	99.678	0.317	0.006	0.000	0.000	0.000	0.000	0.000	0.062	fbmy5635_rel_202302162102.cy10a5_bee
0.000	0.000	99.700	0.294	0.006	0.000	0.000	0.000	0.000	0.000	0.047	fbmy5635_rel_202304122154.cy10a5_bee
0.000	0.000	99.797	0.200	0.003	0.000	0.000	0.000	0.000	0.000	0.049	fbmy5635_rel_202305292102.cy10a5_bee
0.000	0.000	99.728	0.271	0.001	0.000	0.000	0.000	0.000	0.000	0.055	fbmy5635_rel_20230529_832.cy10a5_bee
0.000	0.000	99.675	0.322	0.003	0.000	0.000	0.000	0.000	0.000	0.048	fbmy5635_rel_20230529_843.cy10a5_bee
0.000	0.000	99.718	0.278	0.004	0.000	0.000	0.000	0.000	0.000	0.047	fbmy5635_rel_20230529_850.cy10a5_bee
Delete response time histogram
256us	1ms	4ms	16ms	64ms	256ms	1s	4s	16s	gt	max	tag
0.000	0.000	99.661	0.335	0.004	0.000	0.000	0.000	0.000	0.000	0.058	fbmy5635_rel_202104072149.cy10a5_bee
0.000	0.000	99.515	0.479	0.006	0.000	0.000	0.000	0.000	0.000	0.053	fbmy5635_rel_202203072101.cy10a5_bee
0.000	0.000	99.332	0.651	0.017	0.000	0.000	0.000	0.000	0.000	0.060	fbmy5635_rel_202205192101.cy10a5_bee
0.000	0.000	99.315	0.674	0.010	0.001	0.000	0.000	0.000	0.000	0.065	fbmy5635_rel_202208092101.cy10a5_bee
0.000	0.000	99.572	0.424	0.004	0.000	0.000	0.000	0.000	0.000	0.052	fbmy5635_rel_202210112144.cy10a5_bee
0.000	0.000	99.257	0.729	0.014	0.000	0.000	0.000	0.000	0.000	0.063	fbmy5635_rel_202302162102.cy10a5_bee
0.000	0.000	99.219	0.768	0.013	0.000	0.000	0.000	0.000	0.000	0.047	fbmy5635_rel_202304122154.cy10a5_bee
0.000	0.000	98.794	1.196	0.010	0.000	0.000	0.000	0.000	0.000	0.050	fbmy5635_rel_202305292102.cy10a5_bee
0.000	0.000	99.399	0.599	0.003	0.000	0.000	0.000	0.000	0.000	0.055	fbmy5635_rel_20230529_832.cy10a5_bee
0.000	0.000	99.338	0.657	0.006	0.000	0.000	0.000	0.000	0.000	0.048	fbmy5635_rel_20230529_843.cy10a5_bee
0.000	0.000	99.386	0.607	0.007	0.000	0.000	0.000	0.000	0.000	0.048	fbmy5635_rel_20230529_850.cy10a5_bee