Introduction
This is a report for the insert benchmark with 800M docs and 1 client(s). It is generated by scripts (bash, awk, sed) and Tufte might not be impressed. An overview of the insert benchmark is here and a short update is here. Below, by DBMS, I mean DBMS+version.config. An example is my8020.c10b40 where my means MySQL, 8020 is version 8.0.20 and c10b40 is the name for the configuration file.
The test server has 8 AMD cores, 16G RAM and an NVMe SSD. It is described here as the Beelink. The benchmark was run with 1 client and there were 1 or 3 connections per client (1 for queries or inserts without rate limits, 1+1 for rate limited inserts+deletes). It uses 1 table. It loads 800M rows per table without secondary indexes, creates secondary indexes, then inserts 100M rows per table with a delete per insert to avoid growing the table. It then does 3 read+write tests for 3600s each that do queries as fast as possible with 100, 500 and then 1000 inserts/second/client concurrent with the queries and 1000 deletes/second to avoid growing the table. The database is larger than RAM. Clients and the DBMS share one server. The per-database configs are in the per-database subdirectories here.
The tested DBMS are:
- fbmy5635_rel_202104072149.cy10a_bee - MyRocks 5.6.35 from 20210407 at git hash (f896415fa0 MySQL, 0f8c041ea RocksDB), RocksDB 6.19, cy10a_bee config
- fbmy5635_rel_202203072101.cy10a_bee - MyRocks 5.6.35 from 20220307 at git hash (e7d976ee MySQL, df4d3cf6fd RocksDB), RocksDB 6.28.2, cy10a_bee config
- fbmy5635_rel_202205192101.cy10a_bee - MyRocks 5.6.35 from 20220519 at git hash (d503bd77 MySQL, f2f26b15 RocksDB), RocksDB 7.2.2, cy10a_bee config
- fbmy5635_rel_202208092101.cy10a_bee - MyRocks 5.6.35 from 20220809 at git hash (877a0e585 MySQL, 8e0f4952 RocksDB), RocksDB 7.3.1, cy10a_bee config
- fbmy5635_rel_202210112144.cy10a_bee - MyRocks 5.6.35 from 20221011 at git hash (c691c7160 MySQL, 8e0f4952 RocksDB), RocksDB 7.3.1, cy10a_bee config
- fbmy5635_rel_202302162102.cy10a_bee - MyRocks 5.6.35 from 20230216 at git hash (21a2b0aa MySQL, e5dcebf7 RocksDB), RocksDB 7.10.0, cy10a_bee config
- fbmy5635_rel_202304122154.cy10a_bee - MyRocks 5.6.35 from 20230412 at git hash (205c31dd MySQL, 3258b5c3 RocksDB), RocksDB 7.10.2, cy10a_bee config
- fbmy5635_rel_202305292102.cy10a_bee - MyRocks 5.6.35 from 20230529 at git hash (b739eac1 MySQL, 03057204 RocksDB), RocksDB 8.2.1, cy10a_bee config
- fbmy5635_rel_20230529_832.cy10a_bee - MyRocks 5.6.35 from 20230529 at git hash (b739eac1 MySQL), but with RocksDB 8.3.2, cy10a_bee config
- fbmy5635_rel_20230529_843.cy10a_bee - MyRocks 5.6.35 from 20230529 at git hash (b739eac1 MySQL), but with RocksDB 8.3.2, cy10a_bee config
- fbmy5635_rel_20230529_850.cy10a_bee - MyRocks 5.6.35 from 20230529 at git hash (b739eac1 MySQL), but with RocksDB 8.3.2, cy10a_bee config
Contents
- Summary
- l.i0: load without secondary indexes
- l.x: create secondary indexes
- l.i1: continue load after secondary indexes created
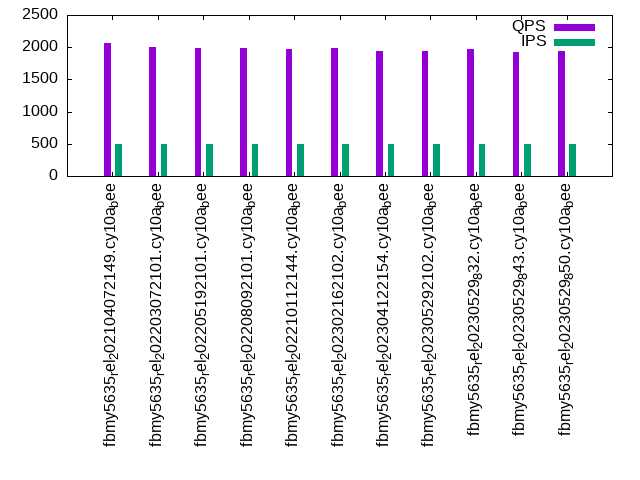
- q100.1: range queries with 100 insert/s per client
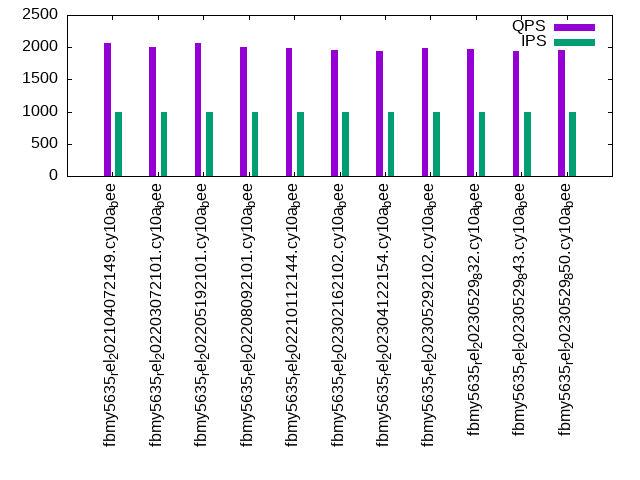
- q500.1: range queries with 500 insert/s per client
- q1000.1: range queries with 1000 insert/s per client
Summary
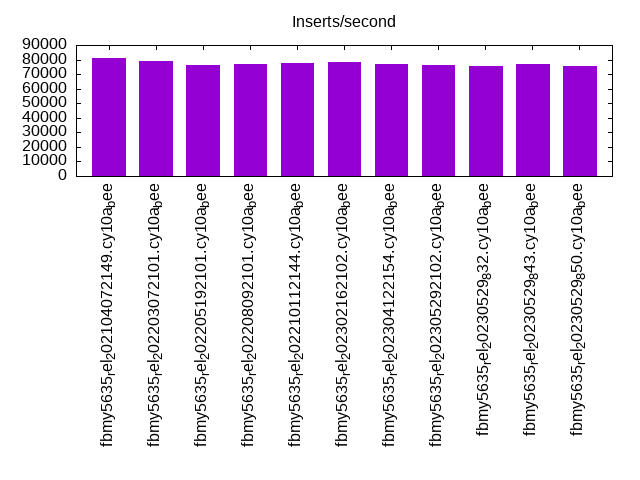
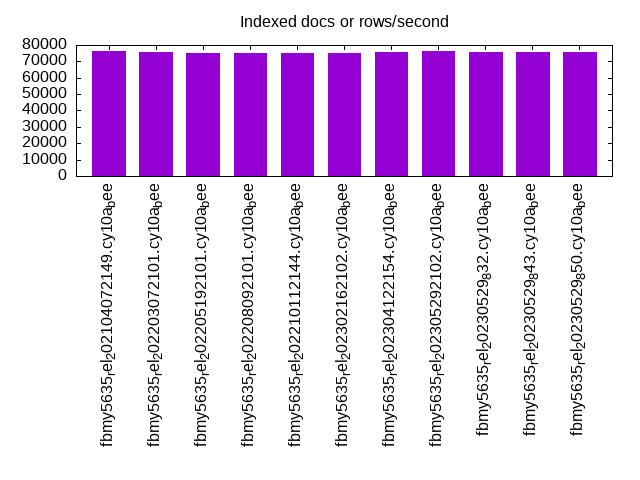
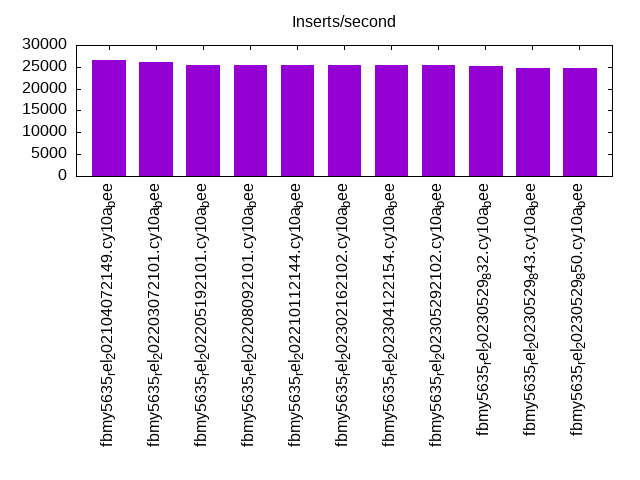
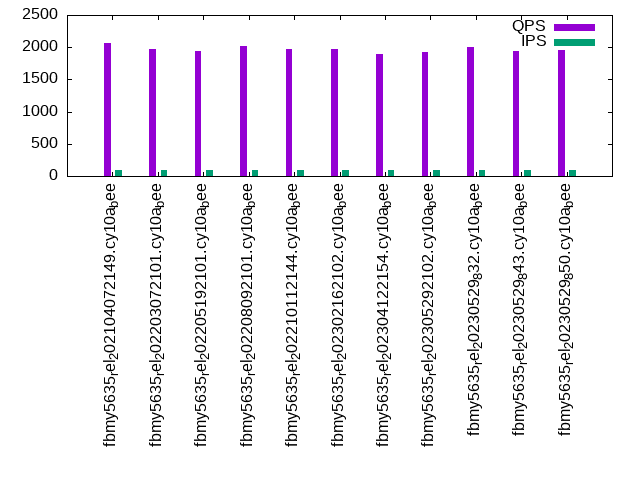
The numbers are inserts/s for l.i0 and l.i1, indexed docs (or rows) /s for l.x and queries/s for q*.2. The values are the average rate over the entire test for inserts (IPS) and queries (QPS). The range of values for IPS and QPS is split into 3 parts: bottom 25%, middle 50%, top 25%. Values in the bottom 25% have a red background, values in the top 25% have a green background and values in the middle have no color. A gray background is used for values that can be ignored because the DBMS did not sustain the target insert rate. Red backgrounds are not used when the minimum value is within 80% of the max value.
| dbms | l.i0 | l.x | l.i1 | q100.1 | q500.1 | q1000.1 |
|---|---|---|---|---|---|---|
| fbmy5635_rel_202104072149.cy10a_bee | 81350 | 76135 | 26490 | 2068 | 2071 | 2070 |
| fbmy5635_rel_202203072101.cy10a_bee | 78958 | 76004 | 26042 | 1969 | 2006 | 2004 |
| fbmy5635_rel_202205192101.cy10a_bee | 76198 | 75275 | 25374 | 1946 | 1987 | 2059 |
| fbmy5635_rel_202208092101.cy10a_bee | 76982 | 75417 | 25471 | 2023 | 1986 | 2007 |
| fbmy5635_rel_202210112144.cy10a_bee | 77504 | 74986 | 25452 | 1978 | 1965 | 1987 |
| fbmy5635_rel_202302162102.cy10a_bee | 78003 | 75410 | 25342 | 1970 | 1982 | 1955 |
| fbmy5635_rel_202304122154.cy10a_bee | 76864 | 75868 | 25413 | 1895 | 1934 | 1948 |
| fbmy5635_rel_202305292102.cy10a_bee | 76482 | 76280 | 25523 | 1925 | 1946 | 1986 |
| fbmy5635_rel_20230529_832.cy10a_bee | 75522 | 75925 | 25291 | 1996 | 1975 | 1965 |
| fbmy5635_rel_20230529_843.cy10a_bee | 76672 | 75846 | 24789 | 1939 | 1921 | 1940 |
| fbmy5635_rel_20230529_850.cy10a_bee | 75844 | 75695 | 24845 | 1951 | 1943 | 1962 |
This table has relative throughput, throughput for the DBMS relative to the DBMS in the first line, using the absolute throughput from the previous table. Values less than 0.95 have a yellow background. Values greater than 1.05 have a blue background.
| dbms | l.i0 | l.x | l.i1 | q100.1 | q500.1 | q1000.1 |
|---|---|---|---|---|---|---|
| fbmy5635_rel_202104072149.cy10a_bee | 1.00 | 1.00 | 1.00 | 1.00 | 1.00 | 1.00 |
| fbmy5635_rel_202203072101.cy10a_bee | 0.97 | 1.00 | 0.98 | 0.95 | 0.97 | 0.97 |
| fbmy5635_rel_202205192101.cy10a_bee | 0.94 | 0.99 | 0.96 | 0.94 | 0.96 | 0.99 |
| fbmy5635_rel_202208092101.cy10a_bee | 0.95 | 0.99 | 0.96 | 0.98 | 0.96 | 0.97 |
| fbmy5635_rel_202210112144.cy10a_bee | 0.95 | 0.98 | 0.96 | 0.96 | 0.95 | 0.96 |
| fbmy5635_rel_202302162102.cy10a_bee | 0.96 | 0.99 | 0.96 | 0.95 | 0.96 | 0.94 |
| fbmy5635_rel_202304122154.cy10a_bee | 0.94 | 1.00 | 0.96 | 0.92 | 0.93 | 0.94 |
| fbmy5635_rel_202305292102.cy10a_bee | 0.94 | 1.00 | 0.96 | 0.93 | 0.94 | 0.96 |
| fbmy5635_rel_20230529_832.cy10a_bee | 0.93 | 1.00 | 0.95 | 0.97 | 0.95 | 0.95 |
| fbmy5635_rel_20230529_843.cy10a_bee | 0.94 | 1.00 | 0.94 | 0.94 | 0.93 | 0.94 |
| fbmy5635_rel_20230529_850.cy10a_bee | 0.93 | 0.99 | 0.94 | 0.94 | 0.94 | 0.95 |
This lists the average rate of inserts/s for the tests that do inserts concurrent with queries. For such tests the query rate is listed in the table above. The read+write tests are setup so that the insert rate should match the target rate every second. Cells that are not at least 95% of the target have a red background to indicate a failure to satisfy the target.
| dbms | q100.1 | q500.1 | q1000.1 |
|---|---|---|---|
| fbmy5635_rel_202104072149.cy10a_bee | 100 | 499 | 998 |
| fbmy5635_rel_202203072101.cy10a_bee | 100 | 499 | 999 |
| fbmy5635_rel_202205192101.cy10a_bee | 100 | 499 | 998 |
| fbmy5635_rel_202208092101.cy10a_bee | 100 | 499 | 999 |
| fbmy5635_rel_202210112144.cy10a_bee | 100 | 499 | 999 |
| fbmy5635_rel_202302162102.cy10a_bee | 100 | 499 | 998 |
| fbmy5635_rel_202304122154.cy10a_bee | 100 | 499 | 999 |
| fbmy5635_rel_202305292102.cy10a_bee | 100 | 499 | 998 |
| fbmy5635_rel_20230529_832.cy10a_bee | 100 | 499 | 999 |
| fbmy5635_rel_20230529_843.cy10a_bee | 100 | 499 | 999 |
| fbmy5635_rel_20230529_850.cy10a_bee | 100 | 499 | 998 |
| target | 100 | 500 | 1000 |
l.i0
l.i0: load without secondary indexes. Graphs for performance per 1-second interval are here.
Average throughput:
Insert response time histogram: each cell has the percentage of responses that take <= the time in the header and max is the max response time in seconds. For the max column values in the top 25% of the range have a red background and in the bottom 25% of the range have a green background. The red background is not used when the min value is within 80% of the max value.
| dbms | 256us | 1ms | 4ms | 16ms | 64ms | 256ms | 1s | 4s | 16s | gt | max |
|---|---|---|---|---|---|---|---|---|---|---|---|
| fbmy5635_rel_202104072149.cy10a_bee | nonzero | 99.874 | 0.122 | 0.003 | 0.001 | 0.118 | |||||
| fbmy5635_rel_202203072101.cy10a_bee | 99.870 | 0.126 | 0.003 | 0.001 | 0.125 | ||||||
| fbmy5635_rel_202205192101.cy10a_bee | 99.866 | 0.130 | 0.003 | 0.001 | 0.113 | ||||||
| fbmy5635_rel_202208092101.cy10a_bee | 99.867 | 0.129 | 0.002 | 0.001 | 0.103 | ||||||
| fbmy5635_rel_202210112144.cy10a_bee | 99.868 | 0.128 | 0.002 | 0.002 | 0.095 | ||||||
| fbmy5635_rel_202302162102.cy10a_bee | 99.869 | 0.127 | 0.003 | 0.001 | 0.116 | ||||||
| fbmy5635_rel_202304122154.cy10a_bee | 99.867 | 0.129 | 0.003 | 0.001 | 0.081 | ||||||
| fbmy5635_rel_202305292102.cy10a_bee | 99.866 | 0.130 | 0.003 | 0.001 | 0.096 | ||||||
| fbmy5635_rel_20230529_832.cy10a_bee | 99.864 | 0.131 | 0.004 | nonzero | 0.133 | ||||||
| fbmy5635_rel_20230529_843.cy10a_bee | 99.866 | 0.130 | 0.004 | 0.001 | 0.097 | ||||||
| fbmy5635_rel_20230529_850.cy10a_bee | 99.865 | 0.131 | 0.003 | 0.001 | 0.085 |
Performance metrics for the DBMS listed above. Some are normalized by throughput, others are not. Legend for results is here.
ips	qps	rps	rmbps	wps	wmbps	rpq	rkbpq	wpi	wkbpi	csps	cpups	cspq	cpupq	dbgb1	dbgb2	rss	maxop	p50	p99	tag
81350	0	0	0.0	44.1	14.6	0.000	0.000	0.001	0.184	8090	23.5	0.099	23	25.1	26.7	1.6	0.118	81703	74301	800m.fbmy5635_rel_202104072149.cy10a_bee
78958	0	0	0.0	42.5	14.2	0.000	0.000	0.001	0.184	7839	22.9	0.099	23	25.1	25.7	1.5	0.125	79210	72716	800m.fbmy5635_rel_202203072101.cy10a_bee
76198	0	0	0.0	41.2	13.7	0.000	0.000	0.001	0.184	7557	21.5	0.099	23	25.1	25.7	1.5	0.113	76313	70320	800m.fbmy5635_rel_202205192101.cy10a_bee
76982	0	0	0.0	43.8	13.8	0.000	0.000	0.001	0.184	7651	22.2	0.099	23	25.1	25.7	1.5	0.103	77212	70519	800m.fbmy5635_rel_202208092101.cy10a_bee
77504	0	0	0.0	44.0	13.9	0.000	0.000	0.001	0.184	7697	22.4	0.099	23	25.1	25.7	1.5	0.095	77810	70722	800m.fbmy5635_rel_202210112144.cy10a_bee
78003	0	0	0.0	42.3	14.0	0.000	0.000	0.001	0.184	7751	22.9	0.099	23	25.1	25.7	1.5	0.116	78309	71822	800m.fbmy5635_rel_202302162102.cy10a_bee
76864	0	0	0.0	41.7	13.8	0.000	0.000	0.001	0.184	7630	22.2	0.099	23	25.1	25.7	1.5	0.081	77111	70819	800m.fbmy5635_rel_202304122154.cy10a_bee
76482	0	0	0.0	41.5	13.8	0.000	0.000	0.001	0.184	7590	21.9	0.099	23	25.1	25.7	1.5	0.096	76711	70619	800m.fbmy5635_rel_202305292102.cy10a_bee
75522	0	0	0.0	40.8	13.6	0.000	0.000	0.001	0.184	7503	21.1	0.099	22	25.1	25.7	1.5	0.133	75517	70122	800m.fbmy5635_rel_20230529_832.cy10a_bee
76672	0	0	0.0	41.7	13.8	0.000	0.000	0.001	0.184	7625	22.0	0.099	23	25.1	25.7	1.5	0.097	76815	71219	800m.fbmy5635_rel_20230529_843.cy10a_bee
75844	0	0	0.0	41.2	13.6	0.000	0.000	0.001	0.184	7527	21.3	0.099	22	25.1	25.7	1.5	0.085	75914	69954	800m.fbmy5635_rel_20230529_850.cy10a_bee
l.x
l.x: create secondary indexes.
Average throughput:
Performance metrics for the DBMS listed above. Some are normalized by throughput, others are not. Legend for results is here.
ips	qps	rps	rmbps	wps	wmbps	rpq	rkbpq	wpi	wkbpi	csps	cpups	cspq	cpupq	dbgb1	dbgb2	rss	maxop	p50	p99	tag
76135	0	102	15.9	30.7	11.1	0.001	0.214	0.000	0.150	301	11.7	0.004	12	51.0	52.6	8.8	0.007	NA	NA	800m.fbmy5635_rel_202104072149.cy10a_bee
76004	0	101	15.9	30.7	11.1	0.001	0.214	0.000	0.150	295	11.7	0.004	12	51.1	51.7	8.8	0.008	NA	NA	800m.fbmy5635_rel_202203072101.cy10a_bee
75275	0	100	15.7	30.6	11.0	0.001	0.214	0.000	0.150	291	11.7	0.004	12	51.0	51.7	8.8	0.012	NA	NA	800m.fbmy5635_rel_202205192101.cy10a_bee
75417	0	100	15.8	32.5	11.0	0.001	0.214	0.000	0.150	341	11.7	0.005	12	51.1	51.7	8.8	0.013	NA	NA	800m.fbmy5635_rel_202208092101.cy10a_bee
74986	0	100	15.7	33.3	11.0	0.001	0.214	0.000	0.150	338	11.7	0.005	12	51.1	51.7	8.8	0.007	NA	NA	800m.fbmy5635_rel_202210112144.cy10a_bee
75410	0	100	15.8	30.7	11.0	0.001	0.214	0.000	0.150	314	11.7	0.004	12	51.0	51.7	8.8	0.007	NA	NA	800m.fbmy5635_rel_202302162102.cy10a_bee
75868	0	101	15.9	30.4	11.1	0.001	0.214	0.000	0.150	293	11.7	0.004	12	51.0	51.7	8.8	0.008	NA	NA	800m.fbmy5635_rel_202304122154.cy10a_bee
76280	0	101	15.9	31.1	11.1	0.001	0.214	0.000	0.149	295	11.7	0.004	12	51.0	51.7	8.8	0.006	NA	NA	800m.fbmy5635_rel_202305292102.cy10a_bee
75925	0	101	15.9	30.1	11.1	0.001	0.214	0.000	0.150	298	11.7	0.004	12	51.0	51.7	8.8	0.007	NA	NA	800m.fbmy5635_rel_20230529_832.cy10a_bee
75846	0	101	15.9	30.8	11.1	0.001	0.214	0.000	0.150	297	11.7	0.004	12	51.0	51.7	8.8	0.008	NA	NA	800m.fbmy5635_rel_20230529_843.cy10a_bee
75695	0	101	15.8	30.1	11.1	0.001	0.214	0.000	0.150	295	11.7	0.004	12	51.0	51.7	8.8	0.007	NA	NA	800m.fbmy5635_rel_20230529_850.cy10a_bee
l.i1
l.i1: continue load after secondary indexes created. Graphs for performance per 1-second interval are here.
Average throughput:
Insert response time histogram: each cell has the percentage of responses that take <= the time in the header and max is the max response time in seconds. For the max column values in the top 25% of the range have a red background and in the bottom 25% of the range have a green background. The red background is not used when the min value is within 80% of the max value.
| dbms | 256us | 1ms | 4ms | 16ms | 64ms | 256ms | 1s | 4s | 16s | gt | max |
|---|---|---|---|---|---|---|---|---|---|---|---|
| fbmy5635_rel_202104072149.cy10a_bee | 99.773 | 0.222 | 0.004 | 0.001 | 0.122 | ||||||
| fbmy5635_rel_202203072101.cy10a_bee | 99.781 | 0.212 | 0.005 | 0.001 | 0.107 | ||||||
| fbmy5635_rel_202205192101.cy10a_bee | 99.781 | 0.212 | 0.005 | 0.002 | 0.119 | ||||||
| fbmy5635_rel_202208092101.cy10a_bee | 99.780 | 0.214 | 0.003 | 0.003 | 0.133 | ||||||
| fbmy5635_rel_202210112144.cy10a_bee | 99.771 | 0.221 | 0.005 | 0.003 | 0.133 | ||||||
| fbmy5635_rel_202302162102.cy10a_bee | 99.781 | 0.212 | 0.005 | 0.002 | 0.204 | ||||||
| fbmy5635_rel_202304122154.cy10a_bee | 99.781 | 0.213 | 0.005 | 0.002 | 0.120 | ||||||
| fbmy5635_rel_202305292102.cy10a_bee | 99.770 | 0.223 | 0.006 | 0.001 | 0.108 | ||||||
| fbmy5635_rel_20230529_832.cy10a_bee | 99.780 | 0.215 | 0.004 | 0.001 | 0.097 | ||||||
| fbmy5635_rel_20230529_843.cy10a_bee | 99.773 | 0.221 | 0.005 | 0.001 | 0.099 | ||||||
| fbmy5635_rel_20230529_850.cy10a_bee | 99.762 | 0.232 | 0.004 | 0.001 | 0.109 |
Delete response time histogram: each cell has the percentage of responses that take <= the time in the header and max is the max response time in seconds. For the max column values in the top 25% of the range have a red background and in the bottom 25% of the range have a green background. The red background is not used when the min value is within 80% of the max value.
| dbms | 256us | 1ms | 4ms | 16ms | 64ms | 256ms | 1s | 4s | 16s | gt | max |
|---|---|---|---|---|---|---|---|---|---|---|---|
| fbmy5635_rel_202104072149.cy10a_bee | 99.740 | 0.251 | 0.008 | 0.001 | 0.121 | ||||||
| fbmy5635_rel_202203072101.cy10a_bee | 99.711 | 0.277 | 0.010 | 0.002 | 0.109 | ||||||
| fbmy5635_rel_202205192101.cy10a_bee | 99.693 | 0.294 | 0.011 | 0.002 | 0.120 | ||||||
| fbmy5635_rel_202208092101.cy10a_bee | 99.689 | 0.299 | 0.009 | 0.003 | 0.133 | ||||||
| fbmy5635_rel_202210112144.cy10a_bee | 99.705 | 0.282 | 0.010 | 0.003 | 0.134 | ||||||
| fbmy5635_rel_202302162102.cy10a_bee | 99.708 | 0.282 | 0.009 | 0.002 | 0.203 | ||||||
| fbmy5635_rel_202304122154.cy10a_bee | 99.711 | 0.278 | 0.009 | 0.002 | 0.119 | ||||||
| fbmy5635_rel_202305292102.cy10a_bee | 99.720 | 0.270 | 0.009 | 0.001 | 0.107 | ||||||
| fbmy5635_rel_20230529_832.cy10a_bee | 99.731 | 0.261 | 0.007 | 0.001 | 0.097 | ||||||
| fbmy5635_rel_20230529_843.cy10a_bee | 99.716 | 0.275 | 0.008 | 0.001 | 0.098 | ||||||
| fbmy5635_rel_20230529_850.cy10a_bee | 99.718 | 0.273 | 0.007 | 0.002 | 0.113 |
Performance metrics for the DBMS listed above. Some are normalized by throughput, others are not. Legend for results is here.
ips	qps	rps	rmbps	wps	wmbps	rpq	rkbpq	wpi	wkbpi	csps	cpups	cspq	cpupq	dbgb1	dbgb2	rss	maxop	p50	p99	tag
26490	0	457	36.0	194.0	73.1	0.017	1.390	0.007	2.825	11761	54.1	0.444	163	58.8	60.0	8.6	0.122	26421	23424	800m.fbmy5635_rel_202104072149.cy10a_bee
26042	0	434	33.7	188.8	71.6	0.017	1.325	0.007	2.815	11624	53.5	0.446	164	57.3	57.3	8.6	0.107	26021	22925	800m.fbmy5635_rel_202203072101.cy10a_bee
25374	0	438	34.7	187.7	71.6	0.017	1.399	0.007	2.889	11365	53.9	0.448	170	58.2	58.2	8.6	0.119	25382	22236	800m.fbmy5635_rel_202205192101.cy10a_bee
25471	0	440	34.6	192.7	72.1	0.017	1.393	0.008	2.897	11423	53.8	0.448	169	57.4	57.4	8.6	0.133	25472	22175	800m.fbmy5635_rel_202208092101.cy10a_bee
25452	0	432	33.9	188.4	69.9	0.017	1.365	0.007	2.813	11374	53.7	0.447	169	57.8	57.8	8.6	0.133	25471	22375	800m.fbmy5635_rel_202210112144.cy10a_bee
25342	0	376	26.9	163.0	60.7	0.015	1.088	0.006	2.454	11234	53.4	0.443	169	56.8	56.9	8.6	0.204	25322	21685	800m.fbmy5635_rel_202302162102.cy10a_bee
25413	0	366	25.6	158.2	60.2	0.014	1.033	0.006	2.425	11294	52.7	0.444	166	57.2	57.2	8.6	0.120	25471	21776	800m.fbmy5635_rel_202304122154.cy10a_bee
25523	0	378	27.0	159.5	60.0	0.015	1.084	0.006	2.409	11300	53.5	0.443	168	57.4	57.5	8.6	0.108	25535	21876	800m.fbmy5635_rel_202305292102.cy10a_bee
25291	0	376	26.9	161.2	60.0	0.015	1.087	0.006	2.429	11186	53.6	0.442	170	56.7	56.7	8.6	0.097	25271	21726	800m.fbmy5635_rel_20230529_832.cy10a_bee
24789	0	365	25.9	155.9	58.8	0.015	1.070	0.006	2.431	10981	54.1	0.443	175	57.9	57.9	8.6	0.099	24732	21237	800m.fbmy5635_rel_20230529_843.cy10a_bee
24845	0	4195	27.6	160.6	59.1	0.169	1.136	0.006	2.437	18358	52.8	0.739	170	56.8	56.8	8.7	0.109	24822	21237	800m.fbmy5635_rel_20230529_850.cy10a_bee
q100.1
q100.1: range queries with 100 insert/s per client. Graphs for performance per 1-second interval are here.
Average throughput:
Query response time histogram: each cell has the percentage of responses that take <= the time in the header and max is the max response time in seconds. For max values in the top 25% of the range have a red background and in the bottom 25% of the range have a green background. The red background is not used when the min value is within 80% of the max value.
| dbms | 256us | 1ms | 4ms | 16ms | 64ms | 256ms | 1s | 4s | 16s | gt | max |
|---|---|---|---|---|---|---|---|---|---|---|---|
| fbmy5635_rel_202104072149.cy10a_bee | 3.286 | 95.053 | 1.649 | 0.011 | 0.001 | 0.041 | |||||
| fbmy5635_rel_202203072101.cy10a_bee | 2.092 | 95.175 | 2.722 | 0.011 | nonzero | 0.049 | |||||
| fbmy5635_rel_202205192101.cy10a_bee | 1.570 | 95.806 | 2.604 | 0.019 | nonzero | 0.049 | |||||
| fbmy5635_rel_202208092101.cy10a_bee | 2.029 | 95.631 | 2.328 | 0.012 | nonzero | 0.054 | |||||
| fbmy5635_rel_202210112144.cy10a_bee | 2.011 | 95.126 | 2.844 | 0.018 | 0.001 | 0.057 | |||||
| fbmy5635_rel_202302162102.cy10a_bee | 1.989 | 92.655 | 5.344 | 0.012 | nonzero | 0.046 | |||||
| fbmy5635_rel_202304122154.cy10a_bee | 2.010 | 91.056 | 6.923 | 0.011 | 0.001 | 0.058 | |||||
| fbmy5635_rel_202305292102.cy10a_bee | 1.712 | 92.074 | 6.205 | 0.009 | 0.001 | 0.048 | |||||
| fbmy5635_rel_20230529_832.cy10a_bee | 2.755 | 92.596 | 4.642 | 0.007 | nonzero | nonzero | 0.074 | ||||
| fbmy5635_rel_20230529_843.cy10a_bee | 1.392 | 93.080 | 5.518 | 0.010 | nonzero | 0.047 | |||||
| fbmy5635_rel_20230529_850.cy10a_bee | 2.498 | 91.798 | 5.690 | 0.013 | nonzero | 0.050 |
Insert response time histogram: each cell has the percentage of responses that take <= the time in the header and max is the max response time in seconds. For max values in the top 25% of the range have a red background and in the bottom 25% of the range have a green background. The red background is not used when the min value is within 80% of the max value.
| dbms | 256us | 1ms | 4ms | 16ms | 64ms | 256ms | 1s | 4s | 16s | gt | max |
|---|---|---|---|---|---|---|---|---|---|---|---|
| fbmy5635_rel_202104072149.cy10a_bee | 99.361 | 0.639 | 0.014 | ||||||||
| fbmy5635_rel_202203072101.cy10a_bee | 99.417 | 0.569 | 0.014 | 0.019 | |||||||
| fbmy5635_rel_202205192101.cy10a_bee | 99.361 | 0.625 | 0.014 | 0.016 | |||||||
| fbmy5635_rel_202208092101.cy10a_bee | 99.361 | 0.639 | 0.015 | ||||||||
| fbmy5635_rel_202210112144.cy10a_bee | 99.389 | 0.611 | 0.015 | ||||||||
| fbmy5635_rel_202302162102.cy10a_bee | 99.403 | 0.569 | 0.028 | 0.047 | |||||||
| fbmy5635_rel_202304122154.cy10a_bee | 99.403 | 0.583 | 0.014 | 0.016 | |||||||
| fbmy5635_rel_202305292102.cy10a_bee | 99.403 | 0.597 | 0.014 | ||||||||
| fbmy5635_rel_20230529_832.cy10a_bee | 99.208 | 0.792 | 0.014 | ||||||||
| fbmy5635_rel_20230529_843.cy10a_bee | 99.458 | 0.528 | 0.014 | 0.017 | |||||||
| fbmy5635_rel_20230529_850.cy10a_bee | 99.306 | 0.681 | 0.014 | 0.018 |
Delete response time histogram: each cell has the percentage of responses that take <= the time in the header and max is the max response time in seconds. For max values in the top 25% of the range have a red background and in the bottom 25% of the range have a green background. The red background is not used when the min value is within 80% of the max value.
| dbms | 256us | 1ms | 4ms | 16ms | 64ms | 256ms | 1s | 4s | 16s | gt | max |
|---|---|---|---|---|---|---|---|---|---|---|---|
| fbmy5635_rel_202104072149.cy10a_bee | 88.208 | 11.625 | 0.167 | 0.022 | |||||||
| fbmy5635_rel_202203072101.cy10a_bee | 89.514 | 10.431 | 0.056 | 0.018 | |||||||
| fbmy5635_rel_202205192101.cy10a_bee | 86.278 | 13.472 | 0.250 | 0.048 | |||||||
| fbmy5635_rel_202208092101.cy10a_bee | 97.458 | 2.542 | 0.015 | ||||||||
| fbmy5635_rel_202210112144.cy10a_bee | 86.667 | 13.167 | 0.167 | 0.021 | |||||||
| fbmy5635_rel_202302162102.cy10a_bee | 87.361 | 12.458 | 0.181 | 0.047 | |||||||
| fbmy5635_rel_202304122154.cy10a_bee | 86.806 | 12.986 | 0.208 | 0.022 | |||||||
| fbmy5635_rel_202305292102.cy10a_bee | 90.972 | 8.958 | 0.069 | 0.022 | |||||||
| fbmy5635_rel_20230529_832.cy10a_bee | 93.125 | 6.806 | 0.069 | 0.022 | |||||||
| fbmy5635_rel_20230529_843.cy10a_bee | 99.347 | 0.653 | 0.015 | ||||||||
| fbmy5635_rel_20230529_850.cy10a_bee | 88.639 | 11.139 | 0.222 | 0.026 |
Performance metrics for the DBMS listed above. Some are normalized by throughput, others are not. Legend for results is here.
ips	qps	rps	rmbps	wps	wmbps	rpq	rkbpq	wpi	wkbpi	csps	cpups	cspq	cpupq	dbgb1	dbgb2	rss	maxop	p50	p99	tag
100	2068	352	5.5	10.1	2.5	0.170	2.738	0.101	25.718	8571	13.7	4.145	530	55.7	57.0	9.7	0.041	2062	1295	800m.fbmy5635_rel_202104072149.cy10a_bee
100	1969	318	5.7	9.8	2.4	0.162	2.974	0.098	24.968	8145	13.7	4.137	557	55.7	55.8	9.7	0.049	1997	1279	800m.fbmy5635_rel_202203072101.cy10a_bee
100	1946	291	5.4	10.6	2.7	0.150	2.827	0.106	27.754	8057	13.8	4.140	567	55.6	55.7	9.7	0.049	1934	1294	800m.fbmy5635_rel_202205192101.cy10a_bee
100	2023	270	5.0	11.7	2.4	0.133	2.550	0.118	24.604	8346	13.6	4.125	538	55.6	55.7	9.9	0.054	2061	1295	800m.fbmy5635_rel_202208092101.cy10a_bee
100	1978	281	5.0	12.0	2.5	0.142	2.598	0.120	25.805	8211	13.6	4.151	550	55.7	55.8	9.7	0.057	1983	1295	800m.fbmy5635_rel_202210112144.cy10a_bee
100	1970	268	4.1	8.5	2.0	0.136	2.145	0.086	20.555	8149	13.2	4.136	536	55.7	55.8	9.8	0.046	1982	1263	800m.fbmy5635_rel_202302162102.cy10a_bee
100	1895	268	4.1	8.4	2.0	0.141	2.239	0.084	20.254	7848	13.2	4.141	557	56.0	56.1	9.3	0.058	1886	1247	800m.fbmy5635_rel_202304122154.cy10a_bee
100	1925	326	5.3	9.4	2.3	0.169	2.803	0.094	23.321	8020	13.5	4.166	561	55.7	55.8	10.0	0.048	1933	1263	800m.fbmy5635_rel_202305292102.cy10a_bee
100	1996	298	4.6	8.5	2.0	0.150	2.345	0.085	20.146	8260	13.3	4.137	533	55.7	55.8	9.9	0.074	2029	1247	800m.fbmy5635_rel_20230529_832.cy10a_bee
100	1939	279	4.3	8.2	1.8	0.144	2.272	0.082	18.513	8015	13.3	4.133	549	55.7	55.8	9.7	0.047	1966	1247	800m.fbmy5635_rel_20230529_843.cy10a_bee
100	1951	539	4.8	9.0	2.1	0.276	2.497	0.090	21.739	8478	13.4	4.346	550	55.7	55.8	9.7	0.050	1981	1310	800m.fbmy5635_rel_20230529_850.cy10a_bee
q500.1
q500.1: range queries with 500 insert/s per client. Graphs for performance per 1-second interval are here.
Average throughput:
Query response time histogram: each cell has the percentage of responses that take <= the time in the header and max is the max response time in seconds. For max values in the top 25% of the range have a red background and in the bottom 25% of the range have a green background. The red background is not used when the min value is within 80% of the max value.
| dbms | 256us | 1ms | 4ms | 16ms | 64ms | 256ms | 1s | 4s | 16s | gt | max |
|---|---|---|---|---|---|---|---|---|---|---|---|
| fbmy5635_rel_202104072149.cy10a_bee | 1.462 | 97.317 | 1.214 | 0.007 | nonzero | 0.037 | |||||
| fbmy5635_rel_202203072101.cy10a_bee | 1.338 | 96.167 | 2.489 | 0.005 | nonzero | 0.043 | |||||
| fbmy5635_rel_202205192101.cy10a_bee | 0.833 | 97.313 | 1.839 | 0.015 | nonzero | 0.036 | |||||
| fbmy5635_rel_202208092101.cy10a_bee | 0.698 | 96.444 | 2.843 | 0.016 | nonzero | 0.021 | |||||
| fbmy5635_rel_202210112144.cy10a_bee | 0.741 | 95.989 | 3.261 | 0.009 | nonzero | 0.044 | |||||
| fbmy5635_rel_202302162102.cy10a_bee | 1.351 | 93.409 | 5.229 | 0.011 | nonzero | 0.036 | |||||
| fbmy5635_rel_202304122154.cy10a_bee | 1.084 | 92.590 | 6.315 | 0.011 | nonzero | 0.034 | |||||
| fbmy5635_rel_202305292102.cy10a_bee | 1.066 | 92.757 | 6.163 | 0.014 | 0.011 | ||||||
| fbmy5635_rel_20230529_832.cy10a_bee | 1.274 | 93.278 | 5.429 | 0.019 | 0.011 | ||||||
| fbmy5635_rel_20230529_843.cy10a_bee | 0.902 | 92.321 | 6.763 | 0.015 | nonzero | 0.041 | |||||
| fbmy5635_rel_20230529_850.cy10a_bee | 1.183 | 92.341 | 6.463 | 0.014 | nonzero | 0.024 |
Insert response time histogram: each cell has the percentage of responses that take <= the time in the header and max is the max response time in seconds. For max values in the top 25% of the range have a red background and in the bottom 25% of the range have a green background. The red background is not used when the min value is within 80% of the max value.
| dbms | 256us | 1ms | 4ms | 16ms | 64ms | 256ms | 1s | 4s | 16s | gt | max |
|---|---|---|---|---|---|---|---|---|---|---|---|
| fbmy5635_rel_202104072149.cy10a_bee | 99.692 | 0.306 | 0.003 | 0.046 | |||||||
| fbmy5635_rel_202203072101.cy10a_bee | 99.656 | 0.342 | 0.003 | 0.057 | |||||||
| fbmy5635_rel_202205192101.cy10a_bee | 99.667 | 0.331 | 0.003 | 0.047 | |||||||
| fbmy5635_rel_202208092101.cy10a_bee | 99.653 | 0.344 | 0.003 | 0.057 | |||||||
| fbmy5635_rel_202210112144.cy10a_bee | 99.667 | 0.328 | 0.006 | 0.048 | |||||||
| fbmy5635_rel_202302162102.cy10a_bee | 99.675 | 0.322 | 0.003 | 0.051 | |||||||
| fbmy5635_rel_202304122154.cy10a_bee | 99.683 | 0.314 | 0.003 | 0.052 | |||||||
| fbmy5635_rel_202305292102.cy10a_bee | 99.650 | 0.347 | 0.003 | 0.045 | |||||||
| fbmy5635_rel_20230529_832.cy10a_bee | 99.672 | 0.325 | 0.003 | 0.051 | |||||||
| fbmy5635_rel_20230529_843.cy10a_bee | 99.686 | 0.314 | 0.014 | ||||||||
| fbmy5635_rel_20230529_850.cy10a_bee | 99.669 | 0.328 | 0.003 | 0.046 |
Delete response time histogram: each cell has the percentage of responses that take <= the time in the header and max is the max response time in seconds. For max values in the top 25% of the range have a red background and in the bottom 25% of the range have a green background. The red background is not used when the min value is within 80% of the max value.
| dbms | 256us | 1ms | 4ms | 16ms | 64ms | 256ms | 1s | 4s | 16s | gt | max |
|---|---|---|---|---|---|---|---|---|---|---|---|
| fbmy5635_rel_202104072149.cy10a_bee | 98.831 | 1.142 | 0.028 | 0.047 | |||||||
| fbmy5635_rel_202203072101.cy10a_bee | 98.431 | 1.556 | 0.014 | 0.056 | |||||||
| fbmy5635_rel_202205192101.cy10a_bee | 97.494 | 2.469 | 0.036 | 0.047 | |||||||
| fbmy5635_rel_202208092101.cy10a_bee | 98.036 | 1.903 | 0.061 | 0.057 | |||||||
| fbmy5635_rel_202210112144.cy10a_bee | 98.733 | 1.250 | 0.017 | 0.047 | |||||||
| fbmy5635_rel_202302162102.cy10a_bee | 98.233 | 1.747 | 0.019 | 0.050 | |||||||
| fbmy5635_rel_202304122154.cy10a_bee | 97.797 | 2.167 | 0.036 | 0.052 | |||||||
| fbmy5635_rel_202305292102.cy10a_bee | 97.706 | 2.253 | 0.042 | 0.046 | |||||||
| fbmy5635_rel_20230529_832.cy10a_bee | 97.236 | 2.742 | 0.022 | 0.052 | |||||||
| fbmy5635_rel_20230529_843.cy10a_bee | 97.039 | 2.944 | 0.017 | 0.044 | |||||||
| fbmy5635_rel_20230529_850.cy10a_bee | 97.361 | 2.614 | 0.025 | 0.020 |
Performance metrics for the DBMS listed above. Some are normalized by throughput, others are not. Legend for results is here.
ips	qps	rps	rmbps	wps	wmbps	rpq	rkbpq	wpi	wkbpi	csps	cpups	cspq	cpupq	dbgb1	dbgb2	rss	maxop	p50	p99	tag
499	2071	108	1.7	7.6	1.6	0.052	0.864	0.015	3.302	8219	13.2	3.969	510	55.7	57.5	8.9	0.037	2046	1870	800m.fbmy5635_rel_202104072149.cy10a_bee
499	2006	80	1.6	7.8	1.7	0.040	0.818	0.016	3.587	7971	13.4	3.973	534	55.7	56.2	9.2	0.043	2014	1759	800m.fbmy5635_rel_202203072101.cy10a_bee
499	1987	53	1.3	7.1	1.5	0.027	0.668	0.014	3.084	7892	13.2	3.972	531	55.7	56.2	9.0	0.036	1951	1791	800m.fbmy5635_rel_202205192101.cy10a_bee
499	1986	35	0.8	9.5	1.7	0.017	0.422	0.019	3.431	7899	13.2	3.978	532	55.6	56.1	9.1	0.021	1966	1806	800m.fbmy5635_rel_202208092101.cy10a_bee
499	1965	54	1.3	9.2	1.5	0.027	0.677	0.018	3.166	7820	13.3	3.980	542	55.7	56.2	9.0	0.044	1934	1774	800m.fbmy5635_rel_202210112144.cy10a_bee
499	1982	45	1.1	7.1	1.5	0.023	0.581	0.014	3.104	7877	13.5	3.974	545	55.7	56.2	9.1	0.036	1966	1758	800m.fbmy5635_rel_202302162102.cy10a_bee
499	1934	52	1.1	7.0	1.5	0.027	0.603	0.014	3.039	7684	13.3	3.974	550	55.7	56.2	8.9	0.034	1918	1710	800m.fbmy5635_rel_202304122154.cy10a_bee
499	1946	41	0.9	6.7	1.3	0.021	0.461	0.013	2.748	7739	13.3	3.977	547	55.7	56.2	9.3	0.011	1917	1742	800m.fbmy5635_rel_202305292102.cy10a_bee
499	1975	65	1.5	7.3	1.6	0.033	0.758	0.015	3.368	7852	13.5	3.976	547	55.6	56.1	9.5	0.011	1950	1758	800m.fbmy5635_rel_20230529_832.cy10a_bee
499	1921	37	0.9	6.4	1.3	0.019	0.466	0.013	2.629	7635	13.3	3.974	554	55.8	56.3	9.3	0.041	1886	1726	800m.fbmy5635_rel_20230529_843.cy10a_bee
499	1943	129	1.2	7.0	1.4	0.066	0.610	0.014	2.944	7829	13.4	4.030	552	55.8	56.2	9.0	0.024	1918	1710	800m.fbmy5635_rel_20230529_850.cy10a_bee
q1000.1
q1000.1: range queries with 1000 insert/s per client. Graphs for performance per 1-second interval are here.
Average throughput:
Query response time histogram: each cell has the percentage of responses that take <= the time in the header and max is the max response time in seconds. For max values in the top 25% of the range have a red background and in the bottom 25% of the range have a green background. The red background is not used when the min value is within 80% of the max value.
| dbms | 256us | 1ms | 4ms | 16ms | 64ms | 256ms | 1s | 4s | 16s | gt | max |
|---|---|---|---|---|---|---|---|---|---|---|---|
| fbmy5635_rel_202104072149.cy10a_bee | 1.366 | 97.045 | 1.586 | 0.003 | nonzero | 0.062 | |||||
| fbmy5635_rel_202203072101.cy10a_bee | 1.385 | 95.459 | 3.151 | 0.005 | nonzero | 0.036 | |||||
| fbmy5635_rel_202205192101.cy10a_bee | 1.220 | 97.132 | 1.645 | 0.003 | nonzero | 0.038 | |||||
| fbmy5635_rel_202208092101.cy10a_bee | 0.965 | 95.942 | 3.082 | 0.010 | nonzero | 0.039 | |||||
| fbmy5635_rel_202210112144.cy10a_bee | 0.913 | 95.543 | 3.539 | 0.004 | nonzero | 0.053 | |||||
| fbmy5635_rel_202302162102.cy10a_bee | 1.251 | 93.386 | 5.346 | 0.017 | nonzero | 0.041 | |||||
| fbmy5635_rel_202304122154.cy10a_bee | 0.929 | 93.433 | 5.629 | 0.009 | nonzero | 0.037 | |||||
| fbmy5635_rel_202305292102.cy10a_bee | 1.311 | 93.651 | 5.028 | 0.010 | nonzero | 0.037 | |||||
| fbmy5635_rel_20230529_832.cy10a_bee | 0.833 | 94.040 | 5.111 | 0.016 | nonzero | 0.043 | |||||
| fbmy5635_rel_20230529_843.cy10a_bee | 1.032 | 93.071 | 5.885 | 0.012 | nonzero | 0.029 | |||||
| fbmy5635_rel_20230529_850.cy10a_bee | 1.073 | 92.858 | 6.058 | 0.010 | nonzero | 0.061 |
Insert response time histogram: each cell has the percentage of responses that take <= the time in the header and max is the max response time in seconds. For max values in the top 25% of the range have a red background and in the bottom 25% of the range have a green background. The red background is not used when the min value is within 80% of the max value.
| dbms | 256us | 1ms | 4ms | 16ms | 64ms | 256ms | 1s | 4s | 16s | gt | max |
|---|---|---|---|---|---|---|---|---|---|---|---|
| fbmy5635_rel_202104072149.cy10a_bee | 99.708 | 0.289 | 0.003 | 0.047 | |||||||
| fbmy5635_rel_202203072101.cy10a_bee | 99.701 | 0.296 | 0.003 | 0.046 | |||||||
| fbmy5635_rel_202205192101.cy10a_bee | 99.690 | 0.306 | 0.004 | 0.048 | |||||||
| fbmy5635_rel_202208092101.cy10a_bee | 99.681 | 0.317 | 0.003 | 0.053 | |||||||
| fbmy5635_rel_202210112144.cy10a_bee | 99.689 | 0.308 | 0.003 | 0.051 | |||||||
| fbmy5635_rel_202302162102.cy10a_bee | 99.681 | 0.317 | 0.003 | 0.045 | |||||||
| fbmy5635_rel_202304122154.cy10a_bee | 99.690 | 0.307 | 0.003 | 0.047 | |||||||
| fbmy5635_rel_202305292102.cy10a_bee | 99.665 | 0.332 | 0.003 | 0.044 | |||||||
| fbmy5635_rel_20230529_832.cy10a_bee | 99.685 | 0.311 | 0.004 | 0.042 | |||||||
| fbmy5635_rel_20230529_843.cy10a_bee | 99.688 | 0.308 | 0.004 | 0.048 | |||||||
| fbmy5635_rel_20230529_850.cy10a_bee | 99.681 | 0.315 | 0.004 | 0.046 |
Delete response time histogram: each cell has the percentage of responses that take <= the time in the header and max is the max response time in seconds. For max values in the top 25% of the range have a red background and in the bottom 25% of the range have a green background. The red background is not used when the min value is within 80% of the max value.
| dbms | 256us | 1ms | 4ms | 16ms | 64ms | 256ms | 1s | 4s | 16s | gt | max |
|---|---|---|---|---|---|---|---|---|---|---|---|
| fbmy5635_rel_202104072149.cy10a_bee | 99.617 | 0.379 | 0.003 | 0.001 | 0.071 | ||||||
| fbmy5635_rel_202203072101.cy10a_bee | 99.636 | 0.358 | 0.006 | 0.047 | |||||||
| fbmy5635_rel_202205192101.cy10a_bee | 99.579 | 0.413 | 0.008 | 0.055 | |||||||
| fbmy5635_rel_202208092101.cy10a_bee | 99.333 | 0.660 | 0.007 | 0.052 | |||||||
| fbmy5635_rel_202210112144.cy10a_bee | 99.576 | 0.418 | 0.006 | 0.051 | |||||||
| fbmy5635_rel_202302162102.cy10a_bee | 99.226 | 0.762 | 0.011 | 0.046 | |||||||
| fbmy5635_rel_202304122154.cy10a_bee | 99.296 | 0.699 | 0.006 | 0.047 | |||||||
| fbmy5635_rel_202305292102.cy10a_bee | 99.367 | 0.617 | 0.017 | 0.046 | |||||||
| fbmy5635_rel_20230529_832.cy10a_bee | 99.024 | 0.967 | 0.010 | 0.043 | |||||||
| fbmy5635_rel_20230529_843.cy10a_bee | 99.303 | 0.688 | 0.010 | 0.048 | |||||||
| fbmy5635_rel_20230529_850.cy10a_bee | 99.362 | 0.631 | 0.007 | 0.047 |
Performance metrics for the DBMS listed above. Some are normalized by throughput, others are not. Legend for results is here.
ips	qps	rps	rmbps	wps	wmbps	rpq	rkbpq	wpi	wkbpi	csps	cpups	cspq	cpupq	dbgb1	dbgb2	rss	maxop	p50	p99	tag
998	2070	180	3.3	13.3	3.6	0.087	1.653	0.013	3.699	8453	14.8	4.083	572	55.7	56.3	8.9	0.062	2046	1902	800m.fbmy5635_rel_202104072149.cy10a_bee
999	2004	127	3.1	12.1	3.3	0.063	1.568	0.012	3.401	8183	14.8	4.083	591	55.7	57.0	8.8	0.036	2014	1758	800m.fbmy5635_rel_202203072101.cy10a_bee
998	2059	112	2.9	13.9	4.0	0.054	1.438	0.014	4.071	8405	15.1	4.081	587	55.6	56.8	8.8	0.038	2062	1822	800m.fbmy5635_rel_202205192101.cy10a_bee
999	2007	79	2.3	14.7	3.6	0.040	1.167	0.015	3.646	8199	14.8	4.085	590	55.6	56.9	8.9	0.039	1967	1806	800m.fbmy5635_rel_202208092101.cy10a_bee
999	1987	114	3.1	15.5	3.8	0.057	1.578	0.016	3.883	8133	15.1	4.094	608	55.6	56.9	8.9	0.053	1966	1774	800m.fbmy5635_rel_202210112144.cy10a_bee
998	1955	61	1.5	10.5	2.8	0.031	0.785	0.010	2.862	8010	14.7	4.098	602	55.7	57.0	8.8	0.041	1902	1742	800m.fbmy5635_rel_202302162102.cy10a_bee
999	1948	70	1.6	10.8	2.9	0.036	0.815	0.011	2.984	7950	14.7	4.081	604	55.7	57.0	8.8	0.037	1918	1742	800m.fbmy5635_rel_202304122154.cy10a_bee
998	1986	80	1.8	10.8	2.9	0.040	0.954	0.011	2.932	8109	14.6	4.082	588	55.8	57.0	8.9	0.037	1966	1758	800m.fbmy5635_rel_202305292102.cy10a_bee
999	1965	69	1.7	11.3	3.1	0.035	0.874	0.011	3.180	8020	14.8	4.081	602	55.7	57.0	8.8	0.043	1934	1758	800m.fbmy5635_rel_20230529_832.cy10a_bee
999	1940	73	1.7	10.9	2.9	0.038	0.902	0.011	3.011	7922	14.8	4.084	610	55.8	57.0	8.8	0.029	1887	1710	800m.fbmy5635_rel_20230529_843.cy10a_bee
998	1962	199	1.8	10.8	2.9	0.101	0.921	0.011	2.942	8193	14.6	4.175	595	55.8	57.0	8.8	0.061	1918	1742	800m.fbmy5635_rel_20230529_850.cy10a_bee
l.i0
l.i0: load without secondary indexes
Performance metrics for all DBMS, not just the ones listed above. Some are normalized by throughput, others are not. Legend for results is here.
ips	qps	rps	rmbps	wps	wmbps	rpq	rkbpq	wpi	wkbpi	csps	cpups	cspq	cpupq	dbgb1	dbgb2	rss	maxop	p50	p99	tag
81350	0	0	0.0	44.1	14.6	0.000	0.000	0.001	0.184	8090	23.5	0.099	23	25.1	26.7	1.6	0.118	81703	74301	800m.fbmy5635_rel_202104072149.cy10a_bee
78958	0	0	0.0	42.5	14.2	0.000	0.000	0.001	0.184	7839	22.9	0.099	23	25.1	25.7	1.5	0.125	79210	72716	800m.fbmy5635_rel_202203072101.cy10a_bee
76198	0	0	0.0	41.2	13.7	0.000	0.000	0.001	0.184	7557	21.5	0.099	23	25.1	25.7	1.5	0.113	76313	70320	800m.fbmy5635_rel_202205192101.cy10a_bee
76982	0	0	0.0	43.8	13.8	0.000	0.000	0.001	0.184	7651	22.2	0.099	23	25.1	25.7	1.5	0.103	77212	70519	800m.fbmy5635_rel_202208092101.cy10a_bee
77504	0	0	0.0	44.0	13.9	0.000	0.000	0.001	0.184	7697	22.4	0.099	23	25.1	25.7	1.5	0.095	77810	70722	800m.fbmy5635_rel_202210112144.cy10a_bee
78003	0	0	0.0	42.3	14.0	0.000	0.000	0.001	0.184	7751	22.9	0.099	23	25.1	25.7	1.5	0.116	78309	71822	800m.fbmy5635_rel_202302162102.cy10a_bee
76864	0	0	0.0	41.7	13.8	0.000	0.000	0.001	0.184	7630	22.2	0.099	23	25.1	25.7	1.5	0.081	77111	70819	800m.fbmy5635_rel_202304122154.cy10a_bee
76482	0	0	0.0	41.5	13.8	0.000	0.000	0.001	0.184	7590	21.9	0.099	23	25.1	25.7	1.5	0.096	76711	70619	800m.fbmy5635_rel_202305292102.cy10a_bee
75522	0	0	0.0	40.8	13.6	0.000	0.000	0.001	0.184	7503	21.1	0.099	22	25.1	25.7	1.5	0.133	75517	70122	800m.fbmy5635_rel_20230529_832.cy10a_bee
76672	0	0	0.0	41.7	13.8	0.000	0.000	0.001	0.184	7625	22.0	0.099	23	25.1	25.7	1.5	0.097	76815	71219	800m.fbmy5635_rel_20230529_843.cy10a_bee
75844	0	0	0.0	41.2	13.6	0.000	0.000	0.001	0.184	7527	21.3	0.099	22	25.1	25.7	1.5	0.085	75914	69954	800m.fbmy5635_rel_20230529_850.cy10a_bee
l.x
l.x: create secondary indexes
Performance metrics for all DBMS, not just the ones listed above. Some are normalized by throughput, others are not. Legend for results is here.
ips	qps	rps	rmbps	wps	wmbps	rpq	rkbpq	wpi	wkbpi	csps	cpups	cspq	cpupq	dbgb1	dbgb2	rss	maxop	p50	p99	tag
76135	0	102	15.9	30.7	11.1	0.001	0.214	0.000	0.150	301	11.7	0.004	12	51.0	52.6	8.8	0.007	NA	NA	800m.fbmy5635_rel_202104072149.cy10a_bee
76004	0	101	15.9	30.7	11.1	0.001	0.214	0.000	0.150	295	11.7	0.004	12	51.1	51.7	8.8	0.008	NA	NA	800m.fbmy5635_rel_202203072101.cy10a_bee
75275	0	100	15.7	30.6	11.0	0.001	0.214	0.000	0.150	291	11.7	0.004	12	51.0	51.7	8.8	0.012	NA	NA	800m.fbmy5635_rel_202205192101.cy10a_bee
75417	0	100	15.8	32.5	11.0	0.001	0.214	0.000	0.150	341	11.7	0.005	12	51.1	51.7	8.8	0.013	NA	NA	800m.fbmy5635_rel_202208092101.cy10a_bee
74986	0	100	15.7	33.3	11.0	0.001	0.214	0.000	0.150	338	11.7	0.005	12	51.1	51.7	8.8	0.007	NA	NA	800m.fbmy5635_rel_202210112144.cy10a_bee
75410	0	100	15.8	30.7	11.0	0.001	0.214	0.000	0.150	314	11.7	0.004	12	51.0	51.7	8.8	0.007	NA	NA	800m.fbmy5635_rel_202302162102.cy10a_bee
75868	0	101	15.9	30.4	11.1	0.001	0.214	0.000	0.150	293	11.7	0.004	12	51.0	51.7	8.8	0.008	NA	NA	800m.fbmy5635_rel_202304122154.cy10a_bee
76280	0	101	15.9	31.1	11.1	0.001	0.214	0.000	0.149	295	11.7	0.004	12	51.0	51.7	8.8	0.006	NA	NA	800m.fbmy5635_rel_202305292102.cy10a_bee
75925	0	101	15.9	30.1	11.1	0.001	0.214	0.000	0.150	298	11.7	0.004	12	51.0	51.7	8.8	0.007	NA	NA	800m.fbmy5635_rel_20230529_832.cy10a_bee
75846	0	101	15.9	30.8	11.1	0.001	0.214	0.000	0.150	297	11.7	0.004	12	51.0	51.7	8.8	0.008	NA	NA	800m.fbmy5635_rel_20230529_843.cy10a_bee
75695	0	101	15.8	30.1	11.1	0.001	0.214	0.000	0.150	295	11.7	0.004	12	51.0	51.7	8.8	0.007	NA	NA	800m.fbmy5635_rel_20230529_850.cy10a_bee
l.i1
l.i1: continue load after secondary indexes created
Performance metrics for all DBMS, not just the ones listed above. Some are normalized by throughput, others are not. Legend for results is here.
ips	qps	rps	rmbps	wps	wmbps	rpq	rkbpq	wpi	wkbpi	csps	cpups	cspq	cpupq	dbgb1	dbgb2	rss	maxop	p50	p99	tag
26490	0	457	36.0	194.0	73.1	0.017	1.390	0.007	2.825	11761	54.1	0.444	163	58.8	60.0	8.6	0.122	26421	23424	800m.fbmy5635_rel_202104072149.cy10a_bee
26042	0	434	33.7	188.8	71.6	0.017	1.325	0.007	2.815	11624	53.5	0.446	164	57.3	57.3	8.6	0.107	26021	22925	800m.fbmy5635_rel_202203072101.cy10a_bee
25374	0	438	34.7	187.7	71.6	0.017	1.399	0.007	2.889	11365	53.9	0.448	170	58.2	58.2	8.6	0.119	25382	22236	800m.fbmy5635_rel_202205192101.cy10a_bee
25471	0	440	34.6	192.7	72.1	0.017	1.393	0.008	2.897	11423	53.8	0.448	169	57.4	57.4	8.6	0.133	25472	22175	800m.fbmy5635_rel_202208092101.cy10a_bee
25452	0	432	33.9	188.4	69.9	0.017	1.365	0.007	2.813	11374	53.7	0.447	169	57.8	57.8	8.6	0.133	25471	22375	800m.fbmy5635_rel_202210112144.cy10a_bee
25342	0	376	26.9	163.0	60.7	0.015	1.088	0.006	2.454	11234	53.4	0.443	169	56.8	56.9	8.6	0.204	25322	21685	800m.fbmy5635_rel_202302162102.cy10a_bee
25413	0	366	25.6	158.2	60.2	0.014	1.033	0.006	2.425	11294	52.7	0.444	166	57.2	57.2	8.6	0.120	25471	21776	800m.fbmy5635_rel_202304122154.cy10a_bee
25523	0	378	27.0	159.5	60.0	0.015	1.084	0.006	2.409	11300	53.5	0.443	168	57.4	57.5	8.6	0.108	25535	21876	800m.fbmy5635_rel_202305292102.cy10a_bee
25291	0	376	26.9	161.2	60.0	0.015	1.087	0.006	2.429	11186	53.6	0.442	170	56.7	56.7	8.6	0.097	25271	21726	800m.fbmy5635_rel_20230529_832.cy10a_bee
24789	0	365	25.9	155.9	58.8	0.015	1.070	0.006	2.431	10981	54.1	0.443	175	57.9	57.9	8.6	0.099	24732	21237	800m.fbmy5635_rel_20230529_843.cy10a_bee
24845	0	4195	27.6	160.6	59.1	0.169	1.136	0.006	2.437	18358	52.8	0.739	170	56.8	56.8	8.7	0.109	24822	21237	800m.fbmy5635_rel_20230529_850.cy10a_bee
q100.1
q100.1: range queries with 100 insert/s per client
Performance metrics for all DBMS, not just the ones listed above. Some are normalized by throughput, others are not. Legend for results is here.
ips	qps	rps	rmbps	wps	wmbps	rpq	rkbpq	wpi	wkbpi	csps	cpups	cspq	cpupq	dbgb1	dbgb2	rss	maxop	p50	p99	tag
100	2068	352	5.5	10.1	2.5	0.170	2.738	0.101	25.718	8571	13.7	4.145	530	55.7	57.0	9.7	0.041	2062	1295	800m.fbmy5635_rel_202104072149.cy10a_bee
100	1969	318	5.7	9.8	2.4	0.162	2.974	0.098	24.968	8145	13.7	4.137	557	55.7	55.8	9.7	0.049	1997	1279	800m.fbmy5635_rel_202203072101.cy10a_bee
100	1946	291	5.4	10.6	2.7	0.150	2.827	0.106	27.754	8057	13.8	4.140	567	55.6	55.7	9.7	0.049	1934	1294	800m.fbmy5635_rel_202205192101.cy10a_bee
100	2023	270	5.0	11.7	2.4	0.133	2.550	0.118	24.604	8346	13.6	4.125	538	55.6	55.7	9.9	0.054	2061	1295	800m.fbmy5635_rel_202208092101.cy10a_bee
100	1978	281	5.0	12.0	2.5	0.142	2.598	0.120	25.805	8211	13.6	4.151	550	55.7	55.8	9.7	0.057	1983	1295	800m.fbmy5635_rel_202210112144.cy10a_bee
100	1970	268	4.1	8.5	2.0	0.136	2.145	0.086	20.555	8149	13.2	4.136	536	55.7	55.8	9.8	0.046	1982	1263	800m.fbmy5635_rel_202302162102.cy10a_bee
100	1895	268	4.1	8.4	2.0	0.141	2.239	0.084	20.254	7848	13.2	4.141	557	56.0	56.1	9.3	0.058	1886	1247	800m.fbmy5635_rel_202304122154.cy10a_bee
100	1925	326	5.3	9.4	2.3	0.169	2.803	0.094	23.321	8020	13.5	4.166	561	55.7	55.8	10.0	0.048	1933	1263	800m.fbmy5635_rel_202305292102.cy10a_bee
100	1996	298	4.6	8.5	2.0	0.150	2.345	0.085	20.146	8260	13.3	4.137	533	55.7	55.8	9.9	0.074	2029	1247	800m.fbmy5635_rel_20230529_832.cy10a_bee
100	1939	279	4.3	8.2	1.8	0.144	2.272	0.082	18.513	8015	13.3	4.133	549	55.7	55.8	9.7	0.047	1966	1247	800m.fbmy5635_rel_20230529_843.cy10a_bee
100	1951	539	4.8	9.0	2.1	0.276	2.497	0.090	21.739	8478	13.4	4.346	550	55.7	55.8	9.7	0.050	1981	1310	800m.fbmy5635_rel_20230529_850.cy10a_bee
q500.1
q500.1: range queries with 500 insert/s per client
Performance metrics for all DBMS, not just the ones listed above. Some are normalized by throughput, others are not. Legend for results is here.
ips	qps	rps	rmbps	wps	wmbps	rpq	rkbpq	wpi	wkbpi	csps	cpups	cspq	cpupq	dbgb1	dbgb2	rss	maxop	p50	p99	tag
499	2071	108	1.7	7.6	1.6	0.052	0.864	0.015	3.302	8219	13.2	3.969	510	55.7	57.5	8.9	0.037	2046	1870	800m.fbmy5635_rel_202104072149.cy10a_bee
499	2006	80	1.6	7.8	1.7	0.040	0.818	0.016	3.587	7971	13.4	3.973	534	55.7	56.2	9.2	0.043	2014	1759	800m.fbmy5635_rel_202203072101.cy10a_bee
499	1987	53	1.3	7.1	1.5	0.027	0.668	0.014	3.084	7892	13.2	3.972	531	55.7	56.2	9.0	0.036	1951	1791	800m.fbmy5635_rel_202205192101.cy10a_bee
499	1986	35	0.8	9.5	1.7	0.017	0.422	0.019	3.431	7899	13.2	3.978	532	55.6	56.1	9.1	0.021	1966	1806	800m.fbmy5635_rel_202208092101.cy10a_bee
499	1965	54	1.3	9.2	1.5	0.027	0.677	0.018	3.166	7820	13.3	3.980	542	55.7	56.2	9.0	0.044	1934	1774	800m.fbmy5635_rel_202210112144.cy10a_bee
499	1982	45	1.1	7.1	1.5	0.023	0.581	0.014	3.104	7877	13.5	3.974	545	55.7	56.2	9.1	0.036	1966	1758	800m.fbmy5635_rel_202302162102.cy10a_bee
499	1934	52	1.1	7.0	1.5	0.027	0.603	0.014	3.039	7684	13.3	3.974	550	55.7	56.2	8.9	0.034	1918	1710	800m.fbmy5635_rel_202304122154.cy10a_bee
499	1946	41	0.9	6.7	1.3	0.021	0.461	0.013	2.748	7739	13.3	3.977	547	55.7	56.2	9.3	0.011	1917	1742	800m.fbmy5635_rel_202305292102.cy10a_bee
499	1975	65	1.5	7.3	1.6	0.033	0.758	0.015	3.368	7852	13.5	3.976	547	55.6	56.1	9.5	0.011	1950	1758	800m.fbmy5635_rel_20230529_832.cy10a_bee
499	1921	37	0.9	6.4	1.3	0.019	0.466	0.013	2.629	7635	13.3	3.974	554	55.8	56.3	9.3	0.041	1886	1726	800m.fbmy5635_rel_20230529_843.cy10a_bee
499	1943	129	1.2	7.0	1.4	0.066	0.610	0.014	2.944	7829	13.4	4.030	552	55.8	56.2	9.0	0.024	1918	1710	800m.fbmy5635_rel_20230529_850.cy10a_bee
q1000.1
q1000.1: range queries with 1000 insert/s per client
Performance metrics for all DBMS, not just the ones listed above. Some are normalized by throughput, others are not. Legend for results is here.
ips	qps	rps	rmbps	wps	wmbps	rpq	rkbpq	wpi	wkbpi	csps	cpups	cspq	cpupq	dbgb1	dbgb2	rss	maxop	p50	p99	tag
998	2070	180	3.3	13.3	3.6	0.087	1.653	0.013	3.699	8453	14.8	4.083	572	55.7	56.3	8.9	0.062	2046	1902	800m.fbmy5635_rel_202104072149.cy10a_bee
999	2004	127	3.1	12.1	3.3	0.063	1.568	0.012	3.401	8183	14.8	4.083	591	55.7	57.0	8.8	0.036	2014	1758	800m.fbmy5635_rel_202203072101.cy10a_bee
998	2059	112	2.9	13.9	4.0	0.054	1.438	0.014	4.071	8405	15.1	4.081	587	55.6	56.8	8.8	0.038	2062	1822	800m.fbmy5635_rel_202205192101.cy10a_bee
999	2007	79	2.3	14.7	3.6	0.040	1.167	0.015	3.646	8199	14.8	4.085	590	55.6	56.9	8.9	0.039	1967	1806	800m.fbmy5635_rel_202208092101.cy10a_bee
999	1987	114	3.1	15.5	3.8	0.057	1.578	0.016	3.883	8133	15.1	4.094	608	55.6	56.9	8.9	0.053	1966	1774	800m.fbmy5635_rel_202210112144.cy10a_bee
998	1955	61	1.5	10.5	2.8	0.031	0.785	0.010	2.862	8010	14.7	4.098	602	55.7	57.0	8.8	0.041	1902	1742	800m.fbmy5635_rel_202302162102.cy10a_bee
999	1948	70	1.6	10.8	2.9	0.036	0.815	0.011	2.984	7950	14.7	4.081	604	55.7	57.0	8.8	0.037	1918	1742	800m.fbmy5635_rel_202304122154.cy10a_bee
998	1986	80	1.8	10.8	2.9	0.040	0.954	0.011	2.932	8109	14.6	4.082	588	55.8	57.0	8.9	0.037	1966	1758	800m.fbmy5635_rel_202305292102.cy10a_bee
999	1965	69	1.7	11.3	3.1	0.035	0.874	0.011	3.180	8020	14.8	4.081	602	55.7	57.0	8.8	0.043	1934	1758	800m.fbmy5635_rel_20230529_832.cy10a_bee
999	1940	73	1.7	10.9	2.9	0.038	0.902	0.011	3.011	7922	14.8	4.084	610	55.8	57.0	8.8	0.029	1887	1710	800m.fbmy5635_rel_20230529_843.cy10a_bee
998	1962	199	1.8	10.8	2.9	0.101	0.921	0.011	2.942	8193	14.6	4.175	595	55.8	57.0	8.8	0.061	1918	1742	800m.fbmy5635_rel_20230529_850.cy10a_bee
l.i0
- l.i0: load without secondary indexes
- Legend for results is here.
- Each entry lists the percentage of responses that fit in that bucket (slower than max time for previous bucket, faster than min time for next bucket).
Insert response time histogram
256us	1ms	4ms	16ms	64ms	256ms	1s	4s	16s	gt	max	tag
0.000	nonzero	99.874	0.122	0.003	0.001	0.000	0.000	0.000	0.000	0.118	fbmy5635_rel_202104072149.cy10a_bee
0.000	0.000	99.870	0.126	0.003	0.001	0.000	0.000	0.000	0.000	0.125	fbmy5635_rel_202203072101.cy10a_bee
0.000	0.000	99.866	0.130	0.003	0.001	0.000	0.000	0.000	0.000	0.113	fbmy5635_rel_202205192101.cy10a_bee
0.000	0.000	99.867	0.129	0.002	0.001	0.000	0.000	0.000	0.000	0.103	fbmy5635_rel_202208092101.cy10a_bee
0.000	0.000	99.868	0.128	0.002	0.002	0.000	0.000	0.000	0.000	0.095	fbmy5635_rel_202210112144.cy10a_bee
0.000	0.000	99.869	0.127	0.003	0.001	0.000	0.000	0.000	0.000	0.116	fbmy5635_rel_202302162102.cy10a_bee
0.000	0.000	99.867	0.129	0.003	0.001	0.000	0.000	0.000	0.000	0.081	fbmy5635_rel_202304122154.cy10a_bee
0.000	0.000	99.866	0.130	0.003	0.001	0.000	0.000	0.000	0.000	0.096	fbmy5635_rel_202305292102.cy10a_bee
0.000	0.000	99.864	0.131	0.004	nonzero	0.000	0.000	0.000	0.000	0.133	fbmy5635_rel_20230529_832.cy10a_bee
0.000	0.000	99.866	0.130	0.004	0.001	0.000	0.000	0.000	0.000	0.097	fbmy5635_rel_20230529_843.cy10a_bee
0.000	0.000	99.865	0.131	0.003	0.001	0.000	0.000	0.000	0.000	0.085	fbmy5635_rel_20230529_850.cy10a_bee
l.x
- l.x: create secondary indexes
- Legend for results is here.
- Each entry lists the percentage of responses that fit in that bucket (slower than max time for previous bucket, faster than min time for next bucket).
TODO - determine whether there is data for create index response time
l.i1
- l.i1: continue load after secondary indexes created
- Legend for results is here.
- Each entry lists the percentage of responses that fit in that bucket (slower than max time for previous bucket, faster than min time for next bucket).
Insert response time histogram
256us	1ms	4ms	16ms	64ms	256ms	1s	4s	16s	gt	max	tag
0.000	0.000	99.773	0.222	0.004	0.001	0.000	0.000	0.000	0.000	0.122	fbmy5635_rel_202104072149.cy10a_bee
0.000	0.000	99.781	0.212	0.005	0.001	0.000	0.000	0.000	0.000	0.107	fbmy5635_rel_202203072101.cy10a_bee
0.000	0.000	99.781	0.212	0.005	0.002	0.000	0.000	0.000	0.000	0.119	fbmy5635_rel_202205192101.cy10a_bee
0.000	0.000	99.780	0.214	0.003	0.003	0.000	0.000	0.000	0.000	0.133	fbmy5635_rel_202208092101.cy10a_bee
0.000	0.000	99.771	0.221	0.005	0.003	0.000	0.000	0.000	0.000	0.133	fbmy5635_rel_202210112144.cy10a_bee
0.000	0.000	99.781	0.212	0.005	0.002	0.000	0.000	0.000	0.000	0.204	fbmy5635_rel_202302162102.cy10a_bee
0.000	0.000	99.781	0.213	0.005	0.002	0.000	0.000	0.000	0.000	0.120	fbmy5635_rel_202304122154.cy10a_bee
0.000	0.000	99.770	0.223	0.006	0.001	0.000	0.000	0.000	0.000	0.108	fbmy5635_rel_202305292102.cy10a_bee
0.000	0.000	99.780	0.215	0.004	0.001	0.000	0.000	0.000	0.000	0.097	fbmy5635_rel_20230529_832.cy10a_bee
0.000	0.000	99.773	0.221	0.005	0.001	0.000	0.000	0.000	0.000	0.099	fbmy5635_rel_20230529_843.cy10a_bee
0.000	0.000	99.762	0.232	0.004	0.001	0.000	0.000	0.000	0.000	0.109	fbmy5635_rel_20230529_850.cy10a_bee
Delete response time histogram
256us	1ms	4ms	16ms	64ms	256ms	1s	4s	16s	gt	max	tag
0.000	0.000	99.740	0.251	0.008	0.001	0.000	0.000	0.000	0.000	0.121	fbmy5635_rel_202104072149.cy10a_bee
0.000	0.000	99.711	0.277	0.010	0.002	0.000	0.000	0.000	0.000	0.109	fbmy5635_rel_202203072101.cy10a_bee
0.000	0.000	99.693	0.294	0.011	0.002	0.000	0.000	0.000	0.000	0.120	fbmy5635_rel_202205192101.cy10a_bee
0.000	0.000	99.689	0.299	0.009	0.003	0.000	0.000	0.000	0.000	0.133	fbmy5635_rel_202208092101.cy10a_bee
0.000	0.000	99.705	0.282	0.010	0.003	0.000	0.000	0.000	0.000	0.134	fbmy5635_rel_202210112144.cy10a_bee
0.000	0.000	99.708	0.282	0.009	0.002	0.000	0.000	0.000	0.000	0.203	fbmy5635_rel_202302162102.cy10a_bee
0.000	0.000	99.711	0.278	0.009	0.002	0.000	0.000	0.000	0.000	0.119	fbmy5635_rel_202304122154.cy10a_bee
0.000	0.000	99.720	0.270	0.009	0.001	0.000	0.000	0.000	0.000	0.107	fbmy5635_rel_202305292102.cy10a_bee
0.000	0.000	99.731	0.261	0.007	0.001	0.000	0.000	0.000	0.000	0.097	fbmy5635_rel_20230529_832.cy10a_bee
0.000	0.000	99.716	0.275	0.008	0.001	0.000	0.000	0.000	0.000	0.098	fbmy5635_rel_20230529_843.cy10a_bee
0.000	0.000	99.718	0.273	0.007	0.002	0.000	0.000	0.000	0.000	0.113	fbmy5635_rel_20230529_850.cy10a_bee
q100.1
- q100.1: range queries with 100 insert/s per client
- Legend for results is here.
- Each entry lists the percentage of responses that fit in that bucket (slower than max time for previous bucket, faster than min time for next bucket).
Query response time histogram
256us	1ms	4ms	16ms	64ms	256ms	1s	4s	16s	gt	max	tag
3.286	95.053	1.649	0.011	0.001	0.000	0.000	0.000	0.000	0.000	0.041	fbmy5635_rel_202104072149.cy10a_bee
2.092	95.175	2.722	0.011	nonzero	0.000	0.000	0.000	0.000	0.000	0.049	fbmy5635_rel_202203072101.cy10a_bee
1.570	95.806	2.604	0.019	nonzero	0.000	0.000	0.000	0.000	0.000	0.049	fbmy5635_rel_202205192101.cy10a_bee
2.029	95.631	2.328	0.012	nonzero	0.000	0.000	0.000	0.000	0.000	0.054	fbmy5635_rel_202208092101.cy10a_bee
2.011	95.126	2.844	0.018	0.001	0.000	0.000	0.000	0.000	0.000	0.057	fbmy5635_rel_202210112144.cy10a_bee
1.989	92.655	5.344	0.012	nonzero	0.000	0.000	0.000	0.000	0.000	0.046	fbmy5635_rel_202302162102.cy10a_bee
2.010	91.056	6.923	0.011	0.001	0.000	0.000	0.000	0.000	0.000	0.058	fbmy5635_rel_202304122154.cy10a_bee
1.712	92.074	6.205	0.009	0.001	0.000	0.000	0.000	0.000	0.000	0.048	fbmy5635_rel_202305292102.cy10a_bee
2.755	92.596	4.642	0.007	nonzero	nonzero	0.000	0.000	0.000	0.000	0.074	fbmy5635_rel_20230529_832.cy10a_bee
1.392	93.080	5.518	0.010	nonzero	0.000	0.000	0.000	0.000	0.000	0.047	fbmy5635_rel_20230529_843.cy10a_bee
2.498	91.798	5.690	0.013	nonzero	0.000	0.000	0.000	0.000	0.000	0.050	fbmy5635_rel_20230529_850.cy10a_bee
Insert response time histogram
256us	1ms	4ms	16ms	64ms	256ms	1s	4s	16s	gt	max	tag
0.000	0.000	99.361	0.639	0.000	0.000	0.000	0.000	0.000	0.000	0.014	fbmy5635_rel_202104072149.cy10a_bee
0.000	0.000	99.417	0.569	0.014	0.000	0.000	0.000	0.000	0.000	0.019	fbmy5635_rel_202203072101.cy10a_bee
0.000	0.000	99.361	0.625	0.014	0.000	0.000	0.000	0.000	0.000	0.016	fbmy5635_rel_202205192101.cy10a_bee
0.000	0.000	99.361	0.639	0.000	0.000	0.000	0.000	0.000	0.000	0.015	fbmy5635_rel_202208092101.cy10a_bee
0.000	0.000	99.389	0.611	0.000	0.000	0.000	0.000	0.000	0.000	0.015	fbmy5635_rel_202210112144.cy10a_bee
0.000	0.000	99.403	0.569	0.028	0.000	0.000	0.000	0.000	0.000	0.047	fbmy5635_rel_202302162102.cy10a_bee
0.000	0.000	99.403	0.583	0.014	0.000	0.000	0.000	0.000	0.000	0.016	fbmy5635_rel_202304122154.cy10a_bee
0.000	0.000	99.403	0.597	0.000	0.000	0.000	0.000	0.000	0.000	0.014	fbmy5635_rel_202305292102.cy10a_bee
0.000	0.000	99.208	0.792	0.000	0.000	0.000	0.000	0.000	0.000	0.014	fbmy5635_rel_20230529_832.cy10a_bee
0.000	0.000	99.458	0.528	0.014	0.000	0.000	0.000	0.000	0.000	0.017	fbmy5635_rel_20230529_843.cy10a_bee
0.000	0.000	99.306	0.681	0.014	0.000	0.000	0.000	0.000	0.000	0.018	fbmy5635_rel_20230529_850.cy10a_bee
Delete response time histogram
256us	1ms	4ms	16ms	64ms	256ms	1s	4s	16s	gt	max	tag
0.000	0.000	88.208	11.625	0.167	0.000	0.000	0.000	0.000	0.000	0.022	fbmy5635_rel_202104072149.cy10a_bee
0.000	0.000	89.514	10.431	0.056	0.000	0.000	0.000	0.000	0.000	0.018	fbmy5635_rel_202203072101.cy10a_bee
0.000	0.000	86.278	13.472	0.250	0.000	0.000	0.000	0.000	0.000	0.048	fbmy5635_rel_202205192101.cy10a_bee
0.000	0.000	97.458	2.542	0.000	0.000	0.000	0.000	0.000	0.000	0.015	fbmy5635_rel_202208092101.cy10a_bee
0.000	0.000	86.667	13.167	0.167	0.000	0.000	0.000	0.000	0.000	0.021	fbmy5635_rel_202210112144.cy10a_bee
0.000	0.000	87.361	12.458	0.181	0.000	0.000	0.000	0.000	0.000	0.047	fbmy5635_rel_202302162102.cy10a_bee
0.000	0.000	86.806	12.986	0.208	0.000	0.000	0.000	0.000	0.000	0.022	fbmy5635_rel_202304122154.cy10a_bee
0.000	0.000	90.972	8.958	0.069	0.000	0.000	0.000	0.000	0.000	0.022	fbmy5635_rel_202305292102.cy10a_bee
0.000	0.000	93.125	6.806	0.069	0.000	0.000	0.000	0.000	0.000	0.022	fbmy5635_rel_20230529_832.cy10a_bee
0.000	0.000	99.347	0.653	0.000	0.000	0.000	0.000	0.000	0.000	0.015	fbmy5635_rel_20230529_843.cy10a_bee
0.000	0.000	88.639	11.139	0.222	0.000	0.000	0.000	0.000	0.000	0.026	fbmy5635_rel_20230529_850.cy10a_bee
q500.1
- q500.1: range queries with 500 insert/s per client
- Legend for results is here.
- Each entry lists the percentage of responses that fit in that bucket (slower than max time for previous bucket, faster than min time for next bucket).
Query response time histogram
256us	1ms	4ms	16ms	64ms	256ms	1s	4s	16s	gt	max	tag
1.462	97.317	1.214	0.007	nonzero	0.000	0.000	0.000	0.000	0.000	0.037	fbmy5635_rel_202104072149.cy10a_bee
1.338	96.167	2.489	0.005	nonzero	0.000	0.000	0.000	0.000	0.000	0.043	fbmy5635_rel_202203072101.cy10a_bee
0.833	97.313	1.839	0.015	nonzero	0.000	0.000	0.000	0.000	0.000	0.036	fbmy5635_rel_202205192101.cy10a_bee
0.698	96.444	2.843	0.016	nonzero	0.000	0.000	0.000	0.000	0.000	0.021	fbmy5635_rel_202208092101.cy10a_bee
0.741	95.989	3.261	0.009	nonzero	0.000	0.000	0.000	0.000	0.000	0.044	fbmy5635_rel_202210112144.cy10a_bee
1.351	93.409	5.229	0.011	nonzero	0.000	0.000	0.000	0.000	0.000	0.036	fbmy5635_rel_202302162102.cy10a_bee
1.084	92.590	6.315	0.011	nonzero	0.000	0.000	0.000	0.000	0.000	0.034	fbmy5635_rel_202304122154.cy10a_bee
1.066	92.757	6.163	0.014	0.000	0.000	0.000	0.000	0.000	0.000	0.011	fbmy5635_rel_202305292102.cy10a_bee
1.274	93.278	5.429	0.019	0.000	0.000	0.000	0.000	0.000	0.000	0.011	fbmy5635_rel_20230529_832.cy10a_bee
0.902	92.321	6.763	0.015	nonzero	0.000	0.000	0.000	0.000	0.000	0.041	fbmy5635_rel_20230529_843.cy10a_bee
1.183	92.341	6.463	0.014	nonzero	0.000	0.000	0.000	0.000	0.000	0.024	fbmy5635_rel_20230529_850.cy10a_bee
Insert response time histogram
256us	1ms	4ms	16ms	64ms	256ms	1s	4s	16s	gt	max	tag
0.000	0.000	99.692	0.306	0.003	0.000	0.000	0.000	0.000	0.000	0.046	fbmy5635_rel_202104072149.cy10a_bee
0.000	0.000	99.656	0.342	0.003	0.000	0.000	0.000	0.000	0.000	0.057	fbmy5635_rel_202203072101.cy10a_bee
0.000	0.000	99.667	0.331	0.003	0.000	0.000	0.000	0.000	0.000	0.047	fbmy5635_rel_202205192101.cy10a_bee
0.000	0.000	99.653	0.344	0.003	0.000	0.000	0.000	0.000	0.000	0.057	fbmy5635_rel_202208092101.cy10a_bee
0.000	0.000	99.667	0.328	0.006	0.000	0.000	0.000	0.000	0.000	0.048	fbmy5635_rel_202210112144.cy10a_bee
0.000	0.000	99.675	0.322	0.003	0.000	0.000	0.000	0.000	0.000	0.051	fbmy5635_rel_202302162102.cy10a_bee
0.000	0.000	99.683	0.314	0.003	0.000	0.000	0.000	0.000	0.000	0.052	fbmy5635_rel_202304122154.cy10a_bee
0.000	0.000	99.650	0.347	0.003	0.000	0.000	0.000	0.000	0.000	0.045	fbmy5635_rel_202305292102.cy10a_bee
0.000	0.000	99.672	0.325	0.003	0.000	0.000	0.000	0.000	0.000	0.051	fbmy5635_rel_20230529_832.cy10a_bee
0.000	0.000	99.686	0.314	0.000	0.000	0.000	0.000	0.000	0.000	0.014	fbmy5635_rel_20230529_843.cy10a_bee
0.000	0.000	99.669	0.328	0.003	0.000	0.000	0.000	0.000	0.000	0.046	fbmy5635_rel_20230529_850.cy10a_bee
Delete response time histogram
256us	1ms	4ms	16ms	64ms	256ms	1s	4s	16s	gt	max	tag
0.000	0.000	98.831	1.142	0.028	0.000	0.000	0.000	0.000	0.000	0.047	fbmy5635_rel_202104072149.cy10a_bee
0.000	0.000	98.431	1.556	0.014	0.000	0.000	0.000	0.000	0.000	0.056	fbmy5635_rel_202203072101.cy10a_bee
0.000	0.000	97.494	2.469	0.036	0.000	0.000	0.000	0.000	0.000	0.047	fbmy5635_rel_202205192101.cy10a_bee
0.000	0.000	98.036	1.903	0.061	0.000	0.000	0.000	0.000	0.000	0.057	fbmy5635_rel_202208092101.cy10a_bee
0.000	0.000	98.733	1.250	0.017	0.000	0.000	0.000	0.000	0.000	0.047	fbmy5635_rel_202210112144.cy10a_bee
0.000	0.000	98.233	1.747	0.019	0.000	0.000	0.000	0.000	0.000	0.050	fbmy5635_rel_202302162102.cy10a_bee
0.000	0.000	97.797	2.167	0.036	0.000	0.000	0.000	0.000	0.000	0.052	fbmy5635_rel_202304122154.cy10a_bee
0.000	0.000	97.706	2.253	0.042	0.000	0.000	0.000	0.000	0.000	0.046	fbmy5635_rel_202305292102.cy10a_bee
0.000	0.000	97.236	2.742	0.022	0.000	0.000	0.000	0.000	0.000	0.052	fbmy5635_rel_20230529_832.cy10a_bee
0.000	0.000	97.039	2.944	0.017	0.000	0.000	0.000	0.000	0.000	0.044	fbmy5635_rel_20230529_843.cy10a_bee
0.000	0.000	97.361	2.614	0.025	0.000	0.000	0.000	0.000	0.000	0.020	fbmy5635_rel_20230529_850.cy10a_bee
q1000.1
- q1000.1: range queries with 1000 insert/s per client
- Legend for results is here.
- Each entry lists the percentage of responses that fit in that bucket (slower than max time for previous bucket, faster than min time for next bucket).
Query response time histogram
256us	1ms	4ms	16ms	64ms	256ms	1s	4s	16s	gt	max	tag
1.366	97.045	1.586	0.003	nonzero	0.000	0.000	0.000	0.000	0.000	0.062	fbmy5635_rel_202104072149.cy10a_bee
1.385	95.459	3.151	0.005	nonzero	0.000	0.000	0.000	0.000	0.000	0.036	fbmy5635_rel_202203072101.cy10a_bee
1.220	97.132	1.645	0.003	nonzero	0.000	0.000	0.000	0.000	0.000	0.038	fbmy5635_rel_202205192101.cy10a_bee
0.965	95.942	3.082	0.010	nonzero	0.000	0.000	0.000	0.000	0.000	0.039	fbmy5635_rel_202208092101.cy10a_bee
0.913	95.543	3.539	0.004	nonzero	0.000	0.000	0.000	0.000	0.000	0.053	fbmy5635_rel_202210112144.cy10a_bee
1.251	93.386	5.346	0.017	nonzero	0.000	0.000	0.000	0.000	0.000	0.041	fbmy5635_rel_202302162102.cy10a_bee
0.929	93.433	5.629	0.009	nonzero	0.000	0.000	0.000	0.000	0.000	0.037	fbmy5635_rel_202304122154.cy10a_bee
1.311	93.651	5.028	0.010	nonzero	0.000	0.000	0.000	0.000	0.000	0.037	fbmy5635_rel_202305292102.cy10a_bee
0.833	94.040	5.111	0.016	nonzero	0.000	0.000	0.000	0.000	0.000	0.043	fbmy5635_rel_20230529_832.cy10a_bee
1.032	93.071	5.885	0.012	nonzero	0.000	0.000	0.000	0.000	0.000	0.029	fbmy5635_rel_20230529_843.cy10a_bee
1.073	92.858	6.058	0.010	nonzero	0.000	0.000	0.000	0.000	0.000	0.061	fbmy5635_rel_20230529_850.cy10a_bee
Insert response time histogram
256us	1ms	4ms	16ms	64ms	256ms	1s	4s	16s	gt	max	tag
0.000	0.000	99.708	0.289	0.003	0.000	0.000	0.000	0.000	0.000	0.047	fbmy5635_rel_202104072149.cy10a_bee
0.000	0.000	99.701	0.296	0.003	0.000	0.000	0.000	0.000	0.000	0.046	fbmy5635_rel_202203072101.cy10a_bee
0.000	0.000	99.690	0.306	0.004	0.000	0.000	0.000	0.000	0.000	0.048	fbmy5635_rel_202205192101.cy10a_bee
0.000	0.000	99.681	0.317	0.003	0.000	0.000	0.000	0.000	0.000	0.053	fbmy5635_rel_202208092101.cy10a_bee
0.000	0.000	99.689	0.308	0.003	0.000	0.000	0.000	0.000	0.000	0.051	fbmy5635_rel_202210112144.cy10a_bee
0.000	0.000	99.681	0.317	0.003	0.000	0.000	0.000	0.000	0.000	0.045	fbmy5635_rel_202302162102.cy10a_bee
0.000	0.000	99.690	0.307	0.003	0.000	0.000	0.000	0.000	0.000	0.047	fbmy5635_rel_202304122154.cy10a_bee
0.000	0.000	99.665	0.332	0.003	0.000	0.000	0.000	0.000	0.000	0.044	fbmy5635_rel_202305292102.cy10a_bee
0.000	0.000	99.685	0.311	0.004	0.000	0.000	0.000	0.000	0.000	0.042	fbmy5635_rel_20230529_832.cy10a_bee
0.000	0.000	99.688	0.308	0.004	0.000	0.000	0.000	0.000	0.000	0.048	fbmy5635_rel_20230529_843.cy10a_bee
0.000	0.000	99.681	0.315	0.004	0.000	0.000	0.000	0.000	0.000	0.046	fbmy5635_rel_20230529_850.cy10a_bee
Delete response time histogram
256us	1ms	4ms	16ms	64ms	256ms	1s	4s	16s	gt	max	tag
0.000	0.000	99.617	0.379	0.003	0.001	0.000	0.000	0.000	0.000	0.071	fbmy5635_rel_202104072149.cy10a_bee
0.000	0.000	99.636	0.358	0.006	0.000	0.000	0.000	0.000	0.000	0.047	fbmy5635_rel_202203072101.cy10a_bee
0.000	0.000	99.579	0.413	0.008	0.000	0.000	0.000	0.000	0.000	0.055	fbmy5635_rel_202205192101.cy10a_bee
0.000	0.000	99.333	0.660	0.007	0.000	0.000	0.000	0.000	0.000	0.052	fbmy5635_rel_202208092101.cy10a_bee
0.000	0.000	99.576	0.418	0.006	0.000	0.000	0.000	0.000	0.000	0.051	fbmy5635_rel_202210112144.cy10a_bee
0.000	0.000	99.226	0.762	0.011	0.000	0.000	0.000	0.000	0.000	0.046	fbmy5635_rel_202302162102.cy10a_bee
0.000	0.000	99.296	0.699	0.006	0.000	0.000	0.000	0.000	0.000	0.047	fbmy5635_rel_202304122154.cy10a_bee
0.000	0.000	99.367	0.617	0.017	0.000	0.000	0.000	0.000	0.000	0.046	fbmy5635_rel_202305292102.cy10a_bee
0.000	0.000	99.024	0.967	0.010	0.000	0.000	0.000	0.000	0.000	0.043	fbmy5635_rel_20230529_832.cy10a_bee
0.000	0.000	99.303	0.688	0.010	0.000	0.000	0.000	0.000	0.000	0.048	fbmy5635_rel_20230529_843.cy10a_bee
0.000	0.000	99.362	0.631	0.007	0.000	0.000	0.000	0.000	0.000	0.047	fbmy5635_rel_20230529_850.cy10a_bee