Introduction
This is a report for the insert benchmark with 4000M docs and 8 client(s). It is generated by scripts (bash, awk, sed) and Tufte might not be impressed. An overview of the insert benchmark is here and a short update is here. Below, by DBMS, I mean DBMS+version.config. An example is my8020.c10b40 where my means MySQL, 8020 is version 8.0.20 and c10b40 is the name for the configuration file.
The test server is a c2-standard-30 with 15 cores, hyperthreads disabled, 120G RAM and XFS with SW RAID 0 across 4 NVMe SSD. The benchmark was run with 8 clients and there were 1 or 3 connections per client (1 for queries or inserts without rate limits, 1+1 for rate limited inserts+deletes). It uses 8 tables, 1 per client. It loads 500M rows per table without secondary indexes, creates secondary indexes, then inserts 40M rows per table with a delete per insert to avoid growing the table. It then does 3 read+write tests for 3600s each that do queries as fast as possible with 100, 500 and then 1000 inserts/second/client concurrent with the queries. There are also deletes to match the inserts and avoid growing the table. The database is larger than memory. Clients and the DBMS share one server. The per-database configs are in the per-database subdirectories here.
The tested DBMS are:
- pg153_o3_native_lto.cx7a27_gcp_c2s30 - Postgres 15.3, o3_native_lto build, cx7a27_gcp_c2s30 config that combines a1, a4, a12, a16, a26 (better for cached workloads)
- pg154_o3_native_lto.cx7a27_gcp_c2s30 - Postgres 15.4, o3_native_lto build, cx7a27_gcp_c2s30 config that combines a1, a4, a12, a16, a26 (better for cached workloads)
- pg16beta1_o3_native_lto.cx7a27_gcp_c2s30 - Postgres 16 beta1, o3_native_lto build, cx7a27_gcp_c2s30 config that combines a1, a4, a12, a16, a26 (better for cached workloads)
- pg16beta2_o3_native_lto.cx7a27_gcp_c2s30 - Postgres 16 beta2, o3_native_lto build, cx7a27_gcp_c2s30 config that combines a1, a4, a12, a16, a26 (better for cached workloads)
- pg16beta3_o3_native_lto.cx7a27_gcp_c2s30 - Postgres 16 beta3, o3_native_lto build, cx7a27_gcp_c2s30 config that combines a1, a4, a12, a16, a26 (better for cached workloads)
Contents
- Summary
- l.i0: load without secondary indexes
- l.x: create secondary indexes
- l.i1: continue load after secondary indexes created
- q100.1: range queries with 100 insert/s per client
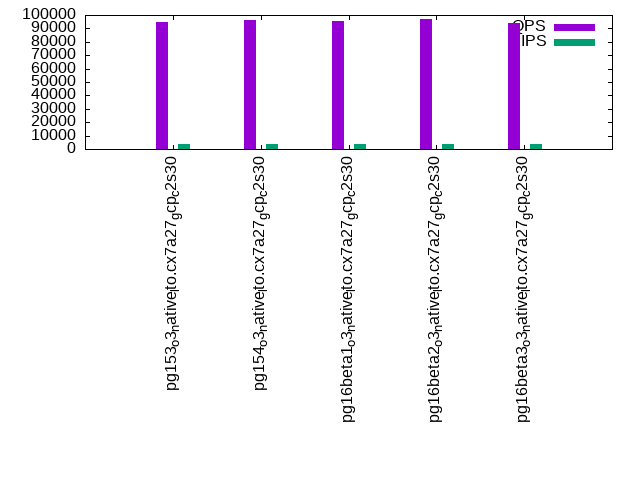
- q500.1: range queries with 500 insert/s per client
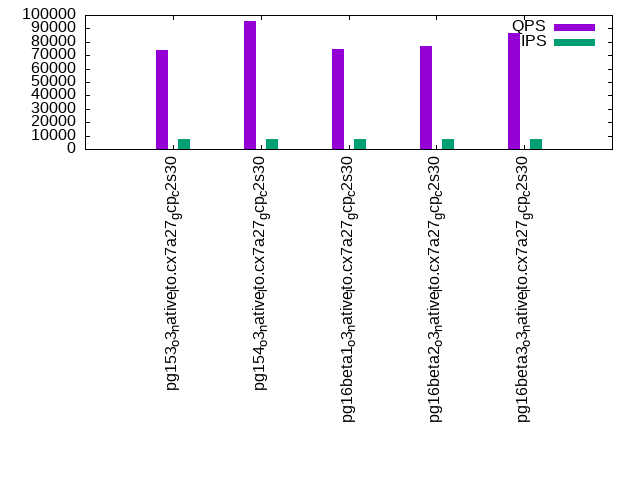
- q1000.1: range queries with 1000 insert/s per client
Summary
The numbers are inserts/s for l.i0 and l.i1, indexed docs (or rows) /s for l.x and queries/s for q*.2. The values are the average rate over the entire test for inserts (IPS) and queries (QPS). The range of values for IPS and QPS is split into 3 parts: bottom 25%, middle 50%, top 25%. Values in the bottom 25% have a red background, values in the top 25% have a green background and values in the middle have no color. A gray background is used for values that can be ignored because the DBMS did not sustain the target insert rate. Red backgrounds are not used when the minimum value is within 80% of the max value.
| dbms | l.i0 | l.x | l.i1 | q100.1 | q500.1 | q1000.1 |
|---|---|---|---|---|---|---|
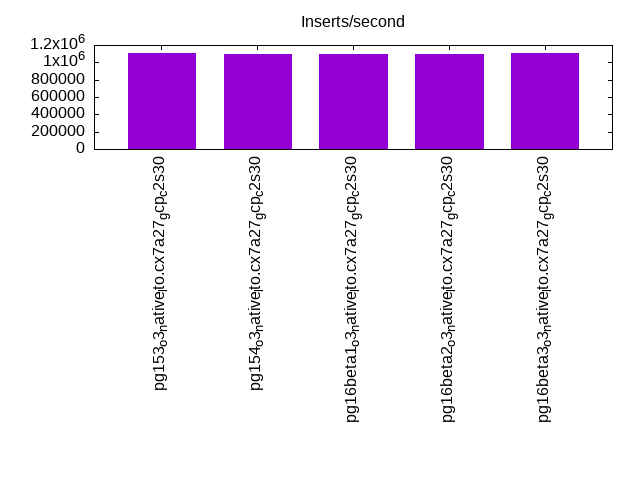
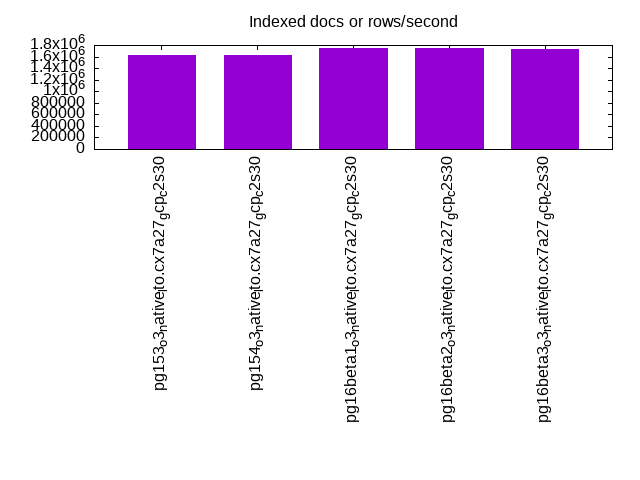
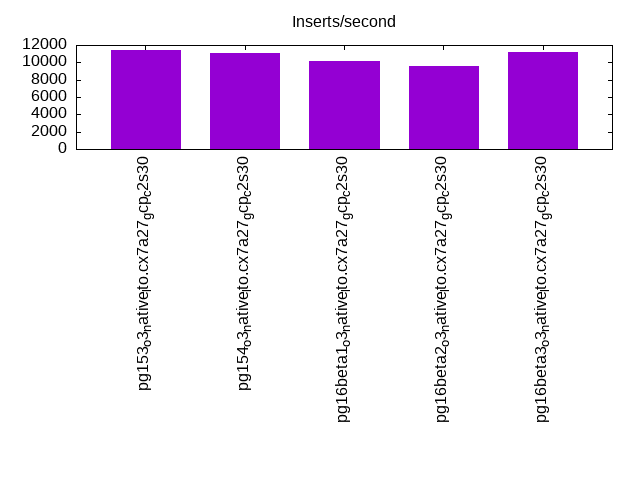
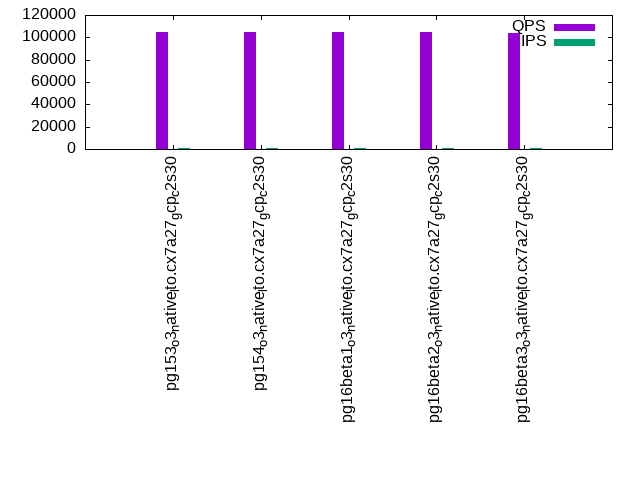
| pg153_o3_native_lto.cx7a27_gcp_c2s30 | 1110802 | 1624736 | 11426 | 104467 | 94699 | 74007 |
| pg154_o3_native_lto.cx7a27_gcp_c2s30 | 1101322 | 1622759 | 11103 | 104603 | 96564 | 95302 |
| pg16beta1_o3_native_lto.cx7a27_gcp_c2s30 | 1091405 | 1739930 | 10124 | 104678 | 95672 | 74696 |
| pg16beta2_o3_native_lto.cx7a27_gcp_c2s30 | 1099505 | 1755200 | 9564 | 104990 | 97299 | 77157 |
| pg16beta3_o3_native_lto.cx7a27_gcp_c2s30 | 1109570 | 1734649 | 11241 | 103679 | 94216 | 86676 |
This table has relative throughput, throughput for the DBMS relative to the DBMS in the first line, using the absolute throughput from the previous table. Values less than 0.95 have a yellow background. Values greater than 1.05 have a blue background.
| dbms | l.i0 | l.x | l.i1 | q100.1 | q500.1 | q1000.1 |
|---|---|---|---|---|---|---|
| pg153_o3_native_lto.cx7a27_gcp_c2s30 | 1.00 | 1.00 | 1.00 | 1.00 | 1.00 | 1.00 |
| pg154_o3_native_lto.cx7a27_gcp_c2s30 | 0.99 | 1.00 | 0.97 | 1.00 | 1.02 | 1.29 |
| pg16beta1_o3_native_lto.cx7a27_gcp_c2s30 | 0.98 | 1.07 | 0.89 | 1.00 | 1.01 | 1.01 |
| pg16beta2_o3_native_lto.cx7a27_gcp_c2s30 | 0.99 | 1.08 | 0.84 | 1.01 | 1.03 | 1.04 |
| pg16beta3_o3_native_lto.cx7a27_gcp_c2s30 | 1.00 | 1.07 | 0.98 | 0.99 | 0.99 | 1.17 |
This lists the average rate of inserts/s for the tests that do inserts concurrent with queries. For such tests the query rate is listed in the table above. The read+write tests are setup so that the insert rate should match the target rate every second. Cells that are not at least 95% of the target have a red background to indicate a failure to satisfy the target.
| dbms | q100.1 | q500.1 | q1000.1 |
|---|---|---|---|
| pg153_o3_native_lto.cx7a27_gcp_c2s30 | 798 | 3987 | 7811 |
| pg154_o3_native_lto.cx7a27_gcp_c2s30 | 797 | 3988 | 7209 |
| pg16beta1_o3_native_lto.cx7a27_gcp_c2s30 | 797 | 3988 | 7822 |
| pg16beta2_o3_native_lto.cx7a27_gcp_c2s30 | 798 | 3987 | 7617 |
| pg16beta3_o3_native_lto.cx7a27_gcp_c2s30 | 797 | 3988 | 7486 |
| target | 800 | 4000 | 8000 |
l.i0
l.i0: load without secondary indexes. Graphs for performance per 1-second interval are here.
Average throughput:
Insert response time histogram: each cell has the percentage of responses that take <= the time in the header and max is the max response time in seconds. For the max column values in the top 25% of the range have a red background and in the bottom 25% of the range have a green background. The red background is not used when the min value is within 80% of the max value.
| dbms | 256us | 1ms | 4ms | 16ms | 64ms | 256ms | 1s | 4s | 16s | gt | max |
|---|---|---|---|---|---|---|---|---|---|---|---|
| pg153_o3_native_lto.cx7a27_gcp_c2s30 | 97.643 | 2.315 | 0.029 | 0.005 | 0.008 | 0.001 | 0.662 | ||||
| pg154_o3_native_lto.cx7a27_gcp_c2s30 | 97.550 | 2.408 | 0.028 | 0.005 | 0.009 | 0.001 | 0.736 | ||||
| pg16beta1_o3_native_lto.cx7a27_gcp_c2s30 | 97.414 | 2.545 | 0.027 | 0.005 | 0.008 | 0.001 | 0.604 | ||||
| pg16beta2_o3_native_lto.cx7a27_gcp_c2s30 | 97.593 | 2.366 | 0.029 | 0.005 | 0.007 | 0.001 | 0.561 | ||||
| pg16beta3_o3_native_lto.cx7a27_gcp_c2s30 | 97.519 | 2.444 | 0.027 | 0.005 | 0.006 | nonzero | 0.803 |
Performance metrics for the DBMS listed above. Some are normalized by throughput, others are not. Legend for results is here.
ips	qps	rps	rmbps	wps	wmbps	rpq	rkbpq	wpi	wkbpi	csps	cpups	cspq	cpupq	dbgb1	dbgb2	rss	maxop	p50	p99	tag
1110802	0	540	4.3	1385.9	253.5	0.000	0.004	0.001	0.234	92534	84.6	0.083	11	382.7	452.8	9.9	0.662	142424	81810	4000m.pg153_o3_native_lto.cx7a27_gcp_c2s30
1101322	0	550	4.3	1364.3	250.3	0.000	0.004	0.001	0.233	91830	84.3	0.083	11	382.7	452.8	17.8	0.736	141645	71622	4000m.pg154_o3_native_lto.cx7a27_gcp_c2s30
1091405	0	532	4.2	1367.4	249.4	0.000	0.004	0.001	0.234	91678	83.9	0.084	12	382.7	452.8	13.3	0.604	140346	70224	4000m.pg16beta1_o3_native_lto.cx7a27_gcp_c2s30
1099505	0	548	4.3	1375.2	251.8	0.000	0.004	0.001	0.235	91448	84.4	0.083	12	382.7	452.8	5.4	0.561	141144	75418	4000m.pg16beta2_o3_native_lto.cx7a27_gcp_c2s30
1109570	0	549	4.3	1373.8	254.3	0.000	0.004	0.001	0.235	91674	84.8	0.083	11	382.7	452.8	9.2	0.803	141946	92935	4000m.pg16beta3_o3_native_lto.cx7a27_gcp_c2s30
l.x
l.x: create secondary indexes.
Average throughput:
Performance metrics for the DBMS listed above. Some are normalized by throughput, others are not. Legend for results is here.
ips	qps	rps	rmbps	wps	wmbps	rpq	rkbpq	wpi	wkbpi	csps	cpups	cspq	cpupq	dbgb1	dbgb2	rss	maxop	p50	p99	tag
1624736	0	3555	768.1	1244.9	277.6	0.002	0.484	0.001	0.175	13241	37.1	0.008	3	735.2	804.7	56.7	0.002	NA	NA	4000m.pg153_o3_native_lto.cx7a27_gcp_c2s30
1622759	0	3511	770.1	1243.1	280.0	0.002	0.486	0.001	0.177	13064	36.9	0.008	3	735.2	805.2	56.9	0.002	NA	NA	4000m.pg154_o3_native_lto.cx7a27_gcp_c2s30
1739930	0	2974	687.3	1330.4	300.3	0.002	0.404	0.001	0.177	18486	39.0	0.011	3	735.2	804.8	57.2	0.002	NA	NA	4000m.pg16beta1_o3_native_lto.cx7a27_gcp_c2s30
1755200	0	3008	697.7	1344.8	300.8	0.002	0.407	0.001	0.175	18698	38.8	0.011	3	735.2	804.9	56.9	0.002	NA	NA	4000m.pg16beta2_o3_native_lto.cx7a27_gcp_c2s30
1734649	0	3016	699.7	1321.4	296.4	0.002	0.413	0.001	0.175	19227	38.7	0.011	3	735.2	804.9	56.8	0.002	NA	NA	4000m.pg16beta3_o3_native_lto.cx7a27_gcp_c2s30
l.i1
l.i1: continue load after secondary indexes created. Graphs for performance per 1-second interval are here.
Average throughput:
Insert response time histogram: each cell has the percentage of responses that take <= the time in the header and max is the max response time in seconds. For the max column values in the top 25% of the range have a red background and in the bottom 25% of the range have a green background. The red background is not used when the min value is within 80% of the max value.
| dbms | 256us | 1ms | 4ms | 16ms | 64ms | 256ms | 1s | 4s | 16s | gt | max |
|---|---|---|---|---|---|---|---|---|---|---|---|
| pg153_o3_native_lto.cx7a27_gcp_c2s30 | 47.402 | 33.854 | 18.734 | 0.010 | 0.001 | 0.771 | |||||
| pg154_o3_native_lto.cx7a27_gcp_c2s30 | 30.015 | 40.775 | 29.198 | 0.011 | 0.001 | nonzero | 1.092 | ||||
| pg16beta1_o3_native_lto.cx7a27_gcp_c2s30 | 32.667 | 44.137 | 23.182 | 0.013 | 0.001 | nonzero | 1.463 | ||||
| pg16beta2_o3_native_lto.cx7a27_gcp_c2s30 | 40.625 | 32.180 | 27.187 | 0.007 | 0.001 | 0.858 | |||||
| pg16beta3_o3_native_lto.cx7a27_gcp_c2s30 | 37.237 | 40.906 | 21.842 | 0.013 | 0.001 | nonzero | 1.138 |
Delete response time histogram: each cell has the percentage of responses that take <= the time in the header and max is the max response time in seconds. For the max column values in the top 25% of the range have a red background and in the bottom 25% of the range have a green background. The red background is not used when the min value is within 80% of the max value.
| dbms | 256us | 1ms | 4ms | 16ms | 64ms | 256ms | 1s | 4s | 16s | gt | max |
|---|---|---|---|---|---|---|---|---|---|---|---|
| pg153_o3_native_lto.cx7a27_gcp_c2s30 | 67.971 | 1.769 | 1.193 | 3.606 | 12.284 | 13.163 | 0.015 | 0.408 | |||
| pg154_o3_native_lto.cx7a27_gcp_c2s30 | 64.004 | 11.090 | 0.933 | 3.329 | 13.288 | 6.972 | 0.382 | 0.447 | |||
| pg16beta1_o3_native_lto.cx7a27_gcp_c2s30 | 62.647 | 4.953 | 0.989 | 3.475 | 11.140 | 16.795 | 0.001 | 0.497 | |||
| pg16beta2_o3_native_lto.cx7a27_gcp_c2s30 | 64.194 | 7.603 | 0.995 | 3.253 | 10.434 | 13.519 | 0.001 | 0.268 | |||
| pg16beta3_o3_native_lto.cx7a27_gcp_c2s30 | 66.693 | 6.347 | 0.925 | 3.230 | 11.872 | 10.934 | nonzero | 0.391 |
Performance metrics for the DBMS listed above. Some are normalized by throughput, others are not. Legend for results is here.
ips	qps	rps	rmbps	wps	wmbps	rpq	rkbpq	wpi	wkbpi	csps	cpups	cspq	cpupq	dbgb1	dbgb2	rss	maxop	p50	p99	tag
11426	0	7741	92.6	9964.0	143.6	0.677	8.297	0.872	12.869	20934	41.5	1.832	545	773.3	843.4	50.5	0.771	250	200	4000m.pg153_o3_native_lto.cx7a27_gcp_c2s30
11103	0	10044	116.0	13326.3	177.8	0.905	10.697	1.200	16.402	25391	35.0	2.287	473	774.3	844.4	41.7	1.092	250	200	4000m.pg154_o3_native_lto.cx7a27_gcp_c2s30
10124	0	8548	99.0	11530.6	158.6	0.844	10.014	1.139	16.042	21884	38.2	2.162	566	772.7	839.6	71.1	1.463	250	200	4000m.pg16beta1_o3_native_lto.cx7a27_gcp_c2s30
9564	0	7810	86.3	9878.0	129.8	0.817	9.239	1.033	13.899	20211	37.6	2.113	590	772.3	838.3	69.7	0.858	350	200	4000m.pg16beta2_o3_native_lto.cx7a27_gcp_c2s30
11241	0	9193	102.9	11887.7	158.7	0.818	9.372	1.058	14.457	23724	37.5	2.111	500	773.9	843.9	67.4	1.138	250	200	4000m.pg16beta3_o3_native_lto.cx7a27_gcp_c2s30
q100.1
q100.1: range queries with 100 insert/s per client. Graphs for performance per 1-second interval are here.
Average throughput:
Query response time histogram: each cell has the percentage of responses that take <= the time in the header and max is the max response time in seconds. For max values in the top 25% of the range have a red background and in the bottom 25% of the range have a green background. The red background is not used when the min value is within 80% of the max value.
| dbms | 256us | 1ms | 4ms | 16ms | 64ms | 256ms | 1s | 4s | 16s | gt | max |
|---|---|---|---|---|---|---|---|---|---|---|---|
| pg153_o3_native_lto.cx7a27_gcp_c2s30 | 99.825 | 0.172 | 0.003 | nonzero | nonzero | nonzero | 0.113 | ||||
| pg154_o3_native_lto.cx7a27_gcp_c2s30 | 99.794 | 0.204 | 0.002 | nonzero | nonzero | nonzero | 0.201 | ||||
| pg16beta1_o3_native_lto.cx7a27_gcp_c2s30 | 99.855 | 0.144 | 0.001 | nonzero | nonzero | nonzero | 0.099 | ||||
| pg16beta2_o3_native_lto.cx7a27_gcp_c2s30 | 99.839 | 0.159 | 0.001 | nonzero | nonzero | 0.025 | |||||
| pg16beta3_o3_native_lto.cx7a27_gcp_c2s30 | 99.817 | 0.182 | 0.001 | nonzero | 0.014 |
Insert response time histogram: each cell has the percentage of responses that take <= the time in the header and max is the max response time in seconds. For max values in the top 25% of the range have a red background and in the bottom 25% of the range have a green background. The red background is not used when the min value is within 80% of the max value.
| dbms | 256us | 1ms | 4ms | 16ms | 64ms | 256ms | 1s | 4s | 16s | gt | max |
|---|---|---|---|---|---|---|---|---|---|---|---|
| pg153_o3_native_lto.cx7a27_gcp_c2s30 | 10.556 | 7.234 | 82.188 | 0.023 | 0.104 | ||||||
| pg154_o3_native_lto.cx7a27_gcp_c2s30 | 6.099 | 12.056 | 81.816 | 0.030 | 0.249 | ||||||
| pg16beta1_o3_native_lto.cx7a27_gcp_c2s30 | 1.642 | 17.427 | 80.925 | 0.005 | 0.082 | ||||||
| pg16beta2_o3_native_lto.cx7a27_gcp_c2s30 | 3.722 | 12.892 | 83.380 | 0.005 | 0.100 | ||||||
| pg16beta3_o3_native_lto.cx7a27_gcp_c2s30 | 9.569 | 5.214 | 85.214 | 0.003 | 0.067 |
Delete response time histogram: each cell has the percentage of responses that take <= the time in the header and max is the max response time in seconds. For max values in the top 25% of the range have a red background and in the bottom 25% of the range have a green background. The red background is not used when the min value is within 80% of the max value.
| dbms | 256us | 1ms | 4ms | 16ms | 64ms | 256ms | 1s | 4s | 16s | gt | max |
|---|---|---|---|---|---|---|---|---|---|---|---|
| pg153_o3_native_lto.cx7a27_gcp_c2s30 | 41.215 | 40.707 | 17.161 | 0.915 | 0.002 | 0.017 | |||||
| pg154_o3_native_lto.cx7a27_gcp_c2s30 | 31.759 | 39.799 | 25.861 | 2.582 | 0.014 | ||||||
| pg16beta1_o3_native_lto.cx7a27_gcp_c2s30 | 33.061 | 37.995 | 26.714 | 2.227 | 0.003 | 0.024 | |||||
| pg16beta2_o3_native_lto.cx7a27_gcp_c2s30 | 30.321 | 31.731 | 34.498 | 3.450 | 0.013 | ||||||
| pg16beta3_o3_native_lto.cx7a27_gcp_c2s30 | 39.625 | 41.490 | 17.335 | 1.547 | 0.003 | 0.017 |
Performance metrics for the DBMS listed above. Some are normalized by throughput, others are not. Legend for results is here.
ips	qps	rps	rmbps	wps	wmbps	rpq	rkbpq	wpi	wkbpi	csps	cpups	cspq	cpupq	dbgb1	dbgb2	rss	maxop	p50	p99	tag
798	104467	1599	13.9	1719.1	24.2	0.015	0.136	2.156	31.133	400895	52.9	3.838	76	773.4	843.4	71.0	0.113	13074	6936	4000m.pg153_o3_native_lto.cx7a27_gcp_c2s30
797	104603	1658	14.3	1911.9	22.3	0.016	0.140	2.398	28.644	401525	53.0	3.839	76	774.3	844.4	71.0	0.201	13185	12930	4000m.pg154_o3_native_lto.cx7a27_gcp_c2s30
797	104678	1484	12.7	1552.0	21.2	0.014	0.124	1.947	27.187	401350	53.0	3.834	76	772.8	842.8	71.0	0.099	13153	11347	4000m.pg16beta1_o3_native_lto.cx7a27_gcp_c2s30
798	104990	1532	13.1	1300.2	19.7	0.015	0.128	1.630	25.244	402597	52.9	3.835	76	772.5	842.5	71.0	0.025	13217	10889	4000m.pg16beta2_o3_native_lto.cx7a27_gcp_c2s30
797	103679	1605	13.8	1508.2	19.3	0.015	0.136	1.892	24.819	397961	52.9	3.838	77	774.0	844.0	71.0	0.014	12994	11576	4000m.pg16beta3_o3_native_lto.cx7a27_gcp_c2s30
q500.1
q500.1: range queries with 500 insert/s per client. Graphs for performance per 1-second interval are here.
Average throughput:
Query response time histogram: each cell has the percentage of responses that take <= the time in the header and max is the max response time in seconds. For max values in the top 25% of the range have a red background and in the bottom 25% of the range have a green background. The red background is not used when the min value is within 80% of the max value.
| dbms | 256us | 1ms | 4ms | 16ms | 64ms | 256ms | 1s | 4s | 16s | gt | max |
|---|---|---|---|---|---|---|---|---|---|---|---|
| pg153_o3_native_lto.cx7a27_gcp_c2s30 | 99.875 | 0.121 | 0.003 | nonzero | nonzero | 0.023 | |||||
| pg154_o3_native_lto.cx7a27_gcp_c2s30 | 99.853 | 0.143 | 0.004 | 0.001 | nonzero | 0.024 | |||||
| pg16beta1_o3_native_lto.cx7a27_gcp_c2s30 | 99.836 | 0.161 | 0.003 | nonzero | nonzero | 0.023 | |||||
| pg16beta2_o3_native_lto.cx7a27_gcp_c2s30 | 99.823 | 0.173 | 0.004 | 0.001 | nonzero | 0.023 | |||||
| pg16beta3_o3_native_lto.cx7a27_gcp_c2s30 | 99.841 | 0.156 | 0.003 | nonzero | nonzero | 0.026 |
Insert response time histogram: each cell has the percentage of responses that take <= the time in the header and max is the max response time in seconds. For max values in the top 25% of the range have a red background and in the bottom 25% of the range have a green background. The red background is not used when the min value is within 80% of the max value.
| dbms | 256us | 1ms | 4ms | 16ms | 64ms | 256ms | 1s | 4s | 16s | gt | max |
|---|---|---|---|---|---|---|---|---|---|---|---|
| pg153_o3_native_lto.cx7a27_gcp_c2s30 | 0.048 | 8.838 | 91.114 | 0.050 | |||||||
| pg154_o3_native_lto.cx7a27_gcp_c2s30 | 11.736 | 88.264 | 0.056 | ||||||||
| pg16beta1_o3_native_lto.cx7a27_gcp_c2s30 | 4.282 | 95.718 | 0.057 | ||||||||
| pg16beta2_o3_native_lto.cx7a27_gcp_c2s30 | 6.983 | 93.015 | 0.002 | 0.112 | |||||||
| pg16beta3_o3_native_lto.cx7a27_gcp_c2s30 | 0.078 | 5.585 | 94.336 | 0.057 |
Delete response time histogram: each cell has the percentage of responses that take <= the time in the header and max is the max response time in seconds. For max values in the top 25% of the range have a red background and in the bottom 25% of the range have a green background. The red background is not used when the min value is within 80% of the max value.
| dbms | 256us | 1ms | 4ms | 16ms | 64ms | 256ms | 1s | 4s | 16s | gt | max |
|---|---|---|---|---|---|---|---|---|---|---|---|
| pg153_o3_native_lto.cx7a27_gcp_c2s30 | 64.860 | 9.978 | 2.840 | 14.073 | 8.248 | 0.032 | |||||
| pg154_o3_native_lto.cx7a27_gcp_c2s30 | 42.231 | 10.166 | 2.408 | 23.402 | 21.792 | nonzero | 0.067 | ||||
| pg16beta1_o3_native_lto.cx7a27_gcp_c2s30 | 64.466 | 10.037 | 4.254 | 15.252 | 5.992 | 0.034 | |||||
| pg16beta2_o3_native_lto.cx7a27_gcp_c2s30 | 38.389 | 9.646 | 3.501 | 26.068 | 22.397 | nonzero | 0.064 | ||||
| pg16beta3_o3_native_lto.cx7a27_gcp_c2s30 | 65.655 | 11.931 | 2.299 | 12.721 | 7.395 | 0.029 |
Performance metrics for the DBMS listed above. Some are normalized by throughput, others are not. Legend for results is here.
ips	qps	rps	rmbps	wps	wmbps	rpq	rkbpq	wpi	wkbpi	csps	cpups	cspq	cpupq	dbgb1	dbgb2	rss	maxop	p50	p99	tag
3987	94699	5886	49.1	7390.2	85.9	0.062	0.530	1.854	22.066	367285	57.4	3.878	91	773.6	843.7	71.0	0.023	11833	11395	4000m.pg153_o3_native_lto.cx7a27_gcp_c2s30
3988	96564	5892	49.0	7395.9	82.8	0.061	0.519	1.855	21.273	361761	59.0	3.746	92	774.5	844.5	71.0	0.024	12019	11315	4000m.pg154_o3_native_lto.cx7a27_gcp_c2s30
3988	95672	5874	49.0	7368.9	94.7	0.061	0.524	1.848	24.330	371166	57.1	3.880	90	773.1	843.2	71.0	0.023	11859	11443	4000m.pg16beta1_o3_native_lto.cx7a27_gcp_c2s30
3987	97299	5856	48.7	7474.9	108.8	0.060	0.512	1.875	27.946	361957	59.1	3.720	91	773.1	843.1	71.0	0.023	12051	11459	4000m.pg16beta2_o3_native_lto.cx7a27_gcp_c2s30
3988	94216	5862	48.9	7332.3	88.9	0.062	0.531	1.839	22.834	365558	57.3	3.880	91	774.3	844.3	71.0	0.026	11619	11161	4000m.pg16beta3_o3_native_lto.cx7a27_gcp_c2s30
q1000.1
q1000.1: range queries with 1000 insert/s per client. Graphs for performance per 1-second interval are here.
Average throughput:
Query response time histogram: each cell has the percentage of responses that take <= the time in the header and max is the max response time in seconds. For max values in the top 25% of the range have a red background and in the bottom 25% of the range have a green background. The red background is not used when the min value is within 80% of the max value.
| dbms | 256us | 1ms | 4ms | 16ms | 64ms | 256ms | 1s | 4s | 16s | gt | max |
|---|---|---|---|---|---|---|---|---|---|---|---|
| pg153_o3_native_lto.cx7a27_gcp_c2s30 | 99.549 | 0.438 | 0.010 | 0.003 | nonzero | 0.027 | |||||
| pg154_o3_native_lto.cx7a27_gcp_c2s30 | 99.703 | 0.278 | 0.015 | 0.005 | nonzero | 0.036 | |||||
| pg16beta1_o3_native_lto.cx7a27_gcp_c2s30 | 99.525 | 0.467 | 0.007 | 0.002 | nonzero | 0.028 | |||||
| pg16beta2_o3_native_lto.cx7a27_gcp_c2s30 | 99.659 | 0.329 | 0.008 | 0.003 | nonzero | nonzero | 0.079 | ||||
| pg16beta3_o3_native_lto.cx7a27_gcp_c2s30 | 99.668 | 0.322 | 0.008 | 0.002 | nonzero | 0.027 |
Insert response time histogram: each cell has the percentage of responses that take <= the time in the header and max is the max response time in seconds. For max values in the top 25% of the range have a red background and in the bottom 25% of the range have a green background. The red background is not used when the min value is within 80% of the max value.
| dbms | 256us | 1ms | 4ms | 16ms | 64ms | 256ms | 1s | 4s | 16s | gt | max |
|---|---|---|---|---|---|---|---|---|---|---|---|
| pg153_o3_native_lto.cx7a27_gcp_c2s30 | 9.466 | 90.464 | 0.069 | 0.245 | |||||||
| pg154_o3_native_lto.cx7a27_gcp_c2s30 | 28.777 | 71.185 | 0.038 | 0.001 | 0.317 | ||||||
| pg16beta1_o3_native_lto.cx7a27_gcp_c2s30 | 4.160 | 95.836 | 0.004 | 0.173 | |||||||
| pg16beta2_o3_native_lto.cx7a27_gcp_c2s30 | 9.827 | 90.165 | 0.008 | 0.163 | |||||||
| pg16beta3_o3_native_lto.cx7a27_gcp_c2s30 | 16.008 | 83.991 | 0.001 | 0.105 |
Delete response time histogram: each cell has the percentage of responses that take <= the time in the header and max is the max response time in seconds. For max values in the top 25% of the range have a red background and in the bottom 25% of the range have a green background. The red background is not used when the min value is within 80% of the max value.
| dbms | 256us | 1ms | 4ms | 16ms | 64ms | 256ms | 1s | 4s | 16s | gt | max |
|---|---|---|---|---|---|---|---|---|---|---|---|
| pg153_o3_native_lto.cx7a27_gcp_c2s30 | 50.485 | 23.502 | 0.150 | 0.029 | 25.832 | 0.002 | 0.086 | ||||
| pg154_o3_native_lto.cx7a27_gcp_c2s30 | 15.714 | 16.443 | 0.110 | 0.020 | 61.169 | 6.544 | 0.149 | ||||
| pg16beta1_o3_native_lto.cx7a27_gcp_c2s30 | 55.819 | 27.268 | 0.161 | 0.024 | 16.714 | 0.014 | 0.078 | ||||
| pg16beta2_o3_native_lto.cx7a27_gcp_c2s30 | 48.066 | 23.293 | 0.205 | 0.032 | 28.324 | 0.081 | 0.084 | ||||
| pg16beta3_o3_native_lto.cx7a27_gcp_c2s30 | 36.112 | 26.141 | 0.164 | 0.045 | 36.357 | 1.181 | 0.132 |
Performance metrics for the DBMS listed above. Some are normalized by throughput, others are not. Legend for results is here.
ips	qps	rps	rmbps	wps	wmbps	rpq	rkbpq	wpi	wkbpi	csps	cpups	cspq	cpupq	dbgb1	dbgb2	rss	maxop	p50	p99	tag
7811	74007	11643	107.0	15912.2	185.1	0.157	1.481	2.037	24.267	274272	67.4	3.706	137	774.2	844.2	44.9	0.027	9254	8731	4000m.pg153_o3_native_lto.cx7a27_gcp_c2s30
7209	95302	10771	98.7	14678.6	165.0	0.113	1.061	2.036	23.433	236040	82.8	2.477	130	774.8	844.9	44.9	0.036	12274	9594	4000m.pg154_o3_native_lto.cx7a27_gcp_c2s30
7822	74696	11590	96.1	15640.7	194.3	0.155	1.318	2.000	25.435	291192	64.1	3.898	129	774.0	844.0	71.0	0.028	9382	8854	4000m.pg16beta1_o3_native_lto.cx7a27_gcp_c2s30
7617	77157	11242	93.1	15237.8	216.3	0.146	1.236	2.000	29.074	271760	66.8	3.522	130	774.4	844.4	71.0	0.079	9174	8694	4000m.pg16beta2_o3_native_lto.cx7a27_gcp_c2s30
7486	86676	11128	92.5	15034.8	174.5	0.128	1.093	2.008	23.867	260074	72.1	3.001	125	774.9	844.9	71.0	0.027	10644	8998	4000m.pg16beta3_o3_native_lto.cx7a27_gcp_c2s30
l.i0
l.i0: load without secondary indexes
Performance metrics for all DBMS, not just the ones listed above. Some are normalized by throughput, others are not. Legend for results is here.
ips	qps	rps	rmbps	wps	wmbps	rpq	rkbpq	wpi	wkbpi	csps	cpups	cspq	cpupq	dbgb1	dbgb2	rss	maxop	p50	p99	tag
1110802	0	540	4.3	1385.9	253.5	0.000	0.004	0.001	0.234	92534	84.6	0.083	11	382.7	452.8	9.9	0.662	142424	81810	4000m.pg153_o3_native_lto.cx7a27_gcp_c2s30
1101322	0	550	4.3	1364.3	250.3	0.000	0.004	0.001	0.233	91830	84.3	0.083	11	382.7	452.8	17.8	0.736	141645	71622	4000m.pg154_o3_native_lto.cx7a27_gcp_c2s30
1091405	0	532	4.2	1367.4	249.4	0.000	0.004	0.001	0.234	91678	83.9	0.084	12	382.7	452.8	13.3	0.604	140346	70224	4000m.pg16beta1_o3_native_lto.cx7a27_gcp_c2s30
1099505	0	548	4.3	1375.2	251.8	0.000	0.004	0.001	0.235	91448	84.4	0.083	12	382.7	452.8	5.4	0.561	141144	75418	4000m.pg16beta2_o3_native_lto.cx7a27_gcp_c2s30
1109570	0	549	4.3	1373.8	254.3	0.000	0.004	0.001	0.235	91674	84.8	0.083	11	382.7	452.8	9.2	0.803	141946	92935	4000m.pg16beta3_o3_native_lto.cx7a27_gcp_c2s30
l.x
l.x: create secondary indexes
Performance metrics for all DBMS, not just the ones listed above. Some are normalized by throughput, others are not. Legend for results is here.
ips	qps	rps	rmbps	wps	wmbps	rpq	rkbpq	wpi	wkbpi	csps	cpups	cspq	cpupq	dbgb1	dbgb2	rss	maxop	p50	p99	tag
1624736	0	3555	768.1	1244.9	277.6	0.002	0.484	0.001	0.175	13241	37.1	0.008	3	735.2	804.7	56.7	0.002	NA	NA	4000m.pg153_o3_native_lto.cx7a27_gcp_c2s30
1622759	0	3511	770.1	1243.1	280.0	0.002	0.486	0.001	0.177	13064	36.9	0.008	3	735.2	805.2	56.9	0.002	NA	NA	4000m.pg154_o3_native_lto.cx7a27_gcp_c2s30
1739930	0	2974	687.3	1330.4	300.3	0.002	0.404	0.001	0.177	18486	39.0	0.011	3	735.2	804.8	57.2	0.002	NA	NA	4000m.pg16beta1_o3_native_lto.cx7a27_gcp_c2s30
1755200	0	3008	697.7	1344.8	300.8	0.002	0.407	0.001	0.175	18698	38.8	0.011	3	735.2	804.9	56.9	0.002	NA	NA	4000m.pg16beta2_o3_native_lto.cx7a27_gcp_c2s30
1734649	0	3016	699.7	1321.4	296.4	0.002	0.413	0.001	0.175	19227	38.7	0.011	3	735.2	804.9	56.8	0.002	NA	NA	4000m.pg16beta3_o3_native_lto.cx7a27_gcp_c2s30
l.i1
l.i1: continue load after secondary indexes created
Performance metrics for all DBMS, not just the ones listed above. Some are normalized by throughput, others are not. Legend for results is here.
ips	qps	rps	rmbps	wps	wmbps	rpq	rkbpq	wpi	wkbpi	csps	cpups	cspq	cpupq	dbgb1	dbgb2	rss	maxop	p50	p99	tag
11426	0	7741	92.6	9964.0	143.6	0.677	8.297	0.872	12.869	20934	41.5	1.832	545	773.3	843.4	50.5	0.771	250	200	4000m.pg153_o3_native_lto.cx7a27_gcp_c2s30
11103	0	10044	116.0	13326.3	177.8	0.905	10.697	1.200	16.402	25391	35.0	2.287	473	774.3	844.4	41.7	1.092	250	200	4000m.pg154_o3_native_lto.cx7a27_gcp_c2s30
10124	0	8548	99.0	11530.6	158.6	0.844	10.014	1.139	16.042	21884	38.2	2.162	566	772.7	839.6	71.1	1.463	250	200	4000m.pg16beta1_o3_native_lto.cx7a27_gcp_c2s30
9564	0	7810	86.3	9878.0	129.8	0.817	9.239	1.033	13.899	20211	37.6	2.113	590	772.3	838.3	69.7	0.858	350	200	4000m.pg16beta2_o3_native_lto.cx7a27_gcp_c2s30
11241	0	9193	102.9	11887.7	158.7	0.818	9.372	1.058	14.457	23724	37.5	2.111	500	773.9	843.9	67.4	1.138	250	200	4000m.pg16beta3_o3_native_lto.cx7a27_gcp_c2s30
q100.1
q100.1: range queries with 100 insert/s per client
Performance metrics for all DBMS, not just the ones listed above. Some are normalized by throughput, others are not. Legend for results is here.
ips	qps	rps	rmbps	wps	wmbps	rpq	rkbpq	wpi	wkbpi	csps	cpups	cspq	cpupq	dbgb1	dbgb2	rss	maxop	p50	p99	tag
798	104467	1599	13.9	1719.1	24.2	0.015	0.136	2.156	31.133	400895	52.9	3.838	76	773.4	843.4	71.0	0.113	13074	6936	4000m.pg153_o3_native_lto.cx7a27_gcp_c2s30
797	104603	1658	14.3	1911.9	22.3	0.016	0.140	2.398	28.644	401525	53.0	3.839	76	774.3	844.4	71.0	0.201	13185	12930	4000m.pg154_o3_native_lto.cx7a27_gcp_c2s30
797	104678	1484	12.7	1552.0	21.2	0.014	0.124	1.947	27.187	401350	53.0	3.834	76	772.8	842.8	71.0	0.099	13153	11347	4000m.pg16beta1_o3_native_lto.cx7a27_gcp_c2s30
798	104990	1532	13.1	1300.2	19.7	0.015	0.128	1.630	25.244	402597	52.9	3.835	76	772.5	842.5	71.0	0.025	13217	10889	4000m.pg16beta2_o3_native_lto.cx7a27_gcp_c2s30
797	103679	1605	13.8	1508.2	19.3	0.015	0.136	1.892	24.819	397961	52.9	3.838	77	774.0	844.0	71.0	0.014	12994	11576	4000m.pg16beta3_o3_native_lto.cx7a27_gcp_c2s30
q500.1
q500.1: range queries with 500 insert/s per client
Performance metrics for all DBMS, not just the ones listed above. Some are normalized by throughput, others are not. Legend for results is here.
ips	qps	rps	rmbps	wps	wmbps	rpq	rkbpq	wpi	wkbpi	csps	cpups	cspq	cpupq	dbgb1	dbgb2	rss	maxop	p50	p99	tag
3987	94699	5886	49.1	7390.2	85.9	0.062	0.530	1.854	22.066	367285	57.4	3.878	91	773.6	843.7	71.0	0.023	11833	11395	4000m.pg153_o3_native_lto.cx7a27_gcp_c2s30
3988	96564	5892	49.0	7395.9	82.8	0.061	0.519	1.855	21.273	361761	59.0	3.746	92	774.5	844.5	71.0	0.024	12019	11315	4000m.pg154_o3_native_lto.cx7a27_gcp_c2s30
3988	95672	5874	49.0	7368.9	94.7	0.061	0.524	1.848	24.330	371166	57.1	3.880	90	773.1	843.2	71.0	0.023	11859	11443	4000m.pg16beta1_o3_native_lto.cx7a27_gcp_c2s30
3987	97299	5856	48.7	7474.9	108.8	0.060	0.512	1.875	27.946	361957	59.1	3.720	91	773.1	843.1	71.0	0.023	12051	11459	4000m.pg16beta2_o3_native_lto.cx7a27_gcp_c2s30
3988	94216	5862	48.9	7332.3	88.9	0.062	0.531	1.839	22.834	365558	57.3	3.880	91	774.3	844.3	71.0	0.026	11619	11161	4000m.pg16beta3_o3_native_lto.cx7a27_gcp_c2s30
q1000.1
q1000.1: range queries with 1000 insert/s per client
Performance metrics for all DBMS, not just the ones listed above. Some are normalized by throughput, others are not. Legend for results is here.
ips	qps	rps	rmbps	wps	wmbps	rpq	rkbpq	wpi	wkbpi	csps	cpups	cspq	cpupq	dbgb1	dbgb2	rss	maxop	p50	p99	tag
7811	74007	11643	107.0	15912.2	185.1	0.157	1.481	2.037	24.267	274272	67.4	3.706	137	774.2	844.2	44.9	0.027	9254	8731	4000m.pg153_o3_native_lto.cx7a27_gcp_c2s30
7209	95302	10771	98.7	14678.6	165.0	0.113	1.061	2.036	23.433	236040	82.8	2.477	130	774.8	844.9	44.9	0.036	12274	9594	4000m.pg154_o3_native_lto.cx7a27_gcp_c2s30
7822	74696	11590	96.1	15640.7	194.3	0.155	1.318	2.000	25.435	291192	64.1	3.898	129	774.0	844.0	71.0	0.028	9382	8854	4000m.pg16beta1_o3_native_lto.cx7a27_gcp_c2s30
7617	77157	11242	93.1	15237.8	216.3	0.146	1.236	2.000	29.074	271760	66.8	3.522	130	774.4	844.4	71.0	0.079	9174	8694	4000m.pg16beta2_o3_native_lto.cx7a27_gcp_c2s30
7486	86676	11128	92.5	15034.8	174.5	0.128	1.093	2.008	23.867	260074	72.1	3.001	125	774.9	844.9	71.0	0.027	10644	8998	4000m.pg16beta3_o3_native_lto.cx7a27_gcp_c2s30
l.i0
- l.i0: load without secondary indexes
- Legend for results is here.
- Each entry lists the percentage of responses that fit in that bucket (slower than max time for previous bucket, faster than min time for next bucket).
Insert response time histogram
256us	1ms	4ms	16ms	64ms	256ms	1s	4s	16s	gt	max	tag
0.000	97.643	2.315	0.029	0.005	0.008	0.001	0.000	0.000	0.000	0.662	pg153_o3_native_lto.cx7a27_gcp_c2s30
0.000	97.550	2.408	0.028	0.005	0.009	0.001	0.000	0.000	0.000	0.736	pg154_o3_native_lto.cx7a27_gcp_c2s30
0.000	97.414	2.545	0.027	0.005	0.008	0.001	0.000	0.000	0.000	0.604	pg16beta1_o3_native_lto.cx7a27_gcp_c2s30
0.000	97.593	2.366	0.029	0.005	0.007	0.001	0.000	0.000	0.000	0.561	pg16beta2_o3_native_lto.cx7a27_gcp_c2s30
0.000	97.519	2.444	0.027	0.005	0.006	nonzero	0.000	0.000	0.000	0.803	pg16beta3_o3_native_lto.cx7a27_gcp_c2s30
l.x
- l.x: create secondary indexes
- Legend for results is here.
- Each entry lists the percentage of responses that fit in that bucket (slower than max time for previous bucket, faster than min time for next bucket).
TODO - determine whether there is data for create index response time
l.i1
- l.i1: continue load after secondary indexes created
- Legend for results is here.
- Each entry lists the percentage of responses that fit in that bucket (slower than max time for previous bucket, faster than min time for next bucket).
Insert response time histogram
256us	1ms	4ms	16ms	64ms	256ms	1s	4s	16s	gt	max	tag
0.000	0.000	47.402	33.854	18.734	0.010	0.001	0.000	0.000	0.000	0.771	pg153_o3_native_lto.cx7a27_gcp_c2s30
0.000	0.000	30.015	40.775	29.198	0.011	0.001	nonzero	0.000	0.000	1.092	pg154_o3_native_lto.cx7a27_gcp_c2s30
0.000	0.000	32.667	44.137	23.182	0.013	0.001	nonzero	0.000	0.000	1.463	pg16beta1_o3_native_lto.cx7a27_gcp_c2s30
0.000	0.000	40.625	32.180	27.187	0.007	0.001	0.000	0.000	0.000	0.858	pg16beta2_o3_native_lto.cx7a27_gcp_c2s30
0.000	0.000	37.237	40.906	21.842	0.013	0.001	nonzero	0.000	0.000	1.138	pg16beta3_o3_native_lto.cx7a27_gcp_c2s30
Delete response time histogram
256us	1ms	4ms	16ms	64ms	256ms	1s	4s	16s	gt	max	tag
67.971	1.769	1.193	3.606	12.284	13.163	0.015	0.000	0.000	0.000	0.408	pg153_o3_native_lto.cx7a27_gcp_c2s30
64.004	11.090	0.933	3.329	13.288	6.972	0.382	0.000	0.000	0.000	0.447	pg154_o3_native_lto.cx7a27_gcp_c2s30
62.647	4.953	0.989	3.475	11.140	16.795	0.001	0.000	0.000	0.000	0.497	pg16beta1_o3_native_lto.cx7a27_gcp_c2s30
64.194	7.603	0.995	3.253	10.434	13.519	0.001	0.000	0.000	0.000	0.268	pg16beta2_o3_native_lto.cx7a27_gcp_c2s30
66.693	6.347	0.925	3.230	11.872	10.934	nonzero	0.000	0.000	0.000	0.391	pg16beta3_o3_native_lto.cx7a27_gcp_c2s30
q100.1
- q100.1: range queries with 100 insert/s per client
- Legend for results is here.
- Each entry lists the percentage of responses that fit in that bucket (slower than max time for previous bucket, faster than min time for next bucket).
Query response time histogram
256us	1ms	4ms	16ms	64ms	256ms	1s	4s	16s	gt	max	tag
99.825	0.172	0.003	nonzero	nonzero	nonzero	0.000	0.000	0.000	0.000	0.113	pg153_o3_native_lto.cx7a27_gcp_c2s30
99.794	0.204	0.002	nonzero	nonzero	nonzero	0.000	0.000	0.000	0.000	0.201	pg154_o3_native_lto.cx7a27_gcp_c2s30
99.855	0.144	0.001	nonzero	nonzero	nonzero	0.000	0.000	0.000	0.000	0.099	pg16beta1_o3_native_lto.cx7a27_gcp_c2s30
99.839	0.159	0.001	nonzero	nonzero	0.000	0.000	0.000	0.000	0.000	0.025	pg16beta2_o3_native_lto.cx7a27_gcp_c2s30
99.817	0.182	0.001	nonzero	0.000	0.000	0.000	0.000	0.000	0.000	0.014	pg16beta3_o3_native_lto.cx7a27_gcp_c2s30
Insert response time histogram
256us	1ms	4ms	16ms	64ms	256ms	1s	4s	16s	gt	max	tag
0.000	0.000	10.556	7.234	82.188	0.023	0.000	0.000	0.000	0.000	0.104	pg153_o3_native_lto.cx7a27_gcp_c2s30
0.000	0.000	6.099	12.056	81.816	0.030	0.000	0.000	0.000	0.000	0.249	pg154_o3_native_lto.cx7a27_gcp_c2s30
0.000	0.000	1.642	17.427	80.925	0.005	0.000	0.000	0.000	0.000	0.082	pg16beta1_o3_native_lto.cx7a27_gcp_c2s30
0.000	0.000	3.722	12.892	83.380	0.005	0.000	0.000	0.000	0.000	0.100	pg16beta2_o3_native_lto.cx7a27_gcp_c2s30
0.000	0.000	9.569	5.214	85.214	0.003	0.000	0.000	0.000	0.000	0.067	pg16beta3_o3_native_lto.cx7a27_gcp_c2s30
Delete response time histogram
256us	1ms	4ms	16ms	64ms	256ms	1s	4s	16s	gt	max	tag
41.215	40.707	17.161	0.915	0.002	0.000	0.000	0.000	0.000	0.000	0.017	pg153_o3_native_lto.cx7a27_gcp_c2s30
31.759	39.799	25.861	2.582	0.000	0.000	0.000	0.000	0.000	0.000	0.014	pg154_o3_native_lto.cx7a27_gcp_c2s30
33.061	37.995	26.714	2.227	0.003	0.000	0.000	0.000	0.000	0.000	0.024	pg16beta1_o3_native_lto.cx7a27_gcp_c2s30
30.321	31.731	34.498	3.450	0.000	0.000	0.000	0.000	0.000	0.000	0.013	pg16beta2_o3_native_lto.cx7a27_gcp_c2s30
39.625	41.490	17.335	1.547	0.003	0.000	0.000	0.000	0.000	0.000	0.017	pg16beta3_o3_native_lto.cx7a27_gcp_c2s30
q500.1
- q500.1: range queries with 500 insert/s per client
- Legend for results is here.
- Each entry lists the percentage of responses that fit in that bucket (slower than max time for previous bucket, faster than min time for next bucket).
Query response time histogram
256us	1ms	4ms	16ms	64ms	256ms	1s	4s	16s	gt	max	tag
99.875	0.121	0.003	nonzero	nonzero	0.000	0.000	0.000	0.000	0.000	0.023	pg153_o3_native_lto.cx7a27_gcp_c2s30
99.853	0.143	0.004	0.001	nonzero	0.000	0.000	0.000	0.000	0.000	0.024	pg154_o3_native_lto.cx7a27_gcp_c2s30
99.836	0.161	0.003	nonzero	nonzero	0.000	0.000	0.000	0.000	0.000	0.023	pg16beta1_o3_native_lto.cx7a27_gcp_c2s30
99.823	0.173	0.004	0.001	nonzero	0.000	0.000	0.000	0.000	0.000	0.023	pg16beta2_o3_native_lto.cx7a27_gcp_c2s30
99.841	0.156	0.003	nonzero	nonzero	0.000	0.000	0.000	0.000	0.000	0.026	pg16beta3_o3_native_lto.cx7a27_gcp_c2s30
Insert response time histogram
256us	1ms	4ms	16ms	64ms	256ms	1s	4s	16s	gt	max	tag
0.000	0.000	0.048	8.838	91.114	0.000	0.000	0.000	0.000	0.000	0.050	pg153_o3_native_lto.cx7a27_gcp_c2s30
0.000	0.000	0.000	11.736	88.264	0.000	0.000	0.000	0.000	0.000	0.056	pg154_o3_native_lto.cx7a27_gcp_c2s30
0.000	0.000	0.000	4.282	95.718	0.000	0.000	0.000	0.000	0.000	0.057	pg16beta1_o3_native_lto.cx7a27_gcp_c2s30
0.000	0.000	0.000	6.983	93.015	0.002	0.000	0.000	0.000	0.000	0.112	pg16beta2_o3_native_lto.cx7a27_gcp_c2s30
0.000	0.000	0.078	5.585	94.336	0.000	0.000	0.000	0.000	0.000	0.057	pg16beta3_o3_native_lto.cx7a27_gcp_c2s30
Delete response time histogram
256us	1ms	4ms	16ms	64ms	256ms	1s	4s	16s	gt	max	tag
64.860	9.978	2.840	14.073	8.248	0.000	0.000	0.000	0.000	0.000	0.032	pg153_o3_native_lto.cx7a27_gcp_c2s30
42.231	10.166	2.408	23.402	21.792	nonzero	0.000	0.000	0.000	0.000	0.067	pg154_o3_native_lto.cx7a27_gcp_c2s30
64.466	10.037	4.254	15.252	5.992	0.000	0.000	0.000	0.000	0.000	0.034	pg16beta1_o3_native_lto.cx7a27_gcp_c2s30
38.389	9.646	3.501	26.068	22.397	nonzero	0.000	0.000	0.000	0.000	0.064	pg16beta2_o3_native_lto.cx7a27_gcp_c2s30
65.655	11.931	2.299	12.721	7.395	0.000	0.000	0.000	0.000	0.000	0.029	pg16beta3_o3_native_lto.cx7a27_gcp_c2s30
q1000.1
- q1000.1: range queries with 1000 insert/s per client
- Legend for results is here.
- Each entry lists the percentage of responses that fit in that bucket (slower than max time for previous bucket, faster than min time for next bucket).
Query response time histogram
256us	1ms	4ms	16ms	64ms	256ms	1s	4s	16s	gt	max	tag
99.549	0.438	0.010	0.003	nonzero	0.000	0.000	0.000	0.000	0.000	0.027	pg153_o3_native_lto.cx7a27_gcp_c2s30
99.703	0.278	0.015	0.005	nonzero	0.000	0.000	0.000	0.000	0.000	0.036	pg154_o3_native_lto.cx7a27_gcp_c2s30
99.525	0.467	0.007	0.002	nonzero	0.000	0.000	0.000	0.000	0.000	0.028	pg16beta1_o3_native_lto.cx7a27_gcp_c2s30
99.659	0.329	0.008	0.003	nonzero	nonzero	0.000	0.000	0.000	0.000	0.079	pg16beta2_o3_native_lto.cx7a27_gcp_c2s30
99.668	0.322	0.008	0.002	nonzero	0.000	0.000	0.000	0.000	0.000	0.027	pg16beta3_o3_native_lto.cx7a27_gcp_c2s30
Insert response time histogram
256us	1ms	4ms	16ms	64ms	256ms	1s	4s	16s	gt	max	tag
0.000	0.000	0.000	9.466	90.464	0.069	0.000	0.000	0.000	0.000	0.245	pg153_o3_native_lto.cx7a27_gcp_c2s30
0.000	0.000	0.000	28.777	71.185	0.038	0.001	0.000	0.000	0.000	0.317	pg154_o3_native_lto.cx7a27_gcp_c2s30
0.000	0.000	0.000	4.160	95.836	0.004	0.000	0.000	0.000	0.000	0.173	pg16beta1_o3_native_lto.cx7a27_gcp_c2s30
0.000	0.000	0.000	9.827	90.165	0.008	0.000	0.000	0.000	0.000	0.163	pg16beta2_o3_native_lto.cx7a27_gcp_c2s30
0.000	0.000	0.000	16.008	83.991	0.001	0.000	0.000	0.000	0.000	0.105	pg16beta3_o3_native_lto.cx7a27_gcp_c2s30
Delete response time histogram
256us	1ms	4ms	16ms	64ms	256ms	1s	4s	16s	gt	max	tag
50.485	23.502	0.150	0.029	25.832	0.002	0.000	0.000	0.000	0.000	0.086	pg153_o3_native_lto.cx7a27_gcp_c2s30
15.714	16.443	0.110	0.020	61.169	6.544	0.000	0.000	0.000	0.000	0.149	pg154_o3_native_lto.cx7a27_gcp_c2s30
55.819	27.268	0.161	0.024	16.714	0.014	0.000	0.000	0.000	0.000	0.078	pg16beta1_o3_native_lto.cx7a27_gcp_c2s30
48.066	23.293	0.205	0.032	28.324	0.081	0.000	0.000	0.000	0.000	0.084	pg16beta2_o3_native_lto.cx7a27_gcp_c2s30
36.112	26.141	0.164	0.045	36.357	1.181	0.000	0.000	0.000	0.000	0.132	pg16beta3_o3_native_lto.cx7a27_gcp_c2s30