Introduction
This is a report for the insert benchmark with 160M docs and 8 client(s). It is generated by scripts (bash, awk, sed) and Tufte might not be impressed. An overview of the insert benchmark is here and a short update is here. Below, by DBMS, I mean DBMS+version.config. An example is my8020.c10b40 where my means MySQL, 8020 is version 8.0.20 and c10b40 is the name for the configuration file.
The test server is a c2-standard-30 with 15 cores, hyperthreads disabled, 120G RAM and XFS with SW RAID 0 across 4 NVMe SSD. The benchmark was run with 8 clients and there were 1 or 3 connections per client (1 for queries or inserts without rate limits, 1+1 for rate limited inserts+deletes). It uses 8 tables, 1 per client. It loads 20M rows per table without secondary indexes, creates secondary indexes, then inserts 200M rows per table with a delete per insert to avoid growing the table. It then does 3 read+write tests for 3600s each that do queries as fast as possible with 100, 500 and then 1000 inserts/second/client concurrent with the queries. There are also deletes to match the inserts and avoid growing the table. The database is cached by Postgres. Clients and the DBMS share one server. The per-database configs are in the per-database subdirectories here.
The tested DBMS are:
- pg153_o3_native_lto.cx7a27_gcp_c2s30 - Postgres 15.3, o3_native_lto build, cx7a27_gcp_c2s30 config that combines a1, a4, a12, a16, a26 (better for cached workloads)
- pg154_o3_native_lto.cx7a27_gcp_c2s30 - Postgres 15.4, o3_native_lto build, cx7a27_gcp_c2s30 config that combines a1, a4, a12, a16, a26 (better for cached workloads)
- pg16beta1_o3_native_lto.cx7a27_gcp_c2s30 - Postgres 16 beta1, o3_native_lto build, cx7a27_gcp_c2s30 config that combines a1, a4, a12, a16, a26 (better for cached workloads)
- pg16beta2_o3_native_lto.cx7a27_gcp_c2s30 - Postgres 16 beta2, o3_native_lto build, cx7a27_gcp_c2s30 config that combines a1, a4, a12, a16, a26 (better for cached workloads)
- pg16beta3_o3_native_lto.cx7a27_gcp_c2s30 - Postgres 16 beta3, o3_native_lto build, cx7a27_gcp_c2s30 config that combines a1, a4, a12, a16, a26 (better for cached workloads)
Contents
- Summary
- l.i0: load without secondary indexes
- l.x: create secondary indexes
- l.i1: continue load after secondary indexes created
- q100.1: range queries with 100 insert/s per client
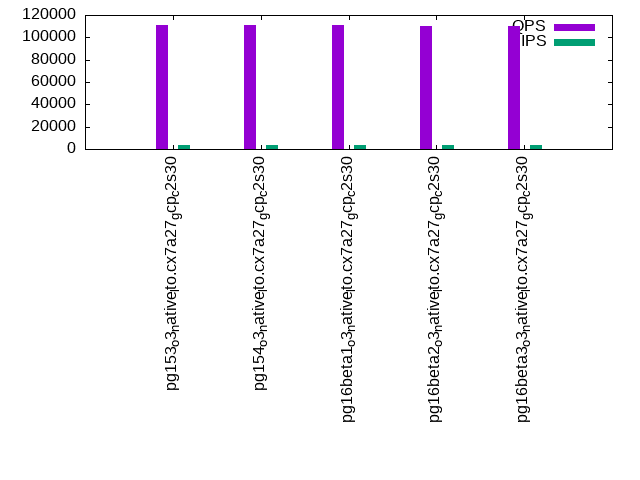
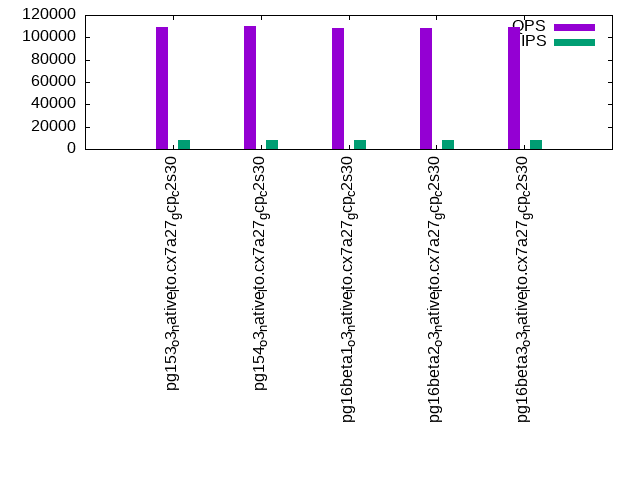
- q500.1: range queries with 500 insert/s per client
- q1000.1: range queries with 1000 insert/s per client
Summary
The numbers are inserts/s for l.i0 and l.i1, indexed docs (or rows) /s for l.x and queries/s for q*.2. The values are the average rate over the entire test for inserts (IPS) and queries (QPS). The range of values for IPS and QPS is split into 3 parts: bottom 25%, middle 50%, top 25%. Values in the bottom 25% have a red background, values in the top 25% have a green background and values in the middle have no color. A gray background is used for values that can be ignored because the DBMS did not sustain the target insert rate. Red backgrounds are not used when the minimum value is within 80% of the max value.
| dbms | l.i0 | l.x | l.i1 | q100.1 | q500.1 | q1000.1 |
|---|---|---|---|---|---|---|
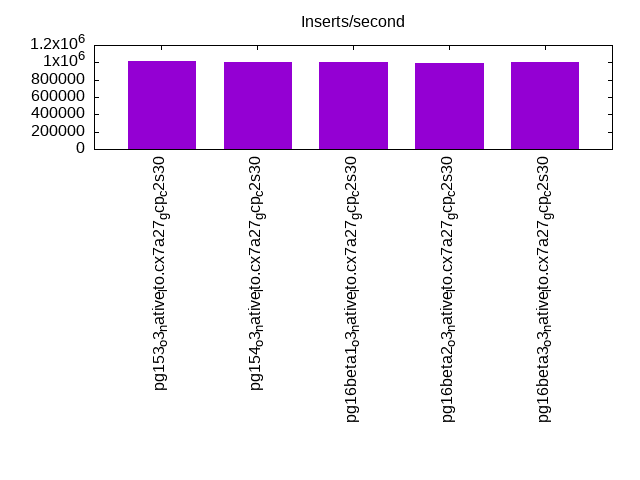
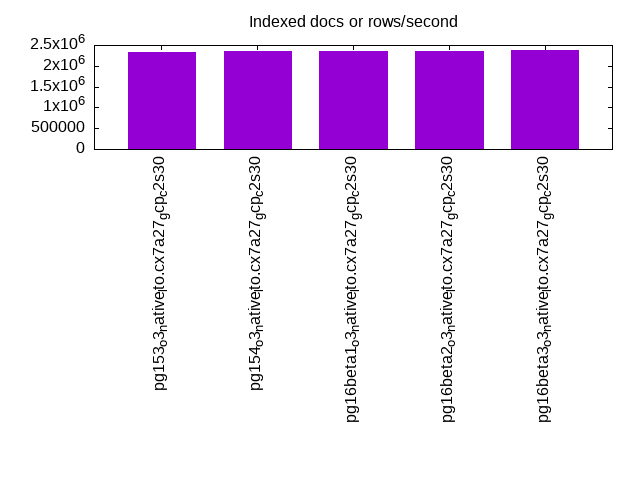
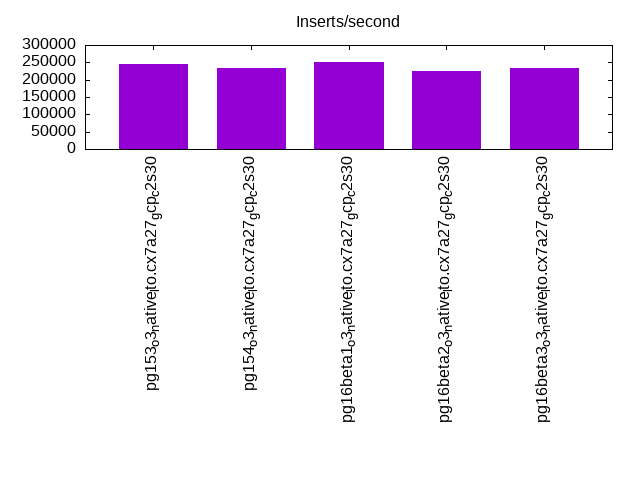
| pg153_o3_native_lto.cx7a27_gcp_c2s30 | 1012658 | 2320290 | 244200 | 114462 | 111191 | 109159 |
| pg154_o3_native_lto.cx7a27_gcp_c2s30 | 1006289 | 2354412 | 232660 | 114165 | 110971 | 109719 |
| pg16beta1_o3_native_lto.cx7a27_gcp_c2s30 | 1000000 | 2354412 | 250078 | 113747 | 111179 | 108648 |
| pg16beta2_o3_native_lto.cx7a27_gcp_c2s30 | 987654 | 2354412 | 226244 | 113646 | 110352 | 108196 |
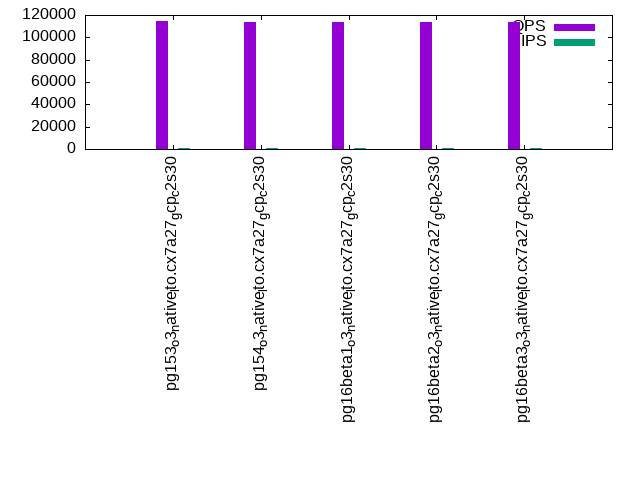
| pg16beta3_o3_native_lto.cx7a27_gcp_c2s30 | 1000000 | 2389552 | 233816 | 113309 | 109984 | 109044 |
This table has relative throughput, throughput for the DBMS relative to the DBMS in the first line, using the absolute throughput from the previous table. Values less than 0.95 have a yellow background. Values greater than 1.05 have a blue background.
| dbms | l.i0 | l.x | l.i1 | q100.1 | q500.1 | q1000.1 |
|---|---|---|---|---|---|---|
| pg153_o3_native_lto.cx7a27_gcp_c2s30 | 1.00 | 1.00 | 1.00 | 1.00 | 1.00 | 1.00 |
| pg154_o3_native_lto.cx7a27_gcp_c2s30 | 0.99 | 1.01 | 0.95 | 1.00 | 1.00 | 1.01 |
| pg16beta1_o3_native_lto.cx7a27_gcp_c2s30 | 0.99 | 1.01 | 1.02 | 0.99 | 1.00 | 1.00 |
| pg16beta2_o3_native_lto.cx7a27_gcp_c2s30 | 0.98 | 1.01 | 0.93 | 0.99 | 0.99 | 0.99 |
| pg16beta3_o3_native_lto.cx7a27_gcp_c2s30 | 0.99 | 1.03 | 0.96 | 0.99 | 0.99 | 1.00 |
This lists the average rate of inserts/s for the tests that do inserts concurrent with queries. For such tests the query rate is listed in the table above. The read+write tests are setup so that the insert rate should match the target rate every second. Cells that are not at least 95% of the target have a red background to indicate a failure to satisfy the target.
| dbms | q100.1 | q500.1 | q1000.1 |
|---|---|---|---|
| pg153_o3_native_lto.cx7a27_gcp_c2s30 | 798 | 3987 | 7978 |
| pg154_o3_native_lto.cx7a27_gcp_c2s30 | 798 | 3987 | 7978 |
| pg16beta1_o3_native_lto.cx7a27_gcp_c2s30 | 797 | 3987 | 7976 |
| pg16beta2_o3_native_lto.cx7a27_gcp_c2s30 | 797 | 3987 | 7978 |
| pg16beta3_o3_native_lto.cx7a27_gcp_c2s30 | 797 | 3987 | 7978 |
| target | 800 | 4000 | 8000 |
l.i0
l.i0: load without secondary indexes. Graphs for performance per 1-second interval are here.
Average throughput:
Insert response time histogram: each cell has the percentage of responses that take <= the time in the header and max is the max response time in seconds. For the max column values in the top 25% of the range have a red background and in the bottom 25% of the range have a green background. The red background is not used when the min value is within 80% of the max value.
| dbms | 256us | 1ms | 4ms | 16ms | 64ms | 256ms | 1s | 4s | 16s | gt | max |
|---|---|---|---|---|---|---|---|---|---|---|---|
| pg153_o3_native_lto.cx7a27_gcp_c2s30 | 97.978 | 1.962 | 0.050 | 0.001 | 0.007 | 0.003 | 0.292 | ||||
| pg154_o3_native_lto.cx7a27_gcp_c2s30 | 98.048 | 1.897 | 0.044 | 0.001 | 0.008 | 0.002 | 0.351 | ||||
| pg16beta1_o3_native_lto.cx7a27_gcp_c2s30 | 98.075 | 1.868 | 0.046 | 0.002 | 0.006 | 0.003 | 0.368 | ||||
| pg16beta2_o3_native_lto.cx7a27_gcp_c2s30 | 97.391 | 2.557 | 0.042 | 0.001 | 0.007 | 0.003 | 0.308 | ||||
| pg16beta3_o3_native_lto.cx7a27_gcp_c2s30 | 98.107 | 1.840 | 0.043 | 0.001 | 0.008 | 0.003 | 0.337 |
Performance metrics for the DBMS listed above. Some are normalized by throughput, others are not. Legend for results is here.
ips	qps	rps	rmbps	wps	wmbps	rpq	rkbpq	wpi	wkbpi	csps	cpups	cspq	cpupq	dbgb1	dbgb2	rss	maxop	p50	p99	tag
1012658	0	0	0.0	997.0	332.9	0.000	0.000	0.001	0.337	85486	77.6	0.084	11	15.3	41.4	5.4	0.292	143445	43268	160m.pg153_o3_native_lto.cx7a27_gcp_c2s30
1006289	0	0	0.0	996.7	335.4	0.000	0.000	0.001	0.341	85371	77.7	0.085	12	15.3	41.4	1.7	0.351	143544	47947	160m.pg154_o3_native_lto.cx7a27_gcp_c2s30
1000000	0	0	0.0	973.0	328.5	0.000	0.000	0.001	0.336	83207	76.4	0.083	11	15.3	41.4	1.7	0.368	142992	53142	160m.pg16beta1_o3_native_lto.cx7a27_gcp_c2s30
987654	0	0	0.0	970.0	325.6	0.000	0.000	0.001	0.338	84170	76.3	0.085	12	15.3	41.4	1.7	0.308	140748	51743	160m.pg16beta2_o3_native_lto.cx7a27_gcp_c2s30
1000000	0	0	0.0	993.2	332.7	0.000	0.000	0.001	0.341	84247	77.6	0.084	12	15.3	41.4	4.5	0.337	142893	47548	160m.pg16beta3_o3_native_lto.cx7a27_gcp_c2s30
l.x
l.x: create secondary indexes.
Average throughput:
Performance metrics for the DBMS listed above. Some are normalized by throughput, others are not. Legend for results is here.
ips	qps	rps	rmbps	wps	wmbps	rpq	rkbpq	wpi	wkbpi	csps	cpups	cspq	cpupq	dbgb1	dbgb2	rss	maxop	p50	p99	tag
2320290	0	0	0.0	893.6	403.2	0.000	0.000	0.000	0.178	8089	41.7	0.003	3	29.4	63.3	13.2	0.002	NA	NA	160m.pg153_o3_native_lto.cx7a27_gcp_c2s30
2354412	0	0	0.0	901.0	405.2	0.000	0.000	0.000	0.176	8467	41.3	0.004	3	29.4	63.3	13.2	0.002	NA	NA	160m.pg154_o3_native_lto.cx7a27_gcp_c2s30
2354412	0	0	0.0	939.4	415.0	0.000	0.000	0.000	0.180	8828	41.0	0.004	3	29.4	63.4	13.1	0.002	NA	NA	160m.pg16beta1_o3_native_lto.cx7a27_gcp_c2s30
2354412	0	0	0.0	949.2	420.9	0.000	0.000	0.000	0.183	8575	40.9	0.004	3	29.4	63.4	13.1	0.002	NA	NA	160m.pg16beta2_o3_native_lto.cx7a27_gcp_c2s30
2389552	0	0	0.0	946.8	419.7	0.000	0.000	0.000	0.180	9041	41.0	0.004	3	29.4	63.4	13.2	0.002	NA	NA	160m.pg16beta3_o3_native_lto.cx7a27_gcp_c2s30
l.i1
l.i1: continue load after secondary indexes created. Graphs for performance per 1-second interval are here.
Average throughput:
Insert response time histogram: each cell has the percentage of responses that take <= the time in the header and max is the max response time in seconds. For the max column values in the top 25% of the range have a red background and in the bottom 25% of the range have a green background. The red background is not used when the min value is within 80% of the max value.
| dbms | 256us | 1ms | 4ms | 16ms | 64ms | 256ms | 1s | 4s | 16s | gt | max |
|---|---|---|---|---|---|---|---|---|---|---|---|
| pg153_o3_native_lto.cx7a27_gcp_c2s30 | 0.045 | 99.733 | 0.160 | 0.059 | 0.004 | 0.167 | |||||
| pg154_o3_native_lto.cx7a27_gcp_c2s30 | 0.088 | 99.694 | 0.163 | 0.052 | 0.003 | nonzero | 0.274 | ||||
| pg16beta1_o3_native_lto.cx7a27_gcp_c2s30 | 0.197 | 99.577 | 0.158 | 0.064 | 0.004 | 0.226 | |||||
| pg16beta2_o3_native_lto.cx7a27_gcp_c2s30 | 0.278 | 99.473 | 0.188 | 0.057 | 0.003 | 0.176 | |||||
| pg16beta3_o3_native_lto.cx7a27_gcp_c2s30 | 0.184 | 99.591 | 0.166 | 0.056 | 0.003 | 0.173 |
Delete response time histogram: each cell has the percentage of responses that take <= the time in the header and max is the max response time in seconds. For the max column values in the top 25% of the range have a red background and in the bottom 25% of the range have a green background. The red background is not used when the min value is within 80% of the max value.
| dbms | 256us | 1ms | 4ms | 16ms | 64ms | 256ms | 1s | 4s | 16s | gt | max |
|---|---|---|---|---|---|---|---|---|---|---|---|
| pg153_o3_native_lto.cx7a27_gcp_c2s30 | 78.542 | 8.042 | 11.369 | 2.028 | 0.018 | 0.002 | 0.173 | ||||
| pg154_o3_native_lto.cx7a27_gcp_c2s30 | 78.992 | 7.287 | 10.801 | 2.898 | 0.020 | 0.002 | nonzero | 0.274 | |||
| pg16beta1_o3_native_lto.cx7a27_gcp_c2s30 | 77.240 | 8.938 | 12.293 | 1.507 | 0.019 | 0.002 | 0.223 | ||||
| pg16beta2_o3_native_lto.cx7a27_gcp_c2s30 | 77.168 | 8.367 | 11.606 | 2.839 | 0.018 | 0.002 | 0.173 | ||||
| pg16beta3_o3_native_lto.cx7a27_gcp_c2s30 | 78.391 | 7.902 | 10.889 | 2.797 | 0.020 | 0.002 | 0.167 |
Performance metrics for the DBMS listed above. Some are normalized by throughput, others are not. Legend for results is here.
ips	qps	rps	rmbps	wps	wmbps	rpq	rkbpq	wpi	wkbpi	csps	cpups	cspq	cpupq	dbgb1	dbgb2	rss	maxop	p50	p99	tag
244200	0	0	0.0	1174.9	192.3	0.000	0.000	0.005	0.807	95317	78.3	0.390	48	41.8	111.9	30.8	0.167	35584	6992	160m.pg153_o3_native_lto.cx7a27_gcp_c2s30
232660	0	0	0.0	1106.8	180.6	0.000	0.000	0.005	0.795	90417	77.4	0.389	50	41.6	111.7	7.2	0.274	35911	6293	160m.pg154_o3_native_lto.cx7a27_gcp_c2s30
250078	0	0	0.0	1181.6	196.2	0.000	0.000	0.005	0.803	97518	78.7	0.390	47	41.8	111.8	24.8	0.226	35967	7092	160m.pg16beta1_o3_native_lto.cx7a27_gcp_c2s30
226244	0	0	0.0	1088.9	175.5	0.000	0.000	0.005	0.795	91084	74.6	0.403	49	41.7	111.7	37.8	0.176	34612	6143	160m.pg16beta2_o3_native_lto.cx7a27_gcp_c2s30
233816	0	0	0.0	1102.7	181.8	0.000	0.000	0.005	0.796	91657	76.5	0.392	49	41.6	111.7	25.8	0.173	35922	4995	160m.pg16beta3_o3_native_lto.cx7a27_gcp_c2s30
q100.1
q100.1: range queries with 100 insert/s per client. Graphs for performance per 1-second interval are here.
Average throughput:
Query response time histogram: each cell has the percentage of responses that take <= the time in the header and max is the max response time in seconds. For max values in the top 25% of the range have a red background and in the bottom 25% of the range have a green background. The red background is not used when the min value is within 80% of the max value.
| dbms | 256us | 1ms | 4ms | 16ms | 64ms | 256ms | 1s | 4s | 16s | gt | max |
|---|---|---|---|---|---|---|---|---|---|---|---|
| pg153_o3_native_lto.cx7a27_gcp_c2s30 | 99.996 | 0.003 | 0.001 | nonzero | 0.010 | ||||||
| pg154_o3_native_lto.cx7a27_gcp_c2s30 | 99.997 | 0.003 | 0.001 | nonzero | 0.005 | ||||||
| pg16beta1_o3_native_lto.cx7a27_gcp_c2s30 | 99.997 | 0.003 | 0.001 | nonzero | 0.009 | ||||||
| pg16beta2_o3_native_lto.cx7a27_gcp_c2s30 | 99.996 | 0.003 | 0.001 | nonzero | 0.005 | ||||||
| pg16beta3_o3_native_lto.cx7a27_gcp_c2s30 | 99.996 | 0.003 | 0.001 | nonzero | 0.005 |
Insert response time histogram: each cell has the percentage of responses that take <= the time in the header and max is the max response time in seconds. For max values in the top 25% of the range have a red background and in the bottom 25% of the range have a green background. The red background is not used when the min value is within 80% of the max value.
| dbms | 256us | 1ms | 4ms | 16ms | 64ms | 256ms | 1s | 4s | 16s | gt | max |
|---|---|---|---|---|---|---|---|---|---|---|---|
| pg153_o3_native_lto.cx7a27_gcp_c2s30 | 99.840 | 0.160 | 0.007 | ||||||||
| pg154_o3_native_lto.cx7a27_gcp_c2s30 | 99.899 | 0.101 | 0.013 | ||||||||
| pg16beta1_o3_native_lto.cx7a27_gcp_c2s30 | 99.884 | 0.116 | 0.013 | ||||||||
| pg16beta2_o3_native_lto.cx7a27_gcp_c2s30 | 99.700 | 0.300 | 0.008 | ||||||||
| pg16beta3_o3_native_lto.cx7a27_gcp_c2s30 | 99.799 | 0.201 | 0.009 |
Delete response time histogram: each cell has the percentage of responses that take <= the time in the header and max is the max response time in seconds. For max values in the top 25% of the range have a red background and in the bottom 25% of the range have a green background. The red background is not used when the min value is within 80% of the max value.
| dbms | 256us | 1ms | 4ms | 16ms | 64ms | 256ms | 1s | 4s | 16s | gt | max |
|---|---|---|---|---|---|---|---|---|---|---|---|
| pg153_o3_native_lto.cx7a27_gcp_c2s30 | 53.476 | 23.043 | 23.458 | 0.023 | 0.005 | ||||||
| pg154_o3_native_lto.cx7a27_gcp_c2s30 | 64.703 | 19.092 | 13.089 | 3.116 | 0.012 | ||||||
| pg16beta1_o3_native_lto.cx7a27_gcp_c2s30 | 55.688 | 18.927 | 24.969 | 0.417 | 0.009 | ||||||
| pg16beta2_o3_native_lto.cx7a27_gcp_c2s30 | 61.271 | 17.434 | 18.932 | 2.363 | 0.010 | ||||||
| pg16beta3_o3_native_lto.cx7a27_gcp_c2s30 | 57.260 | 21.986 | 20.689 | 0.064 | 0.012 |
Performance metrics for the DBMS listed above. Some are normalized by throughput, others are not. Legend for results is here.
ips	qps	rps	rmbps	wps	wmbps	rpq	rkbpq	wpi	wkbpi	csps	cpups	cspq	cpupq	dbgb1	dbgb2	rss	maxop	p50	p99	tag
798	114462	0	0.0	181.4	9.5	0.000	0.000	0.227	12.249	435556	52.9	3.805	69	41.8	111.9	12.4	0.010	14262	14017	160m.pg153_o3_native_lto.cx7a27_gcp_c2s30
798	114165	0	0.0	173.7	9.6	0.000	0.000	0.218	12.337	434521	52.7	3.806	69	41.5	111.6	10.4	0.005	14240	13937	160m.pg154_o3_native_lto.cx7a27_gcp_c2s30
797	113747	0	0.0	175.1	9.5	0.000	0.000	0.220	12.180	433046	52.9	3.807	70	41.8	111.8	1.6	0.009	14240	13937	160m.pg16beta1_o3_native_lto.cx7a27_gcp_c2s30
797	113646	0	0.0	195.7	10.0	0.000	0.000	0.246	12.792	432649	52.9	3.807	70	41.7	111.7	1.7	0.005	14086	13745	160m.pg16beta2_o3_native_lto.cx7a27_gcp_c2s30
797	113309	0	0.0	204.8	9.7	0.000	0.000	0.257	12.396	431321	52.8	3.807	70	41.6	111.7	7.4	0.005	14240	13974	160m.pg16beta3_o3_native_lto.cx7a27_gcp_c2s30
q500.1
q500.1: range queries with 500 insert/s per client. Graphs for performance per 1-second interval are here.
Average throughput:
Query response time histogram: each cell has the percentage of responses that take <= the time in the header and max is the max response time in seconds. For max values in the top 25% of the range have a red background and in the bottom 25% of the range have a green background. The red background is not used when the min value is within 80% of the max value.
| dbms | 256us | 1ms | 4ms | 16ms | 64ms | 256ms | 1s | 4s | 16s | gt | max |
|---|---|---|---|---|---|---|---|---|---|---|---|
| pg153_o3_native_lto.cx7a27_gcp_c2s30 | 99.986 | 0.009 | 0.005 | nonzero | nonzero | nonzero | 0.068 | ||||
| pg154_o3_native_lto.cx7a27_gcp_c2s30 | 99.986 | 0.009 | 0.005 | nonzero | nonzero | nonzero | 0.070 | ||||
| pg16beta1_o3_native_lto.cx7a27_gcp_c2s30 | 99.985 | 0.010 | 0.005 | nonzero | nonzero | 0.018 | |||||
| pg16beta2_o3_native_lto.cx7a27_gcp_c2s30 | 99.986 | 0.009 | 0.005 | nonzero | 0.015 | ||||||
| pg16beta3_o3_native_lto.cx7a27_gcp_c2s30 | 99.987 | 0.009 | 0.005 | nonzero | nonzero | 0.018 |
Insert response time histogram: each cell has the percentage of responses that take <= the time in the header and max is the max response time in seconds. For max values in the top 25% of the range have a red background and in the bottom 25% of the range have a green background. The red background is not used when the min value is within 80% of the max value.
| dbms | 256us | 1ms | 4ms | 16ms | 64ms | 256ms | 1s | 4s | 16s | gt | max |
|---|---|---|---|---|---|---|---|---|---|---|---|
| pg153_o3_native_lto.cx7a27_gcp_c2s30 | 99.797 | 0.202 | 0.001 | 0.018 | |||||||
| pg154_o3_native_lto.cx7a27_gcp_c2s30 | 99.809 | 0.188 | 0.003 | 0.023 | |||||||
| pg16beta1_o3_native_lto.cx7a27_gcp_c2s30 | 99.661 | 0.333 | 0.006 | 0.021 | |||||||
| pg16beta2_o3_native_lto.cx7a27_gcp_c2s30 | 99.836 | 0.162 | 0.002 | 0.020 | |||||||
| pg16beta3_o3_native_lto.cx7a27_gcp_c2s30 | 99.836 | 0.163 | 0.002 | 0.019 |
Delete response time histogram: each cell has the percentage of responses that take <= the time in the header and max is the max response time in seconds. For max values in the top 25% of the range have a red background and in the bottom 25% of the range have a green background. The red background is not used when the min value is within 80% of the max value.
| dbms | 256us | 1ms | 4ms | 16ms | 64ms | 256ms | 1s | 4s | 16s | gt | max |
|---|---|---|---|---|---|---|---|---|---|---|---|
| pg153_o3_native_lto.cx7a27_gcp_c2s30 | 77.939 | 10.264 | 7.256 | 4.541 | 0.001 | 0.019 | |||||
| pg154_o3_native_lto.cx7a27_gcp_c2s30 | 77.299 | 5.500 | 6.811 | 10.387 | 0.003 | 0.025 | |||||
| pg16beta1_o3_native_lto.cx7a27_gcp_c2s30 | 76.841 | 6.617 | 10.261 | 6.272 | 0.008 | 0.021 | |||||
| pg16beta2_o3_native_lto.cx7a27_gcp_c2s30 | 76.709 | 5.969 | 7.821 | 9.500 | 0.001 | 0.019 | |||||
| pg16beta3_o3_native_lto.cx7a27_gcp_c2s30 | 78.203 | 9.042 | 5.069 | 7.684 | 0.003 | 0.031 |
Performance metrics for the DBMS listed above. Some are normalized by throughput, others are not. Legend for results is here.
ips	qps	rps	rmbps	wps	wmbps	rpq	rkbpq	wpi	wkbpi	csps	cpups	cspq	cpupq	dbgb1	dbgb2	rss	maxop	p50	p99	tag
3987	111191	0	0.0	280.8	14.7	0.000	0.000	0.070	3.768	423484	53.8	3.809	73	41.8	106.5	13.7	0.068	13953	11747	160m.pg153_o3_native_lto.cx7a27_gcp_c2s30
3987	110971	0	0.0	277.1	14.4	0.000	0.000	0.070	3.708	422473	53.9	3.807	73	41.5	106.0	14.0	0.070	14001	11859	160m.pg154_o3_native_lto.cx7a27_gcp_c2s30
3987	111179	0	0.0	285.4	14.3	0.000	0.000	0.072	3.665	423185	53.8	3.806	73	41.8	106.3	26.8	0.018	13985	11891	160m.pg16beta1_o3_native_lto.cx7a27_gcp_c2s30
3987	110352	0	0.0	270.8	14.6	0.000	0.000	0.068	3.746	420227	54.0	3.808	73	41.7	106.1	11.5	0.015	13718	11411	160m.pg16beta2_o3_native_lto.cx7a27_gcp_c2s30
3987	109984	0	0.0	270.4	14.8	0.000	0.000	0.068	3.813	418883	53.9	3.809	74	41.6	106.0	12.8	0.018	13745	11555	160m.pg16beta3_o3_native_lto.cx7a27_gcp_c2s30
q1000.1
q1000.1: range queries with 1000 insert/s per client. Graphs for performance per 1-second interval are here.
Average throughput:
Query response time histogram: each cell has the percentage of responses that take <= the time in the header and max is the max response time in seconds. For max values in the top 25% of the range have a red background and in the bottom 25% of the range have a green background. The red background is not used when the min value is within 80% of the max value.
| dbms | 256us | 1ms | 4ms | 16ms | 64ms | 256ms | 1s | 4s | 16s | gt | max |
|---|---|---|---|---|---|---|---|---|---|---|---|
| pg153_o3_native_lto.cx7a27_gcp_c2s30 | 99.958 | 0.032 | 0.009 | nonzero | nonzero | nonzero | 0.091 | ||||
| pg154_o3_native_lto.cx7a27_gcp_c2s30 | 99.960 | 0.030 | 0.009 | nonzero | nonzero | 0.026 | |||||
| pg16beta1_o3_native_lto.cx7a27_gcp_c2s30 | 99.962 | 0.030 | 0.009 | nonzero | nonzero | 0.025 | |||||
| pg16beta2_o3_native_lto.cx7a27_gcp_c2s30 | 99.955 | 0.035 | 0.010 | nonzero | nonzero | 0.025 | |||||
| pg16beta3_o3_native_lto.cx7a27_gcp_c2s30 | 99.953 | 0.036 | 0.010 | nonzero | nonzero | nonzero | 0.087 |
Insert response time histogram: each cell has the percentage of responses that take <= the time in the header and max is the max response time in seconds. For max values in the top 25% of the range have a red background and in the bottom 25% of the range have a green background. The red background is not used when the min value is within 80% of the max value.
| dbms | 256us | 1ms | 4ms | 16ms | 64ms | 256ms | 1s | 4s | 16s | gt | max |
|---|---|---|---|---|---|---|---|---|---|---|---|
| pg153_o3_native_lto.cx7a27_gcp_c2s30 | 99.461 | 0.523 | 0.015 | nonzero | 0.072 | ||||||
| pg154_o3_native_lto.cx7a27_gcp_c2s30 | 99.291 | 0.684 | 0.026 | 0.035 | |||||||
| pg16beta1_o3_native_lto.cx7a27_gcp_c2s30 | 99.652 | 0.337 | 0.011 | 0.033 | |||||||
| pg16beta2_o3_native_lto.cx7a27_gcp_c2s30 | 99.397 | 0.583 | 0.020 | 0.028 | |||||||
| pg16beta3_o3_native_lto.cx7a27_gcp_c2s30 | 99.320 | 0.660 | 0.020 | nonzero | 0.080 |
Delete response time histogram: each cell has the percentage of responses that take <= the time in the header and max is the max response time in seconds. For max values in the top 25% of the range have a red background and in the bottom 25% of the range have a green background. The red background is not used when the min value is within 80% of the max value.
| dbms | 256us | 1ms | 4ms | 16ms | 64ms | 256ms | 1s | 4s | 16s | gt | max |
|---|---|---|---|---|---|---|---|---|---|---|---|
| pg153_o3_native_lto.cx7a27_gcp_c2s30 | 78.638 | 7.380 | 6.352 | 7.616 | 0.014 | nonzero | 0.070 | ||||
| pg154_o3_native_lto.cx7a27_gcp_c2s30 | 76.944 | 5.055 | 7.994 | 9.992 | 0.015 | 0.032 | |||||
| pg16beta1_o3_native_lto.cx7a27_gcp_c2s30 | 77.876 | 6.251 | 8.315 | 7.553 | 0.006 | 0.033 | |||||
| pg16beta2_o3_native_lto.cx7a27_gcp_c2s30 | 75.947 | 6.619 | 8.239 | 9.189 | 0.005 | 0.026 | |||||
| pg16beta3_o3_native_lto.cx7a27_gcp_c2s30 | 76.767 | 8.075 | 6.669 | 8.483 | 0.005 | 0.023 |
Performance metrics for the DBMS listed above. Some are normalized by throughput, others are not. Legend for results is here.
ips	qps	rps	rmbps	wps	wmbps	rpq	rkbpq	wpi	wkbpi	csps	cpups	cspq	cpupq	dbgb1	dbgb2	rss	maxop	p50	p99	tag
7978	109159	0	0.0	181.4	16.7	0.000	0.000	0.023	2.146	413001	55.0	3.783	76	41.6	99.3	24.9	0.091	13777	11811	160m.pg153_o3_native_lto.cx7a27_gcp_c2s30
7978	109719	0	0.0	178.5	16.7	0.000	0.000	0.022	2.142	414915	55.1	3.782	75	41.5	99.1	26.2	0.026	13728	11715	160m.pg154_o3_native_lto.cx7a27_gcp_c2s30
7976	108648	0	0.0	184.0	16.7	0.000	0.000	0.023	2.148	412183	55.0	3.794	76	41.8	99.4	24.4	0.025	13649	11555	160m.pg16beta1_o3_native_lto.cx7a27_gcp_c2s30
7978	108196	0	0.0	177.2	16.6	0.000	0.000	0.022	2.136	409940	55.1	3.789	76	41.7	99.2	14.0	0.025	13377	11352	160m.pg16beta2_o3_native_lto.cx7a27_gcp_c2s30
7978	109044	0	0.0	179.6	16.6	0.000	0.000	0.023	2.136	412608	55.0	3.784	76	41.6	99.0	13.7	0.087	13617	11683	160m.pg16beta3_o3_native_lto.cx7a27_gcp_c2s30
l.i0
l.i0: load without secondary indexes
Performance metrics for all DBMS, not just the ones listed above. Some are normalized by throughput, others are not. Legend for results is here.
ips	qps	rps	rmbps	wps	wmbps	rpq	rkbpq	wpi	wkbpi	csps	cpups	cspq	cpupq	dbgb1	dbgb2	rss	maxop	p50	p99	tag
1012658	0	0	0.0	997.0	332.9	0.000	0.000	0.001	0.337	85486	77.6	0.084	11	15.3	41.4	5.4	0.292	143445	43268	160m.pg153_o3_native_lto.cx7a27_gcp_c2s30
1006289	0	0	0.0	996.7	335.4	0.000	0.000	0.001	0.341	85371	77.7	0.085	12	15.3	41.4	1.7	0.351	143544	47947	160m.pg154_o3_native_lto.cx7a27_gcp_c2s30
1000000	0	0	0.0	973.0	328.5	0.000	0.000	0.001	0.336	83207	76.4	0.083	11	15.3	41.4	1.7	0.368	142992	53142	160m.pg16beta1_o3_native_lto.cx7a27_gcp_c2s30
987654	0	0	0.0	970.0	325.6	0.000	0.000	0.001	0.338	84170	76.3	0.085	12	15.3	41.4	1.7	0.308	140748	51743	160m.pg16beta2_o3_native_lto.cx7a27_gcp_c2s30
1000000	0	0	0.0	993.2	332.7	0.000	0.000	0.001	0.341	84247	77.6	0.084	12	15.3	41.4	4.5	0.337	142893	47548	160m.pg16beta3_o3_native_lto.cx7a27_gcp_c2s30
l.x
l.x: create secondary indexes
Performance metrics for all DBMS, not just the ones listed above. Some are normalized by throughput, others are not. Legend for results is here.
ips	qps	rps	rmbps	wps	wmbps	rpq	rkbpq	wpi	wkbpi	csps	cpups	cspq	cpupq	dbgb1	dbgb2	rss	maxop	p50	p99	tag
2320290	0	0	0.0	893.6	403.2	0.000	0.000	0.000	0.178	8089	41.7	0.003	3	29.4	63.3	13.2	0.002	NA	NA	160m.pg153_o3_native_lto.cx7a27_gcp_c2s30
2354412	0	0	0.0	901.0	405.2	0.000	0.000	0.000	0.176	8467	41.3	0.004	3	29.4	63.3	13.2	0.002	NA	NA	160m.pg154_o3_native_lto.cx7a27_gcp_c2s30
2354412	0	0	0.0	939.4	415.0	0.000	0.000	0.000	0.180	8828	41.0	0.004	3	29.4	63.4	13.1	0.002	NA	NA	160m.pg16beta1_o3_native_lto.cx7a27_gcp_c2s30
2354412	0	0	0.0	949.2	420.9	0.000	0.000	0.000	0.183	8575	40.9	0.004	3	29.4	63.4	13.1	0.002	NA	NA	160m.pg16beta2_o3_native_lto.cx7a27_gcp_c2s30
2389552	0	0	0.0	946.8	419.7	0.000	0.000	0.000	0.180	9041	41.0	0.004	3	29.4	63.4	13.2	0.002	NA	NA	160m.pg16beta3_o3_native_lto.cx7a27_gcp_c2s30
l.i1
l.i1: continue load after secondary indexes created
Performance metrics for all DBMS, not just the ones listed above. Some are normalized by throughput, others are not. Legend for results is here.
ips	qps	rps	rmbps	wps	wmbps	rpq	rkbpq	wpi	wkbpi	csps	cpups	cspq	cpupq	dbgb1	dbgb2	rss	maxop	p50	p99	tag
244200	0	0	0.0	1174.9	192.3	0.000	0.000	0.005	0.807	95317	78.3	0.390	48	41.8	111.9	30.8	0.167	35584	6992	160m.pg153_o3_native_lto.cx7a27_gcp_c2s30
232660	0	0	0.0	1106.8	180.6	0.000	0.000	0.005	0.795	90417	77.4	0.389	50	41.6	111.7	7.2	0.274	35911	6293	160m.pg154_o3_native_lto.cx7a27_gcp_c2s30
250078	0	0	0.0	1181.6	196.2	0.000	0.000	0.005	0.803	97518	78.7	0.390	47	41.8	111.8	24.8	0.226	35967	7092	160m.pg16beta1_o3_native_lto.cx7a27_gcp_c2s30
226244	0	0	0.0	1088.9	175.5	0.000	0.000	0.005	0.795	91084	74.6	0.403	49	41.7	111.7	37.8	0.176	34612	6143	160m.pg16beta2_o3_native_lto.cx7a27_gcp_c2s30
233816	0	0	0.0	1102.7	181.8	0.000	0.000	0.005	0.796	91657	76.5	0.392	49	41.6	111.7	25.8	0.173	35922	4995	160m.pg16beta3_o3_native_lto.cx7a27_gcp_c2s30
q100.1
q100.1: range queries with 100 insert/s per client
Performance metrics for all DBMS, not just the ones listed above. Some are normalized by throughput, others are not. Legend for results is here.
ips	qps	rps	rmbps	wps	wmbps	rpq	rkbpq	wpi	wkbpi	csps	cpups	cspq	cpupq	dbgb1	dbgb2	rss	maxop	p50	p99	tag
798	114462	0	0.0	181.4	9.5	0.000	0.000	0.227	12.249	435556	52.9	3.805	69	41.8	111.9	12.4	0.010	14262	14017	160m.pg153_o3_native_lto.cx7a27_gcp_c2s30
798	114165	0	0.0	173.7	9.6	0.000	0.000	0.218	12.337	434521	52.7	3.806	69	41.5	111.6	10.4	0.005	14240	13937	160m.pg154_o3_native_lto.cx7a27_gcp_c2s30
797	113747	0	0.0	175.1	9.5	0.000	0.000	0.220	12.180	433046	52.9	3.807	70	41.8	111.8	1.6	0.009	14240	13937	160m.pg16beta1_o3_native_lto.cx7a27_gcp_c2s30
797	113646	0	0.0	195.7	10.0	0.000	0.000	0.246	12.792	432649	52.9	3.807	70	41.7	111.7	1.7	0.005	14086	13745	160m.pg16beta2_o3_native_lto.cx7a27_gcp_c2s30
797	113309	0	0.0	204.8	9.7	0.000	0.000	0.257	12.396	431321	52.8	3.807	70	41.6	111.7	7.4	0.005	14240	13974	160m.pg16beta3_o3_native_lto.cx7a27_gcp_c2s30
q500.1
q500.1: range queries with 500 insert/s per client
Performance metrics for all DBMS, not just the ones listed above. Some are normalized by throughput, others are not. Legend for results is here.
ips	qps	rps	rmbps	wps	wmbps	rpq	rkbpq	wpi	wkbpi	csps	cpups	cspq	cpupq	dbgb1	dbgb2	rss	maxop	p50	p99	tag
3987	111191	0	0.0	280.8	14.7	0.000	0.000	0.070	3.768	423484	53.8	3.809	73	41.8	106.5	13.7	0.068	13953	11747	160m.pg153_o3_native_lto.cx7a27_gcp_c2s30
3987	110971	0	0.0	277.1	14.4	0.000	0.000	0.070	3.708	422473	53.9	3.807	73	41.5	106.0	14.0	0.070	14001	11859	160m.pg154_o3_native_lto.cx7a27_gcp_c2s30
3987	111179	0	0.0	285.4	14.3	0.000	0.000	0.072	3.665	423185	53.8	3.806	73	41.8	106.3	26.8	0.018	13985	11891	160m.pg16beta1_o3_native_lto.cx7a27_gcp_c2s30
3987	110352	0	0.0	270.8	14.6	0.000	0.000	0.068	3.746	420227	54.0	3.808	73	41.7	106.1	11.5	0.015	13718	11411	160m.pg16beta2_o3_native_lto.cx7a27_gcp_c2s30
3987	109984	0	0.0	270.4	14.8	0.000	0.000	0.068	3.813	418883	53.9	3.809	74	41.6	106.0	12.8	0.018	13745	11555	160m.pg16beta3_o3_native_lto.cx7a27_gcp_c2s30
q1000.1
q1000.1: range queries with 1000 insert/s per client
Performance metrics for all DBMS, not just the ones listed above. Some are normalized by throughput, others are not. Legend for results is here.
ips	qps	rps	rmbps	wps	wmbps	rpq	rkbpq	wpi	wkbpi	csps	cpups	cspq	cpupq	dbgb1	dbgb2	rss	maxop	p50	p99	tag
7978	109159	0	0.0	181.4	16.7	0.000	0.000	0.023	2.146	413001	55.0	3.783	76	41.6	99.3	24.9	0.091	13777	11811	160m.pg153_o3_native_lto.cx7a27_gcp_c2s30
7978	109719	0	0.0	178.5	16.7	0.000	0.000	0.022	2.142	414915	55.1	3.782	75	41.5	99.1	26.2	0.026	13728	11715	160m.pg154_o3_native_lto.cx7a27_gcp_c2s30
7976	108648	0	0.0	184.0	16.7	0.000	0.000	0.023	2.148	412183	55.0	3.794	76	41.8	99.4	24.4	0.025	13649	11555	160m.pg16beta1_o3_native_lto.cx7a27_gcp_c2s30
7978	108196	0	0.0	177.2	16.6	0.000	0.000	0.022	2.136	409940	55.1	3.789	76	41.7	99.2	14.0	0.025	13377	11352	160m.pg16beta2_o3_native_lto.cx7a27_gcp_c2s30
7978	109044	0	0.0	179.6	16.6	0.000	0.000	0.023	2.136	412608	55.0	3.784	76	41.6	99.0	13.7	0.087	13617	11683	160m.pg16beta3_o3_native_lto.cx7a27_gcp_c2s30
l.i0
- l.i0: load without secondary indexes
- Legend for results is here.
- Each entry lists the percentage of responses that fit in that bucket (slower than max time for previous bucket, faster than min time for next bucket).
Insert response time histogram
256us	1ms	4ms	16ms	64ms	256ms	1s	4s	16s	gt	max	tag
0.000	97.978	1.962	0.050	0.001	0.007	0.003	0.000	0.000	0.000	0.292	pg153_o3_native_lto.cx7a27_gcp_c2s30
0.000	98.048	1.897	0.044	0.001	0.008	0.002	0.000	0.000	0.000	0.351	pg154_o3_native_lto.cx7a27_gcp_c2s30
0.000	98.075	1.868	0.046	0.002	0.006	0.003	0.000	0.000	0.000	0.368	pg16beta1_o3_native_lto.cx7a27_gcp_c2s30
0.000	97.391	2.557	0.042	0.001	0.007	0.003	0.000	0.000	0.000	0.308	pg16beta2_o3_native_lto.cx7a27_gcp_c2s30
0.000	98.107	1.840	0.043	0.001	0.008	0.003	0.000	0.000	0.000	0.337	pg16beta3_o3_native_lto.cx7a27_gcp_c2s30
l.x
- l.x: create secondary indexes
- Legend for results is here.
- Each entry lists the percentage of responses that fit in that bucket (slower than max time for previous bucket, faster than min time for next bucket).
TODO - determine whether there is data for create index response time
l.i1
- l.i1: continue load after secondary indexes created
- Legend for results is here.
- Each entry lists the percentage of responses that fit in that bucket (slower than max time for previous bucket, faster than min time for next bucket).
Insert response time histogram
256us	1ms	4ms	16ms	64ms	256ms	1s	4s	16s	gt	max	tag
0.000	0.045	99.733	0.160	0.059	0.004	0.000	0.000	0.000	0.000	0.167	pg153_o3_native_lto.cx7a27_gcp_c2s30
0.000	0.088	99.694	0.163	0.052	0.003	nonzero	0.000	0.000	0.000	0.274	pg154_o3_native_lto.cx7a27_gcp_c2s30
0.000	0.197	99.577	0.158	0.064	0.004	0.000	0.000	0.000	0.000	0.226	pg16beta1_o3_native_lto.cx7a27_gcp_c2s30
0.000	0.278	99.473	0.188	0.057	0.003	0.000	0.000	0.000	0.000	0.176	pg16beta2_o3_native_lto.cx7a27_gcp_c2s30
0.000	0.184	99.591	0.166	0.056	0.003	0.000	0.000	0.000	0.000	0.173	pg16beta3_o3_native_lto.cx7a27_gcp_c2s30
Delete response time histogram
256us	1ms	4ms	16ms	64ms	256ms	1s	4s	16s	gt	max	tag
78.542	8.042	11.369	2.028	0.018	0.002	0.000	0.000	0.000	0.000	0.173	pg153_o3_native_lto.cx7a27_gcp_c2s30
78.992	7.287	10.801	2.898	0.020	0.002	nonzero	0.000	0.000	0.000	0.274	pg154_o3_native_lto.cx7a27_gcp_c2s30
77.240	8.938	12.293	1.507	0.019	0.002	0.000	0.000	0.000	0.000	0.223	pg16beta1_o3_native_lto.cx7a27_gcp_c2s30
77.168	8.367	11.606	2.839	0.018	0.002	0.000	0.000	0.000	0.000	0.173	pg16beta2_o3_native_lto.cx7a27_gcp_c2s30
78.391	7.902	10.889	2.797	0.020	0.002	0.000	0.000	0.000	0.000	0.167	pg16beta3_o3_native_lto.cx7a27_gcp_c2s30
q100.1
- q100.1: range queries with 100 insert/s per client
- Legend for results is here.
- Each entry lists the percentage of responses that fit in that bucket (slower than max time for previous bucket, faster than min time for next bucket).
Query response time histogram
256us	1ms	4ms	16ms	64ms	256ms	1s	4s	16s	gt	max	tag
99.996	0.003	0.001	nonzero	0.000	0.000	0.000	0.000	0.000	0.000	0.010	pg153_o3_native_lto.cx7a27_gcp_c2s30
99.997	0.003	0.001	nonzero	0.000	0.000	0.000	0.000	0.000	0.000	0.005	pg154_o3_native_lto.cx7a27_gcp_c2s30
99.997	0.003	0.001	nonzero	0.000	0.000	0.000	0.000	0.000	0.000	0.009	pg16beta1_o3_native_lto.cx7a27_gcp_c2s30
99.996	0.003	0.001	nonzero	0.000	0.000	0.000	0.000	0.000	0.000	0.005	pg16beta2_o3_native_lto.cx7a27_gcp_c2s30
99.996	0.003	0.001	nonzero	0.000	0.000	0.000	0.000	0.000	0.000	0.005	pg16beta3_o3_native_lto.cx7a27_gcp_c2s30
Insert response time histogram
256us	1ms	4ms	16ms	64ms	256ms	1s	4s	16s	gt	max	tag
0.000	0.000	99.840	0.160	0.000	0.000	0.000	0.000	0.000	0.000	0.007	pg153_o3_native_lto.cx7a27_gcp_c2s30
0.000	0.000	99.899	0.101	0.000	0.000	0.000	0.000	0.000	0.000	0.013	pg154_o3_native_lto.cx7a27_gcp_c2s30
0.000	0.000	99.884	0.116	0.000	0.000	0.000	0.000	0.000	0.000	0.013	pg16beta1_o3_native_lto.cx7a27_gcp_c2s30
0.000	0.000	99.700	0.300	0.000	0.000	0.000	0.000	0.000	0.000	0.008	pg16beta2_o3_native_lto.cx7a27_gcp_c2s30
0.000	0.000	99.799	0.201	0.000	0.000	0.000	0.000	0.000	0.000	0.009	pg16beta3_o3_native_lto.cx7a27_gcp_c2s30
Delete response time histogram
256us	1ms	4ms	16ms	64ms	256ms	1s	4s	16s	gt	max	tag
53.476	23.043	23.458	0.023	0.000	0.000	0.000	0.000	0.000	0.000	0.005	pg153_o3_native_lto.cx7a27_gcp_c2s30
64.703	19.092	13.089	3.116	0.000	0.000	0.000	0.000	0.000	0.000	0.012	pg154_o3_native_lto.cx7a27_gcp_c2s30
55.688	18.927	24.969	0.417	0.000	0.000	0.000	0.000	0.000	0.000	0.009	pg16beta1_o3_native_lto.cx7a27_gcp_c2s30
61.271	17.434	18.932	2.363	0.000	0.000	0.000	0.000	0.000	0.000	0.010	pg16beta2_o3_native_lto.cx7a27_gcp_c2s30
57.260	21.986	20.689	0.064	0.000	0.000	0.000	0.000	0.000	0.000	0.012	pg16beta3_o3_native_lto.cx7a27_gcp_c2s30
q500.1
- q500.1: range queries with 500 insert/s per client
- Legend for results is here.
- Each entry lists the percentage of responses that fit in that bucket (slower than max time for previous bucket, faster than min time for next bucket).
Query response time histogram
256us	1ms	4ms	16ms	64ms	256ms	1s	4s	16s	gt	max	tag
99.986	0.009	0.005	nonzero	nonzero	nonzero	0.000	0.000	0.000	0.000	0.068	pg153_o3_native_lto.cx7a27_gcp_c2s30
99.986	0.009	0.005	nonzero	nonzero	nonzero	0.000	0.000	0.000	0.000	0.070	pg154_o3_native_lto.cx7a27_gcp_c2s30
99.985	0.010	0.005	nonzero	nonzero	0.000	0.000	0.000	0.000	0.000	0.018	pg16beta1_o3_native_lto.cx7a27_gcp_c2s30
99.986	0.009	0.005	nonzero	0.000	0.000	0.000	0.000	0.000	0.000	0.015	pg16beta2_o3_native_lto.cx7a27_gcp_c2s30
99.987	0.009	0.005	nonzero	nonzero	0.000	0.000	0.000	0.000	0.000	0.018	pg16beta3_o3_native_lto.cx7a27_gcp_c2s30
Insert response time histogram
256us	1ms	4ms	16ms	64ms	256ms	1s	4s	16s	gt	max	tag
0.000	0.000	99.797	0.202	0.001	0.000	0.000	0.000	0.000	0.000	0.018	pg153_o3_native_lto.cx7a27_gcp_c2s30
0.000	0.000	99.809	0.188	0.003	0.000	0.000	0.000	0.000	0.000	0.023	pg154_o3_native_lto.cx7a27_gcp_c2s30
0.000	0.000	99.661	0.333	0.006	0.000	0.000	0.000	0.000	0.000	0.021	pg16beta1_o3_native_lto.cx7a27_gcp_c2s30
0.000	0.000	99.836	0.162	0.002	0.000	0.000	0.000	0.000	0.000	0.020	pg16beta2_o3_native_lto.cx7a27_gcp_c2s30
0.000	0.000	99.836	0.163	0.002	0.000	0.000	0.000	0.000	0.000	0.019	pg16beta3_o3_native_lto.cx7a27_gcp_c2s30
Delete response time histogram
256us	1ms	4ms	16ms	64ms	256ms	1s	4s	16s	gt	max	tag
77.939	10.264	7.256	4.541	0.001	0.000	0.000	0.000	0.000	0.000	0.019	pg153_o3_native_lto.cx7a27_gcp_c2s30
77.299	5.500	6.811	10.387	0.003	0.000	0.000	0.000	0.000	0.000	0.025	pg154_o3_native_lto.cx7a27_gcp_c2s30
76.841	6.617	10.261	6.272	0.008	0.000	0.000	0.000	0.000	0.000	0.021	pg16beta1_o3_native_lto.cx7a27_gcp_c2s30
76.709	5.969	7.821	9.500	0.001	0.000	0.000	0.000	0.000	0.000	0.019	pg16beta2_o3_native_lto.cx7a27_gcp_c2s30
78.203	9.042	5.069	7.684	0.003	0.000	0.000	0.000	0.000	0.000	0.031	pg16beta3_o3_native_lto.cx7a27_gcp_c2s30
q1000.1
- q1000.1: range queries with 1000 insert/s per client
- Legend for results is here.
- Each entry lists the percentage of responses that fit in that bucket (slower than max time for previous bucket, faster than min time for next bucket).
Query response time histogram
256us	1ms	4ms	16ms	64ms	256ms	1s	4s	16s	gt	max	tag
99.958	0.032	0.009	nonzero	nonzero	nonzero	0.000	0.000	0.000	0.000	0.091	pg153_o3_native_lto.cx7a27_gcp_c2s30
99.960	0.030	0.009	nonzero	nonzero	0.000	0.000	0.000	0.000	0.000	0.026	pg154_o3_native_lto.cx7a27_gcp_c2s30
99.962	0.030	0.009	nonzero	nonzero	0.000	0.000	0.000	0.000	0.000	0.025	pg16beta1_o3_native_lto.cx7a27_gcp_c2s30
99.955	0.035	0.010	nonzero	nonzero	0.000	0.000	0.000	0.000	0.000	0.025	pg16beta2_o3_native_lto.cx7a27_gcp_c2s30
99.953	0.036	0.010	nonzero	nonzero	nonzero	0.000	0.000	0.000	0.000	0.087	pg16beta3_o3_native_lto.cx7a27_gcp_c2s30
Insert response time histogram
256us	1ms	4ms	16ms	64ms	256ms	1s	4s	16s	gt	max	tag
0.000	0.000	99.461	0.523	0.015	nonzero	0.000	0.000	0.000	0.000	0.072	pg153_o3_native_lto.cx7a27_gcp_c2s30
0.000	0.000	99.291	0.684	0.026	0.000	0.000	0.000	0.000	0.000	0.035	pg154_o3_native_lto.cx7a27_gcp_c2s30
0.000	0.000	99.652	0.337	0.011	0.000	0.000	0.000	0.000	0.000	0.033	pg16beta1_o3_native_lto.cx7a27_gcp_c2s30
0.000	0.000	99.397	0.583	0.020	0.000	0.000	0.000	0.000	0.000	0.028	pg16beta2_o3_native_lto.cx7a27_gcp_c2s30
0.000	0.000	99.320	0.660	0.020	nonzero	0.000	0.000	0.000	0.000	0.080	pg16beta3_o3_native_lto.cx7a27_gcp_c2s30
Delete response time histogram
256us	1ms	4ms	16ms	64ms	256ms	1s	4s	16s	gt	max	tag
78.638	7.380	6.352	7.616	0.014	nonzero	0.000	0.000	0.000	0.000	0.070	pg153_o3_native_lto.cx7a27_gcp_c2s30
76.944	5.055	7.994	9.992	0.015	0.000	0.000	0.000	0.000	0.000	0.032	pg154_o3_native_lto.cx7a27_gcp_c2s30
77.876	6.251	8.315	7.553	0.006	0.000	0.000	0.000	0.000	0.000	0.033	pg16beta1_o3_native_lto.cx7a27_gcp_c2s30
75.947	6.619	8.239	9.189	0.005	0.000	0.000	0.000	0.000	0.000	0.026	pg16beta2_o3_native_lto.cx7a27_gcp_c2s30
76.767	8.075	6.669	8.483	0.005	0.000	0.000	0.000	0.000	0.000	0.023	pg16beta3_o3_native_lto.cx7a27_gcp_c2s30